Quantifying and Predicting Prepayments in the Microfinance Environment Nandan Sudarsanam and Dibu John Philip Department of Management Studies Indian Institute of Technology Madras Chennai, Tamil Nadu, India. Abstract Financial institutions that lend to customers are interested in understanding and predicting repayment patterns. Two critical subjects of interest in this context are the advances and delays in payment with respect to the stipulated repayment schedule. In this study, we focus on the advances in payment, also referred to as prepayment, of loans on a time-quantum scale. While this translates to interest relief for the customer, it could potentially result in a loss for the institution, albeit small. More importantly, from the institution’s perspective, it could indicate a form of preterm attrition, a sign of the unsuitability of the product, or the customer’s preference for a competitor. This could in turn lead to pre-closures, and even an overall attrition of customers. The contributions of this research are two-fold. First, we present a framework for quantifying prepayments on a fixed scale over the duration of the loan. Second, we recommend and demonstrate the use of a machine learning technique called Temporal Difference (TD) learners to improve the performance of predicting the customer’s prepayment state in the future. TD Learners work with traditional predictive modeling techniques to improve their performance in environments of sparse data. The recommended approach shows an overall improvement in predictive capacity compared to the conventional approach of using only the predictive model. Specifically, with the sample data set, we find that at best the proposed method is 57% better than the traditional approach, and at worst, is indistinguishable in performance. We discuss the specific suitability of such an approach in the microfinance context, where institutions could be looking at unexplored products, demographics or locations and thereby operate in environments that are not data rich. 1
Transcript
Quantifying and Predicting Prepayments inthe Microfinance Environment
Nandan Sudarsanam and Dibu John PhilipDepartment of Management Studies
Indian Institute of Technology Madras
Chennai, Tamil Nadu, India.
AbstractFinancial institutions that lend to customers are interested in
understanding and predicting repayment patterns. Two criticalsubjects of interest in this context are the advances and delays inpayment with respect to the stipulated repayment schedule. In thisstudy, we focus on the advances in payment, also referred to asprepayment, of loans on a time-quantum scale. While this translatesto interest relief for the customer, it could potentially result in aloss for the institution, albeit small. More importantly, from theinstitution’s perspective, it could indicate a form of preterm attrition,a sign of the unsuitability of the product, or the customer’s preferencefor a competitor. This could in turn lead to pre-closures, andeven an overall attrition of customers. The contributions of thisresearch are two-fold. First, we present a framework for quantifyingprepayments on a fixed scale over the duration of the loan. Second, werecommend and demonstrate the use of a machine learning techniquecalled Temporal Difference (TD) learners to improve the performanceof predicting the customer’s prepayment state in the future. TDLearners work with traditional predictive modeling techniques toimprove their performance in environments of sparse data. Therecommended approach shows an overall improvement in predictivecapacity compared to the conventional approach of using only thepredictive model. Specifically, with the sample data set, we findthat at best the proposed method is 57% better than the traditionalapproach, and at worst, is indistinguishable in performance. Wediscuss the specific suitability of such an approach in the microfinancecontext, where institutions could be looking at unexplored products,demographics or locations and thereby operate in environments thatare not data rich.
1
1 Introduction
Loan repayment patterns could serve as valuable indicators of variouscustomer-centric behavioral phenomena in the microfinance environment.A financial institution could potentially gain business insights, at bothindividual as well as systemic levels, and ultimately improve profitability byunderstanding these patterns. Prepayment is one such repayment patternthat is of particular interest to practitioners. Prepayment is the practiceof paying off a debt ahead of the stipulated repayment schedule, partlyor wholly. Typically, in the microfinance context, this leads to interestrelief for the customer. However, practitioners and academics have viewedprepayment behaviour as being more than just the rational response ofseeking interest relief (Kang and Zenios, 1992; Yamamoto and Zenios, 1993).They have examined and discussed various other business insights that canbe drawn from understanding states and patterns of prepayment. Thesestudies generally consider prepayment as a form of customer attrition (Halland Lundstedt, 2005). This can be a result of a customer refinancing her loan,either because of a lower rate from a competitor or because the new source ofdebt is seen as being more customer-friendly (the reasons for being customerfriendly can range from convenience of branch locations, to more flexibility inrepayment, etc.). Another line of enquiry into prepayment patterns focusesmore on suitability of the product and less on seeing it as explicit attrition.For instance, we found that some customers who were on a weekly repaymentcycle would pay for the whole month in advance, and return the subsequentmonth to pay off the amount due for the next four weeks. Such behaviourwas flagged as a recurring prepayment pattern, which could lead to businessinsight on the suitability of the specific product for that customer segment.
This study seeks to provide the practitioner with business intelligenceby quantifying and predicting patterns in the advance repayments of debt.While the construct and findings in this research should be applicable todelays in payment as well, the motivation to initially look at prepaymentsstems from the idea that it can indicate a broader array of businessphenomena, such as convenience of repayment and customer attrition.In contrast, the primary indicator in delayed payments tends to be thecustomer’s inability to pay. The predictions are constructed as a function ofcertain state variables such as the customer’s financial status, demographic,and interactions with other financial products. The predictions also takeinto account the path created by continually evolving transactions betweenthe customer and the microfinance institution (MFI). Specifically, the studyattempts to create a realistic scenario about data availability for theprediction process. For instance, when an MFI seeks to gain insights about a
2
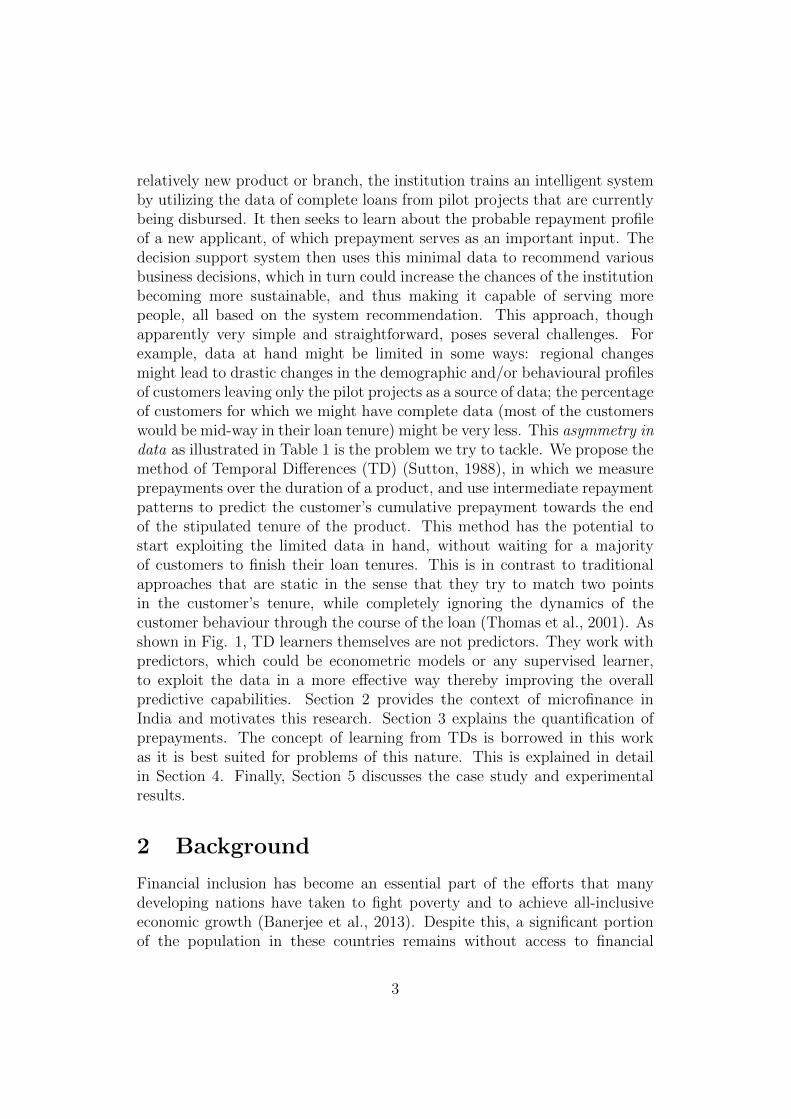
relatively new product or branch, the institution trains an intelligent systemby utilizing the data of complete loans from pilot projects that are currentlybeing disbursed. It then seeks to learn about the probable repayment profileof a new applicant, of which prepayment serves as an important input. Thedecision support system then uses this minimal data to recommend variousbusiness decisions, which in turn could increase the chances of the institutionbecoming more sustainable, and thus making it capable of serving morepeople, all based on the system recommendation. This approach, thoughapparently very simple and straightforward, poses several challenges. Forexample, data at hand might be limited in some ways: regional changesmight lead to drastic changes in the demographic and/or behavioural profilesof customers leaving only the pilot projects as a source of data; the percentageof customers for which we might have complete data (most of the customerswould be mid-way in their loan tenure) might be very less. This asymmetry indata as illustrated in Table 1 is the problem we try to tackle. We propose themethod of Temporal Differences (TD) (Sutton, 1988), in which we measureprepayments over the duration of a product, and use intermediate repaymentpatterns to predict the customer’s cumulative prepayment towards the endof the stipulated tenure of the product. This method has the potential tostart exploiting the limited data in hand, without waiting for a majorityof customers to finish their loan tenures. This is in contrast to traditionalapproaches that are static in the sense that they try to match two pointsin the customer’s tenure, while completely ignoring the dynamics of thecustomer behaviour through the course of the loan (Thomas et al., 2001). Asshown in Fig. 1, TD learners themselves are not predictors. They work withpredictors, which could be econometric models or any supervised learner,to exploit the data in a more effective way thereby improving the overallpredictive capabilities. Section 2 provides the context of microfinance inIndia and motivates this research. Section 3 explains the quantification ofprepayments. The concept of learning from TDs is borrowed in this workas it is best suited for problems of this nature. This is explained in detailin Section 4. Finally, Section 5 discusses the case study and experimentalresults.
2 Background
Financial inclusion has become an essential part of the efforts that manydeveloping nations have taken to fight poverty and to achieve all-inclusiveeconomic growth (Banerjee et al., 2013). Despite this, a significant portionof the population in these countries remains without access to financial
3
URN m0 m1 m2 m3 . . . m11 m121 on-time on-time on-time on-time . . . prepaid prepaid2 on-time prepaid prepaid on-time . . . prepaid on-time3 prepaid prepaid prepaid prepaid . . . NA NA4 on-time on-time on-time NA . . . NA NA5 on-time prepaid NA NA . . . NA NA
Table 1: Each row in this table corresponds to the monthly (m0, m1, . . . ) repaymentprofile of a customer. While the initial rows have data for all the 12 months, data becomessparse as we move down the table (NA denotes missing values). This is because majorityof the customers might be in the middle of a loan product, with very few of them havingcomplete data. A TD learner can quickly start exploiting this data without waiting fora majority of the customers to complete their loan tenure, by looking into intermediaterepayment patterns.
services, and appraisals of past inclusion initiatives show a checkered historyof improving the condition of the targeted beneficiaries (Littlefield et al.,2003; Morduch, 2000). One of the possible reasons for this could be the slowpace, or even the complete inability to achieve a win-win situation (Robinson,2001), societal benefits and profitability, or sometimes even the financialsustainability of the MFIs. To make positive strides in financial inclusion,the multifarious challenges that go with such complex objectives need to beaddressed successfully.
The microfinance scenario in India started off as one in which financingthe poor was seen as a liability by the major banks, and it was thought tobe not sustainable sans external support or subsidies from the government.Further, only public sector banks were involved in this area. However, thingsstarted changing gradually by early the 1970s. The poor were consideredbankable, and more private sector agencies and NGOs ventured into themicrofinance market, as lending to the poor was no more considered aloss-making process (Thorat, 2006). However, many MFIs have been, andcontinue to be, subsidised by the government or through private donations.Sustainability or long-term profitability was of rising concern (Hermes andLensink, 2007; Hulme and Mosley, 1996). In order to meet the grand long-term goal of successfully addressing the problems of the have-nots, MFIsshould be made capable of standing on their own feet, i.e,. self-sustainable.Hefty competition and economic crises in many microfinance markets requireMFIs to now pursue their social and financial objectives in much tighterenvironments (Caudill et al., 2009).
The most widely encountered challenges in the context of thesustainability and self-sufficiency of MFIs as discussed in the extant literature
4
(a) Traditional learner.
(b) TD learner.
Figure 1: Traditional and TD learner.
(Hermes and Lensink, 2007; Brau and Woller, 2004) revolve around, a) reachand b) suitability. Reach, which is a supply-side problem, primarily involvesgetting financial service providers, both traditional and niche banks, andMFIs to set up branches in geographical locations where there is a lackof formal institutions (Goldberg, 2005). Reach problems can be addressedthrough the use of Information and Communications Technologies (ICTs). Ifcell phone based transactions (Asongu, 2013) and more user-friendly ATMscould eliminate the need for traditional brick and mortar branches, then theeconomics of wider reach can be radically redefined.
The problem of the suitability of products and services, the demandcentric side of the challenges, speaks about the appropriateness, or lack
5
thereof, of traditional financial products and practices for the low-income,remotely accessible customer (Nourse, 2001; Musona and Coetzee, 2001;Rahman, 2000). The Basel Committee on Banking Supervision (BCBS)defines suitability as “the degree to which the product or service offered bythe intermediary matches the retail client’s financial situation, investmentobjectives, level of risk tolerance, financial need, knowledge and experience.”Indian regulatory bodies such as the Reserve Bank of India (RBI) and theInsurance Regulatory and Development Authority (IRDA) have come upwith guidelines and matrices for institutions to ensure product suitability.The 2007 Comprehensive Guidelines on Derivatives were revised by the RBIin 2011 to address issues of suitability (RBI, 2011). Further, the 2015 Reportof the Committee on Medium-term Path on Financial Inclusion (RBI, 2015)emphasizes the importance of product suitability to avoid the dangers ofmis-selling. IRDA in its Exposure Draft on Guidelines on Prospect ProductMatrix for Life Insurance came up with a suitability index, viz. the ProspectProduct Matrix, that scores product appropriateness for a client based onher life stage, generic needs, income segment and other factors. While theserequirements focus on client protection, they have a direct impact on thelong-term profitability of the institution in many ways. When a productmatches the client’s requirements or capabilities, it protects her from over-indebtedness and simultaneously safeguards the institution from a possibledefault and loss situation.
To achieve this match, a comprehensive understanding of the customer’sfinancial status and behaviour, and her interaction with various financialproducts is required (Dunn, 2002). The use of business intelligence is hencenot a luxury but a necessity for survival in this sector. Equipped with thisintelligence, an MFI can make a range of informed business decisions thathave the potential to address all the three challenges of reach, suitability,and sustainability.
3 Quantifying Prepayments
When a customer pays back a loan more aggressively than she is supposedto in its normal tenure, she gains relief on interest; the MFI, on the otherhand, incurs a loss. These prepayments might lead to what we call “pretermattrition”.
Suppose a customer takes out a loan of amount P at an interest rate of r% per month. The actual tenure of the loan is N months, and it is a monthlyrepayment loan. Then, the equated monthly installment (EMI) is calculated
6
as,
EMI =P × r
100× (1 + r
100)N
(1 + r100
)N − 1. (1)
As long as the customer pays back an amount equal to her calculated EMIfor a particular month (as well as for all the preceding months where EMIwere due), everything works fine. We call this state as the normal state.Another state into which the customer can fall is the aggressive state, whichis defined as a state in which the customer pays back more than what is duefor a particular month. This might happen because of a variety of reasons,one being availability of another loan at a more attractive rate of interestfrom elsewhere. If a customer remains in the aggressive state for a coupleof months consecutively, this might indicate a chance of her closing the loanearly, which might lead to a loss for the MFI.
Now, let repay actual(n) be the actual amount she pays back in monthn. We define ahead by(n) as
From these, prepayment percentage for month n can be calculated as,
prepayment%(n) =ahead by(n) × r
100×N
(EMI ×N) − P(4)
The cumulative prepayment percentage (CPP),N∑
n=1
prepayment%(n),
presents the repayment pattern of a customer, indicating whether she ison-schedule in her payments, or whether there is a behaviour of paying morethan required and/or earlier. An MFI will be interested in predicting thisCPP, given the repayment pattern up to some specific month. We look intothis prediction problem in the next section.
4 Methodology
In this study we suggest a Temporal Difference (TD) learning approach tosolve the problem of predicting the CPP at the end of a loan term and
7
improve upon the performance of current practices. Prediction using themethod of temporal differences is well explained in prior studies (Sutton,1988). Consider a monthly repayment loan, and without loss of generality,consider the prepayment problem. Traditional approaches would observe theprepayment pattern leading up to any given intermediate month, and thenpair this with the final state that is realized at the term end. This paireddata would be used as a training set for any supervised learning algorithm.This approach requires data that links each intermediate state to the finalstate. However, in many situations, such data might be limited. When anMFI opens a new branch or introduces a new loan product, and decides toanalyze data to improve their business, it might have few customers whohave completed the full tenure for the selected product. Thus, the MFIslack the actual value of the CPP at term-end, making the data impracticalfor training. Using data from other branches might not be appropriatefor social, political, or geographical reasons. These constraints, which arepresent in the traditional approaches, limits the size of the training set toonly the fully completed loans in the branch under question, and a majorpart of the data from loans that are mid-stream will not be used for training.TD learners partly overcome this difficulty by solving the same predictionproblem, by utilizing the inter-relationship between the monthly paymentsthat can be extracted from partial data. This method exploits the fact thatthe confidence about the predictions of final CPP is related to not just onemonth, but evolves as the months pass by. Thus, TD methods make moreefficient use of the training data in such multi-step prediction problems,and could be a powerful tool in the analysis of loan repayment, especiallywhen there is a significant number of open loans that have covered only apartial term of repayment. This should lead to more accurate predictionsunder conditions of limited experience, which is crucial in many financialapplications.
TD learning, like traditional supervised learning algorithms, uses pastexperience of an incompletely known system to predict its future behavior.However, the major difference is in how the algorithm assigns credit to aprediction that is made. While traditional methods assign credit by meansof the difference between predicted and actual outcomes, the TD methodassigns credit by means of the difference between temporally successivepredictions. TD methods make more efficient use of the training data inmulti-step prediction problems. Specifically, in this research, we consider allloans with a tenure of one year and having an EMI repayment schedule. Wecalculate the monthly prepayment percentage of each customer using Eqns. 1- 4. We format the data to appear as is shown in Table 2. We are interestedin predicting the CPP at the end of the loan term from any given month
8
URN m0 m1 m2 m3 m4 m5 m6 m7 . . . m11 m121 0 0 0 0 0 7 6 1 . . . 2 12 0 4 1 0 0 5 2 0 . . . 2 03 10 7 3 2 2 0 5 NA . . . NA NA4 0 0 0 0 0 2 NA NA . . . NA NA5 0 3 1 NA NA NA NA NA . . . NA NA
Table 2: Prepayment profile (in percentage) of customers.
in the loan period, using the TD approach in conjunction with a suitablesupervised learner.
4.1 Predicting cumulative prepayment scores
We now run TD learners on a real-world data set that is obtained from afinancial institution (details of the data set and the practitioner are presentedin section 5). For ease of implementation, we convert the final table intoits cumulative version (as is shown in Table 2); that is, what now comesunder month n is the CPP up to and including the n-th month’s prepaymentpercentage. Since we are currently looking only into 1-year loans, month 12’svalue is the CPP at the end of the loan tenure. Only a small percentage ofthe total data set will have prepayment percentages up to month 12. Hence,the data table will have a structure similar to a left upper triangle matrixas shown in Fig. 2a. We now run TD learners on this data. For ease ofillustration, let us assume that we want to predict the cumulative attritionfor month 4 from month 1. The TD learning system works as follows:
1. A model (such as linear regression or neural networks) is created forpredicting month 4’s CPP from month 3; that is, month 3’s data will bethe predictor, and month 4’s data will be the response or target valuesfor training. The size of this training data will be limited by the size ofthe cases for which data is complete. Let us call this model model3 4.This is a single model built from all customers who have repaymentdata for month 3 as well as month 4.
2. Similarly, another model is created to predict month 4’s CPP frommonth 2. The TD learner uses the predictions of model3 4 (month 3’sdata goes as input to model3 4) as the target variable and month 2’sdata as the predictor for training the model, as shown in Fig. 2c. Thatis, model2 4 predicts the output of model3 4 from month 2.
9
(a) Dataset (b) Traditional learner
(c) TD learner
Figure 2: Comparison of data utilization by a traditional supervisedlearning approach with a TD Learner: Predicting month 4’s cumulativeattrition from month 1.
3. We further create model1 4 with model2 4’s predictions. In general,modeli 4 uses modeli+1 4’s predictions as the response variable.
Figs. 1 and 2 clearly illustrate the advantages of a TD learner over thetraditional method. A traditional learner would be content with the creationof a single model, model1−4, which is trained using the limited cases thathave complete data available up to month 4, as shown in Fig. 2b. On theother hand, a TD learner (see Fig. 2c) progressively gets more data pointsto train the models. Additionally, a TD learner better exploits intermediatetransaction patterns to create more robust predictors. This is helpful whenthe customer transaction patterns are affected by seasonal variations, asevident from the data that we have.
10
(a) Summary of loan products. (b) Summary loan repayment frequencies.
Figure 3: Summary of the data set.
5 Case Study and Implications
In this study, we worked with IFMR Rural Finance (IRF), a provider oftechnology and process solutions to financial institutions that are involvedlow-income environments. We analyzed data sets collected from IRF’s clientswith the objective of modeling the financial behaviour of their currentand prospective customers. These data sets contained transaction anddemographic information of close to half a million end-customers across 250rural branches in India for a time span that stretches from August 2008 toNovember 2014. Fig. 3 shows a broad summary of the available data setpertaining to debt products.
This data set can be viewed as containing two sets of information: self-reported customer characteristics and transactional details. The practitionergathers various self-reported data from potential customers (awareness drivesor walk-ins) and existing customers on a quasi-periodic basis. These rangefrom purely demographic indicators such as age, gender, educational status,and family size, to purely financial details such as family income, familyexpense, and assets. For existing customers, additional information on theirproduct-level transactions is also available. This includes the other productsthey own, open and close dates, their loan repayment transactions, etc.Merging and sorting the tables give us a final data set to work on. Fromthis table, for the analysis we describe in the next subsection, we extractinformation relating to a particular type of loan, which has a tenure of a yearand comes with a monthly repayment pattern.
11
The data is consumed in its raw form without any scaling ornormalization. This is because the purpose of this exercise is to improvethe prediction and not superior interpretation of which factors affect theoutput. Since the econometric model used for prediction is a simple linearregression model, the statistical inference will be the same whether we choseto normalize or not. This is the training data for our analysis.
5.1 Results
We compare the performance of a traditional supervised learner to theproposed TD learner in predicting the CPP in the end of the loan tenure,given the CPP for a particular month. For this, we look into the predictionsof the CPP at the end of a loan tenure made by the traditional and TDmodel from different stages of the loan tenure.
Fig. 4 shows the prediction error when predicting the final CPP fromdifferent stages of the loan period, comparing a traditional supervisedlearning method to a TD learner (see Sec. 4.1) that uses a linear regressionmodel as its back-engine. These results are obtained from running thealgorithms on a test data set. It can be seen that the TD method outperformsthe traditional method by a very high margin, especially at the early stagesof a loan.
Figure 4: RMSE 1 vs. predicting month for conventional and TD methods.
1Root-Mean-Square Error
12
5.2 Implications
There are various business insights and actionable items that thisimprovement in prediction can bring about. At the systemic level, certainrecurrent patterns might indicate phenomena related to branches, products,personnel, or policy. For instance, when customers in a certain branchrecurrently prepaid four of their weekly repayments and mimicked a monthlypayment, this pattern led to divergent questions of whether the customersunderstood the repayment schedule or found it difficult to physically accessthat branch. This might have implications for better explaining the productor opening up more branches. At the individual level, it could indicatethat the product is not suitable, that the repayment schedule needs to bedifferent, or even the increased likelihood of the customer leaving the MFIfor a competitor.
The major implications of these results are twofold. 1) A relatively newloan user can be judged more accurately right from her initial months intothe loan period. This enables the institution to take corrective measures fromits side if necessary, before much loss is incurred. A person who is predictedto have a very aggressive repayment pattern can be encouraged to take upother products, or given other incentives if she is deemed profitable if shestays back. This also helps in understanding the suitability of the productsthat are on offer in a particular region. 2) The majority of the customers inthe data set provided are in the middle of their loan tenures. Only a verysmall percentage have data for all 12 months of the tenure. This makes thedata set very sparse. While the traditional method is limited by this factas explained earlier, the TD learners are able to start building more robustpredictors right away, without waiting for more customers to complete theirloans so as to increase the density of the training data.
6 Future Work
This study aimed to predict prepayment states in sparse and assymetric dataenvironments using Temporal Difference learners. While this study focusesits efforts on a mathematical conception of prepayment, there is nothing thatconstrains the use of these techniques to prepayments. In fact, any behaviourassociated with repayment, which is likely to have similar asymmetric dataavailability, could be a good candidate for modelling through temporaldifferences. One obvious area of interest could be delinquency. While thereare some fundamental differences between attrition and delinquency — suchas the fact that attrition has a guaranteed terminal state that coincides with
13
the loan tenure, whereas delinquency does not have any such guarantees —it still fits our broader framework for using this approach. This idea couldalso be extended to go beyond single loans to looking at cycles of loans andother products.
There is scope for future work in the refinement of the suggested model.Given the mathematical model adopted by the CPP, it should facilitatethe explicit construction of bounds that subsequent prepayment values cantake (rather than allow the supervised learner to implicitly learn this). Forinstance, a single payment that covers the next three repayments posesdifferent lower bound constraints for the CPP of the next three months.Also, much of this work does not explicitly model patterns or paths in therepayment. It is likely that unsupervised grouping of prepayment patternsis likely to provide us with business insights as well as stronger features forbetter predictions.
Finally, the greater value of prepayment prediction is in its use as an inputfor decision-making. In that regard, it would be important to understandthe effects that prepayment patterns have on actual attrition (which refersto the likelihood that a customer chooses to not renew the product, or optfor another product upon expiry of the current product). Also, it is worthexploring and understanding the exact role that prepayment predictionscould play in a broader credit or profit score, which in turn would resultin holistic business intelligence leading to greater long-term profits andsustainability for financial institutions in the low-income space.
7 Conclusions
The proposed algorithm attempts to solve the problem of having sparse andasymmetric data to make predictions of prepayment over the remainingtenure of a loan. As a result, this partially solves the problem of cold-start that a financial institution may face owing to the introduction ofa new product, entering into a new demographic, or starting in a newlocation. The mathematical framework of prepayment, referred to as CPP,uses a percentage- based prepayment conception that can be validated usingcustomer behaviour and can also be easily translated to a scoring system.The predictive engine using Temporal Difference learners shows a significantimprovement over the traditional supervised learner, especially in the earlycycles of a loan repayment. The improved scores are expected to have apositive impact on a wide range of aspects of the money lending business.
14
The most significant of these is a better understanding of the customer.This could lead to better screening of customers and proactive strategiesfor customer engagement to prevent attrition. At an organizational level,it could also lead to better financial planning. Finally, this idea could beextended to modeling other aspects of repayment such as delinquency anddefault.
15
References
Asongu, S. A. (2013). How has mobile phone penetration stimulated financialdevelopment in africa? Journal of African Business, 14(1):7–18.
Banerjee, A., Chandrasekhar, A. G., Duflo, E., and Jackson, M. O. (2013).The diffusion of microfinance. Science, 341(6144):1236498.
Brau, J. C. and Woller, G. M. (2004). Microfinance: A comprehensive reviewof the existing literature. Journal of Entrepreneurial Finance, JEF, 9(1):1–27.
Caudill, S. B., Gropper, D. M., and Hartarska, V. (2009). Which microfinanceinstitutions are becoming more cost effective with time? Evidence from amixture model. Journal of Money, Credit and Banking, 41(4):651–672.
Dunn, E. (2002). It pays to know the customer: addressing the informationneeds of client-centered MFIs. Journal of International Development,14(3):325–334.
Goldberg, N. (2005). Measuring the impact of microfinance: taking stock ofwhat we know. Grameen Foundation USA publication series.
Hall, A. and Lundstedt, K. G. (2005). The competing risks framework formortgages: modeling the interaction of prepayment and default. RMAJOURNAL, 88(1):54.
Hermes, N. and Lensink, R. (2007). The empirics of microfinance: what dowe know? The Economic Journal, 117(517):F1–F10.
Hulme, D. and Mosley, P. (1996). Finance against poverty, volume 2.Psychology Press.
Kang, P. and Zenios, S. A. (1992). Complete prepayment models formortgage-backed securities. Management Science, 38(11):1665–1685.
Littlefield, E., Morduch, J., and Hashemi, S. (2003). Is microfinance aneffective strategy to reach the Millennium Development Goals? FocusNote, 24(2003):1–11.
Morduch, J. (2000). The microfinance schism. World development, 28(4):617–629.
Musona, D. and Coetzee, G. (2001). Dropouts among selected Zambianmicrofinance institutions: causes and potential impact on product design.MicroSave-Africa working paper.
16
Nourse, T. H. (2001). The missing parts of microfinance: Services forconsumption and insurance. SAIS Review, 21(1):61–69.
Rahman, S. (2000). Commercialization of microfinancein Bangladesh perspective. Global Development Research Center, Osaka,Japan.[http://www. gdrc. org/icm/country/bangla-001. html].
RBI (2011). Comprehensive guidelines on derivatives: Modifications.https://rbidocs.rbi.org.in/rdocs/notification/PDFs/CGD021111FL.pdf.
RBI (2015). Report of the committee on medium-term path on financialinclusion. https://rbidocs.rbi.org.in/rdocs/PublicationReport/Pdfs/FFIRA27F4530706A41A0BC394D01CB4892CC.PDF.
Robinson, M. S. (2001). The microfinance revolution: sustainable finance forthe poor. World Bank Publications.
Sutton, R. S. (1988). Learning to predict by the methods of temporaldifferences. Machine learning, 3(1):9–44.
Thomas, L. C., Ho, J., and Scherer, W. T. (2001). Time will tell: behaviouralscoring and the dynamics of consumer credit assessment. IMA Journal ofManagement Mathematics, 12(1):89–103.
Thorat, Y. (2006). Microfinance in India: Sectoral issues and challenges.Towards a sustainable microfinance outreach in India, pages 27–42.
Yamamoto, Y. and Zenios, S. A. (1993). Predicting prepayment rates formortgages using the cascade-correlation learning algorithm. The Journalof Fixed Income, 2(4):86–96.


![[Bank of America] Prepayments on Agency Hybrid ARM MBS](https://static.documents.pub/doc/80x56/577d38c61a28ab3a6b9877d9/bank-of-america-prepayments-on-agency-hybrid-arm-mbs.jpg)


