QUANTIFYING LEAKAGE THRESHOLDS FOR QAM/LTE INTERFERENCE 185 AINSLEY DRIVE SYRACUSE, NY 13210 800.448.1655 I WWW.ARCOMDIGITAL.COM CLEARLY BETTER. ADVANCED TECHNOLOGY AUTHORS VICTOR ZINEVICH GREG TRESNESS INITIAL PUBLICATION I FEBRUARY 2013 REVISION I MARCH 2016
Transcript
QUANTIFYING LEAKAGE THRESHOLDS FOR QAM/LTE INTERFERENCE
185 AINSLEY DRIVE
SYRACUSE, NY 13210
800.448.1655 I WWW.ARCOMDIGITAL.COM
CLEARLY BETTER.
AD
VA
NC
ED
TE
CH
NO
LO
GY
AUTHORS
VICTOR ZINEVICH
GREG TRESNESS
INITIAL PUBLICATION I FEBRUARY 2013
REVISION I MARCH 2016
CLEARLY BETTER.
AD
VA
NC
ED
TE
CH
NO
LO
GY
TABLE OF CONTENTS
Abstract 3
Scenario 1. QAM leak signals interfering with LTE receivers 4
Analysis as pertains to LTE base station locations 5
Analysis as pertains to LTE user equipment 7
Scenario 2. LTE signals Interfering with QAM signals in the cable network 8
QAM CNR being affected by LTE base stations 10
QAM CNR being affected by LTE user equipment 14
Interference from LTE user equipment within the home 19
Shielding effectiveness and the relationship to leak level 19
Statistics showing leak distribution by level 27
Conclusions 28
CLEARLY BETTER.
AD
VA
NC
ED
TE
CH
NO
LO
GY
ABSTRACT The issue of interference between QAM signals carried over the cable network with wireless LTE
signals in the 700 MHz band is well known and has been widely discussed. Egress of QAM signals
from the coaxial network can negatively impact LTE performance, and ingress of LTE signals into
the coaxial cable can negatively impact signal transmission within the cable network. Both of
these phenomena are based on the fact that the coaxial network has “leakage holes” that allow
the two signal sets to coexist. Technology is now available that provides visibility to the existence
and location of these high frequency leaks within the cable network, but an important question
remains: “What is an acceptable leak level within the LTE band”?
The goal of this paper is to attempt to mathematically define thresholds for acceptable QAM leak
levels within the LTE band for two main scenarios:
1. QAM leak signals interfering with LTE receivers.
2. LTE signals interfering with QAM signals within the cable network.
As part of the second scenario above, specific to the case of LTE interference in the home, we will
extend our analysis to include a discussion of how leak level is related to shielding effectiveness
and FCC requirements for field strength immunity.
In our analysis herein, it is important to mention that “worst case” scenarios will be used for all
assumptions which will assure that the requirements for the minimum allowable QAM leak levels
should guarantee the absence of interference.
This specific subject of defining allowable high frequency leakage levels has been tasked to the
SCTE Network Operation Standards Working Group 1. This paper is offered as a possible starting
point for discussion on this subject within the working group, and is intended to assist said group
in their efforts. Any conclusions or assumptions made within this paper are intended to be vetted
within the working group and are intended to stimulate further discussion.
This paper does not attempt to set guidelines for operators as to which leaks should be mitigated,
it simply presents data in a different fashion such that operators can come up with their own
conclusion as to what should be repaired based upon their specific and individual business and
operational objectives.
3
CLEARLY BETTER.
AD
VA
NC
ED
TE
CH
NO
LO
GY
SCENARIO 1. QAM LEAK SIGNALS INTERFERING WITH LTE RECEIVERS
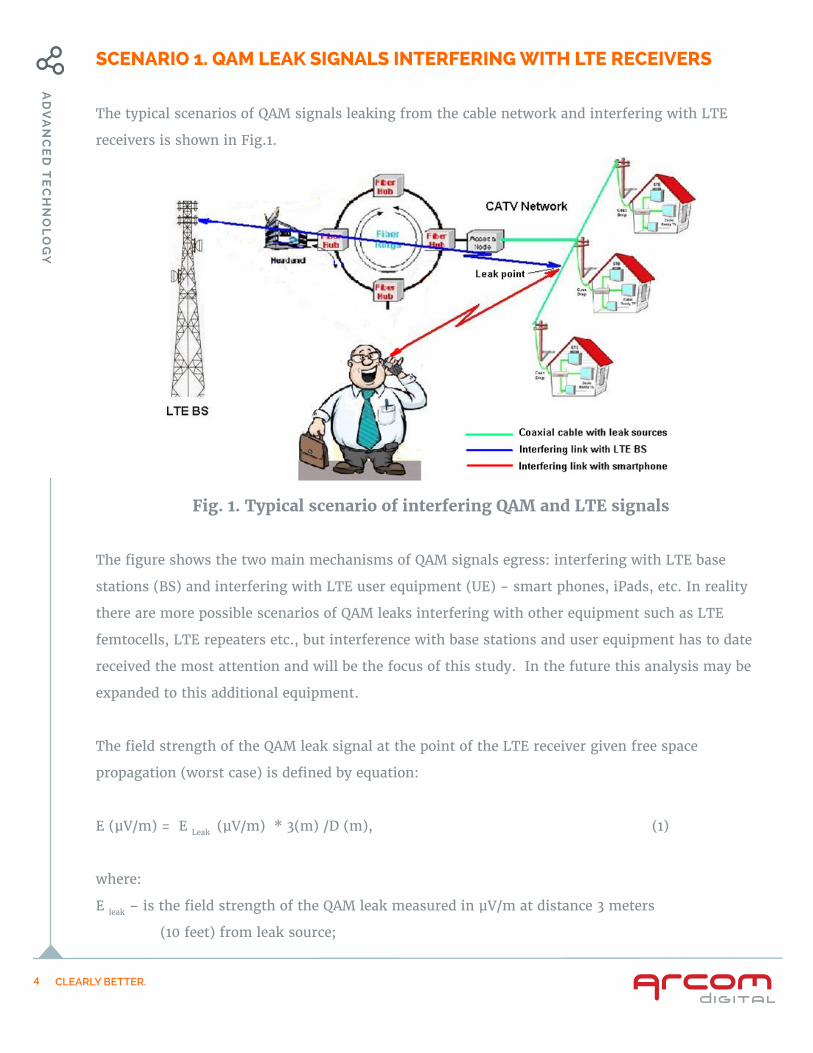
The typical scenarios of QAM signals leaking from the cable network and interfering with LTE
receivers is shown in Fig.1.
4
Fig. 1. Typical scenario of interfering QAM and LTE signals
The figure shows the two main mechanisms of QAM signals egress: interfering with LTE base
stations (BS) and interfering with LTE user equipment (UE) - smart phones, iPads, etc. In reality
there are more possible scenarios of QAM leaks interfering with other equipment such as LTE
femtocells, LTE repeaters etc., but interference with base stations and user equipment has to date
received the most attention and will be the focus of this study. In the future this analysis may be
expanded to this additional equipment.
The field strength of the QAM leak signal at the point of the LTE receiver given free space
propagation (worst case) is defined by equation:
E (μV/m) = E Leak (μV/m) * 3(m) /D (m), (1)
where:
E leak – is the field strength of the QAM leak measured in μV/m at distance 3 meters
(10 feet) from leak source;
CLEARLY BETTER.
AD
VA
NC
ED
TE
CH
NO
LO
GY
D – is the distance from leak source to LTE receiver in meters.
Assume that the bandwidth of the LTE receiver is 5 MHz and that the 6 MHz QAM leak signal fully
overlaps the bandwidth of the LTE receiver. This is the worst case scenario of impact of the QAM
leak signal interfering with the LTE receiver.1 As such, the power of the QAM interfering leak signal
at the input of the LTE receiver is defined by formula:
PRx(W) = 0.83 * (E2 * GRx * λ2)/(480 ∗ π2), (2)
where:
0.83 – is the coefficient (5/6) taking into consideration power losses due to bandwidths of the LTE
receiver and the QAM leak signal;
GRx – is receiving antenna gain (numerical);
λ - is wave length (m) of interfering signal, for 750 MHz LTE λ = 0.4 m.
Taking into account equation (1), the formula (2) in logarithmic scale for 750 MHz LTE band (λ =
ANALYSIS AS PERTAINS TO LTE BASE STATION LOCATIONS
The graphs of the QAM interfering leak signal power at the input of LTE BS with a maximum
receive BS antenna gain of 15 dBi (worst case) are shown on Fig.2. The red dotted line on Fig.2
shows the – 110 dBm threshold where egress begins to impact the LTE BS noise floor receiver with
a 5 MHz bandwidth. This level may be used as a threshold for the minimum allowable QAM leak
interfering signal.
5
1 The immunity of an LTE receiver to interfering signals depends not only on receiver bandwidth, but also on modulation, bit rate and additional factors such as MIMO. But for simplicity and because the spectrum of a QAM signal looks like Gaussian noise we’ll compare impact from QAM leak with the relative increasing noise floor of the receiver. From this point of view, the impact from one 6MHz QAM channel on a receiver with bandwidth 5 MHz is approximately the same as the impact from spectrum of adjacent QAM channels on receiver with bandwidth 10, 15, and 20 MHz.
CLEARLY BETTER.
AD
VA
NC
ED
TE
CH
NO
LO
GY
6
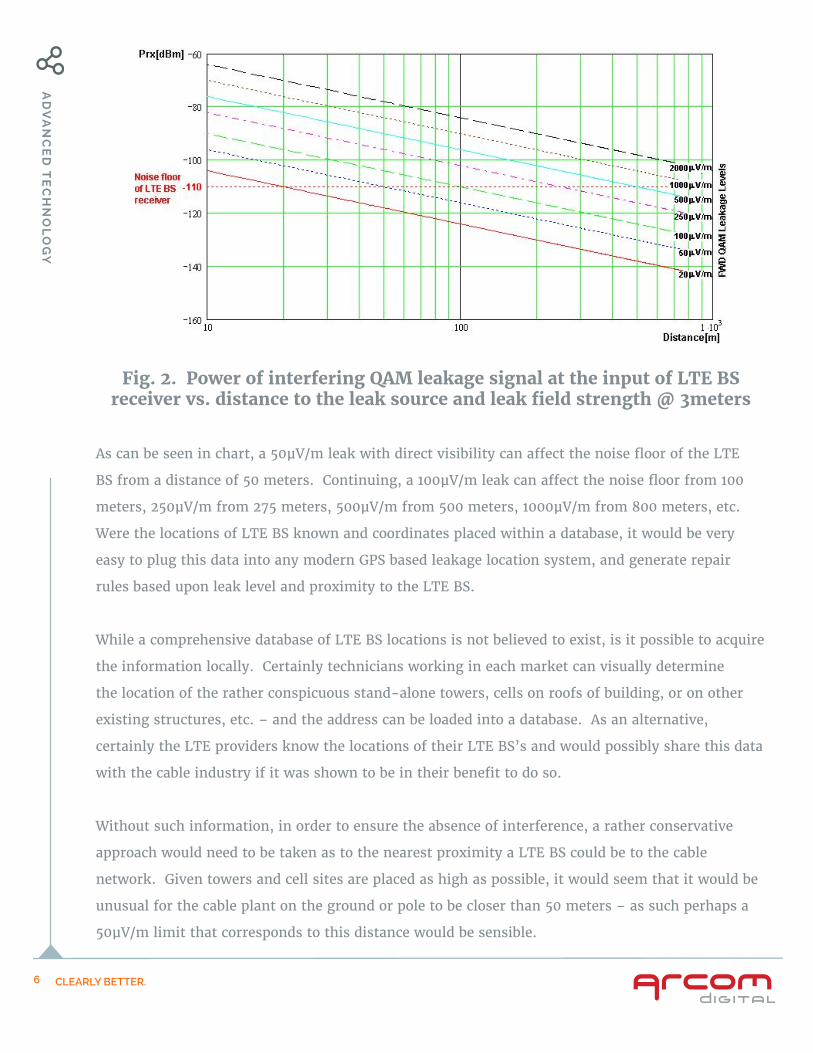
Fig. 2. Power of interfering QAM leakage signal at the input of LTE BS receiver vs. distance to the leak source and leak field strength @ 3meters
As can be seen in chart, a 50µV/m leak with direct visibility can affect the noise floor of the LTE
BS from a distance of 50 meters. Continuing, a 100µV/m leak can affect the noise floor from 100
meters, 250µV/m from 275 meters, 500µV/m from 500 meters, 1000µV/m from 800 meters, etc.
Were the locations of LTE BS known and coordinates placed within a database, it would be very
easy to plug this data into any modern GPS based leakage location system, and generate repair
rules based upon leak level and proximity to the LTE BS.
While a comprehensive database of LTE BS locations is not believed to exist, is it possible to acquire
the information locally. Certainly technicians working in each market can visually determine
the location of the rather conspicuous stand-alone towers, cells on roofs of building, or on other
existing structures, etc. – and the address can be loaded into a database. As an alternative,
certainly the LTE providers know the locations of their LTE BS’s and would possibly share this data
with the cable industry if it was shown to be in their benefit to do so.
Without such information, in order to ensure the absence of interference, a rather conservative
approach would need to be taken as to the nearest proximity a LTE BS could be to the cable
network. Given towers and cell sites are placed as high as possible, it would seem that it would be
unusual for the cable plant on the ground or pole to be closer than 50 meters – as such perhaps a
50µV/m limit that corresponds to this distance would be sensible.
CLEARLY BETTER.
AD
VA
NC
ED
TE
CH
NO
LO
GY
7
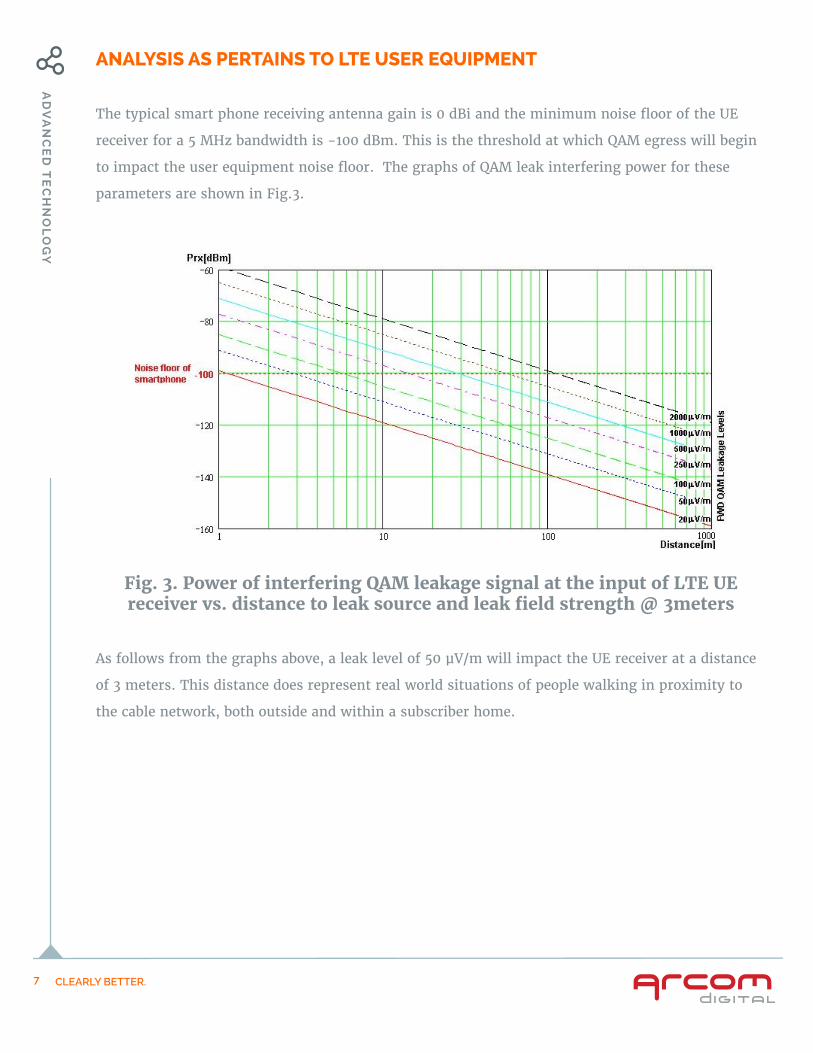
Fig. 3. Power of interfering QAM leakage signal at the input of LTE UE receiver vs. distance to leak source and leak field strength @ 3meters
As follows from the graphs above, a leak level of 50 µV/m will impact the UE receiver at a distance
of 3 meters. This distance does represent real world situations of people walking in proximity to
the cable network, both outside and within a subscriber home.
ANALYSIS AS PERTAINS TO LTE USER EQUIPMENT
The typical smart phone receiving antenna gain is 0 dBi and the minimum noise floor of the UE
receiver for a 5 MHz bandwidth is -100 dBm. This is the threshold at which QAM egress will begin
to impact the user equipment noise floor. The graphs of QAM leak interfering power for these
parameters are shown in Fig.3.
CLEARLY BETTER.
AD
VA
NC
ED
TE
CH
NO
LO
GY
SCENARIO 2. LTE SIGNALS INTERFERING WITH QAM SIGNALS IN THE CABLE NETWORK
To define the influence of LTE signals on QAM signals within coaxial cable, we will use the CNR
parameter. LTE signals looks like white noise, so using CNR is a reasonable and valid parameter for
analysis of interference. To calculate degradation of CNR due to an LTE interfering signal, assume
first that the noise present within the cable absent an interfering signal is low enough (CNR >
40 dB) such that it does not need to be taken into consideration. Also based on the worst case
assumption, assume the free space model of propagation of the LTE signal from BS and UE to the
leak source and that the LTE transmitter works with a 5 MHz bandwidth and all the energy of the
LTE signal is placed within the 6 MHz band of one QAM channel within the coaxial network.
The field strength (E) is calculated by the well-known formula:
E (μV/m) = √(S* Zo), (4)
where
Zo= 120 π − is impedance of free space;
S (w/m2) = PTx * GTx/4 π * D 2 – is the transmitter power flux density at distance D (m) from
transmitter of power PTx (W) with the transmitting antenna gain GTx (numerical).
The final formula for field strength is as follows:
Formula (10) shows a very interesting relationship between degradation of CNR from QAM signal
level Uqam for the same leak level ELeak - the degradation of CNR has a square dependency relative
to the QAM signal level. As will be shown below, this relationship significantly increases the
requirement for allowable leak level anywhere in the network where low level signals exist, either
before an amplifier, within the drop, or especially within the subscriber home portion of the
network.
The typical parameters of the LTE base station (BS) are as follows: PTx = 43 dBm and GTx= 15 dBi.
The QAM signal level in coaxial cable is dependent upon the portion of the cable network and
typically varies as follows2:
- trunk line: +5 to +40 dBmV ;
- drop line: +5 to +15 dBmV;
- home network: -10 to 0 dBmV .
The worst case parameter of OPL for both trunk and drop lines can be defined as 0 dB, which
means that the leak source and LTE transmitter are located within a zone of direct RF visibility
(free space). For home network the typical value of OPL is in range from 15dB to 30 dB depending
from wall material, wall thickness, furniture, etc.
QAM CNR BEING AFFECTED BY LTE BASE STATIONS
Taking in account the above parameters and using formula (10) in Figs. 4-10, the family of graphs
of QAM signal CNR degradation is shown for different scenarios of interference from LTE signals,
with varying QAM signal level and OPL. The red dotted line on the graphs shows the CNR threshold
of 33 dB for a QAM-256 signal.
10
2 Certainly levels are also architecture dependent. These numbers are provided as estimates and also reference QAM levels (not analog equivalent), and take into account slope differences between 700MHz and 860MHz.
CLEARLY BETTER.
AD
VA
NC
ED
TE
CH
NO
LO
GY
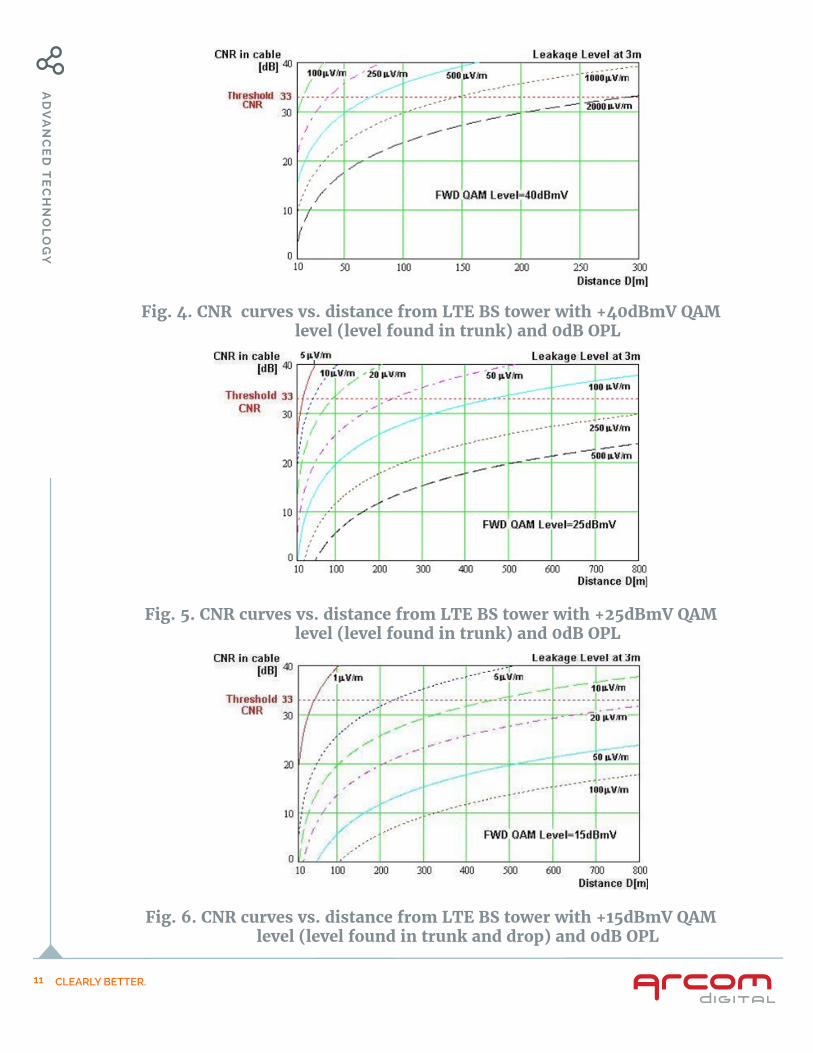
Fig. 4. CNR curves vs. distance from LTE BS tower with +40dBmV QAM level (level found in trunk) and 0dB OPL
11
Fig. 5. CNR curves vs. distance from LTE BS tower with +25dBmV QAM level (level found in trunk) and 0dB OPL
Fig. 6. CNR curves vs. distance from LTE BS tower with +15dBmV QAM level (level found in trunk and drop) and 0dB OPL
CLEARLY BETTER.
AD
VA
NC
ED
TE
CH
NO
LO
GY
Fig. 7. CNR curves vs. distance from LTE BS tower with +10dBmV QAM level (level found in trunk and drop) and 0dB OPL
12
Fig. 8. CNR curves vs. distance from LTE BS tower with +5dBmV QAM level (level found in trunk and drop) and 0dB OPL
Fig. 9. CNR curves vs. distance from LTE BS tower with +0dBmV QAM level (level found in home) and 15 dB OPL
CLEARLY BETTER.
AD
VA
NC
ED
TE
CH
NO
LO
GY
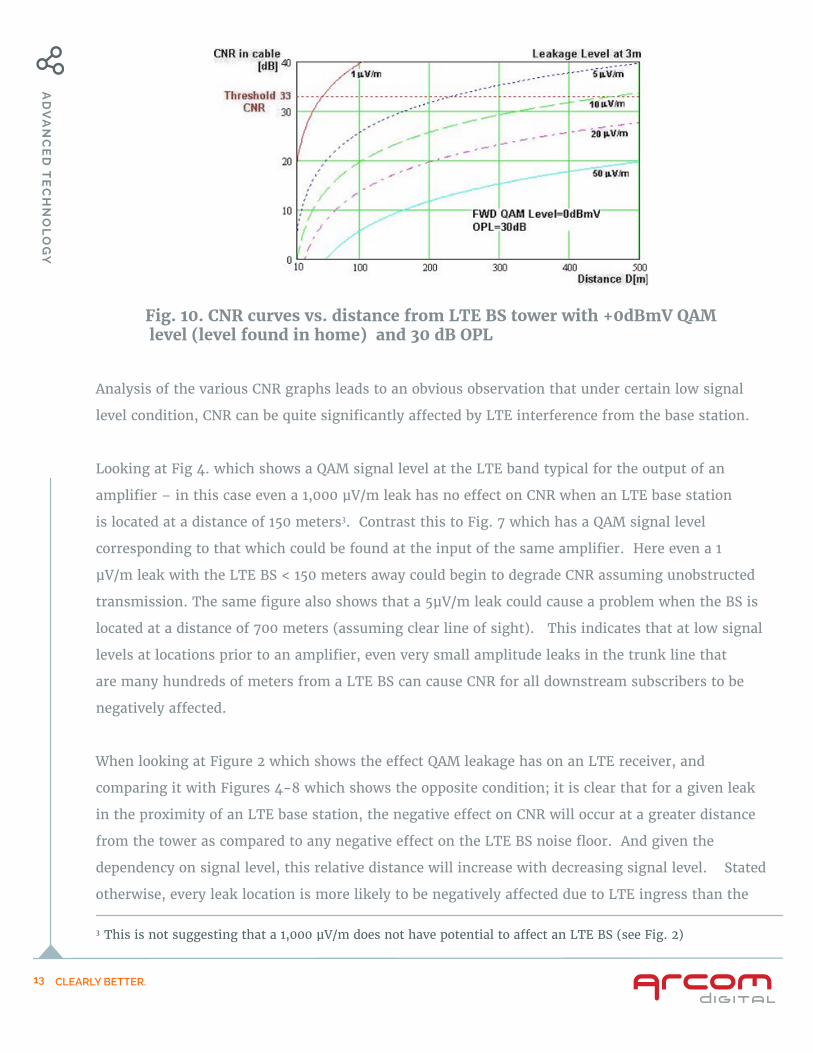
Fig. 10. CNR curves vs. distance from LTE BS tower with +0dBmV QAM level (level found in home) and 30 dB OPL
Analysis of the various CNR graphs leads to an obvious observation that under certain low signal
level condition, CNR can be quite significantly affected by LTE interference from the base station.
Looking at Fig 4. which shows a QAM signal level at the LTE band typical for the output of an
amplifier – in this case even a 1,000 µV/m leak has no effect on CNR when an LTE base station
is located at a distance of 150 meters3. Contrast this to Fig. 7 which has a QAM signal level
corresponding to that which could be found at the input of the same amplifier. Here even a 1
µV/m leak with the LTE BS < 150 meters away could begin to degrade CNR assuming unobstructed
transmission. The same figure also shows that a 5µV/m leak could cause a problem when the BS is
located at a distance of 700 meters (assuming clear line of sight). This indicates that at low signal
levels at locations prior to an amplifier, even very small amplitude leaks in the trunk line that
are many hundreds of meters from a LTE BS can cause CNR for all downstream subscribers to be
negatively affected.
When looking at Figure 2 which shows the effect QAM leakage has on an LTE receiver, and
comparing it with Figures 4-8 which shows the opposite condition; it is clear that for a given leak
in the proximity of an LTE base station, the negative effect on CNR will occur at a greater distance
from the tower as compared to any negative effect on the LTE BS noise floor. And given the
dependency on signal level, this relative distance will increase with decreasing signal level. Stated
otherwise, every leak location is more likely to be negatively affected due to LTE ingress than the
13
3 This is not suggesting that a 1,000 µV/m does not have potential to affect an LTE BS (see Fig. 2)
CLEARLY BETTER.
AD
VA
NC
ED
TE
CH
NO
LO
GY
LTE BS is likely to be affected due to QAM egress. With regard to high frequency leakage, for a
variety of reasons the majority of the attention to date has been focused on the egress aspects, with
the ingress side receiving significantly less attention. While in no way trivializing the egress size,
the ingress size rightly deserves increased attention as there clearly are significant benefits in the
form of improved forward signal transmission quality that can be realized through high frequency
leak mitigation.
In establishing any mitigation rules, consideration should be given to the possible cumulative effect
of CNR degradation from many low level leaks and further investigation should be made as to how
CNR degrades when leaks are combined with other RF impairments existing in coaxial cable such
as micro-reflections and CPD.
Given the described QAM signal level and CNR relationship, it would be of benefit to merge
databases containing leak locations and signal levels in order to better develop rules as to repair
prioritization.
Fig. 10 shows the scenario of an LTE BS affecting CNR within the home. A QAM level of 0dBmV is
used along with 30dB OPL which represents the signal traveling through the outer walls and roof.
This shows that even a 5µV/m leak with the transmitter at 225 meters can begin to affect CNR.
QAM CNR BEING AFFECTED BY LTE USER EQUIPMENT
Switching now to the scenario of QAM CNR being affected by smart phones and other LTE UE, the
power and gain parameters for these devices are: PTx = 23 dBm and GTx= 0 dBi. Taking in account
these parameters and again using formula (10), in Figs. 11-21 the family of graphs of QAM signal
CNR degradation is shown for different scenarios of interference due to LTE user equipment, for
various QAM levels and OPL conditions.
14
CLEARLY BETTER.
AD
VA
NC
ED
TE
CH
NO
LO
GY
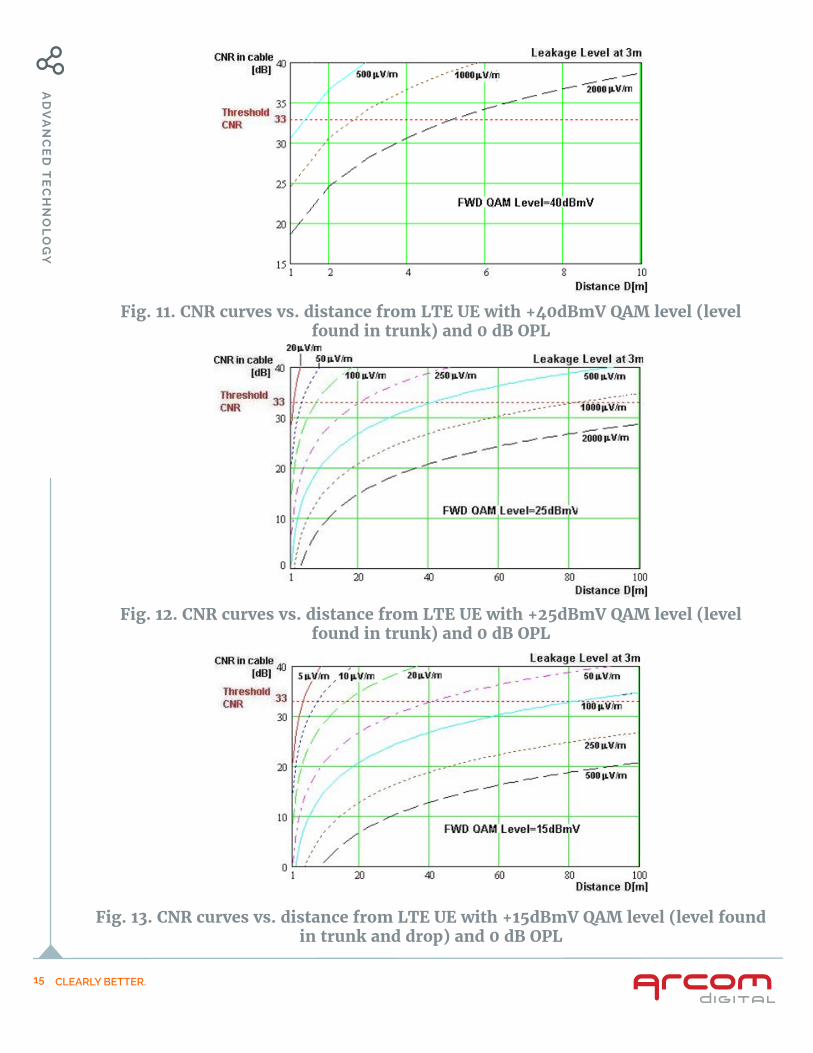
Fig. 11. CNR curves vs. distance from LTE UE with +40dBmV QAM level (level found in trunk) and 0 dB OPL
15
Fig. 12. CNR curves vs. distance from LTE UE with +25dBmV QAM level (level found in trunk) and 0 dB OPL
Fig. 13. CNR curves vs. distance from LTE UE with +15dBmV QAM level (level found in trunk and drop) and 0 dB OPL
CLEARLY BETTER.
AD
VA
NC
ED
TE
CH
NO
LO
GY
Fig. 14. CNR curves vs. distance from LTE UE with +10dBmV QAM level (level found in trunk and drop) and 0 dB OPL
16
Fig. 15. CNR curves vs. distance from LTE UE with +5dBmV QAM level (level found in trunk and drop) and 0 dB OPL
Fig. 16. CNR curves vs. distance from LTE UE with +0dBmV QAM level (level found in home) and 0 dB OPL
CLEARLY BETTER.
AD
VA
NC
ED
TE
CH
NO
LO
GY
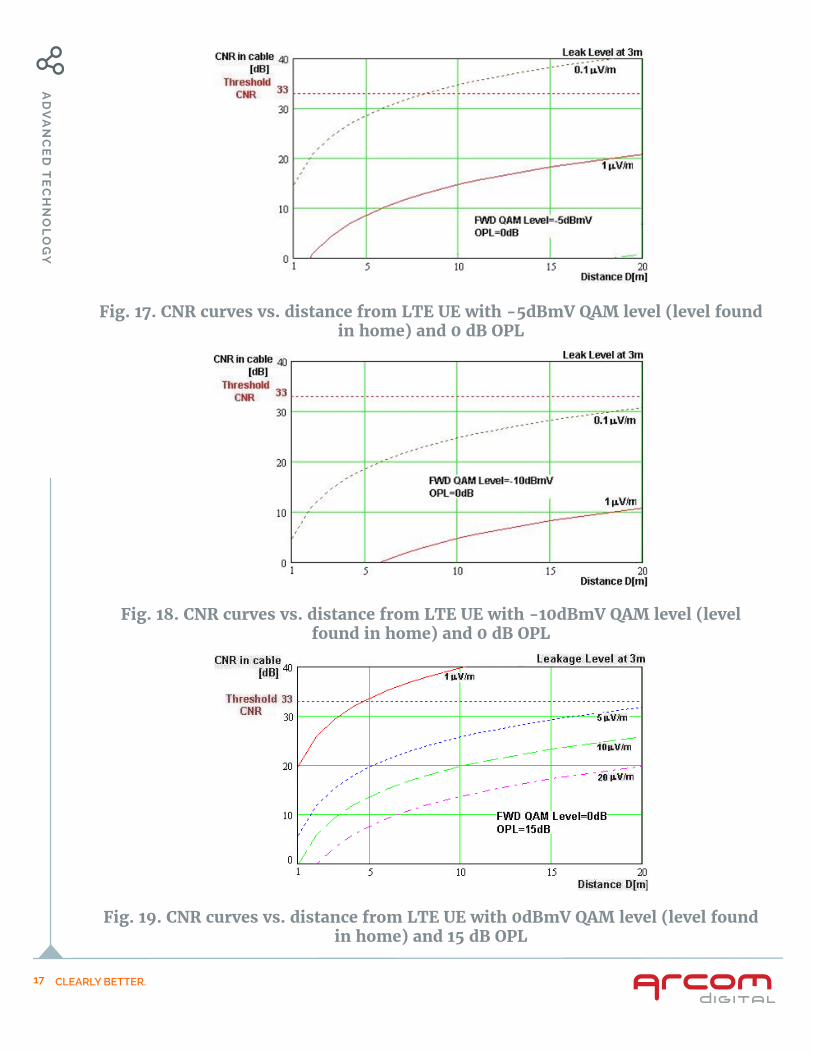
Fig. 17. CNR curves vs. distance from LTE UE with -5dBmV QAM level (level found in home) and 0 dB OPL
17
Fig. 18. CNR curves vs. distance from LTE UE with -10dBmV QAM level (level found in home) and 0 dB OPL
Fig. 19. CNR curves vs. distance from LTE UE with 0dBmV QAM level (level found in home) and 15 dB OPL
CLEARLY BETTER.
AD
VA
NC
ED
TE
CH
NO
LO
GY
Fig. 20. CNR curves vs. distance from LTE UE with -5dBmV QAM level (level found in home) and 15 dB OPL
18
Fig. 21. CNR curves vs. distance from LTE UE with -10dBmV QAM level (level found in home) and 15 dB OPL
Analysis of the various CNR graphs of LTE interference from user equipment shows again that
under conditions of low signal level CNR could be adversely affected. Figure 13 shows that at
a location with a QAM level of 15dBmV and OPL of 0dB, if a person walks with a smart phone
10 meters from a 10µV/m leak, then CNR could begin to degrade. This is certainly a real world
scenario.
CLEARLY BETTER.
AD
VA
NC
ED
TE
CH
NO
LO
GY
INTERFERENCE FROM LTE USER EQUIPMENT WITHIN THE HOME
From a level perspective, the home portion of the network is clearly the most susceptible to CNR
deterioration due to interference from LTE user equipment. Looking at the situation in the home,
the math suggests that in order to ensure the threshold 33 CNR value is met, the requirement for
allowable leak limits would need to be at a very stringent number of <1 µV/m. Figure 21 shows
the lowest expected QAM level within the home of -10dBmV along with 15dB OPL – and the
graph shows that even a 0.1µV/m leak could allow a LTE phone to begin to deteriorate CNR when
located a distance of 5 meters from the leak, through a wall. Obviously a sub 1 µV/m leak can’t
be detected in the LTE band by any leak detector installed on a truck driving outside the home.
So any measurement for this low level within the home only makes sense to implement for home
certification processes or troubleshooting.
SHIELDING EFFECTIVENESS AND THE RELATIONSHIP TO LEAK LEVEL
One of the specific aspects of interfering LTE signal within the home portion of the cable network
is that interfering signals may directly impact cable modems or set-top-boxes due to insufficient
unit shielding effectiveness (SE). This type of interference is commonly referred as Direct Pickup
or DPU interference (DPU). There have been multiple studies performed over the past few years
on this subject, focusing to co-channel interference effects of LTE and other white space devices.
Obviously if a cable modem or set-top-box is connected anywhere within the home network, then
any requirements for SE and immunity to DPU should be extended to in-home cables, splitters
and in general any component of the cable network within the home. Because the SE parameter
is widely used for cables and splitters, it will be helpful to define the relation between SE and leak
levels detected within the home, and compare these results with FCC requirements for DPU.
Current FCC immunity requirement for Cable Ready Devices specified in 47CFR15.118 defines the
threshold for field strength of interfering signal as 0.1 V/m. But as is shown in the Motorola
Whitepaper , “Shielding Effectiveness of In-Home Cable TV Wiring and Splitters”, and reproduced in
Figure 22 below - the minimum separation of a Tx device (an LTE smart phone, for example) with
Tx power of 100 mW (20 dBm) from the unit with FCC compliant threshold of 0.1 V/m should be 57
feet.4
19
4 Motorola Whitepaper, “Shielding Effectiveness of In-Home Cable TV Wiring and Splitters” - Figure 1, page 5
CLEARLY BETTER.
AD
VA
NC
ED
TE
CH
NO
LO
GY
Obviously this separation exceeds most room sizes, which is a reason that more stringent
requirements of 0.3 to 1 V/m are currently being discussed in both the United States and Europe.
In the same referenced Motorola Whitepaper, it calculates that for a 1 V/m threshold, the SE should
be around – 100 dB/m5. This value of SE – 100 dB/m was calculated using a minimum QAM signal
level in cable of -12 dBmV and SNR = 27 dB.
Additional data regarding testing of shielding effectiveness of coaxial cable as related to LTE
interference is found in a report from the Netherlands Organization for Applied Scientific Research
commissioned by NL Kable.6 In their study, one of the items investigated was ingress via the
coaxial cable. They tested 5 different cables under various conditions, including one with shielding
effectiveness >90dB up to 950 MHz, one with shielding effectiveness >75dB, and three additional
cables with unknown shielding effectiveness. For all cables, there were scenarios where the
maximum LTE field strength for lossless EuroDOCIS service was less than that of the equivalent
field strength of an LTE user device transmitting @23dBm @3 meters. Conclusions from this
paper were:
20
5 Ibid., Appendix 1, page 176 TNO Information and Communication Technology, author: Jan de Nijs, Co-channel Interference Tests of LTE to Cable EuroDOCSIS Services, 1 October 2010, pages 12-14
Fig. 22
CLEARLY BETTER.
AD
VA
NC
ED
TE
CH
NO
LO
GY
In a second paper by Excentis, commissioned by UPC Broadband7, tests were made on field
strength immunity to many types of devices when exposed to LTE transmitters. Devices included
integrated TV receivers, set top boxes, and cable modems. They concluded that the average field
strength that caused disturbance was 114 dBµV/m (0.5V/m) – which corresponds to the LTE user
equipment transmitting at a level of +23dBm, at a required separation distance of 5 meters to avoid
interference. The worst case device required a separation distance of 24 meters.8
So looking at these three papers, it seems there is good correlation between the various sources as
to the levels and distances that could cause co-channel interference to the home network from LTE
user equipment transmitters.
In an additional report prepared by Joint working group of the European Committee for
Electrotechnical Standardization (CENELEC) and the European Telecommunications Standards
Institute (ETSI) investigating Digital Dividend Issues, data is presented as to the shielding
effectiveness of a large variety of cable and connector types.9 The Executive Summary stated10:
From the perspective of ingress to the cabling, it can be shown that the combination of worst-case
connector and cable will reduce shielding effectiveness by 35dB against the best.
Plot 1 below shows test results displaying signals picked up by the cable, with the lower the signal
representing improved shielding effectiveness.11
21
7 Excentis, Addendum to CEPT Report 159: Technical Considerations On The Protection of Cable Services, December 6, 2011.8 Ibid., page 239 Annex B JWG DD Report v1.1(2011-05) Joint CENELEC-ETSI Working Group (JWG) on Digital Dividend Issues. Compilation of contributions to the JWG and outpus of sub groups of the JWG. Annex B: CPE and Cable Immunity10 Ibid., page 2411 Ibid., page 25
The tests show the following:
1. For the current cable modems and in-home networks, co-channel LTE transmission from a user terminal operating at the proposed maximum output level of 23 dBm strongly degrades the cable EuroDOCSIS service.2. The ingress of the LTE signal takes place via both the cable modem and coaxial cables of an inferior quality connected to the TV connector of the 3 port wall outlet.3. The use of Class A (Kabel Keur) or Class A+ shielded cables reduces the ingress of the LTE signal and the risk of degradation of the EuroDOCSIS service, however, it does not provide enough protection to eliminate the disturbance to the cable services.
CLEARLY BETTER.
AD
VA
NC
ED
TE
CH
NO
LO
GY
22
Plot 4 below shows the complete results of all cables and connectors tested.12 Note the wide
variation of shielding effectiveness, and additionally note that each type of cable and connector
combination has a corresponding frequency response. As such, in order to test for co-channel
interference from an LTE transmitter – this would suggest that in order to ensure a valid result,
any testing would need to be performed at the same frequency as the transmitter. For example, in
Plot 1 above, the best shielding effectiveness for both cables occurs around 600MHz, where at high
frequency the relative worst high frequency shielding effectiveness is around 700-750MHz.
12 Ibid., page 32
CLEARLY BETTER.
AD
VA
NC
ED
TE
CH
NO
LO
GY
23
CLEARLY BETTER.
AD
VA
NC
ED
TE
CH
NO
LO
GY
As a last component of the referenced cable testing, the actual shielding effectiveness was
calculated from the best and worst cases in Plot 1. Graph 1 below shows the results.13
24
Given these references, there is an expectation that there will be occasions where signals generated
by LTE user equipment will enter through weak points in the home network and cause co-channel
interference to content transmitted at LTE frequencies. As such, there will likely be occasions
when the cable technician is required to troubleshoot the location of this weakness and the source
location of the ingress and the deficient shielding. From the references, shielding effectiveness
in the range of -90 to -100 dB/m would seem to be a threshold as to what potentially may
be required. From this perspective, a reasonable question is what sensitivity of leak detector
would be required in order to measure SE in range -90 to -100 dB/m for home certification or
troubleshooting purposes?
13 Ibid., page 35
CLEARLY BETTER.
AD
VA
NC
ED
TE
CH
NO
LO
GY
25
The SE parameter is defined by formula:
SE (dB/m) = Efield (dBV/m) – Ucable (dBV), (11)
where
Efield - is field strength of interfering signal;
Ucable – is voltage detected on cable center conductor.
Actually SE is nothing more than the antenna factor if one considers cable to act like some sort of
antenna. If so, then SE also may defined by known formula for antenna factor AF
AF (dB/m) = SE (dB/m) = 20 log(F(MHz) – 29.7707(dB) - GRx(dBi), (12)
where
GRx – is gain of receiving antenna.
If one uses the above assumption that the gain of the leak source antenna is the same for the Rx
and Tx signals (GLeak= GRx = GTx), then combining formula (7) and (12) the interrelation between SE
and detected leak level E leak at LTE band 750 MHz is defined by the simple formula.