RESEARCH ARTICLE 10.1002/2014GC005467 Quantifying temporal variations in landslide-driven sediment production by reconstructing paleolandscapes using tephrochronology and lidar: Waipaoa River, New Zealand Corina Cerovski-Darriau 1 , Joshua J. Roering 1 , Michael Marden 2 , Alan S. Palmer 3 , and Eric L. Bilderback 4 1 Department of Geological Sciences, University of Oregon, Eugene, Oregon, USA, 2 Landcare Research, Gisborne, New Zealand, 3 Institute of Natural Resources, Massey University, Palmerston North, New Zealand, 4 Geologic Resources Division, National Park Service, Lakewood, Colorado, USA Abstract Hillslope response to climate-driven fluvial incision controls sediment export and relief genera- tion in most mountainous settings. Following the shift to a warmer, wetter climate after the Last Glacial Maximum (LGM) (18 ka), the Waipaoa River (New Zealand) rapidly incised up to 120 meters, leaving perched, low-relief hillslopes unadjusted to that base level fall. In the Mangataikapua—a 16.5 km 2 tributary principally composed of weak melange—pervasive post-LGM landslides responded to >50 m of fluvial inci- sion by sculpting and denuding >99% of the catchment. By reconstructing LGM and younger paleosurfaces from tephra identified by electron microprobe analysis (EMPA) and lidar-derived surface roughness, we esti- mate the volume, timing, and distribution of hillslope destabilization in the Mangataikapua and the relative contribution of landslide-prone terrain to post-LGM landscape evolution. We calculate volume change between four paleosurfaces constrained by tephra age (Rerewhakaaitu, 17.5 ka; Rotoma, 9.4 ka; Whakatane, 5.5 ka; and Waimihia, 3.4 ka). From the paleosurface reconstructions, we calculate the total post-LGM hill- slope sediment contribution from the Mangataikapua catchment to be 0.5 6 0.06 (s.d.) km 3 , which equates to a subcatchment averaged erosion rate of 1.6 mm yr 21 . This is double the previous hillslope volume when normalized by study area, demonstrating that landslide-prone catchments disproportionately contrib- ute to the terrestrial post-LGM sediment budget. Finally, we observe particularly rapid post-Waimihia ero- sion rates, likely impacted by human settlement. 1. Introduction Base level lowering driven by tectonic or climatic processes can cause differential incision in fluvial networks that drives transient hillslope response as slopes adjust to new channel elevations. Base level is controlled regionally by tectonic uplift and sea level fluctuations, and locally by changes in stream power or sediment supply that can promote valley incision or aggradation [e.g., Merritts and Vincent, 1989; Bull, 1991; Schumm, 1993]. The magnitude of base level lowering and the sensitivity of the hillslopes to these changes set the pace of landscape evolution, which is reflected by sediment production and morphologic adjustment [e.g., Whipple and Tucker, 1999; Lave and Burbank, 2004]. Over long (>500 kyr) time periods, tectonic uplift may be balanced by erosion, but over shorter (<100 kyr) periods a multitude of perturbations (e.g., climatic, anthropogenic, seismic, or stochastic) can trigger feedbacks that disturb this balance. For example, over a glacial-interglacial cycle, climatic fluctuations often cause fluvial incision rates that far surpass tectonic rates [e.g., Bull, 1991; Berryman et al., 2000; Pazzaglia and Brandon, 2001; Wegmann and Pazzaglia, 2002; Litchfield and Berryman, 2006; Finnegan et al., 2014], as well as periods of increased sediment production that pro- mote valley aggradation and relief decline [e.g., Whipple et al., 1999]. How landscapes respond to a transient pulse of river incision, especially in regions of active uplift, is key to understanding regional and global sedi- ment budgets [Milliman and Syvitski, 1992; Warrick et al., 2013; Larsen et al., 2014]. In mountainous regions, landsliding is the primary hillslope response to base level change, driving hillslope adjustment by modifying hillslope gradients and conveying sediment to channels and gullies for transport to continental margins [Schmidt and Montgomery, 1995; Hovius et al., 1997; Montgomery and Brandon, 2002; Ouimet et al., 2007; Booth et al., 2013]. However, most landslide studies focus on historic occurrences, using event inventories Key Points: Landforms dated by tephra glass chemistry calibrate a roughness-age relationship Post-LGM surfaces are reconstructed to calculate hillslope erosion through time Hillslopes contribute significantly to the Waipaoa sedimentary system Supporting Information: Readme Figures S1–S5 Tables SI–S4 Supplemental text Correspondence to: C. Cerovski-Darriau, [email protected]Citation: Cerovski-Darriau, C., J. J. Roering, M. Marden, A. S. Palmer, and E. L. Bilderback (2014), Quantifying temporal variations in landslide-driven sediment production by reconstructing paleolandscapes using tephrochronology and lidar: Waipaoa River, New Zealand, Geochem. Geophys. Geosyst., 15, doi:10.1002/ 2014GC005467. Received 23 JUN 2014 Accepted 2 OCT 2014 Accepted article online 8 OCT 2014 CEROVSKI-DARRIAU ET AL. V C 2014. American Geophysical Union. All Rights Reserved. 1 Geochemistry, Geophysics, Geosystems PUBLICATIONS
Transcript
RESEARCH ARTICLE10.1002/2014GC005467
Quantifying temporal variations in landslide-driven sedimentproduction by reconstructing paleolandscapes usingtephrochronology and lidar: Waipaoa River, New ZealandCorina Cerovski-Darriau1, Joshua J. Roering1, Michael Marden2, Alan S. Palmer3,and Eric L. Bilderback4
1Department of Geological Sciences, University of Oregon, Eugene, Oregon, USA, 2Landcare Research, Gisborne,New Zealand, 3Institute of Natural Resources, Massey University, Palmerston North, New Zealand, 4Geologic ResourcesDivision, National Park Service, Lakewood, Colorado, USA
Abstract Hillslope response to climate-driven fluvial incision controls sediment export and relief genera-tion in most mountainous settings. Following the shift to a warmer, wetter climate after the Last GlacialMaximum (LGM) (�18 ka), the Waipaoa River (New Zealand) rapidly incised up to 120 meters, leavingperched, low-relief hillslopes unadjusted to that base level fall. In the Mangataikapua—a 16.5 km2 tributaryprincipally composed of weak m�elange—pervasive post-LGM landslides responded to >50 m of fluvial inci-sion by sculpting and denuding >99% of the catchment. By reconstructing LGM and younger paleosurfacesfrom tephra identified by electron microprobe analysis (EMPA) and lidar-derived surface roughness, we esti-mate the volume, timing, and distribution of hillslope destabilization in the Mangataikapua and the relativecontribution of landslide-prone terrain to post-LGM landscape evolution. We calculate volume changebetween four paleosurfaces constrained by tephra age (Rerewhakaaitu, 17.5 ka; Rotoma, 9.4 ka; Whakatane,5.5 ka; and Waimihia, 3.4 ka). From the paleosurface reconstructions, we calculate the total post-LGM hill-slope sediment contribution from the Mangataikapua catchment to be 0.5 6 0.06 (s.d.) km3, which equatesto a subcatchment averaged erosion rate of �1.6 mm yr21. This is double the previous hillslope volumewhen normalized by study area, demonstrating that landslide-prone catchments disproportionately contrib-ute to the terrestrial post-LGM sediment budget. Finally, we observe particularly rapid post-Waimihia ero-sion rates, likely impacted by human settlement.
1. Introduction
Base level lowering driven by tectonic or climatic processes can cause differential incision in fluvial networksthat drives transient hillslope response as slopes adjust to new channel elevations. Base level is controlledregionally by tectonic uplift and sea level fluctuations, and locally by changes in stream power or sedimentsupply that can promote valley incision or aggradation [e.g., Merritts and Vincent, 1989; Bull, 1991; Schumm,1993]. The magnitude of base level lowering and the sensitivity of the hillslopes to these changes set thepace of landscape evolution, which is reflected by sediment production and morphologic adjustment [e.g.,Whipple and Tucker, 1999; Lav�e and Burbank, 2004]. Over long (>500 kyr) time periods, tectonic uplift maybe balanced by erosion, but over shorter (<100 kyr) periods a multitude of perturbations (e.g., climatic,anthropogenic, seismic, or stochastic) can trigger feedbacks that disturb this balance. For example, over aglacial-interglacial cycle, climatic fluctuations often cause fluvial incision rates that far surpass tectonic rates[e.g., Bull, 1991; Berryman et al., 2000; Pazzaglia and Brandon, 2001; Wegmann and Pazzaglia, 2002; Litchfieldand Berryman, 2006; Finnegan et al., 2014], as well as periods of increased sediment production that pro-mote valley aggradation and relief decline [e.g., Whipple et al., 1999]. How landscapes respond to a transientpulse of river incision, especially in regions of active uplift, is key to understanding regional and global sedi-ment budgets [Milliman and Syvitski, 1992; Warrick et al., 2013; Larsen et al., 2014]. In mountainous regions,landsliding is the primary hillslope response to base level change, driving hillslope adjustment by modifyinghillslope gradients and conveying sediment to channels and gullies for transport to continental margins[Schmidt and Montgomery, 1995; Hovius et al., 1997; Montgomery and Brandon, 2002; Ouimet et al., 2007;Booth et al., 2013]. However, most landslide studies focus on historic occurrences, using event inventories
Key Points:� Landforms dated by tephra glass
chemistry calibrate a roughness-agerelationship� Post-LGM surfaces are reconstructed
to calculate hillslope erosion throughtime� Hillslopes contribute significantly to
the Waipaoa sedimentary system
Supporting Information:� Readme� Figures S1–S5� Tables SI–S4� Supplemental text
Citation:Cerovski-Darriau, C., J. J. Roering,M. Marden, A. S. Palmer, andE. L. Bilderback (2014), Quantifyingtemporal variations in landslide-drivensediment production byreconstructing paleolandscapes usingtephrochronology and lidar: WaipaoaRiver, New Zealand, Geochem.Geophys. Geosyst., 15, doi:10.1002/2014GC005467.
Received 23 JUN 2014
Accepted 2 OCT 2014
Accepted article online 8 OCT 2014
CEROVSKI-DARRIAU ET AL. VC 2014. American Geophysical Union. All Rights Reserved. 1
associated with a single trigger (e.g., storm or earthquake) or regional inventories, which often lack tempo-ral constraints [Guzzetti et al., 2012, and references therein; Larsen and Montgomery, 2012]. More specifically,the progression of landslide-driven hillslope response over glacial-interglacial timescales has not beendocumented in a real landscape [Korup et al., 2010]. In this study, we estimate the extent and timing of hill-slope relaxation and landscape lowering via landsliding in response to >50 m of post-LGM river incision foran entire tributary catchment of the Waipaoa River, New Zealand (referred to hereafter as the Waipaoa).
In the Waipaoa, the fluvial response was almost immediate, seemingly synchronous with the post-LGM cli-mate shift, however perched low-relief hillslopes are still adjusting to that base level fall [Crosby and Whip-ple, 2006; Gomez and Livingston, 2012; Bilderback et al., 2014; Marden et al., 2014]. The fact that some relicthillslopes are blissfully unaware of the fluvial incision supports the idea of a lag period before incision istranslated to the hillslopes. This raises the question: What is the progression of hillslope adjustment? Inother words, how rapidly do hillslopes respond to incision and what is the magnitude of the response? Thelag time between fluvial and hillslope response is a well-known geomorphic concept [e.g., Gasparini et al.,2007; Hurst et al., 2013], however, it is poorly quantified in the field. Once hillslopes start to adjust, the timeit takes to reach a new equilibrium, or even what that equilibrium form will be, is not well known. Therefore,it is difficult to ascertain from a modern landscape the status of hillslope adjustment, despite efforts by pre-vious studies. At our study site, we can begin to address all of these questions by tracking temporal changesin hillslope adjustment following climate-driven fluvial incision using a sequence of four paleosurfacesdefined by tephrochronology.
Previously, the lack of temporal control on erosion rates associated with post-LGM hillslope adjustment pre-cluded us from definitively linking sedimentary records to landscape change. Here reconstructing the evolu-tion of a subcatchment through time gives us the novel opportunity to: (1) measure how rapidly hillslopesrespond to base level change, (2) quantify the progressive volume of sediment removed as the slopesregrade over a postglacial time interval, and (3) characterize how the continental margin records uplandsediment production.
In this study, we use tephrochronology to date landslide activity and calibrate a surface roughness-age rela-tionship derived from airborne lidar topography for an entire tributary catchment of the Waipaoa, referredto as the ‘‘subcatchment’’ or ‘‘Mangataikapua catchment.’’ Using our roughness-age relationship, we canestimate the age of land-surface stability across the entire subcatchment. We then use a sequence of recon-structed paleosurfaces to: (1) demonstrate how this catchment evolved, predominantly via landsliding,since the LGM in response to a climatically driven base-level fall, (2) estimate the volume of sedimenteroded, and (3) quantify how that erosion varies with time. Our results provide critical data needed to quan-tify how climate perturbs a real landscape on millennial timescales and thus imparts predictive capabilitiesin landscape evolution modeling. Most importantly, using our reconstructed paleosurfaces, we can showthat the hillslope erosion rate is not constant through time. Our findings are reinforced by previously stud-ied fluvial and offshore records that broadly corroborate our observed erosion rate trend, despite our studysite being a small, anomalously landslide-prone subcatchment in the Waipaoa Basin.
2. Study Area
The Waipaoa River, located on the East Coast of the North Island (New Zealand), is a rapidly eroding riverthat is highly sensitive to system-wide perturbations—from long-term tectonic uplift, to millennial scale cli-mate fluctuations, to decadal land-use change, to periodic high magnitude storms. The copious amounts oferoded terrestrial sediments are well-preserved in sediment cores dispersed offshore in Poverty Bay, whichmakes the area an ideal system for tracking the ‘‘source-to-sink’’ system over various time scales.
The 2150 km2 Waipaoa Basin extends from the Raukumara Ranges to Poverty Bay (Figure 1a). The Waipaoais rapidly eroding through Cretaceous-Early Miocene marine sedimentary rocks that have been uplifted anddeformed as part of the active fore arc of the Hikurangi Margin (Figure 1b). Our study site, the 16.5 km2
Mangataikapua catchment, is located 45 km upstream of Poverty Bay just below the confluence betweenthe Waipaoa and Mangatu Rivers. The study site is mostly confined to a narrow band of weak Early Creta-ceous m�elange—a highly sheared mudstone in a smectitic matrix associated with the East Coast Alloch-thon. The m�elange in the Mangataikapua catchment, and other similarly weak lithological units throughoutthe Waipaoa, are collectively referred to as ‘‘landslide-terrain,’’ or areas with pervasive earthflows, slumps,
CEROVSKI-DARRIAU ET AL. VC 2014. American Geophysical Union. All Rights Reserved. 2
and gullies. The exception in this subcatchment is the steep, boundary ridgelines that are medium-grained Mio-cene sandstone of Tolaga Group with locally glauconitic sandstone [Mazengarb and Speden, 2000] (Figure 1b).
Subduction of the Hikurangi Plateau—a thick section of the Pacific Plate obliquely subducting beneath thecontinental Australian Plate at �45 mm yr21 [DeMets et al., 1994; Wallace, 2004]—caused broad scaledeformation and rock uplift averaging 0.5–1 mm yr21 over the past 1–2 Myr [Litchfield and Berryman, 2006].Since the late Pleistocene, the Raukumara Ranges (mean elevation 1300 m) have been rapidly uplifting
Taupo
Okataina
TVZ
Waipaoa Basin
a
Hikurangi Plateau
Australian Plate
Pacific Plate
Rock TypesalluviummudsandgravelmudstonelimestonegreensandsandstonemelangeundifferentiatedMangataikapua
Figure 1. (a) The Waipaoa Basin is located on the East Coast of the North Island, New Zealand. The Mangataikapua study site is markedwith the star. The Taupo Volcanic Zone is outlined on the 30 m hillshade, and the Taupo and Okataina Volcanic Centers (TVC and OVC) arehighlighted in green and purple respectively. (b) Geologic map of the Waipaoa Basin with the m�elange band in purple. The Mangataikapuacatchment, located at the star, is 45 km upstream of Poverty Bay. (c) Mangataikapua hillshade (1 m lidar) with tephra sample locations col-ored by identified tephra. Numbers correspond to sample numbers. Larger circles indicate electron microprobe samples, circles with an ‘‘x’’indicate tephra identified in the field.
CEROVSKI-DARRIAU ET AL. VC 2014. American Geophysical Union. All Rights Reserved. 3
(3–4 mm yr21) due to anticlinal folding along therange crest where the Waipaoa headwaters islocated [Litchfield and Berryman, 2006; Gomez andLivingston, 2012]. Uplift rates, determined frompairs of Quaternary fluvial terraces and analysis ofsediment exhumation, decrease sharply by thecentral Waipaoa catchment (0.5–0.9 mm yr21)and at the Mangataikapua catchment approxi-mate the long-term average (�0.7 mm yr21)determined from Late Tertiary mudstone burialdepths [Berryman et al., 2000; Litchfield and Berry-man, 2006]. However, since the end of the LastGlacial Maximum (LGM)�18 ka, river incision hasfar outpaced tectonically driven uplift such thatclimate appears to dictate the pace of transientperiods of incision and erosion over glacial-interglacial cycles [Berryman et al., 2000; Litchfieldand Berryman, 2006; Marden et al., 2014].
Tectonically driven and climatically exacerbatedbase level change, following the shift to a warmer, wetter climate after the Last Glacial Maximum (LGM)(�18 ka), caused the Waipaoa River to rapidly incise and regrade [Gage and Black, 1979; Berryman et al.,2000; Marden et al., 2008; Gomez and Livingston, 2012]. Well-preserved fluvial cut and strath terracesthroughout the Waipaoa Basin record the history of degradation. A thick (2–30 m) LGM gravel fill terrace(W1) is capped by 17.5 ka Rerewhakaaitu tephra, indicating the terrace was abandoned around the end ofthe last glacial cycle [Eden et al., 2001; Litchfield and Berryman, 2005; Marden et al., 2008, 2014]. Therefore,fluvial downcutting began within 1 kyr of the climate shift, but the most rapid incision occurred throughvalley fill between 9.4 and 14.0 ka [Marden et al., 2014]—which closely correlates with the accumulation ofgravel in Poverty Bay 9–11 ka [Brown, 1995; Berryman et al., 2000]. Following the removal of the valley fill,the river began to incise into bedrock. Terraces in the headwater reaches of the Waipaoa River record up to120 m of post-LGM incision, and approximately 55 m of incision at the junction with the Mangataikapua. Inthe late Holocene, the Waipaoa was likely a boulder-armored bedrock river, until the arrival of the Europeansettlers [Berryman et al., 2000]. Now the modern Waipaoa is a braided alluvial river system at the junctionwith the Mangataikapua, transitioning to a meandering gravel-bedded river downstream with an averagesuspended sediment load of 15 Mt yr21, or a sediment yield of 6800 t km22 yr21 [Hicks et al., 2000].
The Waipaoa is 100–200 km downwind of the Taupo and Okataina Volcanic Centers in the Taupo VolcanicZone (TVZ) (Figure 1a). The TVZ is one of the most active rhyolitic eruption centers since the late Pleistocene[Smith et al., 2005]. Tephra frequently mantles the landscape immediately following eruption with 5–20 cmdeposits, and a multitude of studies have analyzed and characterized these deposits [e.g., Froggatt andLowe, 1990; Eden et al., 2001; Shane et al., 2003; Smith et al., 2005; Lowe et al., 2013]. In the Waipaoa, thereare 15–20 eruptions spanning from 55 to 0.636 ka with an average recurrence interval of approximately 2kyr (Table 1), which have been used to date terraces and landslides throughout the region [e.g., Berrymanet al., 2000; Litchfield and Berryman, 2005; Marden et al., 2014; Bilderback et al., 2014.].
During the LGM, the Waipaoa was a subalpine environment with sparse vegetation and sediment suppliedmainly by periglacial processes [Gage and Black, 1979; McGlone, 2001]. Periglacial sediment supply far out-paced sediment transport capacity in the channels, causing fill terraces to form [Berryman et al., 2000; Litchfieldand Berryman, 2005]. The interglacial climate is marked by increased precipitation and mean annual tempera-ture, and decreased seasonality [Gomez et al., 2004]. The current Waipaoa climate is highly dependent on theEl Nino-Southern Oscillation cycle (established�4 ka) [Gomez et al., 2004], with mean annual rainfall of�1500 mm. The shift to warmer, wetter conditions promoted the establishment of a podocarp forest andincreased river discharge thereby reducing sediment transport from the hillslopes and increasing fluvial trans-port capacity enough to mobilize accumulated gravels [McGlone, 2001; Litchfield and Berryman, 2005, 2006].This combination of feedbacks accelerated river incision, which in turn steepened lower slopes while leavingmany ‘‘relict’’ upper slopes perched above the river.
Table 1. Major TVZ Eruptions Present in the Waipaoa Basin
aBold type indicates tephra sampled in the Mangataikapua catch-ment [e.g., Gage and Black,1979; Berryman et al.,2000; Eden et al.,2001; Smith et al., 2005; Lowe et al., 2008; Marden et al., 2008].
bAge model reported in Lowe et al. [2013].cAge model reported in Smith et al. [2005].
CEROVSKI-DARRIAU ET AL. VC 2014. American Geophysical Union. All Rights Reserved. 4
Europeans began settling in the Poverty Bay region approximately 200 years ago, preceded by the Maoripeople 600–800 years ago [Wilmshurst et al., 1999]. The Maori populated mostly coastal areas, whereas theEuropeans quickly migrated to the uplands and converted �90% of the native podocarp forests to pasture-land using repeated slash-and-burn techniques [Gage and Black, 1979; Wilmshurst et al., 1999]. This land-usechange increased hillslope erosion, leading to modern aggradation in the channel. The Mangataikapua iscurrently �80% pastureland and �20% pinus radiata; the latter planted in a NZ government-led effort dur-ing the mid-20th century to reforest parts of the Waipaoa. Additionally, local areas of poplar and willow areplanted in the Mangataikapua in attempt to slow the most egregious erosion.
The effects of post-LGM fluvial incision and vegetation change, as well as recent deforestation, promotedhillslope adjustment via landsliding that continues today. In the Waipaoa today, we observe a spectrum oflandslide styles as follows: (1) shallow, soil-dominated landslips that fail catastrophically in response to highintensity rainfall, (2) slow moving, shallow to deep, earthflows that activate seasonally due to wetting anddrying of clay-rich material, but persist for decades to millennia, and (3) deep translational or rotationalslumps that fail incrementally to catastrophically due to debuttressing at the toe. Collectively these threelandslide styles, and the extensive gully systems developed on them, are the dominant hillslope sedimentproduction and transport mechanisms active since the post-LGM climate shift [Gage and Black, 1979; Mar-den et al., 2005, 2008, 2014; Page and Lukovic, 2011; Bilderback et al., 2014]. We assume all three styles werepresent in some combination in the past, and we use the generalized term ‘‘landslide’’ to refer to all threecollectively when we cannot definitively differentiate between the mass movement styles.
3. Tephrochronology
In order to quantify how landslide activity varies over time, and therefore the rate and volume of hillslopeerosion, we first need a way to determine the age of relict surfaces. To do so, we collect tephra samplesfrom various ridges throughout the Mangataikapua, analyze the glass chemistry, and compare the signatureto previously published geochemical and geochronological data sets. From these data sets, we identify thevolcanic event and, therefore, age of the sample. Given that surface roughness tends to decrease with agedue to diffusive processes (e.g., soil creep), we can relate those ages to a lidar-derived topographic rough-ness index, which enables us to define an empirical relationship between the surface roughness and age.Using this relationship, we classify the entire landscape by tephra age in order to reconstruct a sequence ofpaleosurfaces and thus calculate erosion rates through time.
3.1. MethodsThe Mangataikapua catchment is blanketed with a distinctive tephra layer from the well-characterizedTaupo Volcanic Zone (TVZ) every �2 kyr since the LGM (Table 1). In the absence of sufficient in situ quartzor carbon for radiometric dating (e.g., cosmogenic, luminescence, or radiocarbon), this plentiful tephrarecord makes tephrochronology an accessible and inexpensive means to constrain landscape age at arange of spatial scales. For each TVZ eruption that reached the Mangataikapua, we assume that the tephra:(1) is deposited across the landscape, (2) can be uniquely identified, (3) is sequentially deposited, and (4)accumulates with time until removed by slope failure [Preston and Crozier, 1999]. Thus, the age assigned tothe basal tephra will correspond to the timing of the first eruption since that location was last disturbed bylandsliding, or duration since stabilization [Lang et al., 1999], as was successfully demonstrated in neighbor-ing subcatchments [Bilderback et al., 2014]. Therefore, using the techniques outlined in Bilderback et al.[2014], we can constrain the date of ridgeline stabilization to within �2 kyr. To do this, we excavated 128soil pits along ridges with various length scales from the Mangataikapua outlet to the headwaters (Figure1c) and collected tephra samples in 5–10 cm increments from different soil horizons, focusing on the basaltephra in contact with bedrock.
To identify each tephra sample, we used the major-element glass chemistry determined from electronmicroprobe analysis (EMPA). Tephra from the TVZ have distinctive chemical signatures [Lowe et al., 2008 andreferences therein], but are difficult to differentiate in the field (with a few exceptions discussed below), there-fore we relied on the glass composition to correlate our samples with known tephra. Tephra samples wereseparated from the surrounding soil material, cleaned in an 11% solution of sodium hexametaphosphate, andrinsed through a 63 mm sieve with the coarse fraction retained for analysis. The tephra was embedded inepoxy resin and polished for EMPA. We analyzed 39 basal tephra samples on the University of Oregon
CEROVSKI-DARRIAU ET AL. VC 2014. American Geophysical Union. All Rights Reserved. 5
CAMECA SX-100 microprobe using 15 kV accelerating voltage, 10 nA beam current (Na, Si, K, Al, and Fe), 50nA beam current (Mg, Ca, Mn, and Ti), and variable count times to maximize detection limits and minimizeanalytical errors. For each sample, 12 unique glass shards were analyzed (n512). Detection limits at a 99%confidence interval are <0.008 wt % for all elements except Ti (<0.02%), giving average % analytical errors(61 s.d.) of Si 60.04%, K 60.1%, Al 60.4%, Na 60.5%, Ca 61%, Mg 63%, Fe 63%, Mn 610%, Ti 620%.Results were run with glass standards and known TVZ tephra as controls. Analytical totals for individual shardcompositions were typically 96–98% with remaining mass attributed to secondary hydration; therefore allanalyses are normalized to 100% to aid comparison with published data (supporting information Table S1).
The most common way to differentiate tephra units is to compare the abundance of major oxides betweenglass samples. For the TVZ, bulk glass chemistry allows easy identification of the source volcanic center fortephra <30 kyr old [Smith et al., 2005]. Individual eruptions can be further differentiated using binary plots ofdiagnostic oxide pairs [Smith et al., 2005; Lowe et al., 2008] (Figure 2a). Most frequently K2O versus CaO isused, but we found that FeO, MgO, MnO, and TiO2 also help distinguish between compositionally similareruptions (supporting information Figure S1). The spread of the data can also be diagnostic, as some erup-tions had multiple phases (e.g., Whakatane) or bimodal compositions (e.g., Rerewhakaaitu), although this canalso result in overlapping compositions (e.g., Whakatane/Rotoma, Kawakawa/Omataroa, Taupo/Opepe) (Fig-ure 2a). To distinguish between two compositionally similar tephra, we used sample depth. We found age toincrease linearly with depth (slope50.048)—similar to the trend (slope50.056) found by Bilderback et al.[2014] (Figure 2b)—allowing for differentiation between overlapping compositions with disparate ages.
We initially identified unique tephra samples by grouping similar compositions using a combination ofoxide biplots (Figure 2a) and cluster analysis. Then, we compared similar compositions to a compilation ofknown TVZ tephra compositions (435 total samples) using discriminant function analysis (DFA). DFA is awidely used statistical method for grouping collections of unknown and known data, including tephra, how-ever it is highly dependent on the quality of the reference data used to develop the comparison model[e.g., Lowe, 2011, and references therein]. To improve the comparison model and to simplify our analysis,we first separated the tephra by source volcano, and then determined the most likely eruption based onsource (Table 1). Using DFA, the TVZ volcanic source—Taupo Volcanic Center (TVC) or Okataina VolcanicCenter (OVC) (Figure 1a)—can be determined with 97% accuracy based on the accuracy of the referencedata set (ntotal5435, nmiss513) (supporting information Table S3). After separating our data according tosource, TVC eruptions can be predicted with 94% accuracy (ntotal5128, nmiss58) and OVC eruptions with60% accuracy (ntotal5307, nmiss5122) (supporting information Table S3). Errors likely arise due to variationin the EMPA analytical precision, heterogeneity within OVC-sourced samples (e.g., OVC more often producesmultiphase and bimodal eruptions), and possibly even misidentified control samples [Lowe et al., 2008]. Thetephra identification accuracy, particularly for OVC tephra, was improved by using the depth-age relation-ship and checking the composition against OVC glass oxide biplots. If we could not confidently identify theoldest tephra, we analyzed the overlaying tephra or reprobed the initial sample.
Due to the wide sampling interval (5–10 cm), as well as in situ mixing, many samples contain shards ofyounger tephra. In six cases, only a single shard of an older tephra was identified, and was thus discarded infavor of the next oldest tephra (supporting information Table S1). For an additional 69 unanalyzed soil pits,we were able to assign ages of Waimihia (3.4 ka), Taupo (1.7 ka), or Modern (<0.6 ka) based on field observa-tions alone (supporting information Table S2). Waimihia tephra deposits as a distinctive thick lapilli layerresembling coarse sugar dominating the soil matrix below 10 cm, and Taupo has obvious pumice clasts (2–7 mm) that make up �10–20% of the A horizon. If no pumice was visible in the A horizon, the pit wasassumed to have no tephra.
3.2. ResultsRecent (Kaharoa, 0.6 ka) to very old (pre-Rerewhakaaitu, >17.5 ka) tephra is preserved in the Mangataikapua(Figures 1c and 2a; Table 1), but 80% of the probed samples are from 4 tephra units: Taupo (1.7 ka), Waimi-hia (3.4 ka), Whakatane (5.5 ka), and Rotoma (9.4 ka) (supporting information Table S1). We used thesefour most sampled tephra units to define our landscape reconstruction intervals: LGM-Rotoma, Rotoma-Whakatane, Whakatane-Waimihia, and Waimihia-Modern. Conveniently, these breaks are similar to thoseused by other Waipaoa studies [e.g., Bilderback, 2012; Bilderback et al., 2014; Leithold et al., 2013; Marden et al.,2014], allowing for comparison of processes and events. Lastly, we could not confidently distinguish between
CEROVSKI-DARRIAU ET AL. VC 2014. American Geophysical Union. All Rights Reserved. 6
the oldest two tephras, Omataroa (32.8 ka) and Kawakawa (25.4 ka), due to ambiguity in the glass chemistryand control tephra. The oldest tephra in the study area was likely Omataroa, but because pre-Rerewhakaaituages are less relevant for our landscape reconstructions, we grouped all tephra older than Rerewhakaaitu intoone group referred to as ‘‘LGM.’’
Average Roughness(15 m smoothing)
1
1.01
1.02
1.03
1.04
1.05
1.06
1.07
0 2 4 6 8 10 12Age (ky)
c
Age (ky)
y=0.056xr2=0.95
This studyBilderback et al. [2014]
2.0
1.5
1.0
0.5
00 5 10 15 20 25 30 35
b
Tp 15
33
14
261
29
30
1310 Op539
39a
Om
Re
Re
Re
20
3516
367
11
3238
17
Ro
Ro
Ro
6818
4
37
31Wk
Wk
Wk
19
923
2712
22
25
34
3
Wm
Kh
24
EMPA Results Lowe et al. [2008]
4.0
3.5
3.0
0.4 0.6 0.8 1.0 1.2 1.4 1.6CaO (wt %)
a
Kh
Dep
th (m
)
y=0.048xr2=0.98
Rou
hnes
s
y=-0.0037x+1.0557r2=0.8568
K2O
(wt %
)
Figure 2. (a) Example binary plot of tephra composition comparing K2O versus CaO for all probed samples. Circles represent resultingcompositions from microprobe analysis, and crosses represent control sample composition from Lowe et al. [2008] (Kh5Kaharoa,Om5Omataroa, Op5Opepe, Re5Rerewhakaaitu, Ro5Rotoma, Tp5Taupo, Wm5Waimihia, Wk5Whakatane). Sample numbers correspondto sample locations (Figure 1c). Full major oxide composition of all probed samples is included in the Table S1 (supporting information).(b) Depth-age relationship for Mangataikapua samples (black circles) binned by tephra age compared to approximate depth-age relation-ship determined by Bilderback et al. [2014] (gray diamonds). (c) Linear fit of mean roughness for binned samples of Rotoma, Whakatane,Waimihia, Taupo, and no tephra (with 15 m smoothing). Characteristic roughness for each time step was determined from the linear fit.
CEROVSKI-DARRIAU ET AL. VC 2014. American Geophysical Union. All Rights Reserved. 7
Using the combination of methods discussed above, the possibility of misidentifying recent tephra is low.Regardless, there are four samples identified as Opepe (10.0 ka) that are likely younger (Figure 2a) and sixsamples identified as a younger tephra (i.e. with n51) that are likely older. However, even if all questionablesamples are misidentified, the probability of falsely identifying samples as older is only 10% (ntotal539,nyounger54) and falsely identifying samples as younger is 15% (ntotal539, nolder56). Therefore, the potentialmisidentification of these few samples does not significantly affect our subcatchment analysis.
4. Roughness Calculations
Surface roughness is a measure of surface texture variability, and can be used to infer age of active processes,e.g., fault scarps [Avouac, 1993], landslides [McKean and Roering, 2004], and alluvial fans [Frankel and Dolan,2007]. Sharp features in the landscape tend to become more diffuse with time such that recent surface distur-bances will produce more variability in surface texture. For example, our lidar data reveal a clear distinctionbetween the smooth, relatively undisturbed morphology in the headwaters that is being progressivelysmoothed with each tephra fall and the rough, rumpled texture of the actively eroding, landslide-dominatedterrain further downstream (Figure 1). By quantifying the roughness from a DEM, and using it as a proxy for sur-face age, we can then extrapolate our tephra-derived surface ages across the entire Mangataikapua catchment.
4.1. MethodsWe calibrated a surface roughness model using the ages determined from our sampled basal tephra. Sur-face roughness was calculated by applying Jenness DEM Surface Tools (www.jennessent.com) to the 1 mlidar DEM. The Jenness model computes the ratio of a fitted surface area to a plane over a 3x3 pixel win-dow. The resulting surface roughness values approach 1 for smooth areas and increase with increasingroughness, often not exceeding 2–3 [Jenness, 2004]. To account for local variations due to roads, ponds,recent failures, etc., we calculated the roughness value at each node as the average roughness over a 15 mradius (see supporting information Table S1). We binned pits by age and fit a line to the average roughnessfor each post-LGM bin, excluding the Opepe points due to the ambiguity discussed above (Figure 2c).
4.2. ResultsThe final smoothed roughness map shows that over 70% of the landscape is younger than Kaharoa (0.6 ka),whereas less than 1% is older than LGM (Table 2); confirming that our study area is a very actively erodinglandscape. The smoothed roughness map (Figure 3) captures the distinction between the older headwaters(mainly blue and yellow), main ridgelines (mainly yellow), and recently active earthflows (pink to no color),and can be used to create tie-points for paleosurface reconstruction through time.
We tested various roughness-age fit functions by iteratively comparing to our tephra data to the predictedages using different scales of spatial averaging. We smoothed the original roughness data over 3, 10, 15,20 m windows to estimate average roughness, filtered by high curvature values to eliminate active earth-flows (Figure 3a), and then compared the predicted roughness age for each pit to the actual tephra age. Wefound that a 15 m smoothing window and a linear fit was the best predictor of the roughness-age relation-ship (local success rate585%), despite the linear regression having a lower r2 value than when we used apower law (see supporting information Figure S3). Thus, we used the linear fit with the smoothed rough-ness data to generate the roughness distribution for the four time steptime steps. If we included the poten-tially misidentified Opepe points, our results were unaffected; therefore it is reasonable to assume that a10–15% tephra misidentification rate does not significantly affect the roughness-age relationship. For the15% of pits incorrectly predicted by the linear fit, 67% of those ages are underestimates. Therefore, overallthere is only a 10% probability of inflating the volume due to underestimating the age.
5. Reconstruction of Paleosurfaces
Paleosurfaces serve as a reference datum from which subsequent elevation change can be calculated [e.g.,Clark et al., 2006], which is useful for quantifying rates of landscape evolution and volume of sedimenteroded through time. In order to reconstruct the post-LGM progression of the Mangataikapua landscape,we first approximated the paleochannel profile for each of the four time steps, and then combined the pale-ochannels with the corresponding paleoridge network and the modern catchment boundary derived fromlidar analysis to generate a sequence of interpolated paleosurfaces.
5.1. MethodsGiven the absence of preserved terraces along the Mangataikapua stream, likely owing to intense landslideactivity, paleochannel profiles were calculated by fitting a theoretical longitudinal profile from the head-waters to the corresponding terrace elevation along the mainstem Waipaoa at the Mangataikapua outlet.The paleochannel profile for each of the four time steps was calculated using the equations [Whipple andTucker, 1999]:
Figure 3. (a) Final roughness map for the Mangataikapua catchment overlain on 1m lidar hillshade. Colors correspond to tephra age andvalues correspond to bins established from the linear fit (Figure 2c). Original sample locations from Figure 1c are included for verificationof roughness-age approximation. (b) Inset of the relict Mangataikapua headwaters where the land surface is predicted to be Rotoma orolder (yellow-blue). (c) Inset of a tributary in the upper watershed where much of the land surface is active earthflows with no tephra pre-served (no color) separated by young interfluves (red-pink).
CEROVSKI-DARRIAU ET AL. VC 2014. American Geophysical Union. All Rights Reserved. 9
z�ðx�Þ5z0i 1Ci 12hm
n
� �21
12x12hm
n�� �
(1)
z�5z=H (2)
x�5x=L (3)
where z* is the elevation normalized forchannel relief (H), x* is the positiondownstream normalized for channellength (L), z0 is the elevation of the Wai-paoa terrace at each time step, h is amodified Hack’s constant, m
n is concavity,and C is the uplift/erosion rate coeffi-
cient for each time steptime step. A simplified valley axis profile, to eliminate sinuosity in the plan-viewchannel form, was used for L. For h, we used Hack’s relationship to calculate a specific value for the Manga-taikapua (see supporting information), and found h51.4–1.6. The best fit model for the channel profilesrequires h51.6 and m
n50.4, similar to previously established values of 1.55 and 0.55 respectively for theentire Waipaoa Basin [Whipple and Tucker, 2002; Crosby and Whipple, 2006], and a linearly decreasing con-stant for each time steptime step (CLGM51.07, CRo51.04, CWk51.02, CWm51.01) (Figure 4a) (Table 2). In allWaipaoa tributaries, the concavity of the LGM terrace is similar to Holocene-aged terraces [Marden et al.,2014], thus we assume a constant m
n for each paleochannels.
The LGM terrace elevation was taken from the GPS surveyed W1 terrace, the last aggradational terracebefore post-LGM downcutting, located at Whatatutu township near the confluence of the Mangataikapuaand the Waipaoa Rivers. In the absence of lower Holocene-aged terrace remnants preserved here, subse-quent elevations for the Rotoma, Whakatane, and Waimihia terraces (Table 2) were calculated using the flu-vial incision rates reported in Marden et al. [2014] and are within 5 m of terrace heights at Whatatutu[Marden et al., 2014]. The Mangataikapua headwater elevation was allowed to vary slightly (<20 m) toaccount for incision of �1 mm yr21, which equals the estimated background uplift rate.
We created a network of the major paleoridges by delineating adjacent areas with no drainage area fromthe modern lidar, then we overlaid this network on the surface roughness map, and assigned ages to eachridgeline segment based on the modal surface roughness within a 15 m buffer—average ridge crestwidth—for each segment (Figure 4c). The surface roughness of each ridge segment corresponds to an agebased on the roughness-age relationship (Figure 2c). Using the modal value eliminates the meter-scale var-iations in topography, captures the distribution of ridge ages, and creates linear segments of the same agethat represent ridgelines of a given age. We used only the corresponding ridges for each time step to definethe four paleosurfaces. However, because there were insufficient ridgelines of LGM age to constrain the sur-face for that interval, we used outlines of the LGM roughness surfaces (dark blue in Figure 3b) to define theLGM paleosurface and added ‘‘ghost’’ points 8 m above the modern surface in 5 poorly fit locations down-stream, which is equivalent to a conservative �0.4 mm yr21 of erosion, in order to minimize erroneouslypredicted areas of aggradation between paleosurfaces.
The modern catchment boundary was used for all paleosurface reconstructions. This is a valid assumptionbecause this divide is predominantly Rotoma (9.4 ka) or older, and we have no constraints on the elevationor position pre-Rotoma stabilization. Therefore, we assume the paleosurface boundary was at least as highas the modern elevation, and our volume calculations are a minimum for the oldest (LGM-Rotoma) timeinterval. We used a stiff, 1-D spline curve to smooth the modern catchment boundary to minimize introduc-tion of spurious ridges and valleys to the paleosurfaces (Figure 4b).
The smoothed catchment boundary, ridge segments, and paleochannel were combined for each of the fourtime steps and used as tie points for interpolation. We fit a paleosurface to the points using MATLAB’s cubicspline interpolation (supporting information Figure S5). The modern 1 m lidar DEM (flown in 2010) wasthen subtracted from each fitted paleosurface to get a total elevation change—which is equal to volumechange—for each time interval (Table 3). The elevation difference between each subsequent paleosurface(i.e. LGM and Rotoma) was calculated to estimate relative volume change and compared to the volume
Table 2. Paleochannel Reconstruction Parameters and Paleosurface Slopes
CEROVSKI-DARRIAU ET AL. VC 2014. American Geophysical Union. All Rights Reserved. 10
difference calculated by cumulatively subtracting each interval’s elevation change from the modern surfaceto test for internal consistency (Table 3).
5.2. ResultsWe found the volume difference between the LGM-reconstructed surface and modern DEM to be approximately0.5 6 0.06 (s.d.) km3 (Figure 5 and Table 3). Of that total volume, 60% of the erosion occurred between LGM(>17.5 ka) and Rotoma (9.4 ka) (0.3 6 0.05 (s.d.) km3) (Figure 5a and Table 3). The residual topography highlightslocalized areas of rapid erosion between the LGM and Rotoma paleosurfaces (green area in Figure 5a). This result
0 2000 4000 6000 8000 10000Distance From Mouth (m)
Ele
vatio
n (m
)
Ele
vatio
n (m
)
a
Figure 4. Inputs used for surface reconstruction. (a) Four paleochannel longitudinal profiles, calculated using a concavity, mn , of 0.4 and a fixed out-
put based on surveyed or calculated paleo-terrace elevations. The modern channel profile (black) is dashed where the channel bed is buried by arecent landslide deposit. (b) Boundary elevation for the Mangataikapua watershed (thick grey line) fitted with a stiff, 1-D spline (thin blue line).Spline fit elevations are used as an approximate boundary elevation for each paleosurface. (c) The ridgeline network for the Mangataikapua coloredby age as determined by the roughness-age relationship established in Figure 2c. Relict LGM surfaces in the headwaters are represented by points.
CEROVSKI-DARRIAU ET AL. VC 2014. American Geophysical Union. All Rights Reserved. 11
confirms a phase of widespread slump-ing or deep-seated earthflows that weobserve in the field and is describedelsewhere in the Waipaoa [e.g., Gageand Black, 1979; Marden et al., 2014; Bil-derback et al., 2014]; and although themodeled surface does not likely corre-spond with the exact location ofslumps, it does reflect the representa-tive volume change. The subsequentintervals show small volume changes,corresponding to only 0.08 6 0.02(s.d.) km3 and 0.02 6 0.01 (s.d.) km3 forthe Rotoma-Whakatane andWhakatane-Waimihia intervals respec-tively (Figures 5b and 5c). For themost recent interval, Waimihia-Modern, volume change increased to0.12 6 0.03 (s.d.) km3 and is moreevenly distributed across the land-scape. In the residual topography mapfor each time interval, some localesare misrepresented as aggradational(purple areas in Figure 5). For example,a recent large landslide that traversesthe upper Mangataikapua stream (Fig-ure 4a) accounts for much of theaggradational bias in the headwaters.However, the total aggradational areaonly represents 5–10% of the terrain,
thus the influence on volume differences is negligible, and we calculated the aggradational nodes as null values.For each interval, we converted volume to erosion rates and found the rates decrease from 2.3 6 0.4 (s.d.) mmyr21 (LGM-Rotoma), to 1.2 6 0.4 (s.d.) mm yr21 (Rotoma-Whakatane), to 0.7 6 0.3 (s.d.) mm yr21 (Whakatane-Waimihia), and then increase to 2.2 6 0.6 (s.d.) mm yr21 (Waimihia-Modern) (Figure 6 and Table 3).
To confirm the robustness of our results, we tested various combinations of relict tie points and fitting surfaces,and used the variation between reasonable combinations to calculate the standard deviation and error for thevolumes and erosion rates. This variability is based on the difference between combinations that cover the max-imum, minimum, and most likely paleolandscape elevations, and therefore span all possible end members foreach paleolandscape reconstruction (see supporting information for more details). The standard deviation foreach estimated volume change is 10–40% (Table 3). We found a similar magnitude error exists for the volumedifference calculated for each time interval (20–40%)—again based on the variability between trials (supportinginformation Table S4)—with the greatest uncertainties for the two slowest eroding time intervals (Table 3). Mostimportantly, we found much of the error derives from the topographic subtraction (up to 40%), which overshad-ows the smaller errors in tephra misidentification (10–15%) and the roughness-age relationship (10%).
6. Discussion
6.1. Volume of Terrestrial Sediment Eroded Post-LGMPrevious studies in the Waipaoa have focused on post-LGM fluvial incision, which is a significant sedimentsource along the mainstem of the Waipaoa and major tributaries characterized by wide valleys with sub-stantial sediment storage [Marden et al., 2008, 2014]. However, we demonstrate that hillslopes are also sig-nificant contributors of sediment, especially in subcatchments like the Mangataikapua, with narrow valleysand thus minimal valley storage. Previously, landslide volume-area scaling relationships developed for theupper Waipaoa and extrapolated for the entire basin—based on lidar, air photo, and field investigations[Page and Lukovic, 2011; Bilderback, 2012]—found the total volume of sediment generated by just by
CEROVSKI-DARRIAU ET AL. VC 2014. American Geophysical Union. All Rights Reserved. 12
landslides above the LGM (W1) terrace is roughly comparable to that of fluvial incision below the W1[Mar-den et al., 2008, 2014]; indicating that including solely landslides will roughly double the terrestrial contribu-tion. At our study site, we found nearly 30 m of post-LGM catchment-averaged lowering. To put our resultsinto context, Marden et al. [2014] estimated that fluvial incision and valley excavation accounts for 14.1 km3
of the post-LGM terrestrial sediment [Marden et al., 2014], equating to an average post-LGM lowering of6 m for the entire Waipaoa basin. So by comparison, we found a 400% increase in the terrestrial sedimentproduction volume normalized by study area, quantitatively demonstrating that hillslopes are indeed a sig-nificant terrestrial sediment source in the overall post-LGM sediment budget.
Although the Mangataikapua is a single small subcatchment in an area of anomalously weak landslide-dominated terrain, it is a relevant contributor to the overall Waipaoa sediment budget. The average post-LGM erosion rate for the Mangataikapua (1.6 mm yr21) (Table 3) is double the previous catchment-averaged denudation rate for the entire Waipaoa (0.8 mm yr21) [Bilderback, 2012], implying these small
Figure 5. Elevation difference between: (a) LGM (>17.5 ka) and Rotoma (9.4 ka) paleosurfaces, (b) Rotoma (9.4 ka) and Whakatane (5.5 ka) paleosurfaces, (c) Whakatane (5.5 ka) and Waimihia(3.4 ka) paleosurfaces, and (d) Waimihia (3.4 ka) paleosurface and 2010 lidar DEM. Green is the greatest net positive change, yellow is minimal change, and purple is net negative change. Nega-tive change occurs in areas of surface misfit that are falsely represented as aggradation. See text for discussion. The elevation difference corresponds to the volume change for this 1 m DEM.
CEROVSKI-DARRIAU ET AL. VC 2014. American Geophysical Union. All Rights Reserved. 13
areas of weaker rock are particularly prolific sources of sediment. Assuming all the m�elange areas (Figure1b) erode at similar rates to the Mangataikapua, then the 1.4% of the Waipaoa Basin composed of this weaklithology contributes nearly 1 km3, or �10%, of the terrestrial sediment transferred to the offshoredepocenter.
6.2. Timing of Hillslope ResponseHillslope response to the glacial-interglacial climate shift can be conceptualized, based on our analysis, asfour main phases: (1) hillslope indifference, (2) initial destabilization, (3) slope stabilization, and (4) reinvigo-rated landsliding.
The initial, fluvial-only, phase lasted a couple thousand years and occurred contemporaneously throughoutmost of the Waipaoa basin [Crosby and Whipple, 2006; Gomez and Livingston, 2012; Bilderback et al., 2014;Marden et al., 2014]. Speleothem, marine, and pollen records [Wright et al., 1995; McGlone, 2001; Williamset al., 2005, 2010] indicate the transition to a warmer, wetter climate occurred by 18.2 ka. Soon after, theWaipaoa River switched from aggradation to degradation, marked by the abandonment of the W1 terracecapped by Rerewhakaaitu tephra (17.5 ka). During this phase most hillslopes remained insulated from thisclimate shift until the post-LGM podocarp forest was established 11.5–15.5 ka [McGlone, 2001], accountingfor the lag time between the fluvial-only and hillslope-coupled response to base level fall. The vegetationlikely slowed diffusive hillslope transport and allowed channels to significantly undercut and debuttress hill-slopes [Bilderback et al., 2014], which corresponds with the end of phase one. The second phase is markedby widespread hillslope adjustment via landsliding. The timing of slope destabilization is constrained by theabsence of Waiohau (14.0 ka) and preservation of Rotoma (9.4 ka) tephra in the Mangataikapua, which iscontemporaneous with other Waipaoa subcatchments [Bilderback et al., 2014]. Bilderback et al. [2014] foundno tephra older than Rotoma in any augered landslides, and we found no evidence of Waiohau tephra inthe study area, while Rotoma tephra capped most main ridgelines in the subcatchment (Figure 3); evidenceof a prolific initial phase of hillslope destabilization beginning after 14.0 ka and ending by 9.4 ka. Duringthis phase, increased fluvial incision debuttressed slopes and caused widespread destabilization [Black,
Wk-Wm
Wm-Mod
0 2 4 6 8 10 12Time (ky)
14 16 18
3.0
0
0.5
1.0
1.5
2.0
2.5
Eros
ion
Rat
e (m
m y
r–1)
LGM-Ro
Ro-Wk
Figure 6. Average erosion rates (6 1 s.d.) calculated for each time interval (Mod5Modern, Wm5Waimihia, Wk5Whakatane, Ro5Rotoma,LGM5Last Glacial Maximum).
CEROVSKI-DARRIAU ET AL. VC 2014. American Geophysical Union. All Rights Reserved. 14
1980; Marden et al., 2005; Gomez and Livingston, 2012; Bilderback et al., 2014]. By contrast, elsewhere in theWaipaoa hillslopes grade to the uneroded terraces buttressing their base, indicating the importance of flu-vial incision in modulating slope response [Black, 1980; Marden et al., 2008; Bilderback et al., 2014]. In theMangataikapua, large arcuate headscarps along the catchment boundaries (e.g., scarps �1 km due north oftephra sample 8 and between samples 20 and 22 in Figures 1c and 3a) and down-dropped benches fromRotoma-covered ridgelines (e.g., tephra sample 32 (and underlying) in Figures 1c and 3a) are evidence ofdeep-seated slumps and rotational slides during this phase. Following the second phase, erosion ratesslowed dramatically (Figure 6). We argue that slower erosion rates during this third phase reflect earthflowsthat slowed or stopped prior to the Waimihia eruption, as evident from minimal erosion during theWhakatane-Waimihia interval (3.4–5.5 ka) and preservation of abundant Waimihia tephra on interfluves ofolder earthflow material between active, modern earthflows in the Mangataikapua, and inactive earthflows(�100s of years old) below indigenous forest in the Waipaoa headwaters [Gage and Black, 1979]. In thefourth and final phase, reinvigorated landsliding throughout the subcatchment likely reflects anthropogenicactivity following European settlement. Erosion rates over the Whakatane-Modern time interval (2.2 mmyr21) are rapid and similar to those for the LGM-Rotoma interval (2.3 mm yr21). The elevated erosion rate isunlikely to be influenced by time-dependent averaging (i.e. ‘‘Sadler’’ effect) because any potential recordingbias is minimized, or even underestimated, by using the spatially averaged total sediment volume [Kirchneret al., 2001; Finnegan et al., 2014; Sadler and Jerolmack, 2014]. Instead, the rapid erosion rate is likely skewedheavily by the widespread deforestation and subsequent land-use change over the past �200 years, mean-ing that most of the erosion during the Waimihia-Modern time interval was accomplished over the latter�5% of that time step; consistent with widespread historic aggradation downstream.
The timing of hillslope evolution within the Mangataikapua catchment closely matches the sequence of hill-slope destabilization and adjustment described by Bilderback et al. [2014] for the upper Waipaoa, whichreflects the downcutting history for much of the Waipaoa [Marden et al., 2008, 2014]. Additionally, the pat-tern of upland erosion fluctuations is also seen in offshore sedimentation fluctuations. Offshore sedimentaccumulation has remained approximately constant through most of the Holocene [Foster and Carter, 1997;Gomez et al., 2004; Orpin et al., 2006; Leithold et al., 2013], but was higher immediately following the LGMtransition [Foster and Carter, 1997] and increased dramatically in the past century due to deforestation [Fos-ter and Carter, 1997; Wilmshurst et al., 1999; Gomez et al., 2004; Orpin et al., 2006; Leithold et al., 2013]; asreflected, broadly, by our subcatchment erosion rates (Figure 6 and Table 3).
More precise correlation between upland, or onshore, and offshore records is complicated by sediment dis-persal on the continental shelf, post-LGM marine transgression, and inputs from other smaller coastal rivers(e.g., Waimata). Additionally, most cores have insufficient dateable material older than �10 ka to constrainthe ages of deep offshore sediments. However, from the available offshore data, we note: (1) periods ofcoarse sedimentation or increased deposition that correspond to the initial fluvial incision and hillslopedestabilization phases trending from gravel (9–11 ka) to deep-sourced, finer sediments [Berryman et al.,2000; Gomez et al., 2004; Leithold et al., 2013], (2) a near constant Holocene (post-10 ka) accumulation ratethat corresponds to equilibrating hillslopes and decreasing erosion rates, and (3) a 2–5 times increase in off-shore sedimentation over the past few centuries [e.g., Foster and Carter, 1997; Gomez et al., 2004; Orpinet al., 2006; Wilmshurst et al., 2011] that corresponds to historic land-use change and increased erosion thatwe observe in this study. Also, recent deposition of deep-sourced carbon [Leithold et al., 2013] and fluvialsediment indicative of increased gully activity [Marsaglia et al., 2010] corroborate accelerated historic ero-sion via earthflows and shallow landslides throughout the Waipaoa [Gage and Black, 1979; Marden et al.,2014].
An onshore/offshore correlation is not surprising since the Waipaoa sedimentary system is thought to betightly coupled between source and sink, meaning there is minimal evidence of significant delays due tosediment storage between terrestrial sediment production and offshore sediment deposition [Hicks et al.,2000; Phillips et al., 2007; Gerber et al., 2010]. However, one major divergence between our study and off-shore records is a sharp pulse of coarse material and terrestrial carbon preserved in sediment coresbetween 3.6 and 5 ka, attributed to landslides during a period of increased storminess [Gomez et al., 2004;Leithold et al., 2013]. A similar pulse of activity is not reflected in our hillslope erosion rates over the sameinterval (Whakatane-Waimihia). This does not necessarily imply that our hillslope record is inconsistent withthe offshore record. Perhaps, instead, this signal originates from increased storm precipitation and/or
CEROVSKI-DARRIAU ET AL. VC 2014. American Geophysical Union. All Rights Reserved. 15
intensity driving sediment transfer from onshore sediment sinks (e.g., floodplains) or other areas of easilyeroded bedrock, rather than changing the pace of sediment production in the Mangataikapua.
6.3. Pattern of Response and Hillslope TransienceCurrently less than 1% of the Mangataikapua remains as pre-LGM terrain and only �5% consists of ridge-lines identified as Rotoma-age—indicating they remain unaltered by historic earthflows. Despite the factthat most of the Mangataikapua has been altered by landslides, the landscape is still in disequilibrium andadjustment is on-going as evident from various estimates of landscape transience. Most of the relict (�18ka) landforms are confined to the upper watershed, upholding the proposed temporal and spatial upstreamprogression of hillslope adjustment. From morphologic evidence, present day earthflows appear to followthis pattern of younging upstream (supporting information Figure S4a). For example, earthflows in theupper watershed are smaller in area and generally deposit in axial gullies (supporting information FigureS4b), whereas downstream single earthflows are more developed and often encompass entire subcatch-ments with toes intersecting the main Mangataikapua channel (supporting information Figure S4c).
In addition to morphologic evidence, we can use surface roughness to test for a signature of transientadjustment. To characterize which areas of the Mangataikapua have adjusted to the post-LGM base levelfall, we correlated surface roughness with distance from the headwaters. To do this, we binned the land-scape into 2.5 km2 increments by downstream drainage area—with an initial 0.5 km2 bin for the relict head-waters—and calculated the median roughness as the age proxy for each bin. The median roughness in therelict, unaltered headwaters is half that of the rest of the subcatchment; indicating an older average age asexpected (Figure 7). The subsequent downstream bins have similar median roughness, although the land-scape roughens slightly near the outlet (Figure 7). This analysis suggests that hillslope response has trans-lated through much of the Mangataikapua but is not yet complete. If fluvial incision rates have slowed orceased, we might expect to see a hillslope response with: (1) the oldest, smoothest areas of unadjusted ter-rain in the headwaters, (2) the roughest, youngest terrain in the middle reaches, and (3) an older terrainagain near the outlet that has equilibrated with the new base level [e.g., Gallen et al., 2011]. However, otherthan the relict smooth terrain in the headwaters, the rest of the subcatchment has a relatively uniformyounger roughness-age. Therefore, slope adjustment has initiated through most of the subcatchment, butthe ultimate morphologic adjustment is incomplete; indicating the time scale needed to reach equilibrium,or completely adjust to the new base level, is longer than the post-LGM (�18 kyr) time period.
The prevalent common age (Rotoma, 9.4 ka) for much of the subcatchment likely reflects the rapid initialphase of hillslope adjustment between LGM and Rotoma. Given sufficient fluvial incision to debuttress theslopes throughout the catchment, the signal of widespread failure dominates and still persists in the land-scape today. More recent earthflows and smaller landslides may not have affected a large enough arealextent to change the overall mean roughness, or more likely, are acting similarly everywhere to maintain anearly uniform median roughness as evident from the field, lidar, and, possibly, reconstruction data (Figure5d). However, the paleosurface reconstructions likely do not have the spatial resolution to resolve a trans-gressive wave of erosion characteristic of a transient landscape, and the relatively uniform distribution ofvolume change (Figure 5d) may reflect the differing resolution between the paleosurface and the lidarrather than a process shift. Regardless, the lack of age discrepancies between the downstream, middle, andupstream reaches of the Mangataikapua indicate the hillslopes continue to adjust. Therefore, despite theweak lithology facilitating a more rapid response than elsewhere in the Waipaoa, the hillslopes are still in atransient state. With time, most relict surfaces will be regraded by landslides. However, the pace of adjust-ment is influenced by the decreasing drainage area upstream and potentially the presence of knickpoints[Crosby et al., 2007]—now obscured by landslide deposits or diffused due to the weak substrate—whichaids the preservation of relict surfaces in the headwaters.
The basic pattern of hillslope erosion in our study area can be explained by changing base level. Hillslope-channel coupling has long been understood to drive relief adjustment. The fundamental idea being thathillslopes grade to a base level, and the gradient is set by the strength of hillslope material while the rate ofadjustment is set by the rate of base level change and celerity of knickpoints [Crosby and Whipple, 2006].The weak m�elange that underlies our subcatchment was unable to support oversteepened slopes, thereforemassive and rapid base level fall locally induced widespread slope failure and hillslope adjustment in theMangataikapua. Slope failures were likely fast-moving and deep-seated in response to elevated incision
CEROVSKI-DARRIAU ET AL. VC 2014. American Geophysical Union. All Rights Reserved. 16
rates at the outlet of the Mangataikapua between 9.4 and 14 ka [Marden et al., 2014]. As incision ratesdecreased through the Holocene [Berryman et al., 2010; Gomez and Livingston, 2012; Marden et al., 2014],and knickpoints either stalled or diffused out, we would expect landsliding to slow in concert as inferred bydecreasing post-Rotoma erosion rates. In addition, vegetation change can concurrently affect hillslopeadjustment. For example, tree growth—like during the transition from shrubland to forest cover in the Wai-paoa—can stabilize hillslopes by decreasing infiltration and anchoring soil and bedrock to the slopes. Wesuggest that a more pronounced vegetation-hillslope-channel feedback manifested during periods ofslower fluvial incision and/or aggradation post-Rotoma, which allowed forest cover to establish and furtherretard landsliding until historic deforestation reinvigorated erosion. Thus, hillslope-channel interactions aredominantly controlled by base level when base level change is rapid; but additional factors—such as vege-tation—become increasingly important as the pace of base level changes slows or the landscapeapproaches its new equilibrium form. Based on the distribution of surface roughness, we propose that the
1
1.01
1.02
1.03
1.04
1.05
1.06
1.07
1.08
1.09
1.10
1.11
1.12
1.13
1.14
Drainage Area (km2)
0.5 3.0 5.5 8.0 10.5 13.0 15.5
Modern
KaharoaTaupo
Waimihia
Whakatane
Rotoma
LGM
Rou
ghne
ss
Figure 7. Trend in average catchment roughness by drainage area, using median roughness to minimize the influence of outliers, calculated from the final roughness map (Figure 3).Roughness is a proxy for surface age and shows the decreasing age of the landscape from the headwaters to the outlet, and the distinct difference between the unadjusted, relict hill-slopes in the headwaters and the adjusting hillslopes downstream. Error bars span the interquartile range for each roughness bin.
CEROVSKI-DARRIAU ET AL. VC 2014. American Geophysical Union. All Rights Reserved. 17
Mangataikapua is a transient landscape that was nearing equilibrium with the current climate and lithology.However, widespread earthflows reactivated following deforestation have increased erosion, leading to sig-nificant aggradation, which has slowed fluvial incision—again perturbing the hillslope-channel response.
7. Conclusion
By reconstructing the paleolandscape, we calculate that the total post-LGM hillslope sediment contributionfrom the Mangataikapua catchment is 0.5 km3 (or a catchment-averaged erosion rate of 1.6 mm yr21),which is double the previous hillslope erosion estimate when normalized by study area. Although the Man-gataikapua is a small area of exceptionally weak lithology, our study shows that landslide-dominated areasof the landscape contribute a disproportionate amount of sediment and hillslopes are a significant terres-trial component of the Waipaoa sedimentary system. The main phase of slope destabilization and hillslopeadjustment occurred between the deposition of Waiohau (14.0 ka) and Rotoma (9.4 ka), driven by rapid flu-vial incision that steepened hillslopes temporarily stabilized by the newly established podocarp forest. Thismajor phase of landsliding was followed by pervasive landslide activity, likely predominantly earthflows,that continues to shape the landscape. Despite the Mangataikapua being a unique subcatchment that isresponding more rapidly to the post-LGM climate shift than the rest of the Waipaoa, the overall processes,timing, and patterns of response are similar—and, notably, still on-going. The initial lag in hillslope adjust-ment, coupled with slowed incision in the upstream reaches of tributaries, is likely why relict terrain remainsin the headwaters, unaltered, as of yet, by landslides. Therefore, after �18 kyr, hillslopes in the Mangataika-pua are still actively adjusting to a climate-driven base level fall, showing the disparate time scales overwhich fluvial and hillslope processes are active despite relatively close coupling between the two processregimes.
ReferencesAvouac, J.-P. (1993), Analysis of scarp profiles: Evaluation of errors in morphologic dating, J. Geophys. Res., 98(B4), 6745–6754, doi:10.1029/
92JB01962.Berryman, K., M. Marden, D. Eden, C. Mazengarb, Y. Ota, and I. Moriya (2000), Tectonic and paleoclimatic significance of Quaternary river
terraces of the Waipaoa River, east coast, North Island, New Zealand, N. Z. J. Geol. Geophys., 43(2), 229–245.Berryman, K., M. Marden, A. Palmer, K. Wilson, C. Mazengarb, and N. Litchfield (2010), The post-glacial downcutting history in the Waihuka
tributary of Waipaoa River, Gisborne district: Implications for tectonics and landscape evolution in the Hikurangi subduction margin,New Zealand, Mar. Geol., 270(1-4), 55–71, doi:10.1016/j.margeo.2009.10.001.
Bilderback, E. L. (2012), Hillslope response to climate-modulated river incision and the role of deep-seated landslides in post-glacial sedi-ment flux: Waipaoa Sedimentary System, New Zealand, PhD thesis, Geol. Sci., Univ. of Canterbury, Christchurch, New Zealand. [Availableat http://ir.canterbury.ac.nz/handle/10092/7439.]
Bilderback, E. L., J. Pettinga, N. J. Litchfield, M. Quigley, M. Marden, J. J. Roering, and A. S. Palmer (2014), Hillslope response to climate-modulated river incision in the Waipaoa Catchment, East Coast North Island, New Zealand, Geol. Soc. Am. Bull, B31015-1, doi:10.1130/B31015.1.
Black, R. (1980), Upper Cretaceous and Tertiary geology of Mangatu State Forest, Raukumara Peninsula, New Zealand, N. Z. J. Geol. Geo-phys., 23(1958), 293–312.
Booth, A. M., J. J. Roering, and A. W. Rempel (2013), Topographic signatures and a general transport law for deep-seated landslides in alandscape evolution model, J. Geophys. Res. Earth Surf., 118, 603–624, doi:10.1002/jgrf.20051.
Brown, L. (1995), Holocene shoreline depositional processes at Poverty Bay, a tectonically active area, northeastern North Island, New Zea-land, Quat. Int., 26(94), 21–33.
Bull, W. B. (1991), Geomorphic Responses to Climatic Change, Oxford Univ. Press, N. Y.Clark, M. K., L. H. Royden, K. X. Whipple, B. C. Burchfiel, X. Zhang, and W. Tang (2006), Use of a regional, relict landscape to measure vertical
deformation of the eastern Tibetan Plateau, J. Geophys. Res., 111, F03002, doi:10.1029/2005JF000294.Crosby, B., and K. Whipple (2006), Knickpoint initiation and distribution within fluvial networks: 236 waterfalls in the Waipaoa River, North
Island, New Zealand, Geomorphology, 82(1-2), 16–38, doi:10.1016/j.geomorph.2005.08.023.Crosby, B. T., K. X. Whipple, N. M. Gasparini, and C. W. Wobus (2007), Formation of fluvial hanging valleys: Theory and simulation, J. Geo-
phys. Res., 112, F03S10, doi:10.1029/2006JF000566.DeMets, C., R. G. Gordon, D. F. Argus, and S. Stein (1994), Effect of recent revisions to the geomagnetic reversal time scale on estimates of
current plate motions, Geophys. Res. Lett., 21(20), 2191–2194, doi:10.1029/94GL02118.Eden, D. N., A. S. Palmer, S. J. Cronin, M. Marden, and K. R. Berryman (2001), Dating the culmination of river aggradation at the end of the
last glaciation using distal tephra compositions, eastern North Island, New Zealand, Geomorphology, 38(1-2), 133–151, doi:10.1016/S0169-555X(00)00077-5.
Finnegan, N. J., R. Schumer, and S. Finnegan (2014), A signature of transience in bedrock river incision rates over timescales of 10(4)–10(7)years, Nature, 505(7483), 391–394, doi:10.1038/nature12913.
Foster, G., and L. Carter (1997), Mud sedimentation on the continental shelf at an accretionary margin—Poverty Bay, New Zealand, N. Z. J.Geol. Geophys., 40(2), 157–173.
Frankel, K. L., and J. F. Dolan (2007), Characterizing arid region alluvial fan surface roughness with airborne laser swath mapping digitaltopographic data, J. Geophys. Res., 112, F02025, doi:10.1029/2006JF000644.
AcknowledgmentsThe authors are grateful to PeterAlmond for his enthusiastic pit diggingand valuable insights in the field. Wealso thank the owners of Te Hau andTe Kowhai Stations for granting fieldaccess. We greatly appreciate NataliaDeligne and Laurel Childress for fieldassistance and Julie Barkman for EMPAassistance. Additionally, we thank thetwo anonymous reviewers forproviding thoughtful comments thatimproved the quality of thismanuscript. This project was fundedby NSF grant OCE-841111 as part ofMARGINS Source-to-Sink (S2S) project.Lidar data were acquired by NewZealand Aerial Mapping (NZAM). Thedata supporting the figures in thispaper are available in the supportinginformation tables.
Froggatt, P., and D. Lowe (1990), A review of late Quaternary silicic and some other tephra formations from New Zealand: Their stratigra-phy, nomenclature, distribution, volume, and age, N. Z. J. Geol. Geophys., 37–41.
Gage, M., and R. D. Black (1979), Slope-stability and geological investigations at Mangatu State Forest, N. Z. For. Serv. Tech. Pap., 66, ForestResearch Institute, Wellington, New Zealand.
Gallen, S. F., K. W. Wegmann, K. L. Frankel, S. Hughes, R. Q. Lewis, N. Lyons, P. Paris, K. Ross, J. B. Bauer, and A. C. Witt (2011), Hillsloperesponse to knickpoint migration in the Southern Appalachians: Implications for the evolution of post-orogenic landscapes, Earth Surf.Process. Landforms, 36(9), 1254–1267, doi:10.1002/esp.2150.
Gasparini, N. M., K. X. Whipple, and R. L. Bras (2007), Predictions of steady state and transient landscape morphology using sediment-flux-dependent river incision models, J. Geophys. Res., 112, 1–20, F03S09, doi:10.1029/2006JF000567.
Gerber, T. P., L. F. Pratson, S. Kuehl, J. P. Walsh, C. Alexander, and A. Palmer (2010), The influence of sea level and tectonics on Late Pleisto-cene through Holocene sediment storage along the high-sediment supply Waipaoa continental shelf, Mar. Geol., 270(1-4), 139–159, doi:10.1016/j.margeo.2009.10.002.
Gomez, B., and D. M. Livingston (2012), The river it goes right on: Post-glacial landscape evolution in the upper Waipaoa River basin, east-ern North Island, New Zealand, Geomorphology, 159-160, 73–83, doi:10.1016/j.geomorph.2012.03.006.
Gomez, B., L. Carter, N. a. Trustrum, A. S. Palmer, and A. P. Roberts (2004), El Ni~no–Southern Oscillation signal associated with middle Holo-cene climate change in intercorrelated terrestrial and marine sediment cores, North Island, New Zealand, Geology, 32(8), 653, doi:10.1130/G20720.1.
Guzzetti, F., A. Mondini, M. Cardinali, F. Fiorucci, M. Santangelo, and K.-T. Chang (2012), Landslide inventory maps: New tools for an oldproblem, Earth Sci. Rev., doi:10.1016/j.earscirev.2012.02.001.
Hicks, D. M., B. Gomez, and N. A. Trustrum (2000), Erosion thresholds and suspended sediment yields, Waipaoa River Basin, New Zealand,Water Resour. Res., 36(4), 1129–1142.
Hovius, N., C. Stark, and P. Allen (1997), Sediment flux from a mountain belt derived by landslide mapping, Geology, 25, 231–234, doi:10.1130/0091-7613(1997)025<0231.
Hurst, M. D., S. M. Mudd, M. Attal, and G. Hilley (2013), Hillslopes record the growth and decay of landscapes, Science (80), 341(6148), 868–871, doi:10.1126/science.1241791.
Jenness, J. (2004), Calculating landscape surface area from digital elevation models, Wildlife Soc. Bull., 32(1986), 829–839.Kirchner, J., R. Finkel, and C. Riebe (2001), Mountain erosion over 10 yr, 10 ky, and 10 my time scales, Geology, 29, 591–594, doi:10.1130/
0091-7613(2001)029<0591.Korup, O., A. L. Densmore, and F. Schlunegger (2010), The role of landslides in mountain range evolution, Geomorphology, 120(1-2), 77–90,
doi:10.1016/j.geomorph.2009.09.017.Lang, A., J. Moya, J. Corominas, L. Schrott, and R. Dikau (1999), Classic and new dating methods for assessing the temporal occurrence of
mass movements, Geomorphology, 30(1-2), 33–52, doi:10.1016/S0169-555X(99)00043-4.Larsen, I. J., and D. R. Montgomery (2012), Landslide erosion coupled to tectonics and river incision, Nat. Geosci., 5(7), 468–473, doi:
10.1038/ngeo1479.Larsen, I. J., D. R. Montgomery, and H. M. Greenberg (2014), The contribution of mountains to global denudation, Geology, 42(6), 527–530,
doi:10.1130/G35136.1.Lav�e, J., and D. W. Burbank (2004), Denudation processes and rates in the Transverse Ranges, southern California: Erosional response of a
transitional landscape to external and anthropogenic forcing, J. Geophys. Res., 109, F01006, doi:10.1029/2003JF000023.Leithold, E. L., N. E. Blair, L. B. Childress, B. R. Brulet, M. Marden, A. R. Orpin, S. a. Kuehl, and C. R. Alexander (2013), Signals of watershed
change preserved in organic carbon buried on the continental margin seaward of the Waipaoa River, New Zealand, Mar. Geol., 346,355–365, doi:10.1016/j.margeo.2013.10.007.
Litchfield, N., and K. Berryman (2006), Relations between postglacial fluvial incision rates and uplift rates in the North Island, New Zealand,J. Geophys. Res., 111, F02007, doi:10.1029/2005JF000374.
Litchfield, N. J., and K. R. Berryman (2005), Correlation of fluvial terraces within the Hikurangi Margin, New Zealand: Implications for climateand baselevel controls, Geomorphology, 68(3-4), 291–313, doi:10.1016/j.geomorph.2004.12.001.
Lowe, D., M. Blaauw, A. G. Hogg, and R. M. Newnham (2013), Ages of 24 widespread tephras erupted since 30,000 years ago in New Zea-land, with re-evaluation of the timing and palaeoclimatic implications of the Lateglacial cool, Quat. Sci. Rev., 74, 170–194, doi:10.1016/j.quascirev.2012.11.022.
Lowe, D. J. (2011), Tephrochronology and its application: A review, Quat. Geochronol., 6(2), 107–153, doi:10.1016/j.quageo.2010.08.003.Lowe, D. J., P. a. R. Shane, B. V. Alloway, and R. M. Newnham (2008), Fingerprints and age models for widespread New Zealand tephra
marker beds erupted since 30,000 years ago: A framework for NZ-INTIMATE, Quat. Sci. Rev., 27(1-2), 95–126, doi:10.1016/j.quascirev.2007.01.013.
Marden, M., G. Arnold, B. Gomez, and D. Rowan (2005), Pre- and post-reforestation gully development in Mangatu Forest, East Coast, NorthIsland, New Zealand, River Res. Appl., 21(7), 757–771.
Marden, M., C. Mazengarb, A. Palmer, K. Berryman, and D. Rowan (2008), Last glacial aggradation and postglacial sediment productionfrom the non-glacial Waipaoa and Waimata catchments, Hikurangi Margin, North Island, New Zealand, Geomorphology, 99(1-4), 404–419, doi:10.1016/j.geomorph.2007.12.003.
Marden, M., H. Betts, a. Palmer, R. Taylor, E. Bilderback, and N. Litchfield (2014), Post-Last Glacial Maximum fluvial incision and sedimentgeneration in the unglaciated Waipaoa catchment, North Island, New Zealand, Geomorphology, 214, 283–306, doi:10.1016/j.geomorph.2014.02.012.
Marsaglia, K. M., A. M. DeVaughn, D. E. James, and M. Marden (2010), Provenance of fluvial terrace sediments within the Waipaoa sedimen-tary system and their importance to New Zealand source-to-sink studies, Mar. Geol., 270(1-4), 84–93, doi:10.1016/j.margeo.2009.10.017.
Mazengarb, C., and I. Speden (2000), Geology of the Raukumara Area, Inst. of Geol. & Nucl. Sci., Lower Hutt, New Zealand.McGlone, M. (2001), A late Quaternary pollen record from marine core P69, southeastern North Island, New Zealand, N. Z. J. Geol. Geophys.,
44, 69–77.McKean, J., and J. Roering (2004), Objective landslide detection and surface morphology mapping using high-resolution airborne laser
altimetry, Geomorphology, 57(3), 331–351.Merritts, D., and K. Vincent (1989), Geomorphic response of coastal streams to low, intermediate, and high rates of uplift, Medocino triple
junction region, northern California, Geol. Soc. Am. Bull., 101(11), 1373–1388, doi:10.1130/0016-7606(1989)101<1373.Milliman, J. D., and J. P. M. Syvitski (1992), Geomorphic/tectonic control of sediment discharge to the ocean: The importance of small
Montgomery, D. R., and M. T. Brandon (2002), Topographic controls on erosion rates in tectonically active mountain ranges, Earth Planet.Sci. Lett., 201(3-4), 481–489, doi:10.1016/S0012-821X(02)00725-2.
Orpin, A. R., C. Alexander, L. Carter, S. Kuehl, and J. P. Walsh (2006), Temporal and spatial complexity in post-glacial sedimentation on thetectonically active, Poverty Bay continental margin of New Zealand, Cont. Shelf Res., 26(17-18), 2205–2224, doi:10.1016/j.csr.2006.07.029.
Ouimet, W. B., K. X. Whipple, L. H. Royden, Z. Sun, and Z. Chen (2007), The influence of large landslides on river incision in a transient land-scape: Eastern margin of the Tibetan Plateau (Sichuan, China), Geol. Soc. Am. Bull., 119(11-12), 1462–1476, doi:10.1130/B26136.1.
Page, M., and B. Lukovic (2011), An Inventory of Deep-Seated Landslides in the Waipaoa and Waimata Catchments, GNS Science, Lower Hutt,New Zealand.
Pazzaglia, F., and M. Brandon (2001), A fluvial record of long-term steady-state uplift and erosion across the Cascadia forearc high, westernWashington State, Am. J. Sci., 301, 385–431.
Phillips, J. D., M. Marden, and B. Gomez (2007), Residence time of alluvium in an aggrading fluvial system, Earth Surf. Process. Landforms,32(2), 307–316, doi:10.1002/esp.1385.
Preston, N., and M. Crozier (1999), Resistance to shallow landslide failure through root-derived cohesion in east coast hill country soils,North Island, New Zealand, Earth Surf. Process. Landforms, 675, 665–675.
Sadler, P. M., and D. J. Jerolmack (2014), Scaling laws for aggradation, denudation and progradation rates: The case for time-scale invari-ance at sediment sources and sinks, Geol. Soc. Spec. Publ., 404, doi:10.1144/SP404.7.
Schmidt, K. M., and D. R. Montgomery (1995), Limits to Relief, Science (80), 270(5236), 617–620, doi:10.1126/science.270.5236.617.Schumm, S. (1993), River response to baselevel change: Implications for sequence stratigraphy, J. Geol., 101(2), 279–294.Shane, P., V. Smith, D. Lowe, and I. Nairn (2003), Re-identification of c. 15 700 cal yr BP tephra bed at Kaipo Bog, eastern North Island: Impli-
cations for dispersal of Rotorua and Puketarata tephra beds, N. Z. J. Geol. Geophys., 46, 591–596.Smith, V., P. Shane, and I. Nairn (2005), Trends in rhyolite geochemistry, mineralogy, and magma storage during the last 50 kyr at Okataina
and Taupo volcanic centres, Taupo Volcanic Zone, New Zealand, J. Volcanol. Geotherm. Res., 148, 372–406, doi:10.1016/j.volgeores.2005.05.005.
Wallace, L. M. (2004), Subduction zone coupling and tectonic block rotations in the North Island, New Zealand, J. Geophys. Res., 109,B12406, doi:10.1029/2004JB003241.
Warrick, J. a., J. D. Milliman, D. E. Walling, R. J. Wasson, J. P. M. Syvitski, and R. E. Aalto (2013), Earth is (mostly) flat: Apportionment of theflux of continental sediment over millennial time scales: COMMENT, Geology, 42(1), e316–e316, doi:10.1130/G34846C.1.
Wegmann, K. W., and F. J. Pazzaglia (2002), Holocene strath terraces, climate change, and active tectonics: The Clearwater River basin,Olympic Peninsula, Washington State, Geol. Soc. Am. Bull., 114(6), 731–744, doi:10.1130/0016-7606(2002)114.
Whipple, K., and G. Tucker (1999), Dynamics of the stream-power river incision model: Implications for height limits of mountain ranges,landscape response timescales, and research needs, J. Geophys. Res., 104, 661–674.
Whipple, K. X., and G. E. Tucker (2002), Implications of sediment-flux-dependent river incision models for landscape evolution, J. Geophys.Res., 107(B2), 2039, doi:10.1029/2000JB000044.
Whipple, K. X., E. Kirby, and S. H. Brocklehurst (1999), Geomorphic limits to climate-induced increases in topographic relief, Nature, 401, 39–43.
Williams, P., H. Nei, and J. Zhao (2010), Age frequency distribution and revised stable isotope curves for New Zealand speleothems: Palaeo-climatic implications, Int. J. Speleol., 39, 99–112.
Williams, P. W., D. N. T. King, J.-X. Zhao, and K. D. Collerson (2005), Late Pleistocene to Holocene composite speleothem 18O and 13C chro-nologies from South Island, New Zealand—Did a global Younger Dryas really exist?, Earth Planet. Sci. Lett., 230(3-4), 301–317, doi:10.1016/j.epsl.2004.10.024.
Wilmshurst, J. M., D. N. Eden, and P. C. Froggatt (1999), Late Holocene forest disturbance in Gisborne, New Zealand: A comparison of terres-trial and marine pollen records, N. Z. J. Bot., 37(3), 523–540.
Wilmshurst, J. M., T. L. Hunt, C. P. Lipo, and A. J. Anderson (2011), High-precision radiocarbon dating shows recent and rapid initial humancolonization of East Polynesia., Proc. Natl. Acad. Sci. U. S. A., 108(5), 1815–20, doi:10.1073/pnas.1015876108.
Wright, I., M. McGlone, C. Nelson, and B. Pillans (1995), An integrated latest Quaternary (stage 3 to present) paleoclimatic and paleoceano-graphic record from offshore northern New Zealand, Quat. Res., 44, 283–293.


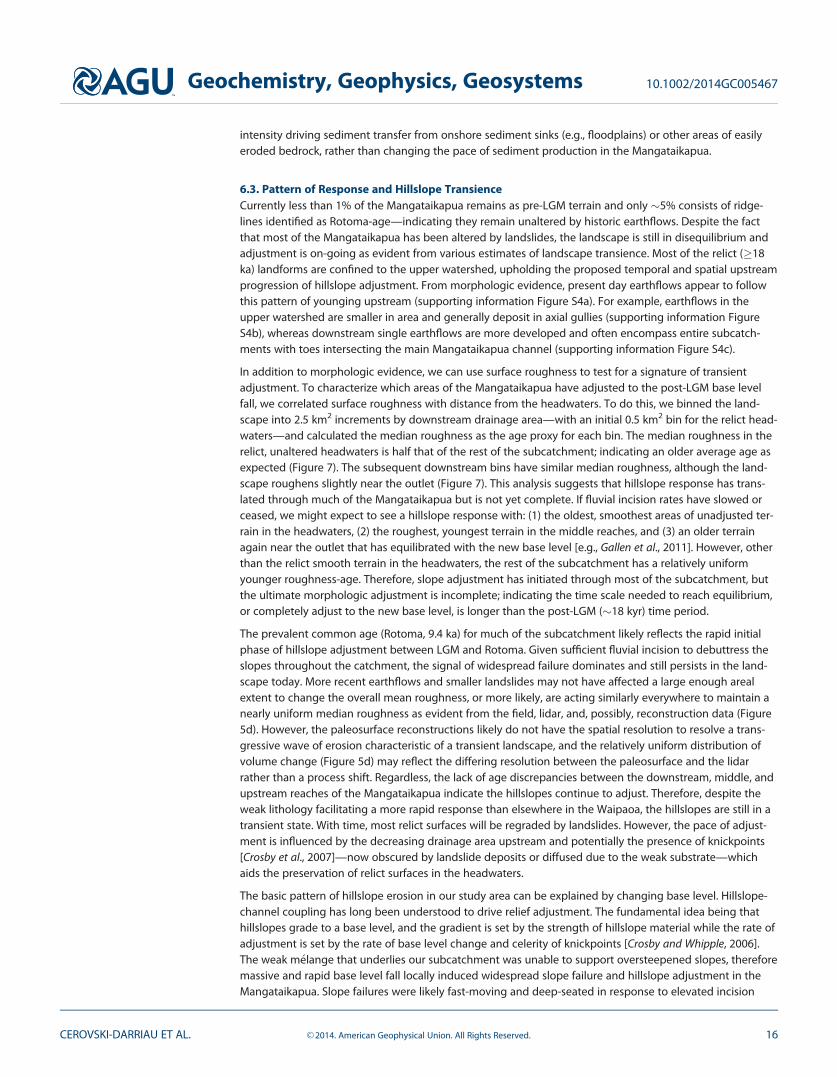


![FRW holography from uplifted AdS/CFT · FRW holography from uplifted AdS/CFT Gonzalo Torroba SLAC, Stanford University Based on arXiv: 1108.5732 [DHMST], 1005.5403 [DHST] with X.](https://static.documents.pub/doc/80x56/5b8405757f8b9a934f8e80df/frw-holography-from-uplifted-ads-frw-holography-from-uplifted-adscft-gonzalo.jpg)


