The Pennsylvania State University The Graduate School College of Earth and Mineral Sciences QUANTIFYING THE ECONOMIC IMPACT OF HYDRAULIC FRACTURING PROPPANT SELECTION IN LIGHT OF OCCUPATIONAL PARTICULATE EXPOSURE RISK AND FUNCTIONAL REQUIREMENTS A Thesis in Energy and Mineral Engineering by Sidharth Agrawal 2017 Sidharth Agrawal Submitted in Partial Fulfillment of the Requirements for the Degree of Master of Science December 2017
Transcript
The Pennsylvania State University
The Graduate School
College of Earth and Mineral Sciences
QUANTIFYING THE ECONOMIC IMPACT OF HYDRAULIC FRACTURING
PROPPANT SELECTION IN LIGHT OF OCCUPATIONAL PARTICULATE
EXPOSURE RISK AND FUNCTIONAL REQUIREMENTS
A Thesis in
Energy and Mineral Engineering
by
Sidharth Agrawal
2017 Sidharth Agrawal
Submitted in Partial Fulfillment of the Requirements
for the Degree of
Master of Science
December 2017
ii
The thesis of Sidharth Agrawal was reviewed and approved* by the following:
Jeremy M. Gernand Assistant Professor of Industrial Health and Safety Thesis Adviser
Sanjay Srinivasan Professor of Petroleum and Natural Gas Engineering
Mort D. Webster Associate Professor of Energy Engineering
Luis F. Ayala H. Professor of Petroleum and Natural Gas Engineering Associate Department Head for Graduate Education
*Signatures are on file in the Graduate School
iii
ABSTRACT
Selection of the proppant material for hydraulic fracturing is an important design
choice to optimize the production of oil and natural gas. Some of these proppants are made
up of substances like silica (quartz sand), alumina, resin coated silica, ceramics, and others.
These materials can be toxic to varying degrees and lead to health problems in the
employees handling them primarily due to inhalation exposure. Factors affecting the
selection of proppants are closure stress of reservoir, required conductivity, and
permeability of the deposit. With increased depth of wells, several types of proppants have
been developed to meet the formation characteristics for achieving higher production.
Existing research describes the effect of silica on human health but little research has been
done to determine the risk-reduction and social-cost-effectiveness associated with using
alternative proppants in light of the health risks. This study quantifies the relative risks or
benefits to human health by the use of these proppants through an economic analysis taking
the health-related economic impact into consideration as well as technical attributes.
Results show that the use of each ton of silica-based proppants results in $123 of external
costs from fatalities and non-fatal illness arising due to exposure to silica for a crew
handing 60,000 tons of proppants. It also suggests that silica-based proppants could be
economically replaced by less harmful, more expensive alternatives for hydraulic
fracturing crews handling less than 60,000 tons of proppant each year, provided the
technical requirements are met.
iv
TABLE OF CONTENTS
List of Figures ............................................................................................................. v
List of Tables ............................................................................................................... vii
Acknowledgements ...................................................................................................... ix
Chapter 2 Literature Review ........................................................................................ 6
2.1 Hydraulic Fracturing ....................................................................................... 6 2.2 Proppants ........................................................................................................ 8 2.3 Selection of Proppants .................................................................................... 10 2.4 Motivation for the Study ................................................................................. 12 2.5 Objective of the Study .................................................................................... 14
3.1 Data Collection ............................................................................................... 15 3.2 Willingness-to-pay for Avoided Fatality and Morbidity ................................ 18 3.3 Willingness-to-pay for Avoided Fatality and Morbidity for One Hydraulic
Chapter 4 Analysis and Results ................................................................................... 28
4.1 Cost of fatalities and non-fatal illness for various proppants ......................... 28 4.2 Silica exposure in hydraulic fracturing industry ............................................. 30 4.3 Sensitivity Analysis ........................................................................................ 31
Appendix A Details of Proppants used in this research ...................................... 56 Appendix B Data to calculate health-related costs for a hydraulic fracturing
Figure 1-1 Estimated fracture sand consumption among major U.S. unconventional oil and gas shale basin. The estimated share of fracture sand to total proppant consumed in ten major non-conventional fields was over 90 percent for all the fields except Bakken (Data from [7]) ...................................... 2
Figure 1-2 Number of different types of silica and non-silica-based proppants by year [10]. The number of different types of silica-based proppants used between 2001 and 2010 far exceeds the number of different types of non-silica-based proppants. .......................................................................................... 4
Figure 2-1 Hydraulic Fracturing Process [23]–[25]. Used by permission. ................. 7
Figure 2-2 Number of wells hydraulically fractured from 1947 to 2010 (Data from [10]) .............................................................................................................. 8
Figure 2-3 Ceramic proppant (CARBOEconoprop 20/40, a high-conductivity, lightweight ceramic proppant from CARBO Ceramics) ...................................... 10
Figure 2-4 Percentage of sample collected at various hydraulic fracturing sited having silica exposure levels above the National Institute for Safety and Occupational Health Respirable Exposure Limit (NIOSH REL), Occupational Safety and Health Administration Permissible Exposure Limit (OSHA PEL) and American Conference of Governmental Industrial Hygienists Threshold Limit Value (ACGIH TVL) (Data from [9]). .................... 13
Figure 3-1 Numbers of four major categories based on their type namely, ceramic-based (C), bauxite-based (B), resin coated (RC) and silica-based (S) proppant. ............................................................................................................... 16
Figure 3-2 Number of proppants available at different permeability ranges .............. 17
Figure 3-3 Number of proppants available at different conductivity ranges .............. 17
Figure 4-1 Cost of fatality and non-fatal illness for different proppant types. The range of cost of fatality and non-fatal illness is approximately 1100 times higher for silica-based proppant as compared to ceramic and bauxite based proppant. ............................................................................................................... 30
Figure 4-2 (a) Sensitivity analysis for ceramic-based proppants. The total combined cost is negligibly affected by the change in the cost of fatality and non-fatal illness as compared to proppant quantity and the proppant cost. (b) Sensitivity Analysis for bauxite based proppants. The total combined cost is negligibly affected by the change in the cost of fatality and non-fatal illness as compared to proppant quantity and the proppant cost. (c) Sensitivity
vi
Analysis for silica-based proppants. The change in the cost of fatality and non-fatal illness has a substantial effect on the total cost. .................................... 34
Figure 4-3 Comparison of cost of different types of proppants. The cost of silica-based proppant is lowest and the cost of ceramic-based proppant is highest. ...... 35
Figure 4-4 Comparison of total combined raw material and health cost for different types of proppants. The combined cost for bauxite based proppant is less than silica-based proppant and ceramic-based proppant has lower combined cost as compared to bauxite based proppant for crews handling slightly less than 60000 tons of proppants per year. ............................................. 37
Figure 4-5 Proppant Selection Strategy Map. (a) Least expensive proppants available at various closure stress and permeability excluding financial implications of health into account. (b) Least expensive proppants available at various closure stress and permeability including financial implications of health into account. (d) Least expensive proppants available at various closure stress and conductivity including financial implications of health into account. (c) Least expensive proppants available at various closure stress and conductivity excluding financial implications of health into account. ................. 39
vii
LIST OF TABLES
Table 3-1 Number of people in a typical hydraulic fracturing crew based on their job description. ..................................................................................................... 20
Table 3-2 Estimated number of avoided fatalities & non-fatal illnesses due to a reduction in crystalline silica exposure of 50 μg/m3 for at-risk workers over a 45-year of working life [41]. OSHA applies the dose-response relationship to project the number of avoided fatality and non-fatal illness. ............................... 22
Table 3-3 Estimated percentage of avoided fatalities & non-fatal illnesses due to reduction in crystalline silica exposure of 50 μg/m3 for at-risk workers over a 45-year of working life ......................................................................................... 23
Table 3-4 Number of affected workers exposed to silica level of 50 μg/m3 or more in a typical hydraulic fracturing crew. ......................................................... 24
Table 3-5 Estimated cost of fatalities & non-fatal illnesses due to crystalline silica exposure of 50 μg/m3 for at-risk workers over a 45-year of working life for one typical fracturing crew. .................................................................................. 25
Table 3-6 Material exposure limit as per American Conference of Governmental Industrial Hygienists Threshold Limit Value (ACGIH TVL) .............................. 26
Table 4-1 Cost of fatalities and non-fatal illness for various proppant types. The cost of fatalities and non-fatal illness is negligible for ceramic and bauxite based proppant as compared to silica-based proppant. ......................................... 29
Table 4-2 Estimated number of fatality & non-fatal illnesses due to crystalline silica exposure of 50 μg/m3 for at-risk workers over a 45-year of working life in hydraulic fracturing industry. ........................................................................... 31
Table 4-3 Average cost per ton and the average cost of fatality and non-fatal illness for proppant for a typical hydraulic fracturing crew. ................................ 32
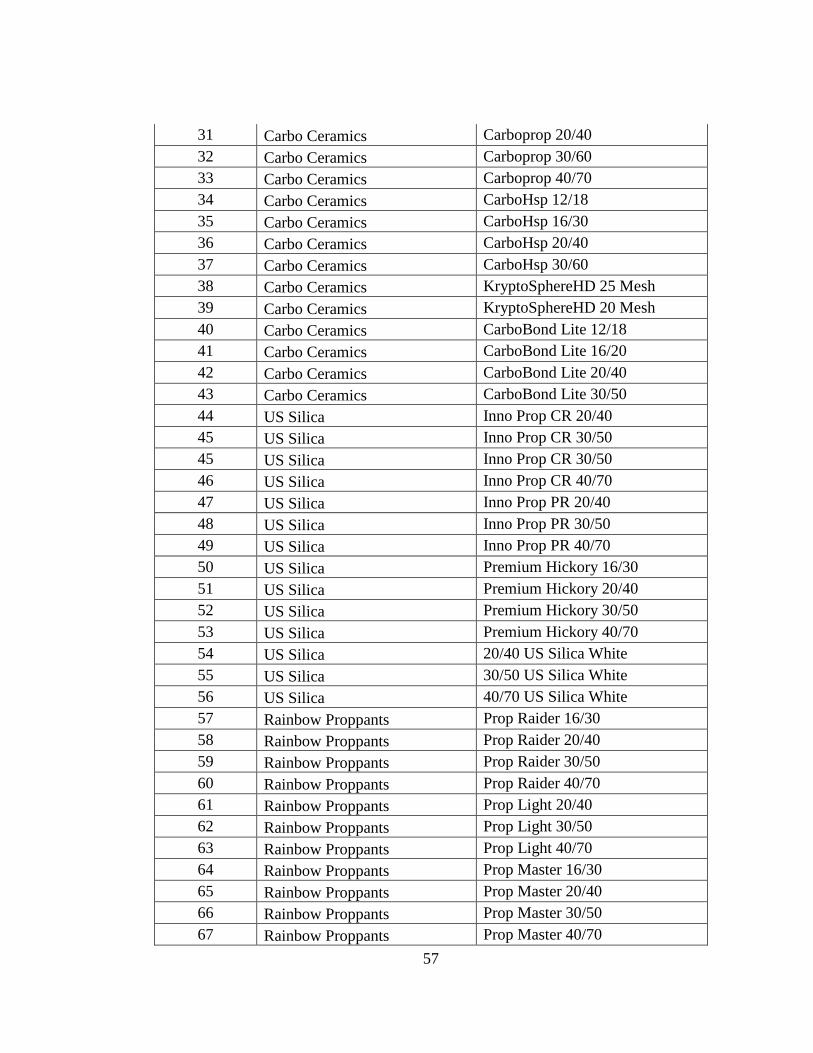
Table A- 1 List of commercially available proppants used in this research. .............. 56
Table A- 2 List of commercially available proppants designed to be used at a closure stress of 2000 psi with varying conductivity and permeability. ............... 58
Table A- 3 List of commercially available proppants designed to be used at a closure stress of 4000 psi with varying conductivity and permeability. ............... 61
Table A- 4 List of commercially available proppants designed to be used at a closure stress of 6000 psi with varying conductivity and permeability. ............... 64
viii
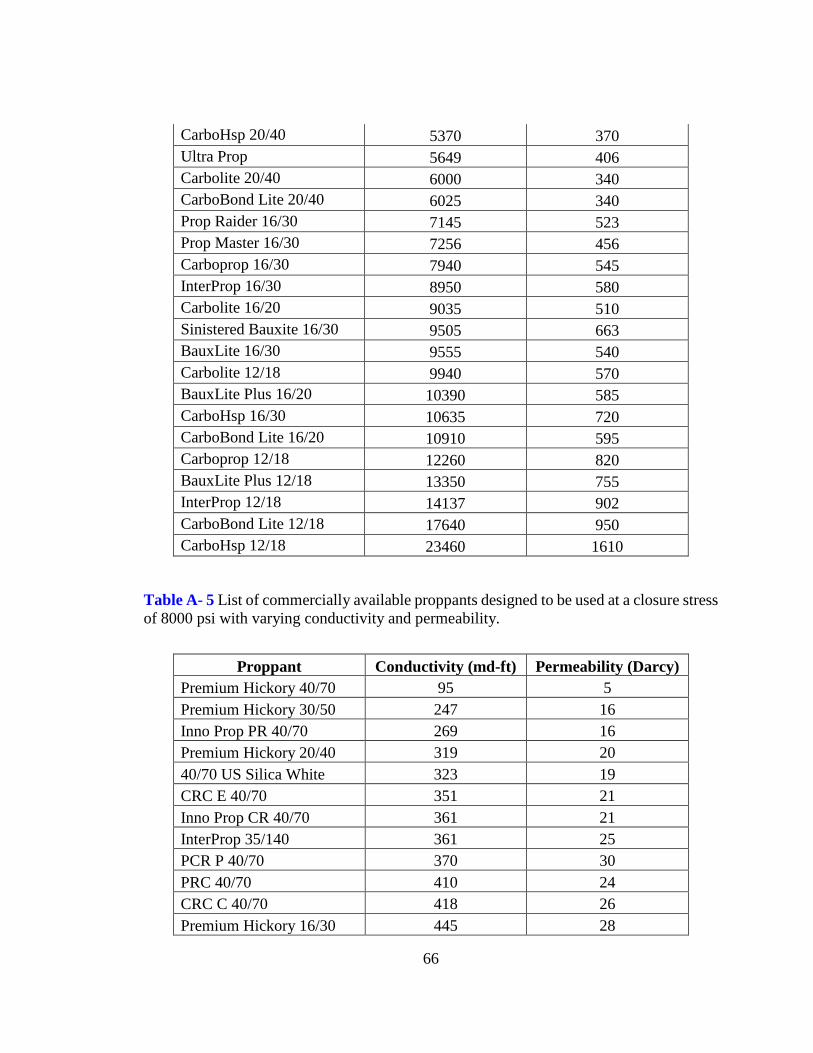
Table A- 5 List of commercially available proppants designed to be used at a closure stress of 8000 psi with varying conductivity and permeability. ............... 66
Table A- 6 List of commercially available proppants designed to be used at a closure stress of 10000 psi with varying conductivity and permeability. ............. 69
Table A- 7 List of commercially available proppants designed to be used at a closure stress of 12000 psi with varying conductivity and permeability. ............. 71
Table A- 8 List of commercially available proppants designed to be used at a closure stress of 14000 psi with varying conductivity and permeability. ............. 73
Table A- 9 List of commercially available proppants designed to be used at a closure stress of 16000 psi with varying conductivity and permeability. ............. 74
Table A- 10 List of commercially available proppants designed to be used at a closure stress of 18000 psi with varying conductivity and permeability. ............. 74
Table B- 1 Estimated number of hydraulic fracturing establishments. ....................... 75
Table B- 2 Number of hydraulic fracturing workers exposed to silica level greater than 50 μg/m3. ....................................................................................................... 75
Table B- 3 Distribution of typical hydraulic fracking crew by function and number of workers exposed to silica level greater than 50 μg/m3. ....................... 76
Table B- 4 Consumer Price Index-All Urban Consumers for Medical Care in the USA. ..................................................................................................................... 76
ix
ACKNOWLEDGEMENTS
To my inspiration, and grandfather Satyanarayan Agrawal: you are dearly missed.
Firstly, I would like to express my sincere gratitude to my advisor, Dr. Jeremy M.
Gernand for his continuous support, patience and encouragement during my graduate
study and related research. His guidance and expert knowledge steered my research in the
right direction and helped me in writing this thesis. I enjoyed the insightful discussions
we had during our weekly meetings, which played a huge role in the completion of this
thesis. I could not have imagined having a better advisor for my graduate study.
I would also like to thank the rest of my thesis committee members, Prof. Sanjay
Srinivasan, and Dr. Mort Webster for their precious time. Their comments and
perspective have been invaluable in widening the scope of the research. My sincere
thanks also go to Prof. Jeffery Kohler, Dr. Jamal Rostami and Dr. John Wang, who
provided me an opportunity to work with them as a graduate assistant. I would like to
thank Ms. Jaime Harter for her endless support throughout my graduate study. I would
also like to thank all the administrative staff at Energy and Mineral Engineering
department who have always been jovial and helpful.
A heartfelt gratitude to all the amazing people I met and friends I made during
this journey. I could not have completed this journey without the love and support of
these people. Special mention to Aniket Sakpal, and Shrey Arora who has been a family
to me during my time here at Penn State.
Last but not the least; I would like to thank my parents, Saroj, and Shanti, my
sisters, Shikha, and Amrita, and my brother-in-law Amit for their unconditional love,
x
support, and encouragement. None of this would have happened without their motivation
and support.
Chapter 1
Introduction
Treatment of wells using proppants in hydraulic fracturing has been recorded as
early as the early 1940s [1]–[3]. With the advent of the shale gas boom at the dawn of the
twenty-first century, hydraulic fracturing operations have increased substantially and
various proppants have been developed to achieve higher production in deeper wells.
Waxman et al. (2011) in their report have indicated the development of over 2,500
different proppants between 2005 and 2009 made up of different substances [4].
Numerous proppants with different combinations of technical capabilities are available
which can be used for different deposits based on the closure stress, permeability of the
deposit and required conductivity. Horizontal drilling technology has further incentivized
the proppant industry to develop proppants with high conductivity which can effectively
keep the fractures open at high closure stress. In particular, ceramic proppants have been
developed to be used in deeper wells having higher closure stress and resin coated
proppants for increased conductivity. [5]
Various proppant types are readily available to meet the varying technical
requirements like closure stress, permeability, and conductivity to maximize production.
Choice of the optimal proppant is important in any hydraulic fracturing site for
maximizing production. However, the cost and availability of proppant appear to play an
important role in determining the economics of any fracturing site as it can constitute a
significant portion of the total cost of well treatment [5]. Despite the development of
2
different types of proppant, sand continues to be the most widely used proppant [1][5].
Reports show that from the early 1940s to 2010, sand dominated the proppant use with
over 99% of fractured wells using sand as a proppant [6]. The proportion of sand in the
proppant quantity placed in various non-conventional shale basins in U.S during 4
consecutive quarters in 2013 and 2014 is over 90% [7] (Figure 1-1).
Figure 1-1 Estimated fracture sand consumption among major U.S. unconventional oil and gas shale basin. The estimated share of fracture sand to total proppant consumed in ten major non-conventional fields was over 90 percent for all the fields except Bakken (Data from [7])
3
Among the different types of proppant used in the hydraulic fracturing industry
from the year 2001 to 2010, over 99% of the total types of proppants reported were silica-
based (Figure 1-2). Available research indicates the risks of silica on human health from
exposures similar to that of hydraulic fracturing. Studies have confirmed the presence of
respirable crystalline silica beyond the Occupational Safety and Health Administration
PEL (Permissible Exposure Limit) and National Institute for Occupational Safety and
Health REL (Recommended Exposure Limit) at hydraulic fracturing sites, which likely
indicate health hazards for workers [8]. Personal breathing zone samples collected from
11 hydraulic fracturing sites by researchers from National Institute for Occupational
Safety and Health showed that over 68 % of the people working at these hydraulic
fracturing sites were exposed to more than 50 μg/m3 of respirable silica, the NIOSH REL
and OSHA PEL [9].
4
Figure 1-2 Number of different types of silica and non-silica-based proppants by year [10]. The number of different types of silica-based proppants used between 2001 and 2010 far exceeds the number of different types of non-silica-based proppants.
Proppant demand is expected to increase in the future and with rising use of silica-based
proppants. This study examines the health risks and project tradeoffs of replacing silica-
based proppants with other commercially available proppants. Reports show that the
proppant supply increased by over 50% in the year 2014 as compared to 2013 [11] which
was synchronous with an increase in gross natural gas production in the year 2014 as
compared to 2013. Further, reports from the U.S. Energy Information Agency predicts
that the natural gas production in the United States is expected to increase by 5.8 billion
5
cubic feet per day in the year 2018 as compared to production of 73.7 billion cubic feet
per day in 2017 [12]. Moreover, the U.S. Energy Information Administration (EIA)
expects an increase of 45% in the production of dry gas by the end of 2045 [13]. With
demand expected to soar in future years [14], the use of silica-based proppant is expected
to rise in the future. With different kinds of proppants (ceramic, bauxite, and resin-
coated) now being developed and used [15]–[17], this research examines how the
potential use of these proppants in place of silica-based proppants may reduce
occupational health-related costs. The choice of proppant is solely based on its
performance and direct economic costs and benefits. This paper seeks to determine the
health impact of various proppants choices and determines the costs related to exposure
to such proppants. Further, the paper quantifies the economic impact of proppant
selection not only based on its engineering performance and cost of proppant but also
including the health-related costs associated with worker exposure to such substances.
6
Chapter 2
Literature Review
Hydraulic fracturing was first introduced nearly 70 years ago, and since then it is
estimated that over 2.5 million wells have been hydraulically fractured [1]. U.S Energy
Information Agency reported that in the year 2016, nearly two-thirds of the total natural
gas production in the United States was from hydraulically fractured wells [18] and it is
expected to grow in future. A successful fracture depends on various factors and several
studies have been conducted to maximize productivity. Proppant selection contributes
substantially to the outcome of any fracturing operation. This chapter introduces
hydraulic fracturing process, proppants, and its selection process. Further, it reviews the
relevant research done in the past for optimal selection of proppants and presents the
motivation and objective of this research.
2.1 Hydraulic Fracturing
Hydraulic fracturing is a technology used since the mid-twentieth century [1]–[3], [19] to
create a network of interconnected openings for increased production and productivity
[20]–[22]. Proppant and fluids along with additives are injected to fracture the sub-strata
to create openings for movement of gas and oil [23], [24]. The fracturing fluid is pumped
into the wells at a pressure higher than the sub-strata pressure to keep it open [3], [24].
Proppants are then injected into the wells to keep the fractures open to allow the flow of
7
gas and oil [24]. A typical hydraulic fracturing process is shown in Figure 2-1. The
diagram shows the process of hydraulic fracturing wherein a mixture of water, proppants
and chemicals are injected at high pressure to create fissures and keep them open.
Figure 2-1 Hydraulic Fracturing Process [23]–[25]. Used by permission.
Since the first recorded fracturing in 1947 [2], [5], there has been a substantial
increase in the number of wells hydraulically fractured and with the shale gas boom at the
dawn of the twenty-first century [24]–[27], there has been significant increase in number
8
of gas wells hydraulically fractured. Figure 2-2 shows the trend in the number of wells
hydraulically fractured since 1947 to 2010. Close analysis of this activity shows that the
number of gas well fractured between 2000 to 2010 has increased substantially (Figure
2-2).
Figure 2-2 Number of wells hydraulically fractured from 1947 to 2010 (Data from [10])
2.2 Proppants
Proppants are essential in hydraulic fracturing to keep the fractures open for
increased productivity [5]. Sand was first used as proppant in 1947, and since then
different materials like ceramic, bauxite, resin coated, walnut hulls, and gravel have been
reported to be used as proppant material [10], [28]. In the recent past, the major broad
9
categories of proppants manufactured and used in hydraulic fracturing industry have been
ceramic-based, silica-based, resin-coated sand, and bauxite-based proppant [5], [15]–
[17], [19].
Silica-based proppant, commonly called as ‘frac sand’ or ‘silica sand’ is the most
commonly used proppant which was first used in 1947 [5], [7], [15], [19]. Silica-based
proppant is typically used in shallow wells having closure stress below 6000 psi [29]. At
higher closer stress, the sand particles are crushed due to the high pressures thereby
closing the fractures and rendering it ineffective. Data show that silica sand captured over
85 percent of North American proppant market by weight and 95 percent of all fractured
wells in the year 2013 [7].
Ceramic-based proppants were first introduced in the year 1983 and resin-coated
proppant was used in 1984 [30]. Resin-coated proppant has better performing
characteristics as compared to sand because it offers higher resistance to closure stress as
compared to sand and thus reduces proppant crushing. This, in turn, provides higher
conductivity and permeability. [7]. Ceramic proppants are typically used in deeper wells
where fractures are subject to higher closure stress [29], [31] as it offers even higher
resistance to closure stress as compared to resin-coated proppant.
10
Figure 2-3 Ceramic proppant (CARBOEconoprop 20/40, a high-conductivity, lightweight ceramic proppant from CARBO Ceramics)
2.3 Selection of Proppants
Selection of proppant is key to achieving a successful fracture for improved
productivity [32]. With various proppant types commercially available, the total proppant
cost and the combination of technical specifications are the basic criteria for selection of
proppant [19], [29], [31], [33]–[35]. Several studies have been conducted to determine
the optimum choice of proppant.
Proppant selection has been addressed as early as in 1985 when Montgomery et.
al. (1985) studied various factor governing successful fracturing operation. The study
found that the selection of proppant depends on the well formation and fracture
11
conductivity [33]. Vincent (2002) reviewed 80 field studies to determine the factors for
increased productivity and found that increase in fracture conductivity increases well
production [31]. Fracturing treatments were reviewed in the Fayetteville Shale, Bakken
Shale and Haynesville Shale by Terracina et. al. (2010) which not only studied the
importance of conductivity, cost and availability of proppant for optimal proppant choice
but also conducted studies to determine the optimal proppant for these fields through a
combination of field data and laboratory experiments [34].
The cost of proppant also significantly affects the choice of proppant. Studies
show that the cost of proppant could be as low as 10% to over 50% of the total well
treatment cost depending on the size of the treatment and the proppant choice [5]. Mack
et. al. (2013) have shown that use of advanced ceramic proppants increases production
and net present value in low-permeability reservoirs [36]. Yang et. al. (2013) discuss the
design flaws in proppant selection and conclude that natural sand proppants are
economically more viable than synthetically manufactured proppants i.e. bauxite and
ceramic-based proppants in Permian basin in Texas [37]. The effect of formation type,
well depth and the fracture job size was studied for well in the Texas shale plays and it
was found that natural brown sand resulted in higher net present value (NPV) in
reservoirs with closure stress less than 6,000 psi as compared to ceramic proppants [29].
All these studies optimized the choice of proppant not only based on the technical
requirements but also financial returns, but none of the studies incorporated the health-
related costs in their analysis.
12
2.4 Motivation for the Study
Many researchers have reported the presence of toxic air pollutants at oil and gas
development sites like Nitrogen Oxides (NOx) Volatile Organic Compounds (VOCs) and
of work crew to crystalline silica in 11 hydraulic fracturing site collecting 111 personal
breathing dust samples. Results showed that over 83 percent samples exceeded crystalline
silica concentration beyond American Conference of Governmental Industrial Hygienists
Threshold Limit Value (ACGIH TVL) of 0.025 mg/m3, 68 percent exceeded crystalline
silica concentration beyond National Institute for Safety and Occupational Health
Respirable Exposure Limit (NIOSH REL) of 0.05 mg/m3, and 57 percent were exposed
to crystalline silica concentration beyond Occupational Safety and Health Administration
Permissible Exposure Limit (OSHA PEL) of 0.1 mg/m3 [9]. It should be noted that with
the change in OSHA PEL from 0.1 to .05 mg/m3, the percent of samples exposed to silica
level above current OSHA PEL is 68%. This silica comes from the handling of proppants
on site.
Figure 2-4 shows the presence of respirable crystalline silica beyond the OSHA
PEL, NIOSH REL and ACGIH TVL at different hydraulic fracturing sites. All the sites
except Bakken reported 62 to 85 percent of total samples exceeding the OSHA PEL.
Only one sample out of ten collected in Bakken reported respirable silica to be beyond
OSHA PEL. This can be attributed to the fact that over 60% of proppants used in the site,
during sampling were ceramic-based proppant [9].
13
Figure 2-4 Percentage of sample collected at various hydraulic fracturing sited having silica exposure levels above the National Institute for Safety and Occupational Health Respirable Exposure Limit (NIOSH REL), Occupational Safety and Health Administration Permissible Exposure Limit (OSHA PEL) and American Conference of Governmental Industrial Hygienists Threshold Limit Value (ACGIH TVL) (Data from [9]).
Available research indicates that there are risks to human health due to silica
exposure and this study conducts a cost-benefit analysis to examine if silica-based
proppant can be replaced by alternate proppant to reduce health impacts on workers in
hydraulic fracturing industry.
14
2.5 Objective of the Study
The optimal choice of proppants is attributed to technical requirements and
economic considerations and many researchers have recommended various selection
process to maximize productivity and NPV. But as far as the knowledge of the author, no
study has been conducted to select the optimal proppant taking into consideration health-
related cost incurred due to worker exposure to such proppants. This research focuses on
quantifying the health-related economic impacts of the use of various proppant types.
Further, the study develops a decision tree to choose the most optimal proppant by taking
into consideration both the technical and internal and external financial implications of
their use.
Chapter 3
Methodology
3.1 Data Collection
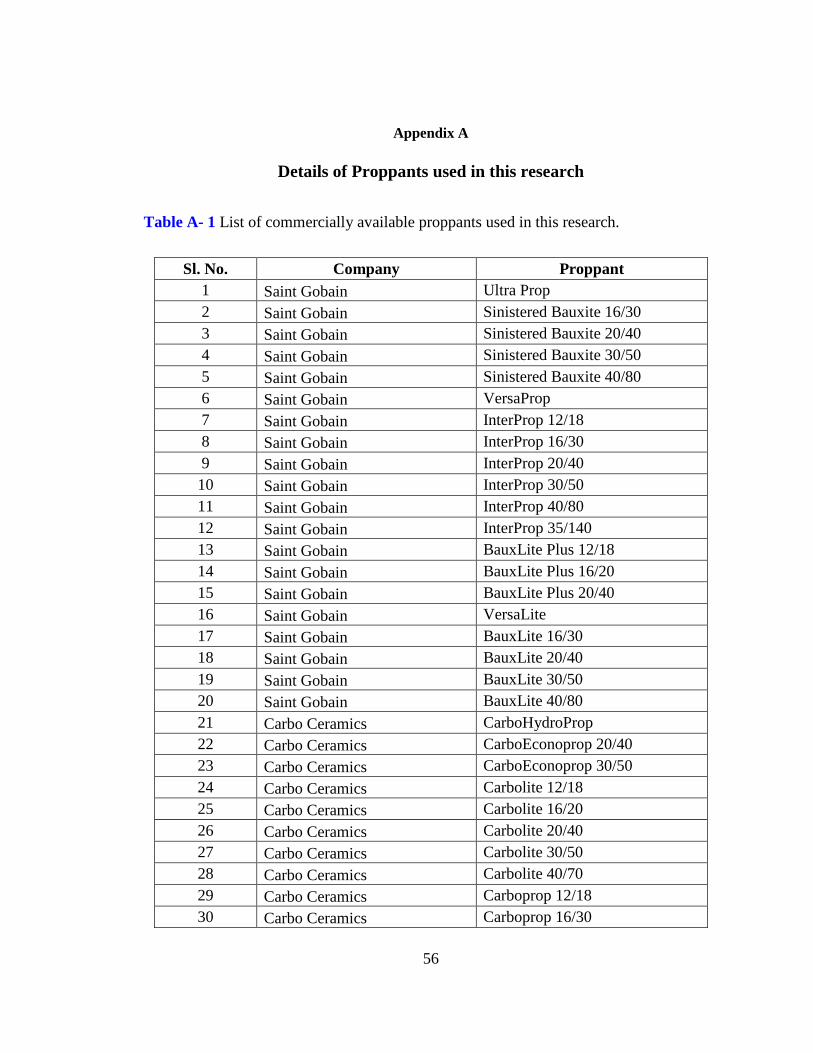
The first step involved the compilation of a database of different proppants
commercially available in the market. Material Safety Data Sheets (MSDS) and
Technical Data Sheets of 94 commercially available proppants were collected from the
websites of different companies. The technical parameters like the ranges of closure
stress, and the corresponding conductivity and permeability for each proppant was
collected from the technical data sheets and a database of such proppants was created
including their name. The fracture conductivity is the product of the permeability of the
proppant and the width of the propped fracture. The chemical composition of each
proppant was assessed from the MSDS and included in the database as well. The
proppants were then divided into four major categories based on the material they were
made from, namely, ceramic-based (C), bauxite-based (B), resin-coated (RC) and silica-
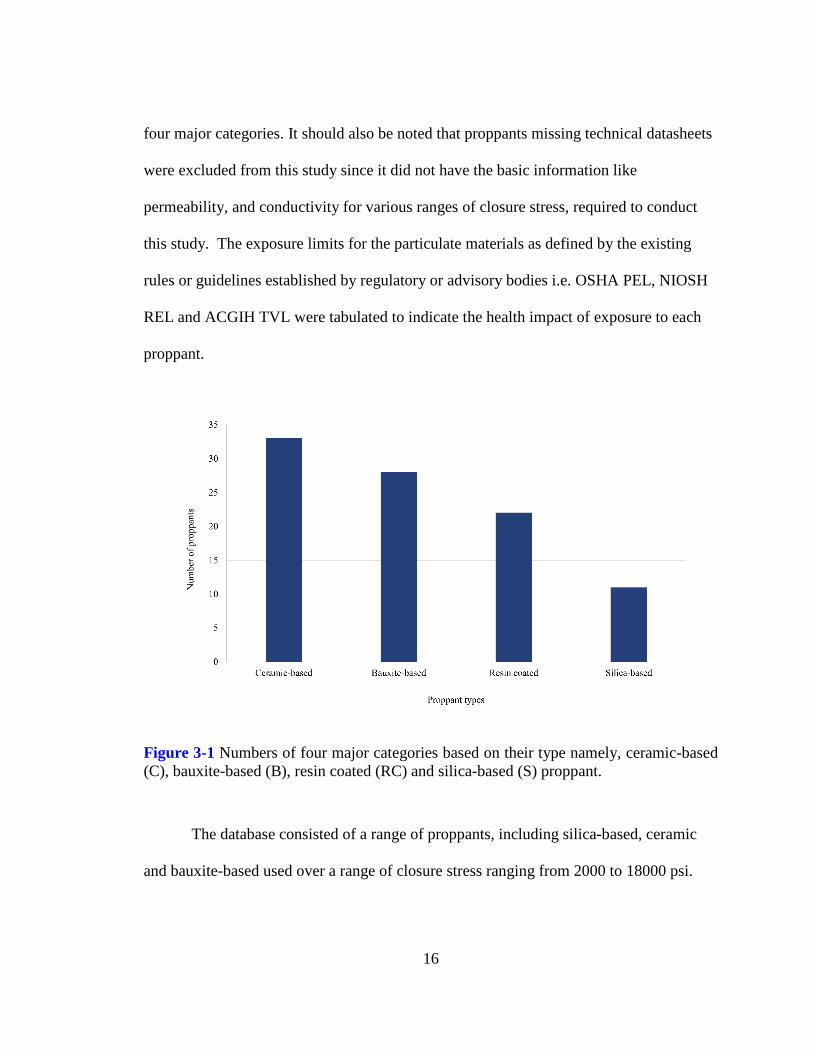
based (S) proppant. Figure 3-1 shows the number of proppant of each type included in
the study. The study incorporated 33 ceramic-based proppant, 28 bauxite-based proppant,
22 resin-coated proppant and 11 silica-based proppant. It should be noted that the
proppants with available MSDS and Technical Data Sheets were included in this study.
Further, 1 in 5 of the MSDS did not cite the exact composition of the proppant since they
are trade secrets but sufficient data was available to divide the proppants into one of the
16
four major categories. It should also be noted that proppants missing technical datasheets
were excluded from this study since it did not have the basic information like
permeability, and conductivity for various ranges of closure stress, required to conduct
this study. The exposure limits for the particulate materials as defined by the existing
rules or guidelines established by regulatory or advisory bodies i.e. OSHA PEL, NIOSH
REL and ACGIH TVL were tabulated to indicate the health impact of exposure to each
proppant.
Figure 3-1 Numbers of four major categories based on their type namely, ceramic-based (C), bauxite-based (B), resin coated (RC) and silica-based (S) proppant.
The database consisted of a range of proppants, including silica-based, ceramic
and bauxite-based used over a range of closure stress ranging from 2000 to 18000 psi.
17
The conductivity ranges from 60 to 42000 md-ft with a permeability range of 5 to 2750
Darcy (1 Darcy = 9.869233×10⁻¹³ m²).
Figure 3-2 Number of proppants available at different permeability ranges
Figure 3-3 Number of proppants available at different conductivity ranges
Analyzing the technical data sheet, it is found that for each combination of
permeability or conductivity with closure stress, there are multiple options available for
proppant selection. Figure 3-2 shows the number of proppants available at different
18
conductivity ranges and Figure 3-3 shows the number of proppants available at different
permeability range. It was found that there are more proppants available at intermediate
ranges of permeability and conductivity as compared to the higher values. Fracturing in
deeper wells in the recent past has led to the development of proppants with higher
ranges of permeability and conductivity.
3.2 Willingness-to-pay for Avoided Fatality and Morbidity
Willingness to pay for an avoided fatality is defined as the money an individual is
willing to pay to avoid a marginal increase in the risk of fatality [41]. It has been studied
by various researchers and statistically robust estimates have been given Hintermann et.
al. [42]. Extensive analysis of various studies conducted to determine the values of
statistical life in U.S labor market has been done by Viscusi and Aldy and they have
estimated that the mean willingness to pay for avoided fatality to be $7 million in 2000
dollars [43]. Over the past decade and a half, OSHA has used the willingness to pay
method for calculating the benefits of reduced risk in proposing various rules [8], [44],
[45]. The benefit of avoided fatality has been estimated to be $8.7 million in 2009 dollars
[41]. Using the Consumer Price Index for Medical care [46], the cost of each avoided
fatality has been calculated to be approximately $10.2 million in 2015 dollars, the base
year for this analysis.
Working in an environment with respirable silica dust leads to a number of related
illnesses like cancer, silicosis, and renal diseases and the costs of such illness needs to be
determined. Since the intensity and duration of these illnesses vary in each case, a
19
number of studies are taken into consideration when evaluating the monetary value for
non-fatal illness [41]. Studies have shown that the cost of treating non-fatal form of lung
impairment in 2008 dollar value is $460,000 [41]. The cost of treating each case of the
renal disease was estimated to be approximately $620,000 in 2002 dollars [41]. Using the
willingness to pay method, OSHA has estimated the cost of various non-fatal illness
avoided to lie in a range of $62,000 to $5.1 million in 2009 dollar value [41]. We have
used this range of values in our studies since this value has been used by OSHA to
calculate the willingness to pay for avoided non-fatal illness for proposed rulemaking for
occupational exposure to crystalline silica. Using the Consumer Price Index for medical
care [46], the cost of each non-fatal illness (silicosis, lung cancer, and renal disease) has
been calculated to lie between $72,000 and $5.95 million in 2015 dollars.
3.3 Willingness-to-pay for Avoided Fatality and Morbidity for One Hydraulic Fracturing Crew
OSHA estimated that a typical hydraulic fracturing crew consists of 16 members
assigned to different jobs [41]. Table 3-1 shows the distribution of typical hydraulic
fracturing crew based on their job description.
20
Table 3-1 Number of people in a typical hydraulic fracturing crew based on their job description.
Primary Function Estimated number of workers per site
Sand Mover Operator 5
Conveyor Belt Tender 1
Blender Tender 2
Hydraulic Unit Operator 1
Water/ Chemical Hands 2
Pump Operator Technicians 3
Supervisor 1
Ground Guide 1
Total Employees 16
No study has been conducted to estimate the number of fatalities & non-fatal
illnesses due to crystalline silica exposure higher than the prescribed exposure limit of 50
μg/m3 by OSHA for at-risk workers at a hydraulic fracturing site. Occupational Safety
and Health Administration in their study of preliminary economic analysis and initial
regulatory flexibility analysis estimated that around 16,000 workers in hydraulic
fracturing industry are exposed to silica levels of 50 μg/m3 [41]. To estimate the number
of fatalities and non-fatal illness due to exposure of these 16,000 workers to silica, we
assume that the ratio of number of fatality and non-fatal illness to the number of people
exposed to silica in hydraulic fracturing industry is similar to the construction and general
21
maritime industry. Using equations 1, 2 and 3, the cost of avoided fatality and non-fatal
illness was calculated for a hydraulic fracturing crew typically consisting of 16 members.
Pall = nallNall
∗ 100 (1)
Nall = Number of people exposed to silica of 50 μg/m3 in the United States in
construction and general and maritime industry (The estimated number of
workers exposed to silica levels of 50 μg/m3 in construction and general
maritime 770,000 workers [41]).
nall = Estimated number of fatality & non-fatal illnesses due to crystalline silica
exposure of 50 μg/m3 for at-risk workers over a 45-year working life in
construction and general maritime industry (Table 3-2).
Pall = Estimated percentage of fatal & non-fatal illnesses due to crystalline silica
exposure of 50 μg/m3 for at-risk workers over a 45-year working life.
22
Table 3-2 Estimated number of avoided fatalities & non-fatal illnesses due to a reduction in crystalline silica exposure of 50 μg/m3 for at-risk workers over a 45-year of working life [41]. OSHA applies the dose-response relationship to project the number of avoided fatality and non-fatal illness.
Using equation 1, we estimate the percentage of avoided fatalities and non-fatal
illnesses resulting due to a reduction in crystalline silica exposure of 50 μg/m3 for at-risk
workers over a 45-year of working life which is shown in Table 3-3.
Total estimated number of avoided cases in U.S. general maritime and construction
industry due to reduction of silica exposure to 50 μg/m3
Lung Cancer
High 12000
Mid 7000
Low 2000
Silicosis & Other Non-Malignant Respiratory Diseases 17000
End-stage Renal Diseases 7000
Total Number of Fatal Illness Prevented
High 36000
Mid 31000
Low 26000
Total Number of Silicosis Morbidity Cases Prevented 71000
23
Table 3-3 Estimated percentage of avoided fatalities & non-fatal illnesses due to reduction in crystalline silica exposure of 50 μg/m3 for at-risk workers over a 45-year of working life
nhf = (Pall*Nhf)/100 (2)
Nhf = Number of people exposed to silica over 50 μg/m3 over years in the United
States in one hydraulic fracturing site (Table 3-4).
Estimated percent of avoided cases of fatalities and non-fatal illness in U.S. general maritime and construction industry due to reduction of silica
exposure to 50 μg/m3
Lung Cancer
High 1.60
Mid 0.95
Low 0.30
Silicosis & Other Non-Malignant Respiratory Diseases 2.20
End-stage Renal Diseases 0.90
Total Number of Fatal Illness Prevented
High 4.65
Mid 4.00
Low 3.40
Total Number of Silicosis Morbidity Cases Prevented 9.25
24
nhf = Estimated number of fatality & non-fatal illnesses due to crystalline silica
exposure of 50 μg/m3 for at-risk workers over a 45-year working life in one
hydraulic fracturing site.
The number of workers exposed to silica levels of 50 μg/m3 or more in a typical
hydraulic fracturing crew is shown in Table 3-4.
Table 3-4 Number of affected workers exposed to silica level of 50 μg/m3 or more in a typical hydraulic fracturing crew.
Classification by Function Numbers of Affected Workers Exposed to Silica level of 50 μg/m3
Sand Mover Operator 4.55
Conveyor Belt Tender 1.00
Blender Tender 1.73
Hydraulic Unit Operator 0.50
Water/ Chemical Hands 1.00
Pump Operator Technicians 1.00
Supervisor 0.50
Ground Guide 0.50
Total 10.79
Using equation 2, it is estimated that the number of workers prone to non-fatal
illness because of exposure to silica level of 50 μg/m3 or more for at-risk workers over a
45-year working life in one hydraulic fracturing crew is 1 in every 16 workers. Similarly,
25
the number of workers prone to fatality in a typical hydraulic fracturing crew is
calculated to be 1 in every 48 workers.
c = (nhf*a) (3)
a = Willingness-to-pay for avoided fatality and silica-related disease (As
calculated using the Consumer Price Index, US Department of Labor, BLS).
c = Total Cost for fatality and non-fatal illness for one typical fracturing crew.
Using equation 1-3, the total cost of fatality and non-fatal illness for a typical
hydraulic fracturing crew was calculated to lie in the range of $3.8 million to $11 million,
in 2015 dollar value (Table 3-5).
Table 3-5 Estimated cost of fatalities & non-fatal illnesses due to crystalline silica exposure of 50 μg/m3 for at-risk workers over a 45-year of working life for one typical fracturing crew.
Total Cost (In millions)
Total Cost for Fatal Illness
High $5.10
Mid $4.40
Low $3.70
Total Cost of non-fatal illness (Low) $0.07
Total Cost of non-fatal illness (High) $5.94
Total Cost of fatality and non-fatal illness (Low) $3.80
Total Cost of fatality and non-fatal illness (High) $11.00
26
The willingness to pay for avoided fatality and non-fatal illness was calculated for
silica exposure of 50 μg/m3 using silica-based proppants. The alternate proppants like
ceramic and bauxite based are made up of several materials like aluminum oxide,
magnesium iron silicate, magnesium silicate, and aluminum silicates which also pose
threat on exposure. The American Conference of Governmental Industrial Hygienists
Threshold Limit Value (ACGIH TVL) exposure limit to such materials is given in Table
3-6. We use the ACGIH TVL because ACGIH has defined an exposure limit for each
these materials. But, these are not regulatory limits, which compromise the promotion of
worker health with the technological and economic feasibility of the limit (such as
OSHA’s permissible exposure limit).
Table 3-6 Material exposure limit as per American Conference of Governmental Industrial Hygienists Threshold Limit Value (ACGIH TVL)
Material/Chemical Name ACGIH TVL Limit
Silica 0.025
Aluminum Oxide 3.000
Aluminum Silicate 3.000
Magnesium Silicate 2.000
Since no studies have been conducted to calculate the costs of exposure to these
proppants, equation 4 was used to calculate the costs of exposure for the proppants made
up of these materials. This assumes that other particulate substances cause fatalities and
non-fatal illnesses in proportion to an individual’s exposure relative to the recommended
exposure limit of that substance. For instance, a person exposed to 50% of the REL for
27
silica will be at the same probability of developing a fatal illness as a person exposed to
50% of the REL for another substance. The cost of fatalities and non-fatal illnesses for a
proppant was expressed as the sum-product of the percentage of chemicals in the
proppant and the ratio of the exposure limit of silica to that of the chemical, multiplied by
the range of exposure-related cost for silica exposure.
�𝐸𝐸𝑠𝑠E1∗ 𝑐𝑐1 + 𝐸𝐸𝑠𝑠
𝐸𝐸2∗ 𝑐𝑐2 + 𝐸𝐸𝑠𝑠
𝐸𝐸3∗ 𝑐𝑐3 + ⋯� ∗ 𝐶𝐶 (4)
Where
Es – Exposure limit of silica ( 0.025 mg/m3) as per ACGIH TVL.
C - Cost of fatality and non-fatal illness due to silica exposure of 50 μg/m3
En - Exposure limit of chemical ‘n’ in mg/m3 (Table 3-6)
cn - Percentage of chemical ‘n’ in the proppant
Equation (4) calculates the cost of fatality and non-fatal illness as a result of
exposure to harmful particulates associated with various commercially available
proppants.
Chapter 4
Analysis and Results
4.1 Cost of fatalities and non-fatal illness for various proppants
The cost of fatalities and non-fatal illnesses is the estimated cost of exposure to
the various materials in the proppant. This cost was calculated for the four broad
categories of proppants using equation (4). Table 4-1 shows the cost of fatalities and
non-fatal illnesses for exposure to various proppant types. Our calculations assume that
the particulate size distributions for fugitive dust emission from the various proppant
types are similar. Moreover, we assume that the biological effect from to exposure to
these materials is similar, though not the potency, or the risk of illness due to exposure to
the same amount or dose of each material. We calculate a range of estimated cost of
fatality and non-fatal illness based on the estimated cost of fatality and non-fatal illness
due to exposure to silica (Table 3-5).
29
Table 4-1 Cost of fatalities and non-fatal illness for various proppant types. The cost of fatalities and non-fatal illness is negligible for ceramic and bauxite based proppant as compared to silica-based proppant.
Proppant Category Range of cost of fatalities and non-fatal illness (In millions)
Silica-based $3.80 to $11.00
Resin-coated $3.80 to $11.00
Bauxite-based $0.03 to $0.09
Ceramic-based $0.04 to $0.12
It shows that the cost of fatalities and non-fatal illness for both silica-based
proppant and resin-coated silica proppant was equal since the silica content in both
proppant types as reported in the MSDS were equal. The cost of fatalities and non-fatal
illnesses for ceramic-based proppant and bauxite-based proppant were around 0.1% of
the silica-based proppant. The range of cost of fatality and non-fatal illness or health-
related cost for using different kind of proppants is shown in Figure 4-1. The range of
cost of fatality and non-fatal illness for silica-based proppant is approximately 1,100
times higher than that of ceramic-based and bauxite-based proppant.
30
Figure 4-1 Cost of fatality and non-fatal illness for different proppant types. The range of cost of fatality and non-fatal illness is approximately 1100 times higher for silica-based proppant as compared to ceramic and bauxite based proppant.
4.2 Silica exposure in hydraulic fracturing industry
Research shows that approximately 17,000 people are directly involved in
hydraulic fracturing industry out of which nearly 50% workers are exposed to silica
levels over 50 μg/m3 [41]. Assuming that the percentage of fatality and non-fatal illness
due to silica exposure in hydraulic fracturing industry is similar to that in general
maritime and construction industry for same silica exposure levels it is estimated that 1 in
16 workers are prone to non-fatal illness. We also estimate that 1 in 30 to 1 in 48 workers
are prone to fatal illness due to exposure to silica in a typical hydraulic fracturing crew.
Table 4-2 shows the estimated number of fatality and non-fatal illness due to crystalline
silica exposure of 50 μg/m3 for at-risk workers over a 45-year of working life in hydraulic
fracturing industry.
31
Table 4-2 Estimated number of fatality & non-fatal illnesses due to crystalline silica exposure of 50 μg/m3 for at-risk workers over a 45-year of working life in hydraulic fracturing industry.
Total Number of avoided cases in
hydraulic fracturing industry
Total Number of avoided cases in a typical hydraulic
fracturing crew
Lung Cancer
High 260 0.17
Mid 155 0.10
Low 50 0.034
Silicosis & Other Non-Malignant Respiratory Diseases
358 0.236
End-stage Renal Diseases 144 0.095
Total Number of Fatal Illness Prevented
High 760 0.502
Mid 656 0.433
Low 552 0.365
Total Number of Silicosis Morbidity Cases Prevented
1512 0.999
4.3 Sensitivity Analysis
To determine the effect of changes in the cost of proppant materials, the quantity
of proppant handled by a typical hydraulic fracturing crew each year and the cost of
32
avoided fatalities and non-fatal illnesses, we conducted sensitivity analysis to determine
the effect of variation in these components to the total cost (includes the cost of proppant
and the cost of avoided fatality and non-fatal illness) of using different proppant type. For
carrying out the sensitivity analysis, the quantity of proppant handled by a typical
hydraulic fracturing crew was varied from 10,000 to 100,000 tons per year. To determine
the impact of the cost of fatality and non-fatal illness, different ranges of the expected
cost of realized fatality and non-fatal illness were used as calculated in Table 4-1.
Table 4-3 lists the average cost per ton (in $) of each proppant [19] and the
expected cost of realized fatalities and non-fatal illness (in $). The expected cost of
realized fatality and non-fatal illness per ton of proppant used has been calculated based
on the assumption that the average quantity of proppant handled by each crew every year
is 60,000 tons.
Table 4-3 Average cost per ton and the average cost of fatality and non-fatal illness for proppant for a typical hydraulic fracturing crew.
Proppant Type Average cost per ton
Expected cost of realized fatalities and non-fatal
illness
Expected cost of realized fatalities
and non-fatal illness per ton of proppant used
Silica Based $ 275 $ 7.40 million $ 123.00
Bauxite Based $ 400 $ 0.061 million $ 1.01
Ceramic Based $ 475 $ 0.072 million $ 1.20
33
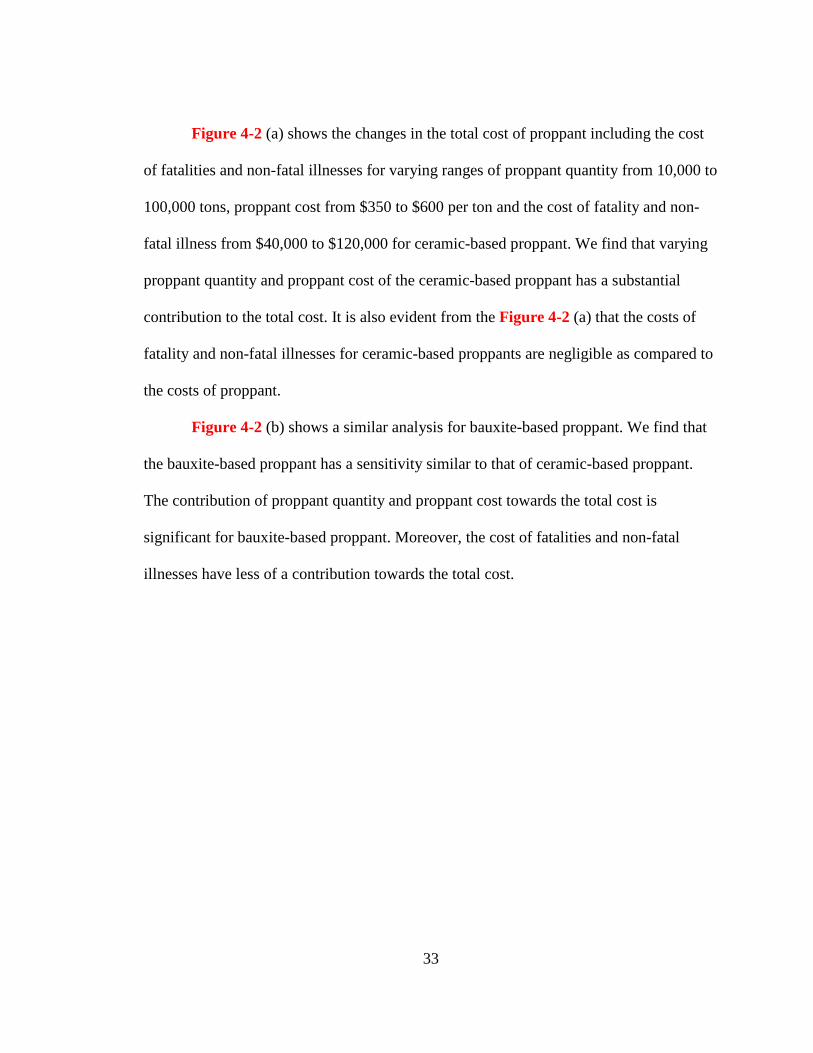
Figure 4-2 (a) shows the changes in the total cost of proppant including the cost
of fatalities and non-fatal illnesses for varying ranges of proppant quantity from 10,000 to
100,000 tons, proppant cost from $350 to $600 per ton and the cost of fatality and non-
fatal illness from $40,000 to $120,000 for ceramic-based proppant. We find that varying
proppant quantity and proppant cost of the ceramic-based proppant has a substantial
contribution to the total cost. It is also evident from the Figure 4-2 (a) that the costs of
fatality and non-fatal illnesses for ceramic-based proppants are negligible as compared to
the costs of proppant.
Figure 4-2 (b) shows a similar analysis for bauxite-based proppant. We find that
the bauxite-based proppant has a sensitivity similar to that of ceramic-based proppant.
The contribution of proppant quantity and proppant cost towards the total cost is
significant for bauxite-based proppant. Moreover, the cost of fatalities and non-fatal
illnesses have less of a contribution towards the total cost.
34
Figure 4-2 (a) Sensitivity analysis for ceramic-based proppants. The total combined cost is negligibly affected by the change in the cost of fatality and non-fatal illness as compared to proppant quantity and the proppant cost. (b) Sensitivity Analysis for bauxite based proppants. The total combined cost is negligibly affected by the change in the cost of fatality and non-fatal illness as compared to proppant quantity and the proppant cost. (c) Sensitivity Analysis for silica-based proppants. The change in the cost of fatality and non-fatal illness has a substantial effect on the total cost.
Figure 4-2 (c) shows the sensitivity of total cost to changing proppant quantity, proppant
cost and cost of fatality and non-fatal illness for silica-based proppants. We find that the
cost of fatality and non-fatal illness was a significant contributor to the total cost unlike
the ceramic and bauxite-based proppants. The cost of the proppant material was also a
significant contributor to the total cost.).
35
Figure 4-3 shows the cost of different proppants with increasing proppant
quantity without any external health-related costs. We find that the ceramic-based
proppant is the most expensive type whereas silica-based proppant is the cheapest
proppant available.
Figure 4-3 Comparison of cost of different types of proppants. The cost of silica-based proppant is lowest and the cost of ceramic-based proppant is highest.
With the addition of costs associated with fatalities and non-fatal illnesses for
each proppant, we compare the total combined cost i.e. cost of proppant plus the cost of
fatality and non-fatal illness for each proppant for varying values of proppant quantity
36
which is shown in Figure 4-4. For calculating the total combined cost, we take the
average cost of proppant and the average cost of fatality and non-fatal illness associated
with each proppant, as given in Table 4-3. We find that there is an increase in the total
combined cost with an increase in the proppant quantity. We find that for lower proppant
quantities, the total combined cost of bauxite and ceramic-based proppant are lower than
that of silica-based proppant. This indicates that for hydraulic fracturing crews handing
approximately less than 60,000 tons of proppant every year, ceramic and bauxite-based
proppants are more economical if the cost of fatality and non-fatal illness are taken into
overall cost consideration. We find that for crews handling approximately 55,000 tons of
proppant per year, the total combined cost for bauxite-based proppant is less than silica-
based proppant. The same is true for ceramic-based proppants. Ceramic-based proppants
are cheaper if the cost of fatality and non-fatal illness is added to the proppant cost for
crews handling less than 58,000 tons of resin coated silica-based proppant per year.
37
Figure 4-4 Comparison of total combined raw material and health cost for different types of proppants. The combined cost for bauxite based proppant is less than silica-based proppant and ceramic-based proppant has lower combined cost as compared to bauxite based proppant for crews handling slightly less than 60000 tons of proppants per year.
In practice, the selection of proppant material is based on the type of deposit,
performance of the proppant, and economics. A good proppant achieves required
conductivity and permeability for the given closure stress to create a good fracture for
sustained production. With the development of new engineered types of proppants,
various options are available to cater to these technical requirements.
The other factor considered during the selection of proppant is the cost of the
proppant since the cost of proppant can contribute anywhere from 10% to over 50% of
38
the total cost for any hydraulic fracturing operation [5]. Generally, a cost-benefit analysis
approach is used to determine the type of proppant used. Statistics show that over 99% of
the fracturing sites have used sand as proppant [1]. Studies suggest that sand-based
proppant should always be selected unless ceramic proppant justifies the economic
benefits [5]. But these studies do not take into consideration the health-related financial
implications of the use of sand-based proppants. So we develop a proppant selection
strategy map taking into consideration the technical requirements and the financial
implications associated with selection of any proppant.
From Figure 4-4 we already know that silica-based proppant and resin-coated
silica-based proppant can be replaced by bauxite-based proppant and ceramic-based
proppant respectively for fracturing crews handling approximately 60,000 tons or less of
proppant. Studies conducted by OSHA for the preliminary economic analysis and initial
regulatory flexibility analysis reported that there are approximately 17,000 workers
employed in hydraulic fracturing crew in the United States in 2013 [41] and reports show
that the total quantity of proppant used in hydraulic fracturing industry in 2013 was
approximately 33 million tons [11]. Based on this data, we estimate that the total quantity
of proppant handled by each hydraulic fracturing crew is approximately 31,000 tons
every year. Based on the threshold limit of 60,000 tons for using bauxite and ceramic-
based proppant and the estimated quantity of proppant handled by each fracturing crew,
we plot a proppant selection strategy map for hydraulic fracturing crew which handles
45,000 tons of proppant every year (Figure 4-5).
39
Figure 4-5 Proppant Selection Strategy Map. (a) Least expensive proppants available at various closure stress and permeability excluding financial implications of health into account. (b) Least expensive proppants available at various closure stress and permeability including financial implications of health into account. (d) Least expensive proppants available at various closure stress and conductivity including financial implications of health into account. (c) Least expensive proppants available at various closure stress and conductivity excluding financial implications of health into account.
Taking the financial implications of health-related costs into consideration, we
find that it is possible to replace silica-based proppants with less harmful and technically
equivalent ceramic and bauxite based proppants. To create the strategy plot, we
developed a database of commercially available proppants at 162 different ranges of
permeability (ranging from 0 to 1220 Darcy at an interval of 20 Darcy) and 208 different
ranges of conductivity (ranging from 0 to 18800 md-ft at an interval of 200 md-ft) for
40
given closure stress. The lowest-cost proppant was selected for each specific permeability
and conductivity ranges, which is represented in Figure 4-5 (a) and (c). Cost of fatalities
and non-fatal illness were then added to the proppant cost and the cheapest proppant for
the same range of permeability and conductivity was selected, which is represented in
Figure 4-5 (b) and (d). It was found that silica-based proppant could be replaced by
bauxite or ceramic based proppant for 32% and 26% of different ranges of permeability
and conductivity respectively.
This analysis found that silica-based proppants can be replaced with less harmful
bauxite and ceramic proppants for permeability range between 0 to 400 Darcy and
conductivity range between 0 to 6,000 md-ft. At higher conductivity and permeability
range, silica-based proppants are generally not a viable option due to technical constraints
so the inclusion of health implications into the decision-making process does not affect
the selection of proppant at higher ranges of conductivity and permeability.
Chapter 5
Discussion
This research was conducted to study the economic impact of the selection of
different proppant types in hydraulic fracturing industry based on the technical design
requirements and costs associated with them including the health-related costs related to
workers’ exposure to particulate matter created by handling such proppants. Several
previous studies in the field optimized the selection of proppant based on technical
requirements and cost-benefit analysis to maximize productivity and NPV [5], [32], [33],
[36], [47] but none of these analyses incorporated healthcare costs associated with worker
exposure to those proppants. This study focuses on incorporating health-related cost for
the socially optimal selection of proppant. This chapter summarizes the research,
discussing its findings, assumptions, and limitations, and outlining the future work.
5.1 Alternate proppants are available but rarely used
The database of commercially available proppants created for this study
demonstrated that multiple proppants types were available to cater similar technical
design requirement for most of the possible combinations of reservoir characteristics.
The historical pattern in proppant consumption for the hydraulic fracturing
industry shows that over 90% of the total proppants used for fracturing were silica-based
proppants (Figure 1-1). This indicates that silica-based proppants were given precedence
42
over other proppants due to their low upfront cost (since silica is no more functionally
beneficial than alternative materials, and the risks of exposure to silica have been well
known for some time). Bauxite and ceramic-based proppants were used in deep wells
with high closure stress since silica-based proppants crushes due to high stress in deep
wells rendering it ineffective.
5.2 Health-related Costs of Proppant Choice
To determine the health-related costs due to exposure to different proppant types,
we conducted a review of the literature to find their corresponding health-related costs,
especially costs related to exposure to silica-based proppant i.e. silica, which is
elaborated in chapter 3. Health-related costs of fatalities and non-fatal illnesses for a
typical hydraulic fracturing crew due to silica exposure was calculated to lie in the range
of $3.8 million to $11 million, in 2015 dollars (Table 3-5). We used the Consumer Price
Index for Medical care to calculate the value from various other basis years since it
closely reflected the changes in healthcare costs over time (Table in the appendix). This
health-related cost substantially increases the overall cost of using silica-based proppant
and changes the economic dynamics for proppant selection.
Further, it was found that the financial implications of silica-based proppants for
health-related costs were substantially higher as compared to ceramic or bauxite based
proppants (Table 4-1). The cost related to exposure to bauxite and ceramic-based
proppants were calculated using equation 4 since no research has been conducted to
calculate the direct cost related to exposure to these proppants. Several studies have been
43
conducted to determine the risks associated with exposure to bauxite and alumina dust
but none of these studies attribute any respiratory diseases, changes in lung functions or
incidences of cancer to exposure to bauxite or alumina dust.[48]–[52]. Determining and
differences in possible health-related costs due to exposure to these silica-alternative
proppants from field data was out of the scope of this research. The assumption that these
exposures could nonetheless lead to similarly costly diseases, though at a reduced
prevalence for a similar level of exposure, is reasonable under these circumstances.
5.3 Socially Optimal Proppant Selection
The review of available literature shows that silica-based proppant is given
precedence over bauxite and ceramic-based proppants due to its low upfront cost which is
half the cost or even lesser as compared to that of bauxite or ceramic-based proppants.
Drilling and fracturing companies apparently do not incorporate potential costs from
health risks into their decision-making because they do not bear most of these health-
related costs directly. The financial burden for most of the cases falls either to the family
of the employee, the government, the insurance company, or healthcare provider. These
externalities result in the over-use of silica, and an excess of silica-exposure-related
health impacts to those workers employed in the industry.
Studies show that over 68% of the crew are exposed to silica levels of more than
50 μg/m3 [9]. Such high exposure rate warrants analyzing the health-related cost due to
silica exposure and including such costs in the decision-making process. Incorporating
the health-related costs together with the proppant cost shows that silica-based proppants
44
(sand and resin-coated sand) could be replaced by alternative proppants like bauxite and
ceramic-based proppants for 29% of the different combinations of permeability and
conductivity (Figure 4-5) found in reservoirs. Moreover, silica-based proppants could be
replaced by either ceramic or bauxite based proppant for use in shallow wells wherein
each hydraulic fracturing crew handles approximately less than 60,000 tons of silica-
based proppant each year. For crews handling more, the costs of the more expensive
materials continue to outweigh the health-related costs of using silica.
It should be noted that this study does not include transportation costs and
geographic availability of different proppant types. The inclusion of transportation cost
and regional availability can significantly influence the choice of proppant. For example,
substantial transportation cost of silica-based proppant may encourage companies to use
safer bauxite or ceramic proppants owing to less overall cost. These results presented
here assume that such trades balance out in the end (silica alternatives are chosen due to
these reasons at the same frequency as silica proppants) and are not responsible for the
overall fraction of silica and silica alternatives actually used by the industry.
The recent rule revision by OSHA reducing the silica permissible exposure limit
to 50 μg/m3 may decrease the percentage of hydraulic fracturing crews exposed to silica
levels of 50 μg/m3, thereby reducing the health-related costs arising from exposure to
silica-based proppant. Studies estimate a reduction in 41 cases of silicosis morbidity and
9 to 14 cases of fatality as a result of this new ruling in hydraulic fracturing industry [41].
This reduction in cases of fatalities and non-fatal illness is due to the reduction of
exposure of workers in hydraulic fracturing industry from 100 μg/m3 to 50 μg/m3 for a
45
45-year working life for approximately 16,000 workers are exposed to silica level of 50
μg/m3.
5.4 Encouraging alternatives to Silica-based proppants
The inclination to use sand-based proppant is based on supply and availability, a cheaper
price per ton as compared to other materials, and acceptable, though not excellent
technical properties. Levying some sort of tax or fee for the use of silica-based proppants
could incline producers to internalize these costs and decide to use other proppants
instead of silica-based proppants. It is not uncommon for taxes to be levied on hazardous
substances, and environmental pollutants by both federal and state governments like gas
Remote/Intermittent Support Workers 8480 4893 57.70
TOTAL 25440 16327 64.18
76
Table B- 3 Distribution of typical hydraulic fracking crew by function and number of workers exposed to silica level greater than 50 μg/m3.
Estimated Number of Workers per site
Percent of Total Classification by Function
Numbers of Affected Workers Exposed to Silica level greater than
50 μg/m3
5 31.25 Fracturing Sand Worker in Central Area 4.55 1 6.25 Fracturing Sand Worker in Central Area 1.00 2 12.5 Fracturing Sand Worker in Central Area 1.73 1 6.25 Ancillary Support Worker 0.50