University of Central Florida University of Central Florida STARS STARS Honors Undergraduate Theses UCF Theses and Dissertations 2016 Quantifying The Success Of Eastern Oyster Pilot Reefs In Brevard Quantifying The Success Of Eastern Oyster Pilot Reefs In Brevard County, Florida County, Florida Lacie Anderson University of Central Florida Part of the Marine Biology Commons, Other Animal Sciences Commons, and the Other Ecology and Evolutionary Biology Commons Find similar works at: https://stars.library.ucf.edu/honorstheses University of Central Florida Libraries http://library.ucf.edu This Open Access is brought to you for free and open access by the UCF Theses and Dissertations at STARS. It has been accepted for inclusion in Honors Undergraduate Theses by an authorized administrator of STARS. For more information, please contact [email protected]. Recommended Citation Recommended Citation Anderson, Lacie, "Quantifying The Success Of Eastern Oyster Pilot Reefs In Brevard County, Florida" (2016). Honors Undergraduate Theses. 59. https://stars.library.ucf.edu/honorstheses/59
Transcript
University of Central Florida University of Central Florida
STARS STARS
Honors Undergraduate Theses UCF Theses and Dissertations
2016
Quantifying The Success Of Eastern Oyster Pilot Reefs In Brevard Quantifying The Success Of Eastern Oyster Pilot Reefs In Brevard
County, Florida County, Florida
Lacie Anderson University of Central Florida
Part of the Marine Biology Commons, Other Animal Sciences Commons, and the Other Ecology and
Evolutionary Biology Commons
Find similar works at: https://stars.library.ucf.edu/honorstheses
University of Central Florida Libraries http://library.ucf.edu
This Open Access is brought to you for free and open access by the UCF Theses and Dissertations at STARS. It has
been accepted for inclusion in Honors Undergraduate Theses by an authorized administrator of STARS. For more
Recommended Citation Recommended Citation Anderson, Lacie, "Quantifying The Success Of Eastern Oyster Pilot Reefs In Brevard County, Florida" (2016). Honors Undergraduate Theses. 59. https://stars.library.ucf.edu/honorstheses/59
QUANTIFYING THE SUCCESS OF EASTERN OYSTER PILOT REEFS IN BREVARD COUNTY, FLORIDA
by
LACIE L. ANDERSON
A thesis submitted in partial fulfillment of the requirements for the Honors in the Major Program in Biology
in the College of Sciences and in the Burnett Honors College at the University of Central Florida
Orlando, Florida
Spring Term, 2016
Thesis Chair: Linda Walters, PhD
ii
ABSTRACT Crassostrea virginica, the eastern oyster, is a native keystone species that
inhabits many coastal and estuarine ecosystems along the Atlantic seaboard.
Introduction of the eastern oyster into estuarine areas with limited current populations is
gaining popularity as a pro-active approach to improve estuarine water quality. In
November 2014 and April 2015, a total of five pilot oyster reef treatments were deployed
in Brevard County: bagged adult oysters (grown by community members under their
docks through oyster gardening) collected in fall 2014 and spring 2015, bagged clean
shell, oyster restoration mats, and empty plots (control). Locations of deployment
included a Merritt Island impoundment (Marsh Harbor), Nicol Park (Port St. John), and
Scout Island (Melbourne Beach). Prior to deployment, we collected morphometric data
(shell length, weight) on all gardened oysters. Abiotic factors including salinity, air and
water temperature, and wind speed were collected monthly. During quarterly sampling
at each site, morphometric data were collected for all live oysters, surviving and newly
recruited. Results show survival of gardened oysters and natural recruitment differed by
and depended greatly on the within-site location of each reef. In areas with no
recruitment and limited gardened oyster survival, regular deployment of gardened
oysters is needed for long term success. In areas with natural recruitment, bagged,
clean shell or oyster restoration mats are most successful. Future restoration sites
should be tested prior to any large-scale oyster deployments.
iii
DEDICATIONS
For my parents, thank you providing me with the opportunity to have a college education and for always being there to support and encourage me.
For my professors, thank you for encouraging me to go above and beyond the classroom.
iv
ACKNOWLEDGEMENTS
I would like to thank CEE Lab members, Brevard Zoo, volunteers and Brevard County Natural Resources for field assistance; the residents of Brevard County who
participated in oyster gardening; Paul Sacks for assistance in the field and site map illustrations; Dr. Melinda Donnelly and Panayoita Makris for GIS and analysis help. I
would like to thank UCF Department of Biology, Brevard County, FL Dept. of Environmental Protection, Office of Undergraduate Research, LEAD Scholars and
SURF for funding this project. Special thanks to my thesis chair Dr. Linda Walters for always encouraging me and providing me with the opportunity to be the lead on this
research project. Thank you Dr. Melinda Donnelly and Dr. Kelly Kibler for serving on my committee and providing me with meaningful insight.
v
TABLE OF CONTENTS CHAPTER 1: INTRODUCTION ......................................................................... 1
live), 4. Bagged adult gardened oysters collected in fall 2014, and 5. Bagged adult
gardened oysters collected in spring 2015. There were five entire reef replicates of each
treatment type, which resulted in a total of 25 pilot oyster reefs at each site. All pilot
oyster reefs covered a total of 152 meters of shoreline at each location. Three meters
separated each treatment replicate reef.
8
Figure 2 Cross section and overview of pilot oyster reef layout.
Pilot oyster reefs that consisted of oyster bags (fall/spring adult gardened oysters
and bagged clean shell) were built with a total of 48 bags and were approximately 2.7 m
long, 0.5 m high, and 1.8 m wide. Each pilot reef had two layers of shell bags. The
bottom layer consisted of two rows of 12 bags that were filled with clean shell only. This
layer was present to elevate the top layer away from the sediment. The top layer
consisted of two rows of 12 bags; the seaward row of 12 contained the tagged bags
monitored in the study. Top and bottom layers of adjacent oyster bags were bound to
one another with zip ties to prevent movement of bags. Pilot oyster reefs that consisted
of oyster restoration mats were built with a total of 24 mats aligned in four rows of six
mats. Pilot oyster reefs constructed from oyster restoration mats were made
9
approximately 2.74 m across and 1.83 m wide to obtain a footprint similar to bag reefs.
The seaward two rows of six mats were tagged and monitored in the study.
Figure 3 Cross section of a pilot reef constructed from bags.
Figure 4 Aerial view of a pilot reef constructed from bags.
Figure 5 Aerial view of a pilot reef constructed from mats.
10
Oyster bags were constructed using DelStar Technologies “Naltex” nylon net
material that was cut into 1.75 m long tubes. To fill oyster bags, these mesh tube
segments were tied on one side, 0.25 m from end, and fitted over a PVC tube 0.6 m
long and 0.16 m wide. Live oysters and oyster shells, in an 18.9 liter bucket, were
funneled through the PVC tube and into the mesh bag. The PVC tube was then
removed and the oyster bag was tied shut. The same method was used to fill oyster
bags that consisted of only blank shell. Blank shell refers to clean, disarticulated oyster
shells that contain no live oysters. These shells were donated from shucking facilities
where the oyster meat were previously harvested as a food source. All shells were
quarantined for a minimum of three months. Each oyster bag, used in fall and spring
adult gardened oyster treatments, was filled with a mixture of clean shell and 50
gardened live adult oysters. The final shell bags were approximately one meter long.
Oyster bags and oyster restoration mats were each tagged with a unique number.
Figure 6 Oyster bag dimensions.
11
Oyster restoration mats were made of VexarTM plastic mesh segments that were
cut in 0.25 m2 squares. Attached to each mat via zip ties were 36 oyster shells, each
with a single hole drilled near the umbo. Oyster restoration mats were attached with zip
ties to concrete irrigation weights on each corner.
Figure 7 Oyster mat dimensions.
Data Collection At each site prior to deployment, morphometric data were collected on live
oysters. Live oyster shell length was measured with digital or analog calipers in
millimeters and cluster weight was measured with digital balances in grams. Using a
random number generator, three of the five treatment replicate reefs were selected to
be monitored.
Post-deployment morphometric data were collected on all treatments every three
months from November 2014 through spring 2016. For the first two sampling periods
12
(spring 2015 & summer 2015), all tagged bags were monitored and for the third and
fourth sampling periods (fall 2015 & spring 2016) a subset of 9 bags and 18 mats per
treatment were sampled. Due to extremely low survival, zero natural recruitment and
accessibility issues, all monitoring for Marsh Harbor ended in summer 2015.
With the help of University of Central Florida, Brevard Zoo, and community
volunteers, bagged treatment contents were emptied by hand and each live oyster was
measured and weighed. Sorted contents were placed into new bags and the original tag
was placed on the new bag. Shell lengths of oysters that naturally recruited on the
oyster restoration mats were measured with a ruler in millimeters. Oyster restoration
mats were kept in original position if it was low tide or moved on shore while
measurement took place if it was high tide.
Since initial deployment in November 2014, measurements of abiotic factors
(salinity, water temperature, air temperature, and wind speed) were collected monthly.
Salinity was collected with a refractometer and measured in parts per thousand. Water
temperature was collected with HOBO tidbit temperature loggers, which recorded the
temperature in degrees Celsius continuously every 15 minutes, and were replaced
monthly. Air temperature measured in Celsius, and wind speed measured in meters per
second, were both collected using an Osprey anemometer.
Data Analysis For this thesis, all oyster data included in the analyses were collected from
November 2014- November 2015 and all abiotic data were those collected from
13
November 2014-January 2016. All data for this thesis were analyzed with model
selection in R.
Monthly water temperatures used in the analysis were calculated by taking the
mean of all temperatures recorded from one abiotic sample date to the next abiotic
sample date. Wind speed used in the analysis refers to the mean wind speed recorded
at time of sampling. Salinities and air temperatures used in the analysis were the values
recorded at time of sampling.
Oyster weights used in the analysis were the total mass (grams) of live oysters in
an oyster bag. Weights recorded for live oysters during the fall 2015 sampling (final
weight) were compared to the bag’s initial weight when first deployed in either fall 2014
or spring 2015, depending on treatment type. Marsh Harbor was not included in this
analysis since there were no final weights recorded for that site in fall 2015. The control
treatment contained no live oysters during the fall 2015 sampling; therefore it was not
included in this analysis. Weights were not monitored on the restoration mat treatment;
therefore it was not included in this analysis.
To compare differences in the amount of natural recruitment by treatment type at
Scout Island, restoration mats were compared to shell bags. Blank shell bags were the
only bagged treatment that started with zero live oysters, thus were the bagged
treatment chosen for this analysis. All oysters seen on both of these treatments were
naturally recruited.
14
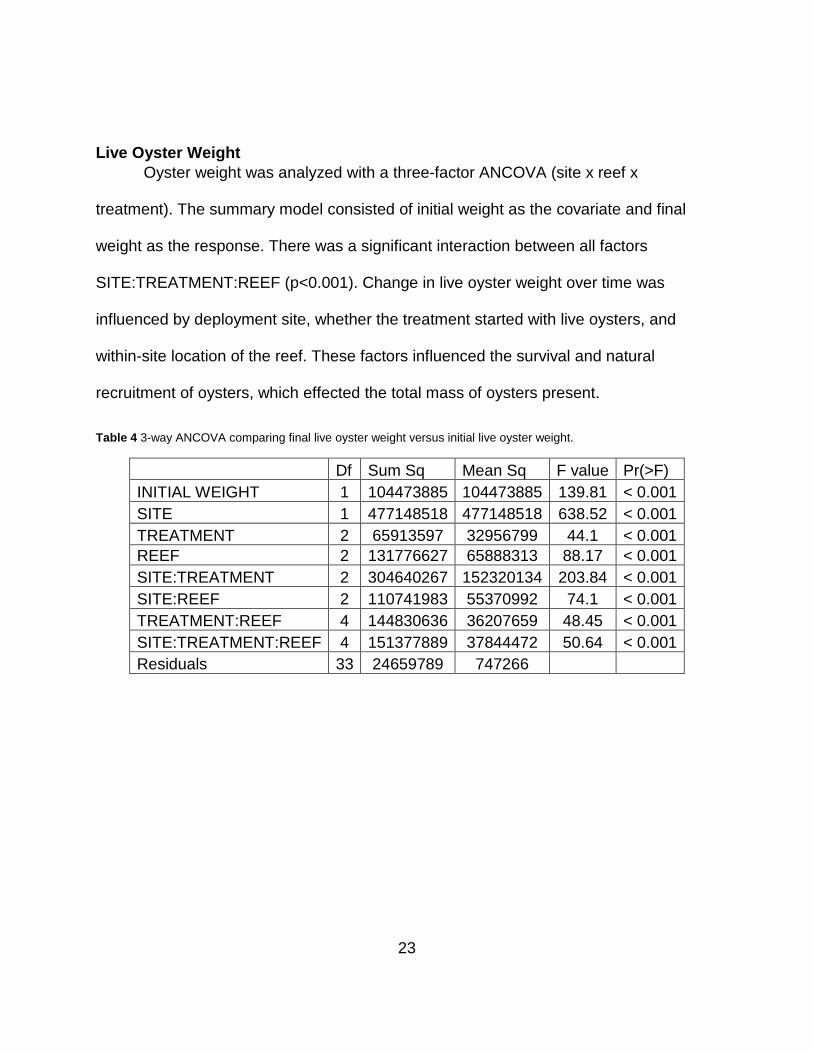
CHAPTER 3: RESULTS
Initial morphometric data were collected on all live oysters deployed at each site
(Tables 1, 2). A 3-factor ANOVA (site x treatment x reef) with initial size as the
response shows a significant SITE:TREATMENT interaction (p<0.001). Oyster shell
length varied by the location in which they were reared and the season during which
they were reared. A 3-factor ANOVA (site x treatment x reef) with initial mass as the
response shows a significant SITE:TREATMENT interaction (p=0.002). Oyster mass
varied by the location in which they were reared and the season during which they were
reared.
Table 1 Summary of initial morphometric data on fall gardened live oysters for each site represented by the means of each reef. Initial mean weight represents the mean of the total live oyster weight per bag.
INITIAL DATA: FALL ADULT OYSTER
TREATMENT
SITE REEF MEAN TOTAL WEIGHT PER
BAG (g)
MEAN SHELL LENGTH (mm)
INITIAL # OYSTERS
SCOUT 1 2460.3 47.14 50
2 2408.4 49.6 50
3 2249.8 46.0 50 NICOL 1 2415.8 43.1 50
2 1935.7 45.4 50
3 2437.3 44.3 50 MARSH 1 798.3 44.2 50
2 1528.6 44.4 50
3 2145.8 48.7 50
15
Table 2 Summary of initial morphometric data on spring gardened live oysters for each site represented by the means of each reef. Initial mean weight represents the mean of the total live oyster weight per bag.
INITIAL DATA: SPRING ADULT OYSTER
TREATMENT
SITE REEF MEAN TOTAL WEIGHT PER
BAG (g)
MEAN SHELL LENGTH (mm)
INITIAL # OYSTERS
SCOUT 1 1569.8 48.5 50
2 1589.9 49.2 50
3 1653.3 47.9 50
NICOL 1 888.1 41.8 50
2 911.5 41.2 50
3 1101.2 43.4 50
MARSH 1 2006.0 53.1 50
2 1281.5 56.9 50
3 1912.9 53.3 50
Number and Size of Oysters An overall four-factor MANOVA (date x site x treatment x reef), combining the
variables of size and number of oysters, which are correlated by bag (replicate),
resulted in a significant interaction between all factors (p<0.001) (Table 3). When the
oysters were sampled, deployment site, whether the treatment started out with live
oysters, and within-site location of the reef, are all factors which influenced the variation
Figure 14 Summary of mean total live oyster weight per bag for each reef during the fall 2015 sampling. ‘FALL’ refers to fall adult oyster treatment, ‘SPRING’ refers to spring adult oyster treatment, and ‘BLANK’ refers to blank shell bag
treatment. There was a significant interaction between SITE:TREATMENT:REEF (p<0.001).
25
Natural Recruitment To compare the amount of natural recruitment between the restoration mat and
blank shell bag treatments at Scout Island (only site with natural recruitment), a three-
factor MANOVA was performed (Table 5). In this test, size and number of oysters were
combined, which were assumed to be associated by bag or mat (replicate). In the
summary model there was a significant TREATMENT:REEF interaction (p<0.001). This
indicates number and size of naturally recruited oysters is influenced by treatment type
and within-site location of the reef. On a separate three-factor ANOVA with oyster
number as the response there was a significant DATE:TREATMENT:REEF interaction
(p=0.04). When a three-factor ANOVA was ran with oyster size as the response there
were no significant differences. This indicates the significant DATE:TREATMENT:REEF
interaction from the three-factor ANOVA ,with oyster number as the response, is likely
driving the significance of the TREATMENT:REEF interaction in the overall MANOVA.
Table 5 Overall MANOVA of natural recruitment on oyster bags versus oyster mats.
Df
Pillai approx F
num Df
den Df Pr(>F)
DATE 1 0.61928 66.692 2 82 < 0.001
TREATMENT 1 0.88347 310.835 2 82 < 0.001
REEF 2 0.84956 30.646 4 166 < 0.001
DATE:TREATMENT 1 0.11093 5.115 2 82 0.008
DATE:REEF 2 0.30687 7.522 4 166 < 0.001
TREATMENT:REEF 2 0.83042 29.466 4 166 < 0.001
DATE:TREATMENT:REEF 2 0.07942 1.716 4 166 0.149
Residuals 83
26
Abiotic Factors Table 6 Abiotic data collected. There is significant variation by date (p=0.001) and site (p=0.03).
Figure 15 Comparison of number of oysters for blank shell bag (‘BLANK’) and restoration mat (‘MAT’) treatments. The numbers 1, 2, & 3 refer to the reef replicates. There was a significant TREATMENT:REEF interaction (p<0.001).