Ultramicroscopy 107 (2007) 644–655 Quantitative amplitude and phase contrast imaging in a scanning transmission X-ray microscope Benjamin Hornberger ,1 , Michael Feser 1,2 , Chris Jacobsen Department of Physics and Astronomy, Stony Brook University, Stony Brook, NY 11794-3800, USA Received 7 September 2006; received in revised form 6 December 2006; accepted 19 December 2006 Abstract Phase contrast in X-ray imaging provides lower radiation dose, and dramatically higher contrast at multi-keV photon energies when compared with absorption contrast. We describe here the use of a segmented detector in a scanning transmission X-ray microscope to collect partially coherent bright field images. We have adapted a Fourier filter reconstruction technique developed by McCallum, Landauer and Rodenburg to retrieve separate, quantitative maps of specimen phase shift and absorption. This is demonstrated in the imaging of a germanium test pattern using 525 eV soft X-rays. r 2007 Elsevier B.V. All rights reserved. Keywords: X-ray microscopy; Phase contrast; Phase recovery; Configured detector; Segmented detector 1. Introduction Scanning X-ray microscopes can be used for transmis- sion imaging as well as for elemental mapping using fluorescence detection [1]. Traditionally the only mode of transmitted signal detection has been for absorption contrast imaging, whereas phase contrast is also significant, and even dominant at X-ray energies in the multi-keV range. We describe here the use of a configured X-ray detector [2,3], and image reconstruction algorithms based on those developed for electron microscopy [4–6], to obtain quantitative phase contrast images with a soft X-ray scanning transmission X-ray microscope (STXM). Inspired by the presence of fringes at the edges of objects in early X-ray images and by considerations of optical dispersion theory, Einstein suggested in 1918 that the real part of the index of refraction for X-rays in matter is slightly less than unity [7]. This was confirmed in 1924 by Larsson et al. [8] in measurements of wavelength-dependent refrac- tion of X-rays by a prism. Based on the high-frequency limit of classical dispersion theory, the X-ray refractive index is often written [9] as n ¼ 1 d ib ¼ 1 al 2 ðf 1 þ i f 2 Þ, which implies that the wave propagation in the þz direction is written as exp½i ðkz otÞ. Here, a ¼ n a r e =ð2pÞ depends on the number density of atoms n a and the classical radius of the electron r e ¼ 2:82 10 15 m, and l is the X-ray wavelength. The complex oscillator strength ðf 1 þ i f 2 Þ has a real part (which describes the phase shift) that varies slowly except near absorption edges, while the imaginary part (which describes absorption) tends to decrease as l 2 (see Fig. 1). As a result, phase contrast tends to scale as l 2 while absorption contrast scales as l 4 , so that phase contrast dominates over absorption contrast at short wavelengths or increasing photon energies. In recognition of this, Schmahl et al. [11] were the first to exploit phase contrast in lens-based X-ray microscopes. A wide range of phase contrast techniques, including the Zernike, Nomarski, and propagation based methods, are now in use, as described in a recent review by Momose [12]. However, most of these approaches are implemented in full-field X-ray imaging systems. Scanned X-ray imaging systems offer advantages such as reduced radiation dose (any inefficient X-ray focusing optics are located upstream ARTICLE IN PRESS www.elsevier.com/locate/ultramic 0304-3991/$ - see front matter r 2007 Elsevier B.V. All rights reserved. doi:10.1016/j.ultramic.2006.12.006 Corresponding author. Tel.: +1 631 632 8056; fax: +1 631 632 8101. E-mail addresses: [email protected] (B. Hornber- ger), [email protected] (M. Feser), [email protected](C. Jacobsen). 1 Contributed equally to this work. 2 Current address: Xradia, Inc., 4075A Sprig Dr., Concord, CA 94520, USA.
Transcript
ARTICLE IN PRESS
0304-3991/$ - see
doi:10.1016/j.ult
�CorrespondiE-mail addre
ger), michael@f
(C. Jacobsen).1Contributed2Current addr
USA.
Ultramicroscopy 107 (2007) 644–655
www.elsevier.com/locate/ultramic
Quantitative amplitude and phase contrast imaging in a scanningtransmission X-ray microscope
Benjamin Hornberger�,1, Michael Feser1,2, Chris Jacobsen
Department of Physics and Astronomy, Stony Brook University, Stony Brook, NY 11794-3800, USA
Received 7 September 2006; received in revised form 6 December 2006; accepted 19 December 2006
Abstract
Phase contrast in X-ray imaging provides lower radiation dose, and dramatically higher contrast at multi-keV photon energies when
compared with absorption contrast. We describe here the use of a segmented detector in a scanning transmission X-ray microscope to
collect partially coherent bright field images. We have adapted a Fourier filter reconstruction technique developed by McCallum,
Landauer and Rodenburg to retrieve separate, quantitative maps of specimen phase shift and absorption. This is demonstrated in the
imaging of a germanium test pattern using 525 eV soft X-rays.
Scanning X-ray microscopes can be used for transmis-sion imaging as well as for elemental mapping usingfluorescence detection [1]. Traditionally the only mode oftransmitted signal detection has been for absorptioncontrast imaging, whereas phase contrast is also significant,and even dominant at X-ray energies in the multi-keVrange. We describe here the use of a configured X-raydetector [2,3], and image reconstruction algorithms basedon those developed for electron microscopy [4–6], to obtainquantitative phase contrast images with a soft X-rayscanning transmission X-ray microscope (STXM).
Inspired by the presence of fringes at the edges of objectsin early X-ray images and by considerations of opticaldispersion theory, Einstein suggested in 1918 that the realpart of the index of refraction for X-rays in matter is slightlyless than unity [7]. This was confirmed in 1924 by Larsson
front matter r 2007 Elsevier B.V. All rights reserved.
ess: Xradia, Inc., 4075A Sprig Dr., Concord, CA 94520,
et al. [8] in measurements of wavelength-dependent refrac-tion of X-rays by a prism. Based on the high-frequency limitof classical dispersion theory, the X-ray refractive index isoften written [9] as n ¼ 1� d� ib ¼ 1� al2ðf 1 þ i f 2Þ,which implies that the wave propagation in the þz directionis written as exp½�i ðkz� otÞ�. Here, a ¼ nare=ð2pÞ dependson the number density of atoms na and the classical radius ofthe electron re ¼ 2:82� 10�15 m, and l is the X-raywavelength. The complex oscillator strength ðf 1 þ i f 2Þ hasa real part (which describes the phase shift) that varies slowlyexcept near absorption edges, while the imaginary part(which describes absorption) tends to decrease as l2 (seeFig. 1). As a result, phase contrast tends to scale as l2 whileabsorption contrast scales as l4, so that phase contrastdominates over absorption contrast at short wavelengths orincreasing photon energies.In recognition of this, Schmahl et al. [11] were the first to
exploit phase contrast in lens-based X-ray microscopes. Awide range of phase contrast techniques, including theZernike, Nomarski, and propagation based methods, arenow in use, as described in a recent review by Momose [12].However, most of these approaches are implemented infull-field X-ray imaging systems. Scanned X-ray imagingsystems offer advantages such as reduced radiation dose(any inefficient X-ray focusing optics are located upstream
Fig. 1. Real and imaginary parts of the complex oscillator strength for
carbon and gold (data from Ref. [10]). While the real part f 1, responsible
for phase shifts, remains strong, the imaginary part f 2, responsible for
absorption, declines rapidly with increasing photon energy.
B. Hornberger et al. / Ultramicroscopy 107 (2007) 644–655 645
rather than downstream of the specimen) and signals inaddition to X-ray transmission (such as the detection ofphotoelectrons or of fluorescent X-rays emitted bydifferent elements in the specimen). However, there havebeen fewer demonstrations of phase contrast imaging inSTXMs because in most cases a large area X-ray detectorhas been used to measure the transmitted signal. Previouswork in phase contrast imaging in STXM includes the useof configured detectors [13,14], a wavefront profiler incombination with a slit detector [15–17], aperture align-ment [18], and the use of offset zone plate (ZP) doublets[19]. The work described here [20] also uses a configureddetector, with an emphasis on obtaining quantitative phasecontrast images.
2. Configured detectors for phase contrast scanning
microscopy
There is a rich history in the use of configured detectorsfor phase contrast in scanning microscopes [21–23], andany detector other than one with large area and uniformresponse will in principle reveal contrast beyond simpleabsorption by the specimen. The greatest flexibility isavailable with a fully pixelated detector such as a charge-coupled device or CCD, whose detector response can bemodified arbitrarily after data acquisition. For instance,one can collect the microdiffraction pattern at each scanposition, and indeed the reconstruction of specimenamplitude and phase by means of Wigner-distributiondeconvolution [24] has been demonstrated in STXM [25].Several STXMs have been equipped with CCDs fordemonstration experiments or as standard detectors[26–31]. However, these approaches still have complica-tions of readout time and storage (a CCD frame has to be
acquired and stored for each scan pixel) as well as signal-to-noise (the transmitted signal is divided among 1032106
CCD pixels, so the noise requirements per pixel becomequite demanding). Fortunately, much simpler detectorconfigurations can reveal the phase information desired.With a first-moment detector, the signal will be propor-tional to the phase gradient of the specimen even forstrong phase objects [32,33]; such a detector can again berealized with a pixelated detector, or even with a wedgeabsorber [34].A detector with a small number of separate segments
offers a large degree of flexibility while increasing thereadout and storage requirements only moderately. Wehave described a novel charge integrating silicon detectorwith segmentation [2,3], which is in operation at the StonyBrook STXM at the National Synchrotron Light Source(NSLS) [35]. The detector has high efficiency and lownoise, so that it allows for the recording of high qualityX-ray absorption spectra. At the same time, it is spatiallysegmented into eight separate regions, allowing for highspeed, parallel recording of all signals.Difference images between opposing segments exhibit
differential phase contrast (DPC) [21,23,33,36]; the signalagain responds to the phase gradient of the specimen.Clearly, the sum of all signals will deliver the sameabsorption contrast image which would be obtained witha simple large-area detector. All those signals are availablein parallel and in real-time (while scanning), withoutcomplicated signal processing. However, DPC images canbe hard to interpret [33, Section 5] due to the differentialnature and the directional dependence of the signal. In thispaper, we describe the use of a Fourier filtering method[4–6] developed for scanning transmission electron micro-scopy (STEM), to obtain simultaneously quantitativeabsorption and phase contrast images from a single
measurement of a specimen.
3. Image formation in STXM with a segmented detector
The theory of image formation in STXM with asegmented detector has been described before [13,14],based on the extensive expertise from the field of STEM(see, e.g., Refs. [22,37–39]). Here we want to review theimportant steps in a suitable form for later use.The specimen is raster-scanned through a focused X-ray
beam, and the transmitted intensity is measured by adetector for each scan position as illustrated in Fig. 2. Thefocusing optic, in our case a Fresnel ZP [40], is coherentlyilluminated, and the complex scalar wavefield within theaperture of the optic is represented by the pupil functionPð~f ZPÞ. It is convenient for Fourier transform notation touse spatial frequency coordinates ~f in the ZP and detectorplanes, which relate to real space coordinates ~r as~f ¼~r=ðlzÞ, where l is the X-ray wavelength and z thepropagation distance under consideration. We are con-sidering plane wave illumination, for which Pð~f Þ is aconstant within the focusing area of the ZP and zero
ARTICLE IN PRESS
Fig. 2. Illustration of the imaging process in a scanning transmission X-
ray microscope. A Fresnel zone plate is coherently illuminated. The
combination of a central stop on the zone plate and an order-sorting
aperture (OSA) isolates the first-order focus, through which the specimen
is scanned. The total detected intensity gives absorption contrast, but
variations in the detector plane intensity distribution jCð~f Þj2 can be used
to extract phase contrast information.
B. Hornberger et al. / Ultramicroscopy 107 (2007) 644–655646
otherwise. The combination of a central stop on the ZPand an order-sorting aperture (OSA) isolates the first-orderfocus of the ZP, which then can be described as a thin lens.The probe function pð~rÞ, which is the wavefield associatedwith the focal plane, is related to Pð~f Þ by a simple inverseFourier transform [41] if the area of interest is close to theoptical axis (i.e., the effective spatial extent of the focal spotis sufficiently small):
pð~rÞ ¼
ZPð~f Þ e2pi~r
~f d~f . (1)
The specimen is described by a multiplicative complextransmission function hð~rÞ modulating the amplitude andphase of the probing wavefield. If the probe is displaced bya vector ~r0 with respect to the specimen, we can write forthe exiting wavefield
cð~r; ~r0Þ ¼ pð~r� ~r0Þhð~rÞ. (2)
If the detector is considered to be in the far-field, theintensity distribution in the detector plane is given by theinverse Fourier transform of the specimen exit wave
jCð~f ; ~r0Þj2 ¼Z
pð~r� ~r0Þhð~rÞe2pi~r~f d~r
���� ����2, (3)
where we have dropped all irrelevant phase factors andconstants outside the integral. Using the Fourier shifttheorem for pð~r� ~r0Þ and the convolution theorem, this isequivalent to
where Hð~f Þ is the Fourier transform of the specimenfunction hð~rÞ and �f denotes a convolution with respect to~f .We now consider the use of a segmented detector to
measure this intensity distribution in separate segmentsindexed by k, and with individual intensity responsefunctions Rkð
~f Þ. It should be noted that due to theprinciple of reciprocity [37,42], the role of detector andsource are interchanged between the scanning and the full-field microscope, so that using a point-like detectorcorresponds to coherent imaging in a full-field microscope,
while a large-area detector with a constant responsecorresponds to incoherent imaging. Using a segmenteddetector means partially coherent imaging, and the imagesignal skð~r0Þ recorded by segment k is
skð~r0Þ ¼
ZRkð
~f ÞjCð~f ; ~r0Þj2 d~f , (5)
where Rkð~f Þ is set to 1 within the sensitive area of segment
k and 0 otherwise.Expanding jCj2 from Eq. (4) into CC�, we obtain the
Fourier transform of the detector images skð~r0Þ with respectto probe positions ~r0 as
Skð~f 0Þ ¼
ZRkð
~f ÞfðPð�~f ÞP�ð�~f � ~f 0ÞÞ
� �f ðHð�~f ÞH�ð�~f � ~f 0ÞÞgd
~f , ð6Þ
for which we first integrated the plane wave factors of theform e�2pi ~r0
~f over ~r0 producing a Dirac delta function,which then permits a second integration.For an electromagnetic wave traversing a semi-transpar-
ent specimen with a spatially dependent complex index ofrefraction nð~rÞ ¼ 1� dð~rÞ � ibð~rÞ and thickness tð~rÞ, themultiplicative specimen function can be written as
hð~rÞ ¼ expð�bð~rÞktð~rÞ þ i dð~rÞktð~rÞÞ, (7)
where k ¼ 2p=l. For a weak-amplitude, weak-phase speci-men, we can expand to first order
hð~rÞ ¼ 1þ hrð~rÞ þ i hið~rÞ, (8)
where the amplitude and phase of the scattered wavehrð~rÞ ¼ �bð~rÞktð~rÞ and hið~rÞ ¼ dð~rÞktð~rÞ are small comparedto unity. hr;i are real functions and the Fourier spectrum ofthe specimen becomes
Hð~f Þ ¼ Dð~f Þ þHrð~f Þ þ iHið
~f Þ, (9)
where each summand is the Fourier transform of thecorresponding term in Eq. (8) and Dð~f Þ is the Dirac-deltafunction.Within this approximation, Eq. (6) can be written as
represent bilinear transfer functions [43]. Note thatCkð0; 0; ~f Þ is constant for all ~f and represents the intensitymeasured by detector segment k in absence of a specimen.The contrast transfer functions (CTFs) for the real and
imaginary part of the specimen modulation are identifiedas
T ðkÞr ð~f 0Þ ¼ Ckð�1; 0; ~f 0Þ þ Ckð0; 1; ~f 0Þ,
TðkÞi ð
~f 0Þ ¼ Ckð�1; 0; ~f 0Þ � Ckð0; 1; ~f 0Þ. ð12Þ
ARTICLE IN PRESSB. Hornberger et al. / Ultramicroscopy 107 (2007) 644–655 647
A measure of the total contrast transfer (including allsegments) is
T totr;i ð
~f 0Þ ¼X
k
jTðkÞr;i ð
~f 0Þj, (13)
where T totr;i describes the total spectral power transfer of the
imaging system as a function of the spatial frequency. T totr;i
does not explain the interpretation of recorded images, butis a convenient measure when comparing different detectorconfigurations.
4. Calculated transfer functions
The CTFs for the split, opposite quadrant and first-moment detectors have been published before [33,36,44];here we want to calculate the CTFs for the conditions ofthe simulations and experiments we describe below. Wehave used a Nickel ZP with a diameter of 80 mm, a centralopaque stop with a diameter of 35mm and an outermostzone width of drN ¼ 30 nm [45]. The ZP has a focal lengthof 1016mm for the X-ray wavelength l ¼ 2:36 nm (525 eVphoton energy) used.
The detector [2,3] has eight sensitive segments as shownin Fig. 3. The inner three segments were intended to beused for differential interference contrast [15,16] and breakthe symmetry of the detector, which is not ideal for themethod described here. An improved design with a doublequadrant geometry will be available in the future. Theseparation of the detector from the specimen is chosen suchthat in spatial frequency space the quadrant segments ofthe detector extend to a normalized spatial frequency ofone. Fig. 4 shows the computer representation of twoselected detector segments and the computed CTFs.
It is seen that the CTFs for the real part of the specimenfunction are positive and show even symmetry with respectto the zeroth spatial frequency. Furthermore the CTFs foropposing detector segments are identical. The CTFs for the
Fig. 3. Segmentation of the detector.
imaginary part have odd symmetry and are opposite in signfor opposing segments.For the case of incoherent bright field imaging, the signal
over the whole detector plane would be summed up. In thiscase, the CTFs for the imaginary part cancel out and onlythe total CTF for the real part (Fig. 4d) remains. T tot
r ð~f Þ is
also commonly known as the modulation transfer function(MTF) of the STXM with a large-area detector. To obtainphase contrast, the emphasis in the past has been ondisplaying difference images of opposing segments, forwhich only the CTF for the imaginary part gives acontribution. As mentioned earlier, the signal in theresulting DPC images is a measure for the gradient of thespecimen phase and shows a directional dependence,which makes interpretation difficult. In the following weconsider an approach in which the signals of all detectorsegments are collected and a best estimate of the complexspecimen function is reconstructed by means of Fourierfiltering.
5. Fourier filter reconstruction
One can use the images recorded on all segments of thedetector to reconstruct an estimate of the specimenfunction in the presence of noise. We are following theapproach of McCallum et al. [4–6] developed for scanningelectron microscopy, while we focus here on a trulyquantitative reconstruction of the specimen function (seeEq. (8)) and the treatment of the measurement noise.The method is closely related to the Wiener filter (see, e.g.,Refs. [46–48]) commonly used for transfer functiondeconvolution in signal and image processing.We assume that an estimate of the specimen bHð~f Þ can be
formed as a filtered sum of the detector images Skð~f Þ in
Fourier spacebHð~f Þ ¼Xk
W kð~f ÞSkð
~f Þ, (14)
where W kð~f Þ represents Fourier filter weighting functions.
The RMS error of the reconstruction can be defined as
� ¼
Zhj bHð~f Þ �Hð~f Þj2id~f , (15)
which has to be minimized for an optimal reconstruction.The brackets hi indicate an expectation value, whichaverages over many measurements of the noisy data Sk.Since the integrand of Eq. (15) is real and greater or equalto zero for all spatial frequencies ~f , the minimization of �can be performed for each value of ~f independently and wecan omit the explicit dependence on ~f and the integrationin the following.The stationary solution of Eq. (15) is found by setting
the partial derivative of the integrand with respect to theweighting functions W k to zero, which can be written as
S�k
Xl
W lSl �H
!* +¼ 0. (16)
ARTICLE IN PRESS
0.00
1.00
0.00
1.00
0.00
1.65
0.00
0.19
0.00
0.28
0.00
0.57
-0.10
0.10
-0.14
0.14
-2 -1 0 1 2-2
-1
0
1
2
0.00
1.00Detector Segment 1 Detector Segment 4
normalized spatial frequency fxno
rmal
ized
spa
tial f
requ
ency
f y
a b c
d e f
g h i
Fig. 4. Contrast transfer functions calculated for the experimental conditions: (a) representation of the pupil function; (b, c) detector response for two
selected segments; (e, f) real and (h, i) imaginary part transfer functions for the two segments; (d, g) total real and imaginary transfer for all segments. Each
representation is shown on a normalized frequency scale. The frequency with value f ¼ 1 corresponds to the maximum diffraction angle of the objective,
i.e., f ¼ 1=ð2 drNÞ. For the zone plate used here (drN ¼ 30 nm) this is f ¼ 16:7mm�1 so that the above image extends to twice that value or 33:3mm�1. Forthe imaginary transfer functions, zero response is shown as grey, and larger positive responses are shown as white while larger negative responses are
shown as black.
B. Hornberger et al. / Ultramicroscopy 107 (2007) 644–655648
This constitutes a linear set of equations for the W k,which can be solved for all W k [5,6], if we substitute for theFourier transformed detector images Skð
~f Þ the weakspecimen approximation from Eq. (10):
Skð~f Þ ¼ Hrð
~f ÞT ðkÞr ð~f Þ þ iHið
~f ÞT ðkÞi ð~f Þ þNkð
~f Þ for fa0,
(17)
where Nkð~f Þ represents the spectral noise of detector segment
k. The Dð~f Þ-term in Eq. (10), which represents the DC-level ofthe image, is omitted here but will be taken into accountbelow. The general solution can be further simplified [6] if thepupil function Pð~f Þ is real and centrosymmetric and eachdetector segment k has a corresponding segment k if rotated
by 180� such that Rkð~f Þ ¼ Rkð�
~f Þ. In this case, thereconstruction filters are given by
W kð~f Þ ¼
T ðkÞ�r ð~f ÞP
ljTðlÞr ð~f Þj2 þ bðkÞr ð
~f Þ
þTðkÞ�i ð
~f ÞPljTðlÞi ð~f Þj2 þ bðkÞi ð
~f Þfor fa0, ð18Þ
where TðkÞr;i ð~f Þ are the CTFs for the real and imaginary part
(cf. Eq. (12)). The noise terms br;ið~f Þ are defined as
bðkÞr;i ð~f Þ ¼hjNkð
~f Þj2i
jHr;ið~f Þj2
. (19)
ARTICLE IN PRESS
Ra
dia
l P
ow
er
Sp
ectr
um
De
nsity [
ph
2]
105
104
103
102
101
100
10-1
10-2
Spatial Frequency [μm-1]
100.010.01.00.1limit = 33.3 μm
-1
Information
Noise level
Estimation of Specimen Power Spectrum
l
ll
l
Fig. 5. Radial power spectrum densities extracted from the images of the
weak Siemens star pattern simulated in Section 7. Beyond the information
limit of the objective zone plate 1=drN ¼ 33:3mm�1, the power spectrum
decays to a flat line representing the noise level. The actual RPSD of the
simulated specimen (not shown), if properly scaled by the square of the
number of photons, coincides perfectly with the transfer-corrected real
part RPSD except at the highest frequencies. The transfer-corrected
imaginary part is too large at low frequencies due to the low-frequency
transfer.
B. Hornberger et al. / Ultramicroscopy 107 (2007) 644–655 649
For Eq. (18) to be valid, the noise power has to be equal foropposing detector segments.
For the zero frequency component, we assume that thenoise contribution is negligible (i.e., the noise has anaverage close to zero) and that Hrð
~f ¼ 0Þ is smallcompared to the Dirac D-term in Eq. (9) (weak specimen).Keeping in mind that T ðkÞr ð
~f Þ ¼ 2Ckð0; 0; ~f Þ and TðkÞi ð~f Þ ¼ 0
for ~f ¼ 0, it can then be shown that the reconstruction filteris given by Eq. (18) multiplied by 2.
The terms bðkÞr;i explicitly depend on the ratio of noise tospecimen power, which varies depending on the signalstrength and specimen properties. Therefore, it is notpossible to calculate the general reconstruction filters to beused with every measurement. As is commonly done inWiener filtering, one can use a constant value of br;i for allfrequencies and adjust it interactively to obtain the‘‘visually best’’ result for the reconstruction [47]. However,it is usually better to estimate the required quantities fromthe measurement itself as is demonstrated in the followingsection.
The fact that this reconstruction method processesinformation up to twice the frequency cut-off of the ZPlens might lead to the conclusion that a factor of two inresolution is gained, and in fact, Landauer et al. [4] call themethod ‘‘double resolution imaging’’ (compared to coher-ent imaging with an on-axis point detector). Note,however, that the unprocessed incoherent bright field andDPC images each contain information up to twice the ZPcut-off frequency, albeit at less contrast (see Figs. 4d and g).Moreover, the cut-off frequency alone does not sufficientlydescribe resolution and image quality, as described inChapter 6.5 of Goodman [41].
6. Calculation of the reconstruction filters
If the signal is sufficiently strong compared to detectordark noise and no other systematic noise sources (likeinstabilities in the illumination) are present, the noise isdominated by photon statistics. In this case the noise is notcorrelated between pixels and thus has a flat, white noisepower spectrum. The magnitude of the noise power can beread directly from a plot of the radial power spectrumdensity (RPSD) of the detector images, which we define as
1
2pj~f j
Z 2p
0
jSkð~f Þj2 df~f (20)
and is thus only a function of the magnitude of the spatialfrequency j~f j. For spatial frequencies exceeding the transferof the microscope, the RPSD decays to a flat linerepresenting the noise power (see Fig. 5). For computationof the filter we substitute for hjNkð
~f Þj2i of Eq. (19) thelargest of the noise powers determined from the RPSDs ofall detector segments.
The specimen function Hr;ið~f Þ is not known a priori, but
with the assumption that the contrast is isotropicallydistributed over all directions the power spectrum jHr;ið
~f Þj2
can be well approximated by a RPSD. From Eq. (17), wecan see that in a frequency range where the signaldominates the noise
jHr;iðf Þj2 �jSkr;i ðf Þj
2
jTðkr;iÞ
r;i ðf Þj2
(21)
if kr;i denotes a combination of detector segments whichexhibits only real or imaginary transfer, respectively.For the real part Hrðf Þ, we compute the RPSD from the
sum of all detector images skrð~rÞ ¼
Pkskð~rÞ. Because of the
symmetry properties of the CTFs (cf. Fig. 4), there is nocontribution of the imaginary transfer to this sum. Byanalogy, the real transfer vanishes when computingdifference images of opposing detector segments k and k.The sum of DPC images
skið~rÞ ¼
Xk;k
ðskð~rÞ � skð~rÞÞ (22)
taken over all pairs k,k of opposite segments exhibits phasetransfer only, and the RPSD can be computed.In the same way we can form the radial density of the
transfer functions Tðkr;iÞ
r;i corresponding to the imagecombinations kr;i used above, which can be used to correctthe signal-RPSDs to obtain estimates of the real andimaginary specimen power spectra according to Eq. (21).Fig. 5 shows signal and transfer-corrected RPSDs for the
weak Siemens star test pattern simulated in Section 7. Asthe specimen power gets lower than the noise power, thecorrected RPSDs lose their meaning and curve steeplyupward. For most specimens, the decline of the signal with
ARTICLE IN PRESS
-2 -1 0 1-2
-1
0
1
23.89
-2.06
Filter W1(f)
no
rma
lize
d s
pa
tia
l fr
eq
ue
ncy f
normalized spatial frequency f
Reconstruction Filter Detector Segment 14.69
-2.70
Reconstruction Filter Detector Segment 4
Filter W4(f)a b
Fig. 6. Calculated Fourier reconstruction filters for two selected detector segments (cf. Fig. 4).
B. Hornberger et al. / Ultramicroscopy 107 (2007) 644–655650
frequency is well approximated by a power law. Therefore,a power law fit to the corrected RPSDs can be made in themedium spatial frequency range, which is used as the inputjHr;ij
2 of Eq. (19). The test pattern used in the followingsimulations and experiments, however, peaks in themedium frequency range so that we chose to do a piecewisepower law fit instead.
It is clear that the ideal illumination and alignmentconditions cannot be met exactly, leading to mixing ofcontrast from the real and imaginary part [5, Section 3.3].Therefore it can be necessary to put a lower limit to thenoise parameter br;i to avoid this effect at the lowestspatial frequencies, where the CTF of the real partdominates over the CTF of the imaginary part. However,if br;i is too large, it follows from Eq. (18) that low spatialfrequencies in the imaginary part are overly suppressed, sothat one has to compromise between the two effects. Forour experiments a value of 10�4 was chosen for this lowercut-off.
Fig. 6 shows two examples of calculated Fourierreconstruction filters. Since the transfer functions are realvalued, the filter functions are real valued as well.
7. Simulations
We have simulated the imaging and reconstructionprocess for a Siemens star test pattern in conditions closeto those of the experiments described in Section 8. Theparameters of the ZP and the detector have beenmentioned in Section 4. In a first simulation, the spokesof the test pattern are assumed to have both an amplitudebkt and a phase dkt of 0.1 to fulfill the weak specimenapproximation. However, the method will be mostbeneficial in cases where the phase shift contribution islarger than the absorption, and since the actual test patternused in Section 8 has an estimated amplitude of 0.41 andphase of 1.14 in the spokes, we have repeated thesimulation with those values as well (strong specimen).The background has been set to be transparent in all cases.All calculations have been carried out on a grid of 256�256 pixels with an assumed real space sampling interval of
15 nm. The incident intensity has been assumed to be 7000photons per scan pixel, and random Poisson-distributednoise has been applied to the resulting image of eachdetector segment. For the simulation of the imagingprocess, the formula for general specimens (Eq. (5)) hasbeen used.Fig. 7 shows the simulated incoherent bright field and
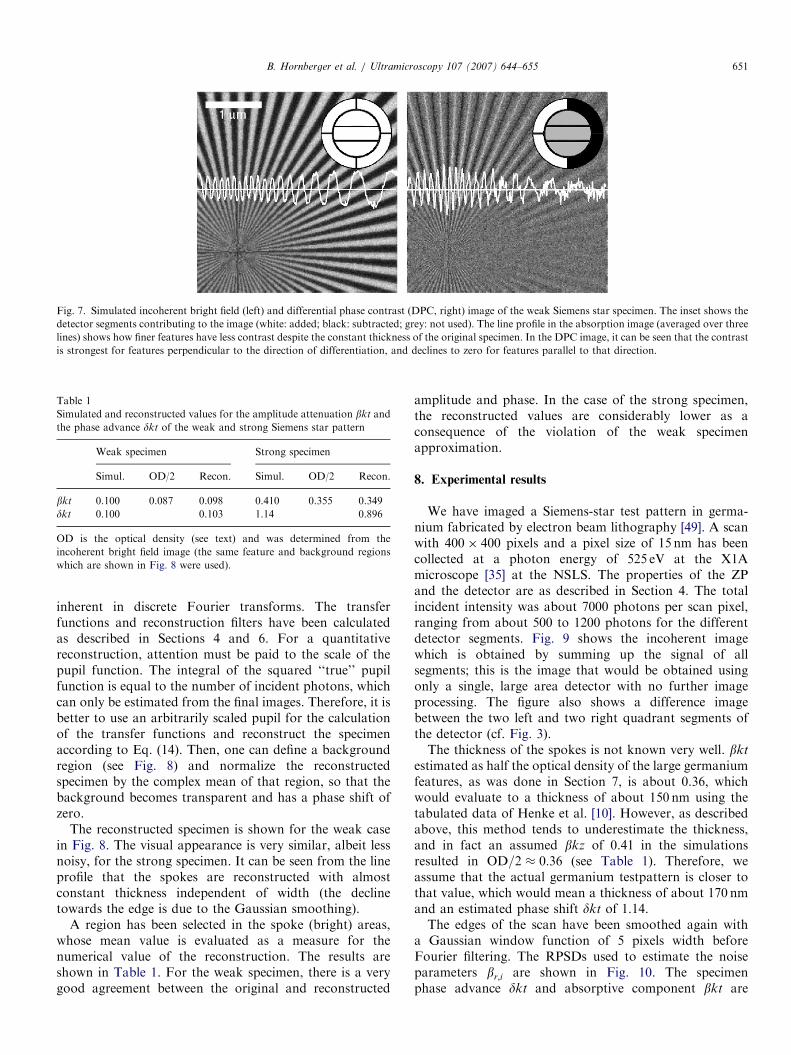
DPC images of the weak specimen. The incoherent brightfield (absorption) image is often used to extract the opticaldensity of a feature. The optical density is defined asOD ¼ mt ¼ � logðI=I0Þ, where I and I0 are intensities inthe feature and background region, respectively, m ¼ 2kb isthe absorption coefficient and t is the thickness, so thatOD=2 ¼ bkt. In our case, we can use the optical density toobtain an independent measure of the specimen absorptionbkt for comparison with the result of the reconstruction.However, it turns out that the optical density under-estimates bkt considerably even if I and I0 are determinedfrom the wider features of the test pattern (see Table 1).The reason is the decline of the amplitude transfer functionat higher frequencies corresponding to finer features in thespecimen (see Fig. 4d). In other words, the concept ofoptical density assumes a perfect projection image and doesnot take into account the finite extent of the probe functiondue to the limited numerical aperture of the ZP. Even if theprobe is centered on a spoke, part of the wavefield isincident in the background region and therefore notattenuated, so that the intensity measured for that scanpixel is higher than expected. This effect is particularlypronounced for an object with sharp edges like the testpattern and gets stronger with decreasing feature size,which is evident from the line profile shown in Fig. 7.Since the Fourier filter reconstruction method correctsfor the frequency transfer of the optical system, weexpect that effect to be absent in the final result; thereconstructed bkt of the spokes should be larger than theone obtained from the optical density and independent ofspoke width.Before reconstruction, the edges of the images have been
smoothed with a Gaussian window function of 5 pixelswidth to avoid the edge effects due to discontinuities
ARTICLE IN PRESS
Table 1
Simulated and reconstructed values for the amplitude attenuation bkt and
the phase advance dkt of the weak and strong Siemens star pattern
Weak specimen Strong specimen
Simul. OD/2 Recon. Simul. OD/2 Recon.
bkt 0.100 0.087 0.098 0.410 0.355 0.349
dkt 0.100 0.103 1.14 0.896
OD is the optical density (see text) and was determined from the
incoherent bright field image (the same feature and background regions
which are shown in Fig. 8 were used).
Fig. 7. Simulated incoherent bright field (left) and differential phase contrast (DPC, right) image of the weak Siemens star specimen. The inset shows the
detector segments contributing to the image (white: added; black: subtracted; grey: not used). The line profile in the absorption image (averaged over three
lines) shows how finer features have less contrast despite the constant thickness of the original specimen. In the DPC image, it can be seen that the contrast
is strongest for features perpendicular to the direction of differentiation, and declines to zero for features parallel to that direction.
B. Hornberger et al. / Ultramicroscopy 107 (2007) 644–655 651
inherent in discrete Fourier transforms. The transferfunctions and reconstruction filters have been calculatedas described in Sections 4 and 6. For a quantitativereconstruction, attention must be paid to the scale of thepupil function. The integral of the squared ‘‘true’’ pupilfunction is equal to the number of incident photons, whichcan only be estimated from the final images. Therefore, it isbetter to use an arbitrarily scaled pupil for the calculationof the transfer functions and reconstruct the specimenaccording to Eq. (14). Then, one can define a backgroundregion (see Fig. 8) and normalize the reconstructedspecimen by the complex mean of that region, so that thebackground becomes transparent and has a phase shift ofzero.
The reconstructed specimen is shown for the weak casein Fig. 8. The visual appearance is very similar, albeit lessnoisy, for the strong specimen. It can be seen from the lineprofile that the spokes are reconstructed with almostconstant thickness independent of width (the declinetowards the edge is due to the Gaussian smoothing).
A region has been selected in the spoke (bright) areas,whose mean value is evaluated as a measure for thenumerical value of the reconstruction. The results areshown in Table 1. For the weak specimen, there is a verygood agreement between the original and reconstructed
amplitude and phase. In the case of the strong specimen,the reconstructed values are considerably lower as aconsequence of the violation of the weak specimenapproximation.
8. Experimental results
We have imaged a Siemens-star test pattern in germa-nium fabricated by electron beam lithography [49]. A scanwith 400� 400 pixels and a pixel size of 15 nm has beencollected at a photon energy of 525 eV at the X1Amicroscope [35] at the NSLS. The properties of the ZPand the detector are as described in Section 4. The totalincident intensity was about 7000 photons per scan pixel,ranging from about 500 to 1200 photons for the differentdetector segments. Fig. 9 shows the incoherent imagewhich is obtained by summing up the signal of allsegments; this is the image that would be obtained usingonly a single, large area detector with no further imageprocessing. The figure also shows a difference imagebetween the two left and two right quadrant segments ofthe detector (cf. Fig. 3).The thickness of the spokes is not known very well. bkt
estimated as half the optical density of the large germaniumfeatures, as was done in Section 7, is about 0.36, whichwould evaluate to a thickness of about 150 nm using thetabulated data of Henke et al. [10]. However, as describedabove, this method tends to underestimate the thickness,and in fact an assumed bkz of 0.41 in the simulationsresulted in OD=2 � 0:36 (see Table 1). Therefore, weassume that the actual germanium testpattern is closer tothat value, which would mean a thickness of about 170 nmand an estimated phase shift dkt of 1.14.The edges of the scan have been smoothed again with
a Gaussian window function of 5 pixels width beforeFourier filtering. The RPSDs used to estimate the noiseparameters br;i are shown in Fig. 10. The specimenphase advance dkt and absorptive component bkt are
ARTICLE IN PRESS
0.120.100.080.060.040.020.00-0.02
Amplitude attenuation βkt
0.100.050.00
Phase advance δkt
1 1
2 2
Fig. 8. Reconstructed amplitude attenuation and phase advance of the simulated weak specimen. Shown in the upper right are the selected background
region (1) used to normalize the reconstruction and the feature region (2) whose mean value has been determined as a measure for the numerical value of
the reconstruction.
Fig. 9. Incoherent bright field STXM image (left) and differential phase contrast image (DPC, right) of the germanium test pattern.
100.010.01.00.1
Estimation of Specimen Power Spectrum
Ra
dia
l P
ow
er
Sp
ectr
um
De
nsity [
ph
2]
104
102
100
10-1
10-2
Spatial Frequency [μm-1]
l
l
l
l
Fig. 10. Radial power spectrum densities used to estimate the specimen
power spectrum of the germanium test pattern.
B. Hornberger et al. / Ultramicroscopy 107 (2007) 644–655652
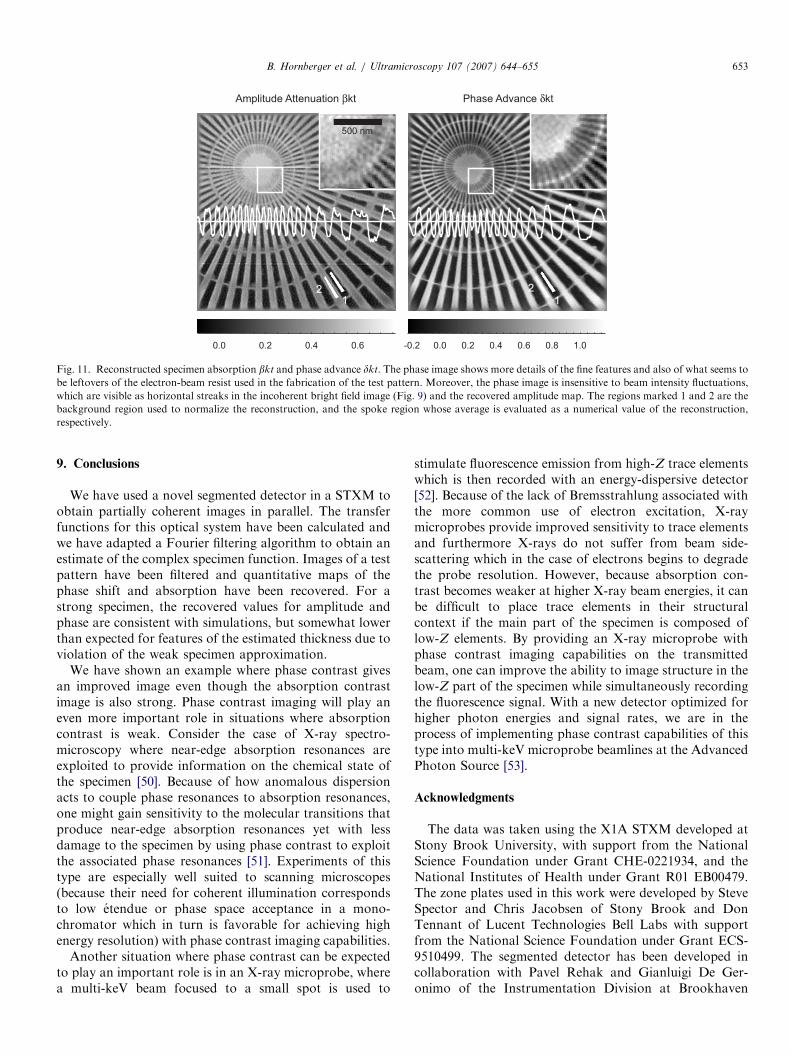
extracted from the resulting estimate of the complexspecimen transmission function after filtering and normal-izing (Fig. 11).The phase dkz measured in one region of the spokes (see
Fig. 11) is 0:99 rad, which is lower than estimated in theparagraph above but only moderately higher than theresult of the simulation. The difference could come fromelectron-beam resist left from the production process,which has low absorption but appreciable phase shift. Therecovered estimate of the amplitude attenuation bkz is 0.35,which is again lower than expected but consistent with thesimulation.Note that the phase shift image shows considerably more
high resolution detail than the absorption image does; thisis in part due to phase contrast being stronger thanabsorption contrast for this material at this energy, and inpart due to the fact that the phase contrast image isrelatively insensitive to beam intensity fluctuations in ascanned beam system.
ARTICLE IN PRESS
0.60.40.20.0
Amplitude Attenuation βkt
1.00.80.60.40.20.0-0.2
Phase Advance δkt
500 nm
2 2
11
Fig. 11. Reconstructed specimen absorption bkt and phase advance dkt. The phase image shows more details of the fine features and also of what seems to
be leftovers of the electron-beam resist used in the fabrication of the test pattern. Moreover, the phase image is insensitive to beam intensity fluctuations,
which are visible as horizontal streaks in the incoherent bright field image (Fig. 9) and the recovered amplitude map. The regions marked 1 and 2 are the
background region used to normalize the reconstruction, and the spoke region whose average is evaluated as a numerical value of the reconstruction,
respectively.
B. Hornberger et al. / Ultramicroscopy 107 (2007) 644–655 653
9. Conclusions
We have used a novel segmented detector in a STXM toobtain partially coherent images in parallel. The transferfunctions for this optical system have been calculated andwe have adapted a Fourier filtering algorithm to obtain anestimate of the complex specimen function. Images of a testpattern have been filtered and quantitative maps of thephase shift and absorption have been recovered. For astrong specimen, the recovered values for amplitude andphase are consistent with simulations, but somewhat lowerthan expected for features of the estimated thickness due toviolation of the weak specimen approximation.
We have shown an example where phase contrast givesan improved image even though the absorption contrastimage is also strong. Phase contrast imaging will play aneven more important role in situations where absorptioncontrast is weak. Consider the case of X-ray spectro-microscopy where near-edge absorption resonances areexploited to provide information on the chemical state ofthe specimen [50]. Because of how anomalous dispersionacts to couple phase resonances to absorption resonances,one might gain sensitivity to the molecular transitions thatproduce near-edge absorption resonances yet with lessdamage to the specimen by using phase contrast to exploitthe associated phase resonances [51]. Experiments of thistype are especially well suited to scanning microscopes(because their need for coherent illumination correspondsto low etendue or phase space acceptance in a mono-chromator which in turn is favorable for achieving highenergy resolution) with phase contrast imaging capabilities.
Another situation where phase contrast can be expectedto play an important role is in an X-ray microprobe, wherea multi-keV beam focused to a small spot is used to
stimulate fluorescence emission from high-Z trace elementswhich is then recorded with an energy-dispersive detector[52]. Because of the lack of Bremsstrahlung associated withthe more common use of electron excitation, X-raymicroprobes provide improved sensitivity to trace elementsand furthermore X-rays do not suffer from beam side-scattering which in the case of electrons begins to degradethe probe resolution. However, because absorption con-trast becomes weaker at higher X-ray beam energies, it canbe difficult to place trace elements in their structuralcontext if the main part of the specimen is composed oflow-Z elements. By providing an X-ray microprobe withphase contrast imaging capabilities on the transmittedbeam, one can improve the ability to image structure in thelow-Z part of the specimen while simultaneously recordingthe fluorescence signal. With a new detector optimized forhigher photon energies and signal rates, we are in theprocess of implementing phase contrast capabilities of thistype into multi-keV microprobe beamlines at the AdvancedPhoton Source [53].
Acknowledgments
The data was taken using the X1A STXM developed atStony Brook University, with support from the NationalScience Foundation under Grant CHE-0221934, and theNational Institutes of Health under Grant R01 EB00479.The zone plates used in this work were developed by SteveSpector and Chris Jacobsen of Stony Brook and DonTennant of Lucent Technologies Bell Labs with supportfrom the National Science Foundation under Grant ECS-9510499. The segmented detector has been developed incollaboration with Pavel Rehak and Gianluigi De Ger-onimo of the Instrumentation Division at Brookhaven
ARTICLE IN PRESSB. Hornberger et al. / Ultramicroscopy 107 (2007) 644–655654
National Laboratory and Peter Holl and Lothar Struder ofthe Max Planck Semiconductor Laboratory (MPI-HLL) inMunich, Germany. It was supported in part by the USDepartment of Energy, Contract No. DE AC02-98CH10886 and the Max Planck Society. We would alsolike to thank Franc-ois Polack and Denis Joyeux for theirinput and initial work on phase contrast in STXM.
References
[1] S. Aoki, Y. Kagoshima, Y. Suzuki (Eds.), in: Proceedings of the
Eighth International Conference on X-ray Microscopy, IPAP
Conference Series 7, Institute of Pure and Applied Physics, Japan
(IPAP), 2006.
[2] M. Feser, C. Jacobsen, P. Rehak, G. DeGeronimo, P. Holl, L.
Struder, Novel integrating solid state detector with segmentation for
scanning transmission soft X-ray microscopy, in: I. McNulty (Ed.),
X-ray Micro- and Nano-Focusing: Applications and Techniques II,
vol. 4499, Society of Photo-Optical Instrumentation Engineers
(SPIE), Bellingham, Washington, DC, 2001, pp. 117–125.
[3] M. Feser, B. Hornberger, C. Jacobsen, G. De Geronimo, P. Rehak,
P. Holl, L. Struder, Nucl. Instrum. Methods Phys. Res. A 565 (2006)


![Index []Index a Abbe, Ernst Karl 1 Abbe theory of imaging 54–57, 162, 409f, 500 ... amplitude contrast transfer function (ACTF) 90 amplitude image, of reconstructed wave 160 ...](https://static.documents.pub/doc/80x56/5ebf630d895b827a89568580/index-index-a-abbe-ernst-karl-1-abbe-theory-of-imaging-54a57-162-409f.jpg)


