Quantitative Analysis of Carbendazim & other Pesticides in Fruit Juices by Direct Analysis in Real Time (DART®) Mass Spectrometry IonSense, Inc. 999 Broadway Suite 404 Saugus, MA 01906 USA Elizabeth Crawford and Brian Musselman 60 th ASMS Conference Vancouver, BC Canada 20-24 th May 2012
Transcript
Quantitative Analysis of Carbendazim & other Pesticides in Fruit Juices by Direct
Analysis in Real Time (DART®) Mass Spectrometry
IonSense, Inc. 999 Broadway Suite 404
Saugus, MA 01906 USA
Elizabeth Crawford and Brian Musselman
60th ASMS Conference Vancouver, BC Canada
20-24th May 2012
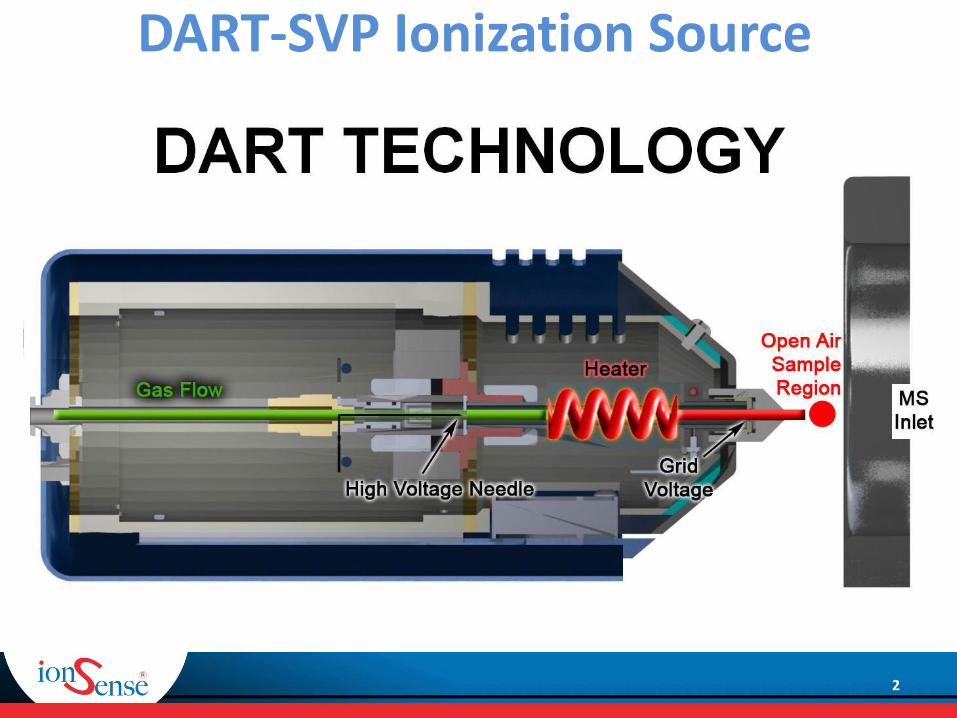
DART-SVP Ionization Source
2
3
1. Objectives:
• Generate standard curve data for carbendazim in orange juice ranging from 1 ppb – 5000 ppb.
• Screen for carbendazim in a variety of orange juices from the EU (2 countries) and the USA. – European maximum residue limit* (MRL) is set at 200 ppb for oranges and
carbendazim is not approved for use on citrus fruits in the US . The US FDA has set an action limit of 10 ppb.
2. Analysis Overview:
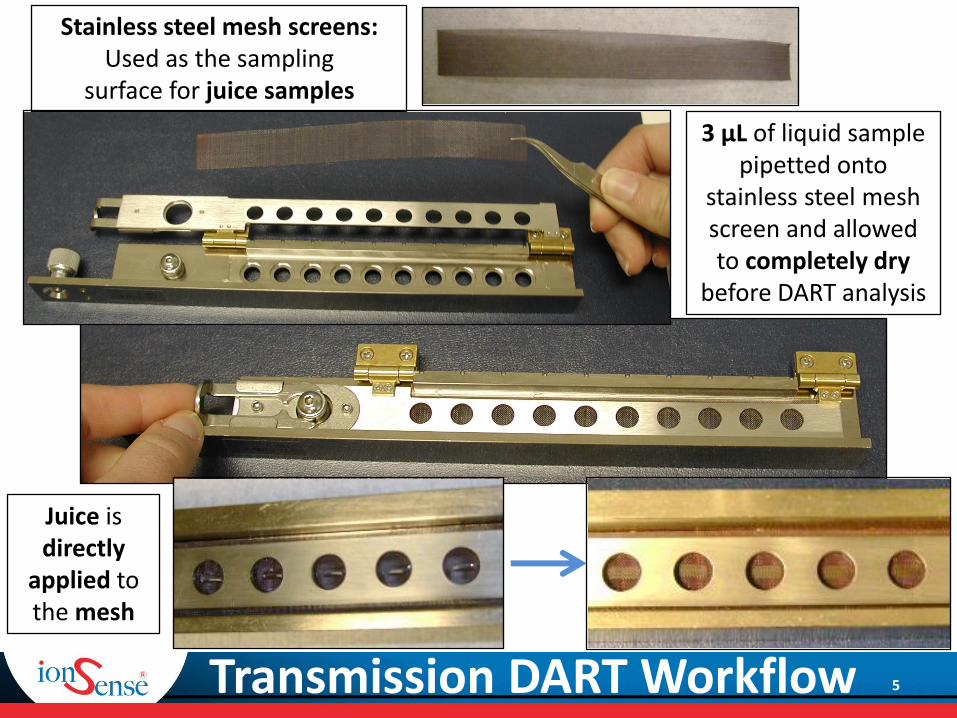
• No sample preparation – liquid from consumer juice beverages directly analyzed by transmission mode direct analysis in real time (DART) source coupled with triple quad.
• Positive ion mode; carbendazim transition m/z 192.2 → 160.2.
USA OJ 1 USA OJ 2 USA OJ 3 France OJ 1 Germany OJ1
Germany OJ2
Me
asu
red
Le
vel
(p
pb
)
Fruit Juice Consumer Beverage
Carbendazim Levels: Screening Fruit Juices
n = 8; except n = 16 for German OJs
ND ND ND ND ND
ND = Not Detected
8
• DART-SVP ion source coupled to the API 4000 QTRAP yielded LOD of 2 ppb and LOQ of 15 ppb. • DART-SVP contact closure capability allows the user to acquire data directly through
an Analyst sample queue.
• The standard curve generated for cardbendazim using the transmission DART method was very good with R2 value 0.9988 across 10 – 5000 ppb.
• The reproducibility for an n = 3 across the concentration ranges was generally less than 18 % based on peak areas without internal standard correction.
• The two orange juices from Germany from the same manufacturer, but different lots yielded estimated carbendazim levels of 20 ppb, 10x below the Europe MRL, where the French orange juice contained only trace amounts.
Summary
9
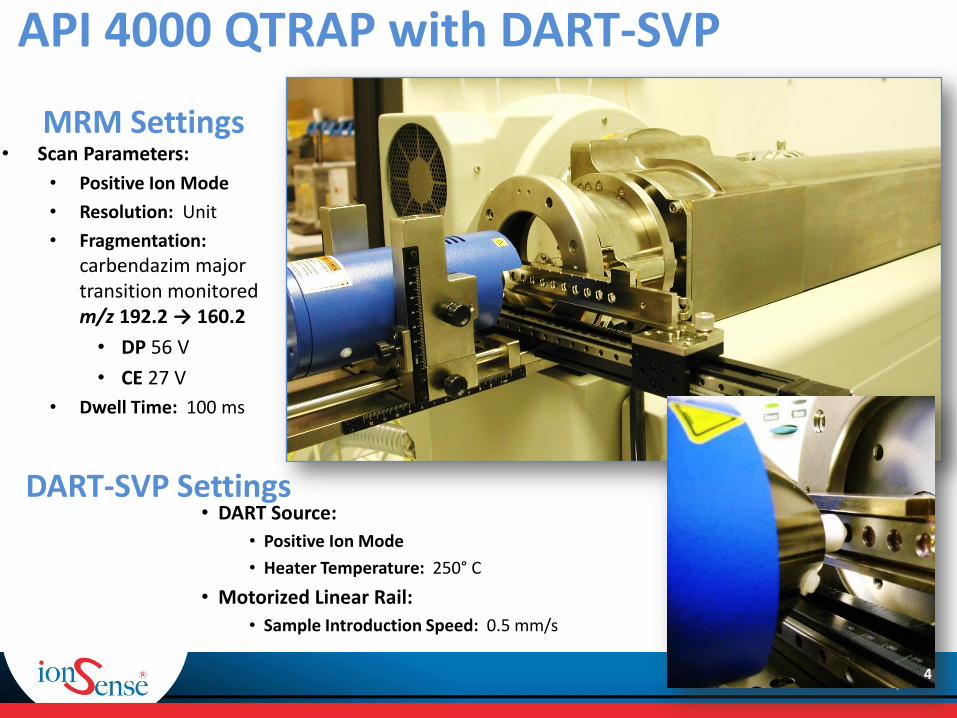
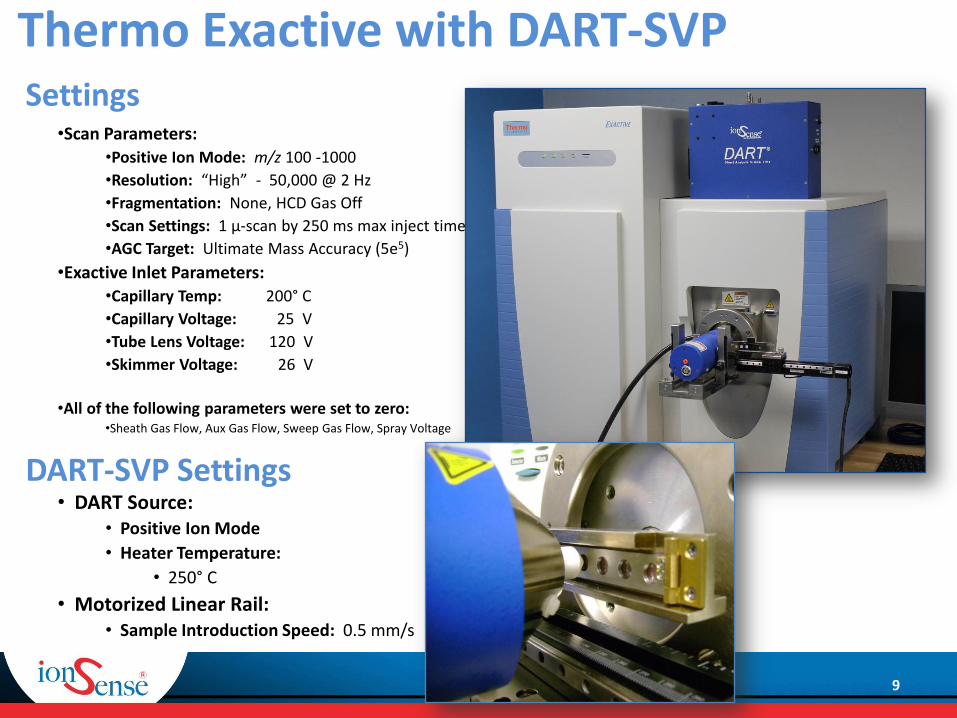
Settings •Scan Parameters:
•Positive Ion Mode: m/z 100 -1000
•Resolution: “High” - 50,000 @ 2 Hz
•Fragmentation: None, HCD Gas Off
•Scan Settings: 1 µ-scan by 250 ms max inject time
•AGC Target: Ultimate Mass Accuracy (5e5)
•Exactive Inlet Parameters: •Capillary Temp: 200° C
•Capillary Voltage: 25 V
•Tube Lens Voltage: 120 V
•Skimmer Voltage: 26 V
•All of the following parameters were set to zero: •Sheath Gas Flow, Aux Gas Flow, Sweep Gas Flow, Spray Voltage
DART-SVP Settings • DART Source:
• Positive Ion Mode
• Heater Temperature:
• 250° C
• Motorized Linear Rail: • Sample Introduction Speed: 0.5 mm/s
Thermo Exactive with DART-SVP
10
192.06 192.08 192.10 192.12 192.14 192.16 192.18
m/z
0
20
40
60
80
100
0
20
40
60
80
100
Rela
tive
Ab
un
da
nce
0
20
40
60
80
100192.07675
192.08685
192.07664192.12313
192.09582 192.13880 192.15934
192.07666
192.12279192.08670
192.15833192.13769
NL:2.09E4
C 9 H 9 O 2 N 3 +H: C 9 H 10 O 2 N 3
p (gss, s /p:40) Chrg 1R: 70000 Res .Pwr . @FWHM
NL:5.80E4
blk,10,20ngml_carbendazimspike_graninioj_70k_e+full_pos_03_20120307#439-475 RT: 2.04-2.20 AV: 37 SB: 64 4.16-4.44 T: FTMS + p NSI Full ms [150.00-1000.00]
NL:2.65E5
BLK,10,20ngmL_CarbendazimSpike_MeOH_70K_E+Full_POS_01_20120307#445-477 RT: 2.07-2.21 AV: 33 SB: 56 4.17-4.41 T: FTMS + p NSI Full ms [150.00-1000.00]
192.06 192.08 192.10 192.12 192.14 192.16 192.18
m/z
0
20
40
60
80
100
0
20
40
60
80
100
Re
lative
Ab
un
da
nce
0
20
40
60
80
100192.07675
192.08685
192.07664192.12313
192.09582 192.13880 192.15934
192.07666
192.12279192.08670
192.15833192.13769
NL:2.09E4
C 9 H 9 O 2 N 3 +H: C 9 H 10 O 2 N 3
p (gss, s /p:40) Chrg 1R: 70000 Res .Pwr . @FWHM
NL:5.80E4
blk,10,20ngml_carbendazimspike_graninioj_70k_e+full_pos_03_20120307#439-475 RT: 2.04-2.20 AV: 37 SB: 64 4.16-4.44 T: FTMS + p NSI Full ms [150.00-1000.00]
NL:2.65E5
BLK,10,20ngmL_CarbendazimSpike_MeOH_70K_E+Full_POS_01_20120307#445-477 RT: 2.07-2.21 AV: 33 SB: 56 4.17-4.41 T: FTMS + p NSI Full ms [150.00-1000.00]
192.06 192.08 192.10 192.12 192.14 192.16 192.18
m/z
0
20
40
60
80
100
0
20
40
60
80
100
Rela
tive
Ab
un
da
nce
0
20
40
60
80
100192.07675
192.08685
192.07664192.12313
192.09582 192.13880 192.15934
192.07666
192.12279192.08670
192.15833192.13769
NL:2.09E4
C 9 H 9 O 2 N 3 +H: C 9 H 10 O 2 N 3
p (gss, s /p:40) Chrg 1R: 70000 Res .Pwr . @FWHM
NL:5.80E4
blk,10,20ngml_carbendazimspike_graninioj_70k_e+full_pos_03_20120307#439-475 RT: 2.04-2.20 AV: 37 SB: 64 4.16-4.44 T: FTMS + p NSI Full ms [150.00-1000.00]
NL:2.65E5
BLK,10,20ngmL_CarbendazimSpike_MeOH_70K_E+Full_POS_01_20120307#445-477 RT: 2.07-2.21 AV: 33 SB: 56 4.17-4.41 T: FTMS + p NSI Full ms [150.00-1000.00]
Theoretical [M+H]+
[M+H]+
C9H10N3O2
-0.6 ppm
[M+H]+
C9H10N3O2
-0.5 ppm
Spiked in Orange Juice
Spiked in Methanol
Nearing LOD for detection directly out of orange juice on Exactive
Carbendazim: 10 ppb in Orange Juice & MeOHCarbendazim Positive Ion
m/z= 202.08512-202.08714 MS 120424-01_Twister19&20_OSCranLt_Blank&50ppbSpin
NL: 4.23E4
m/z= 202.08512-202.08714 MS 120424-01_Twister19&20_OSCranLt_Blank&50ppbSpin
NL: 2.20E5
m/z= 280.15286-280.15567 MS 120424-01_Twister19&20_OSCranLt_Blank&50ppbSpin
NL: 6.78E4
m/z= 302.06818-302.07120 MS 120424-01_Twister19&20_OSCranLt_Blank&50ppbSpin
NL: 1.88E6
m/z= 305.10634-305.10939 MS 120424-01_Twister19&20_OSCranLt_Blank&50ppbSpin
NL: 2.62E6
m/z= 322.14134-322.14456 MS 120424-01_Twister19&20_OSCranLt_Blank&50ppbSpin
NL: 9.00E5
m/z= 365.14233-365.14598 MS 120424-01_Twister19&20_OSCranLt_Blank&50ppbSpin
NL: 1.71E5
m/z= 388.12772-388.13161 MS 120424-01_Twister19&20_OSCranLt_Blank&50ppbSpin
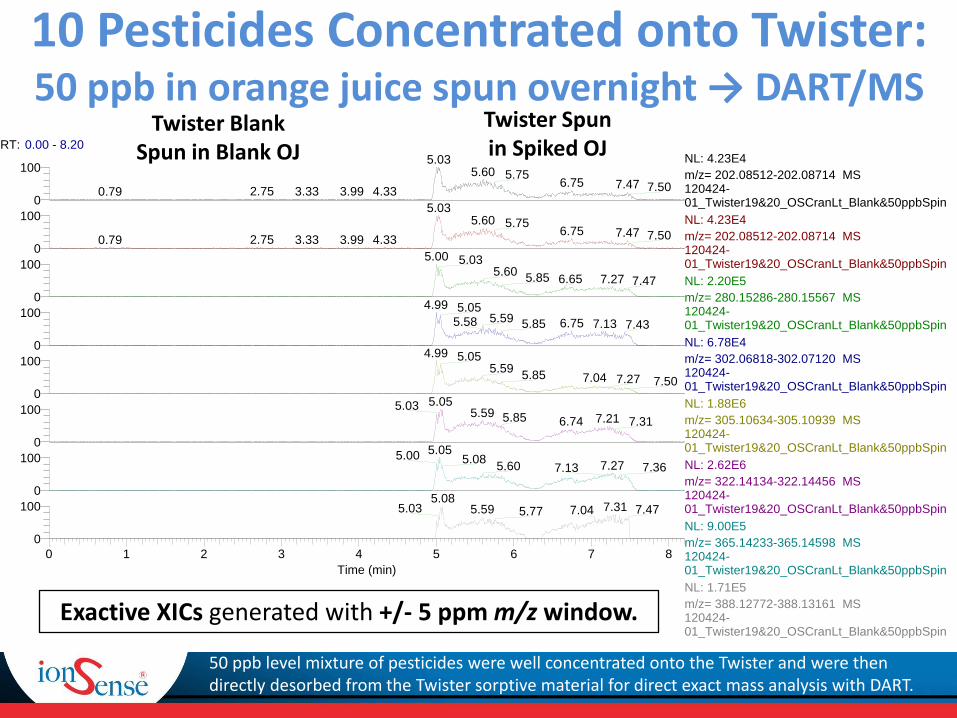
10 Pesticides Concentrated onto Twister: 50 ppb in orange juice spun overnight → DART/MS
Exactive XICs generated with +/- 5 ppm m/z window.
Twister Blank Spun in Blank OJ
Twister Spun in Spiked OJ
50 ppb level mixture of pesticides were well concentrated onto the Twister and were then directly desorbed from the Twister sorptive material for direct exact mass analysis with DART.
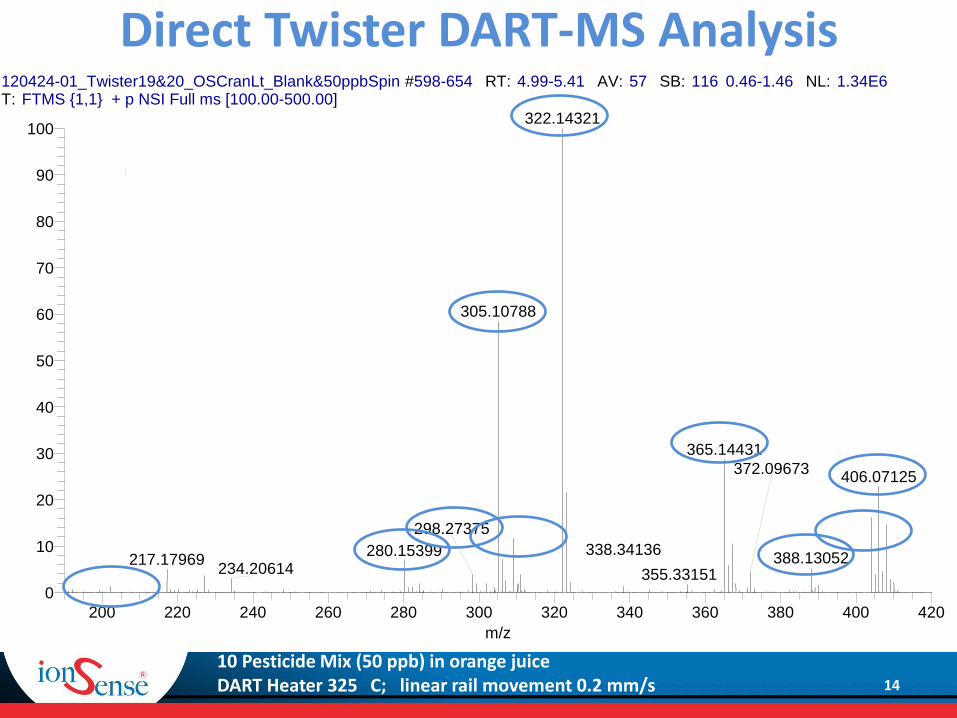
120424-01_Twister19&20_OSCranLt_Blank&50ppbSpin #598-654 RT: 4.99-5.41 AV: 57 SB: 116 0.46-1.46 NL: 1.34E6T: FTMS {1,1} + p NSI Full ms [100.00-500.00]
200 220 240 260 280 300 320 340 360 380 400 420
m/z
0
10
20
30
40
50
60
70
80
90
100
Rela
tive
Ab
un
da
nce
322.14321
305.10788
365.14431
406.07125
280.15399 388.13052217.17969
372.09673
298.27375
234.20614 355.33151
338.34136
14
Direct Twister DART-MS Analysis
10 Pesticide Mix (50 ppb) in orange juice DART Heater 325
C; linear rail movement 0.2 mm/s
• There is a very good concentration effect on the Gerstel Twister for direct screening for low levels (50 ppb) of pesticides with ambient ionization DART source.
• Long lasting signal from the Twister experiments indicates that a large amount of material is collected on the Twister surface • A temperature ramp of the DART heater would yield thermal
separation and long lasting signal is beneficial for MS/MS experiments.


![BNN Laboratory Performance Assessment 2016 Pesticides in ... Laboratory... · Pesticide Spiked level [mg/kg] Assigned value [mg/kg] Number of results Correct quantification Carbendazim](https://static.documents.pub/doc/80x56/606382c8ba5b585eae257eab/bnn-laboratory-performance-assessment-2016-pesticides-in-laboratory-pesticide.jpg)


