Final Report 1 Quantitative and Qualitative Approach to Understand Poverty and Inequality Dynamics in Uganda 1 Collection of Life History Data based on 1992/99 Household Panel David Lawson April 2006 1 This research was undertaken with support from The Faculty of Humanities, General Research Support Fund, University of Manchester, and Department of International Development (DFID) Uganda. I gratefully acknowledge the assistance of David Hulme, James Muwange, Anthony Matovu and Vincent Ssennono, and comments on earlier drafts from Arthur van Diesen.
Transcript
Final Report
1
Quantitative and Qualitative Approach toUnderstand Poverty and Inequality
Dynamics in Uganda1
Collection of Life History Data based on 1992/99Household Panel
David Lawson
April 2006
1 This research was undertaken with support from The Faculty of Humanities, General ResearchSupport Fund, University of Manchester, and Department of International Development (DFID)Uganda. I gratefully acknowledge the assistance of David Hulme, James Muwange, Anthony Matovuand Vincent Ssennono, and comments on earlier drafts from Arthur van Diesen.
Final Report
2
EXECUTIVE SUMMARY
Despite an increased focus in combining qualitative and quantitative (‘Q2’) researchto further our understanding of poverty, there are still relatively few LDC basedattempts that have successfully achieved this. By using the sampling frame ofUganda’s 1992/99 (2 wave) quantitative household panel data we follow up a smallnumber of households to obtain life history information, with the objective being tofurther explain some of the Propagators, Maintainers, and Interrupters of Poverty, andInequality, dynamics. In this case, and primarily due to budgetary constrains, werestrict our focus to three main issues of Ill health/HIV/AIDS, Assets and Gender, butalso comment on broader findings.
In particular, we find:• Suggestions of direct causality between Ill health/HIV/AIDS and movements into
poverty, and explanations regarding the processes that underpin this.• Households ‘preference order’ the types of assets sold ‘in times of crisis’ (e.g.
luxury goods such as radios are commonly sold first). However, the willingness,order and extent to which assets are sold varies according to age, geographicallocation and socio-economic characteristics of the household members.
• Households commonly ‘asset smooth’ – i.e. if chronic or transiently poorhouseholds do not have immediately available resources to pay for medicalbills/transport etc. as a first resort food consumption was virtually always reduced,before selling assets or obtaining loans.
• Many individuals, and particularly women, commented that the lack of effectivesocial networks and ‘limited contacts’ in the job market, was a probable cause ofgender inequality, especially with regards to formal labour market participation.
• Increased (and larger) household sizes were commonly identified as a major causeof persistent and transient poverty. In particular, a very common finding was forhouseholds to experience increased wealth, for household sizes then to increase,but only 5-6 years later do the ‘delayed child costs’ of school fees etc. startcausing the major monetary problems that impact on a households ability to avoidpoverty.
• The ‘Q2’ approach was particularly useful in identifying household vulnerability.• Limited access to land, and cases of ‘disputed land’, were particularly prevalent
amongst poorer households. This has deteriorated the welfare status and long termsecurity and planning of such households.
From a policy perspective, preliminary micro level findings indicate that there couldbe a limiting of agricultural productivity, due to lack of access/ability to plan longterm. Also, given the impact of illness, death and increasing pressures from having noland access, such findings perhaps point to the importance of social protection ashaving key role to avoid persistent poverty and inequality.
From a methodological perspective, the use of ‘Q2’ approaches clearly assisted inproviding clarity of understanding regarding the processes that underpin poverty andinequality dynamics. Even with a small life history sample size, and based onrelatively ‘old’ panel data we were able to complement the quantitative data with lifehistory, and further data collection, to reveal some of the real processes that underpinhow health, assets and gender interconnect with poverty and inequality dynamics.
Final Report
3
1. Introduction/Background to The Study
Over the last few years there has been an increased focus on genuinely combiningqualitative and quantitative (‘Q2’) research methodologies to further ourunderstanding of poverty. Despite this however, there are still relatively few LDCbased attempts that have successfully achieved this. Most applied papers focus on theuse of participatory techniques and simply cross-reference to separate quantitativefindings (e.g. Barahona et al. 2004 for Malawi, Lawson et al. 2005 for Uganda).2While in some respects such work is “breakthrough”, in the main it has made only alimited contribution to deepening analysis of poverty because they rarely closelyintegrate the sampling frame, they use group based methods in public (participatoryappraisal) and the analytical methods applied to data collected by participatoryappraisal remain opaque. 3
Considering the above, for this research we integrate qualitative and quantitativeresearch, using Ugandan panel data, visiting the same households to obtain life historyinformation. A number of direct findings are provided in relation to some acceptedareas highlighted in the PMAU Research agenda. For example, issues covered underseveral of the ‘cross cutting themes’ mentioned in Research Programme to Supportthe Eradication of Poverty in Uganda are directly investigated. In particular we limitour investigation to the main issues highlighted by households as being particularlyimportant in relation to poverty dynamics. These include issues of gender inequalitiesand empowerment, HIV/AIDS/Chronic Illness, and Assets.
The report is structured as follows. The next section reviews the main attempts thathave been made at combining ‘Q2’ research within Uganda. We then provide adetailed outline of the approach used for this paper. Section 4 then provides the mainempirical analysis. Disaggregating the section by the 3 main themes, we undertake afocused analysis of the 1992/99 quantitative data, outlining the main findings, andthen further these with the information obtained from the life history interviews. Thefinal section of the paper summarise the main findings.
2 See further ‘Q2’ literature such as Adoto, M, F. Lund and P Mhlongo (2004), Parker B.,and V. Kozel(2004), Barahona and Levy (2004), all Q2 conference papers: http:www.utoronto.ca/mcis/q2.3 The use of group based methods in public (participatory appraisal) means that the quality of data isoften compromised and there are profoundly ethical issues (e.g. by classifying named individuals as“poor” in public, reinforces social stigma). A better, and more complementary methods to quantitativemethods, is a life history research approach. The analytical methods applied to data collected byparticipatory appraisal remain opaque. While some analysts claim to present the “Voices of the Poor”this is clearly untrue as the materials presented are selective and structured, some form of interpretivelens has been utilized but is not explained
Final Report
4
2. Previous ‘Q2’ Work In UgandaPoverty research in Uganda is very well developed with both of Uganda’sParticipatory Poverty Assessment Process (UPPAP’s) providing widely quotedqualitative findings and a series of quantitative papers having been produced by thelikes of Deininger and Okidi (2003), and Appleton (1999). However, there isrelatively limited genuinely integrated poverty research for the country.
McGee (2000) and Appleton and Booth (2001) were perhaps the first to note theadvantages of combining research methods to further our understanding ofpoverty/poverty dynamics. From a methodological perspective, McGee (2000)focused on how the nationally representative quantitative household surveys (theUganda National Household Survey - UNHS) and the Participatory PovertyAssessment (PPA) could be combined. She concluded that the PPA could be used to:
• Further examine the downturn in welfare indicators between 1995/6 and 1996/7as derived by the UNHS;
• Provide insights to refine the UNHS questionnaires e.g. including questions onrisk and vulnerability;
• Visit some of the same households for both the PPA and UNHS; Try andstandardise poverty trends assessment in PPA and repeat the PPA for subsequentwaves. (Kanbur 2001a: 19).
Further to the above, Appleton and Booth (2001) highlighted the need to takeadvantage of the panel data in furthering our understanding of poverty and otherissues.
Of the research that has applied the ‘combined’ methods, Lawson et al. (2003)combined qualitative and quantitative research to try and understand the factors andprocesses underlying poverty transitions and persistence. They used the nationallybased UPPAP findings, and two wave panel data, of 1992/99, to undertakeeconometric analysis. The research showed that the qualitative sources addedsubstantially to the information available from the panel survey data alone, by helpingto identify key issues to investigate using the survey data and by providing importantadditional insights not available from the survey data, including about processes andcontextual factors. Despite not inter-linking the sampling frame/householdsinterviewed, of particular note they found:
• Factors such as the lack of key physical assets, high dependency ratios andincreased household size were identified by both the qualitative and quantitativeapproaches, as major factors influencing poverty transitions and persistence.
• In other instances though the qualitative approach identifies additional factors notso easily identified quantitatively - for example the impacts of excessive alcoholconsumption in many cases.
A more notable attempt at genuine ‘Q2’ research for rural Uganda, is that undertakenby Bird and Shinyekwa (2003). They build on the qualitative (participatory) andquantitative livelihoods research undertaken in 3 Districts and undertake in-depth lifehistory interviews with the heads of nearly 25 households in 3 villages. The choice totalk to someone about their life, rather than adopting a thematic approach, meant they
Final Report
5
were able to identify the most common covariant and idiosyncratic shocks whichtriggered a decline into poverty (drivers) and the constraints which preventedaccumulation, investment and movement out of poverty (maintainers) (Bird andShinyekwa, 2003:10).
As with UPPAP, Bird and Shinyekwa found:
• Poor gender relations and excessive alcohol consumption to be key factors,with the latter often financed by the sale of household assets and a major cause ofdomestic violence.
• However, a common finding was that the poorest had suffered recurrent andcomposite shocks and personal tragedies compared with the persistently non-poor who had simply managed to avoid personal disaster, allowing them to retaintheir assets and even continue to accumulate (Bird and Shinyekwa, 2003:31).
More recently Ellis et al. (2006) completed a ‘ladder’ study for the three districts ofMbale, Kamuli and Mubende.4 266 Panel households were interviewed and theinformation complemented with community qualitative interviews. They foundreasons for downward trajectories in welfare status to be:
• Farm sub-division, chronic illness, death of household head, livestock disease,theft, and profligacy (spending money on gambling and drink and thence gettinginto debt) (Ellis et al. 2006:14).
Even more recent attempts at ‘Q2’ attempts have been made by The Government ofUganda, with support from The World Bank, to understand the dynamics of upwardmobility from poverty. The idea was to follow up households from the 1992/99 panelthat had moved out of poverty. Results are yet to be finalised, but despite few panelhouseholds having been located, the work is likely to produce value added for thequantitative/qualitative survey design of future research.
4 Livelihoods and Diversification Directions Explored by Research (LADDER).
Final Report
6
3. This Approach
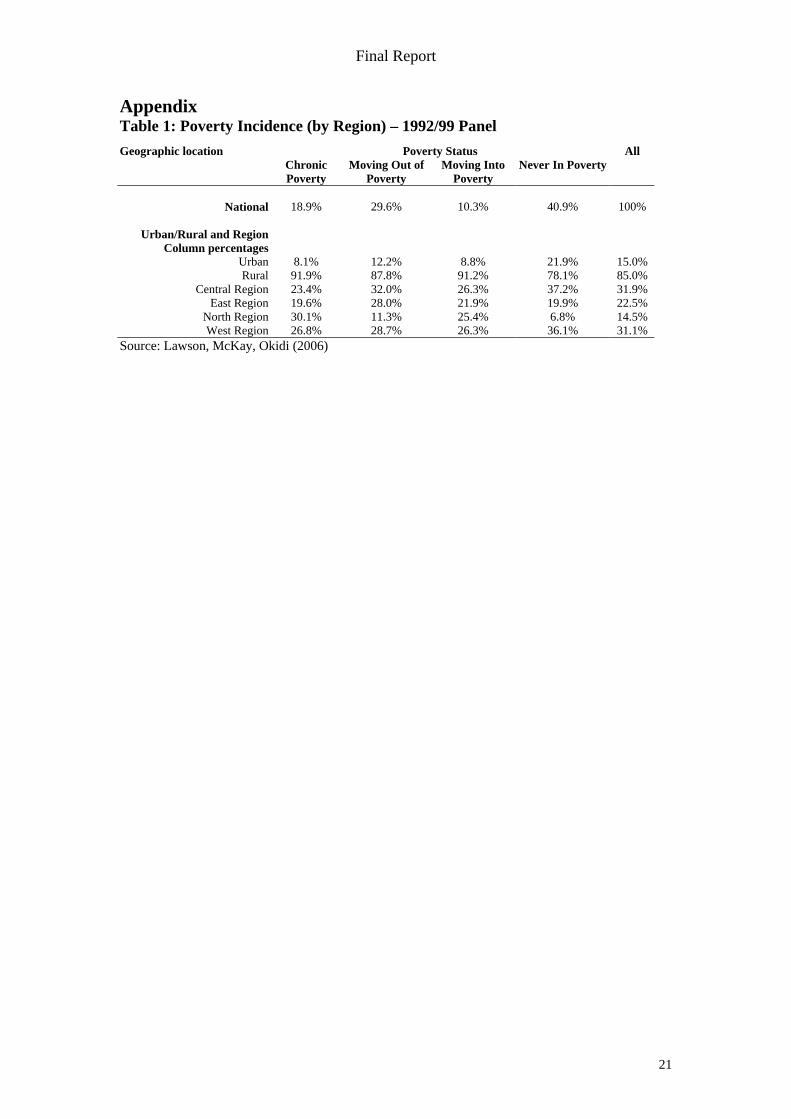
Quantitative DataSpecifically, life history interviews were carried out on the households that were in anationally representative sample of 1,103 households that had been interviewed forquantitative data in both 1992 and 1999 (a two wave panel).5 Based on the country’saccepted monetary based poverty measures, a sample of households that areChronically Poor (Poor in both periods), Never Poor, Moving Into Poverty, andMoved Out Of Poverty were selected (see Appendix Table 1 for a summary of thenational figures of households defined as chronically poor, moved into poverty,moved out of poverty, never poor).
The sampling of households to be selected for further interview was based on theproportions in the panel, with more than 40 households interviewed (comprisingroughly equally proportions of households, across several districts and 3 regions, thatwere persistently poor, moved into poverty, moved out of poverty and have neverbeen poor). For logistical, purposes and due to a restrictive budget, the majority (34)of the interviews took place in the 3 Central Region districts of Masaka, Mukono andLuwero. A further 9 households were collected in the Eastern Region and NorthernRegions – some households of which formed a three wave quantitative panel form the1992/99 national household panel and the 2005 Northern Ugandan Survey.
Qualitative Data - Life History and TimelineThe main qualitative method of detailed life histories followed the approach of asemi-structured format providing comparative information about households as wellas record responses to open-ended questions that arise during the course of interviews.The latter focused on critical incidents, events and factors identified by householdsand information that households identify as important but was not part of thequestionnaire design.
The life history and timeline traced an individual’s life from childhood to the presentday, focusing on key events. As with Bird and Shinyekwa (2003), by talking to aperson about their life we also hoped to identify path-determination in individuals’lives and to pinpoint key moments of choice – or the absence of choice, but with theadvantage of also having robust quantitative panel data to underpin this.
5 To ensure that the panel households were the same in both periods, a two part matching process wasundertaken. The first stage matched the sex and age of the household head, allowing for an acceptableerror range given uncertainty about precise ages etc. A second stage focused on those householdswhose head had changed over the period, for example where a household head had died and anothermember of the family had become the new head. See Lawson et al. (2006) for further details.
Final Report
7
4. Empirical Analysis
This section is disaggregated into the three main research themes of HIV/AIDS/IllHealth, Assets, and Gender Inequality and their interconnections withpoverty/inequality dynamics. However, we also extend the section by providing arelatively succinct summary of the other key findings. We restrict our primaryanalysis to the aforementioned areas as these were themes that highlighted by theinterviewed households as being particularly important, but were also ‘priorityresearch’ areas in the Research Programme of PMAU, MFPED.
For each of the aforementioned areas we firstly highlight what we can establish byundertaking a pure quantitative analysis. Even considering the large volume ofquantitative poverty research, we differentiate from a large section of this priorresearch by utilising the 1992/99 panel data and focusing exclusively on dynamics.Although previously published, and unpublished, work has utilised such data, it hasrarely, if at all, provided exclusive focus on such issues. Hence, these quantitativefindings in themselves add value to our understanding of such issues. We then followup the quantitative findings with examples of how life history (and timeline) analysiswere then used to further our understanding of the propagators, maintainers andinterrupters of poverty.
Ill Health/HIV/AIDSOf the previous econometric work that has touched on ill health and poverty dynamics(Deininger 2003, Lawson 2004) an association between the two has been established.However, by using the 1992/99 panel data we can see from both descriptive andeconometric analysis that ill health not only appears to be associated in some waywith both chronic and transient poverty, but particularly with households that havemoved into poverty, or are chronically poor.
• For example, Table 1 indicates that initial health status of the household headappears to be associated with households that move into poverty (chronicallypoor) – above average proportions, 28.3% (21.8%) of households that moved intopoverty (chronically poor) were headed by somebody who was sick.
• Above average proportions (8.08%) of households, that moved into poverty, wereheaded by somebody who was suffering from a long term sickness.6
Table 1: Chronic and Transient Poverty By Health StatusChronic
PoorMovingout of
Poverty
Moving into Poverty
Never InPoverty
All
(1) (2) (3) (4) (5)Household Head Health Status
Proportion of households with head who has along term sickness (>10 days), in 1992 6.84% 6.44% 8.08% 6.92% 6.87%
Proportion of households with head sick, in 1992 21.8% 15.6% 28.3% 18.9% 17.9%
6 NOTE: Ideally, when looking at long term sickness, in the context of microdata, one would like toanalyse HIV/AIDS. However as this was not accurately recorded in the UNHS 1999 survey, a proxy of‘long term sickness’ is used for HIV/AIDS and for those individuals with more severe sickness. Thereare obvious drawbacks to this assumption, therefore limiting the conclusions that can be drawn aboutHIV/AIDS.
Final Report
8
We can also see from econometric analysis in Appendix Table 2 that:
• If a household head is sick, in 1992, then the household is significantly associatedwith an increased probability of moving into poverty (by 3.5 percentagepoints)…
• …and significantly associated with a reduced probability of never being poor(6.7 percentage points).7
• In addition, households headed by females who are ill face a higherprobability of moving into poverty, compared with households headed by illmen.8 In fact, households headed by women and suffering from (long term)sickness are up to (15) 7 percentage points more likely to fall into poverty thansimilarly defined male headed households.
Such findings add value to our understanding of such issues, however, they still donot tell us the ‘full story’ regarding the processes through which ill health might thenresult in a household moving into poverty or becoming chronically poor? Thedirection of causality is unclear, for example, are households more likely to bechronically poor/move into poverty and as a result of being unable to eat then fallsick, or vica versa. In addition, the quantitative data analysis was also unable to clarifyhow HIV/AIDS was related to poverty dynamics – primarily because large scalehousehold data on such issues tends to very poor. ‘Q2’ research enlightens us further.
In the life history interviews, a number of households highlighted ill health to be amajor influence in their deteriorating welfare status. We use a timeline example, andlife history extracts, from a household that moved into poverty to highlight somecommon findings regarding the impact of Ill health/HIV/AIDS on welfare status.
The first point to note is that, upon corroboration of the quantitative micro panel data,we find that it correctly suggested the household to have moved into poverty.However the time line and detailed qualitative information only support this after themid 1990’s coffee boom ended. In fact, when originally interviewed the householdhead identified the 1990’s as ‘very good times’. She explains the primary reason forthis as being:
• She “….could would work for labour and brew beer” In addition she used to dig,produce, collect and sell maize. ‘Somebody next door used to buy the maize’.
• Several of her children used to crop the land and trade coffee. ‘We could choosewhat to eat whenever we wanted….. and …even owned a radio”.
However, in the mid to late 1990’s all of the adult working children died, with thisappearing to be the major cause of the downturn (see figure 1) and subsequent‘movement into poverty’.
• The household head remarks that “four of the main income earning children died….. one of my sons and daughters died of AIDS (1999, 1992 respectively), andtwo sons died of Malaria (1992, and 1996)”.
7 All significant results are at or below the 5% level.8 Significant at the 10% level for sick regressions and at the 5% level for long term sickness results.
Final Report
• In addition, since 2000 though the household head thinks her old age has causedthings to get worse as she can’t dig and she can’t see properly and “has weaknessin her hands”.
• ‘As much as there were good times we now no longer have a radio (we sold it for80,000 Ug Sh when he (the son with AIDS) was sick, to pay for the healthcentre drugs). After this the house started falling down etc. At the time of death,however a local organisation did help with the funeral costs’.
• The household head currently eats 1 to 2 meals per day, compared with 3meals in the mid 1990’s.
20051960 1992
Figure 1: TIMELINE (Drawn by Interviewee)
1 of 5Siblings - 3girls and 2boys.
Produced 12 childrenin 1 marriage. Theygrew a lot of coffeeand a lot of maize, 3bedrooms in thefamily home – theystill own this but it isvery ‘run down’ andthey don’t have themanpower to crop theland.
Lookedafterlivestockfor fatheruntil theage of 18.
Lady is too oldto crop land,mature childrenhave died,daughter nowin jail.
Birth1927
Although the above focuses only on one qualitative fHIV/AIDS and general sickness can impact on a househothe processes underpinning such a movement were comthe life history data collection. A very common sequdynamics associated events identified by both chronihouseholds was identified as follows:
1) Many households increasing welfare levels (often afcollected), sometimes acquiring both productive productive assets (radios etc.) during the coffee boom
2) Such periods of increased wealth often resulted in an appears an increase in the number of sexual partnersincreased incomes during this time).
3) Serious sickness of the ‘main breadwinners’ followearners being unable to work but also ‘draining’ (commonly after reducing food consumption – see nebills or food consumption.
4) The additional household size that resulted form the baccentuates the households reduction in welfare – par
3 mature childrenworking,household “didwell”, traded,cropped etc.,Times were goodbut children thendied of AIDS(1995/6/9) – soldassets.
9
ollow up example of howld that moved into poverty,monly observed throughoutence of ill health/poverty
cally and transiently poor
ter the 1992 data had been(livestock etc.) and non-of the mid 1990’s.increased family size (and it – particularly for men who
ed, with the main incomefinances and selling assetsxt section) to pay for health
oom then, at a later, furtherticularly when the offspring
Final Report
10
were of a schooling age and extra resourcing demands resulted (e.g. school fees,increased health costs, increased food demands of children).
We have confirmed that the pure quantitative analysis indicates a clear associationbetween sickness and poverty dynamics, but this appears to be more closelyassociated with households that were chronically poor or moving into poverty, thanothers. However, the life history information has provided clearer understandingregarding the underpinning process. If the households are to be believed the causalityis one of sickness that then causes reduced welfare/movement below the (officialmonetary) poverty line. This appears acceptable for several reasons, but no more sothan because many households reduced food consumption as a result of reducedincomes (i.e. the breadwinner being unable to work) - by implication such householdsare more likely to experience a decline in, officially defined, welfare as the acceptedpoverty line is derived from food consumption. Such a process appears to have beenparticularly accentuated during the high (but declining) period of HIV/AIDSprevalence, in Uganda.
AssetsThere is relatively little prior quantitative analysis that has focused on the issue ofassets. Perhaps of particular note is the work by Okidi (2004) that used theretrospective 1999 data to produce a descriptive analysis of the 1992/99 changes inassets. Inter-linking similar data with poverty dynamics, and extending theaforementioned results we find, amongst other things that (see Table 2):
• Chronically poor households are less likely to own cattle, and to own smallerquantities when they do.
• Both the chronically poor households and those that moved into povertycultivated less land, and experienced smaller increases in land areacultivated, between 1992 and 1999, than compared with h average.
Table 2: Land and Cattle Assets and Poverty DynamicsPoverty status 1992/99
ChronicPoor
Movingout of
Poverty
Movinginto
Poverty
Never InPoverty
All
(1) (2) (3) (4) (5)Asset ownership
Average land area cultivated 1992 2.71 2.75 2.47 2.76 2.72Average land area cultivated 1999 3.27 4.90 2.41 5.56 4.60
Average number of cattle owned 1992 0.85 0.98 1.02 1.01 0.98Average number of cattle owned 1999 0.72 0.96 0.82 1.56 1.14
As with the ill health and poverty dynamics descriptive data, the data for assets andpoverty dynamics are enlightening but tell us little regarding the interesting storiesthat underpin these movements – for example, they don’t inform us of:
• Why Chronically Poor Households Have Experienced Smaller Increases inLand Area Cultivated?
• If Ill Health Leads To Asset Depletion and Therefore Move Households intoPoverty?
Final Report
11
When we cross tabulate ill health, asset levels and poverty dynamics status ofhouseholds (Table 3) we find:
• Comparing healthy and non-healthy headed households (column 11) that not onlyare land areas smaller for the sick than non-sick (3.54 acres and 4.59 acresrespectively) but land increases for the sick are almost half that of the non-sick(65.7% compared with 36.7% for the sick). Similar (un-presented) trends werefound to also exist for other enterprise assets such as chickens and cows.
Once again however, although the data shows that sick households have lower landincreases it does not inform us of the very processes that underpin this, in addition tothe direction of causality, i.e.
• Does ill health propagate the asset depletion which then forces households tomove into poverty?
• Does the movement into poverty cause ill health, by having less money tospend on food, reducing consumption etc.? and then asset sales occur to coverfor the loss in income?
Unfortunately, we can not provide clear answers to such questions from the 2 wavepanel data, and even adding community based participatory information does notcompletely clarify the situation. However, by collecting life history information fromthe same households for the descriptive where generated allows us to at least startproviding insightful answers to such questions. In this case, we explore this further,through the example of a Never Poor household, with a brief household summaryprovided as a background starting point (Box 3)
BOX 3: Summary Box – A ‘Never Poor’ Household
An agricultural/rural household that has met its needs over the years through mixes offarming, fishing and charcoal burning. They managed at one stage to accumulateenough to build a good quality house. Income has levelled out since they werestopped from charcoal burning in mid/late 1990s. Food production appears to havedropped in last 4 years as ‘B’ has been unwell and unable to dig. Main problem theyhave faced is paying health costs – had to sell a bicycle to cover ‘A’’s costs and ‘B’has not had an operation she needs (80,000 Ug sh). Having a large family has reducedthe possibility for accumulation of non-human assets and increased health/educationexpenses. There are also effects of ‘B’’s 11 pregnancies on her health.
Final Report
12
Table 3: Household Head Health Status and Assets
Chronic Poor Moving out ofPoverty
Moving intoPoverty
Never In Poverty All
Asset Levels and Change Sick (1) Not Sick(2)
Sick(3)
Not Sick(4)
Sick(5)
Not Sick(6)
Sick (7) Not Sick(8)
Sick(10)
Not Sick(11)
Number of Cows at 1992 0.41 0.91 1.17 0.99 1.39 0.89 1.27 0.98 1.13 0.97Number of Cows at 1999 0.15 0.78 0.45 1.13 1.36 0.70 1.21 1.62 0.88 1.22
Moving out of Poverty 27.8% 29.8% 33.3% 16.7% 29.6% 21.1% 27.9% 19.1% 39.4% 30.3% 29.7%Moving into Poverty 13.9% 10.0% 6.7% 5.6% 9.9% 0.0% 17.6% 14.9% 8.5% 11.8% 10.4%
Never In Poverty 50.0% 40.2% 43.3% 44.4% 41.1% 68.4% 26.5% 46.8% 37.2% 40.4% 40.9%
Final Report
13
Even for this ‘never poor’ household assets play a major role during ‘times of crisis’.However, the life history information reveals the story to be more complex than ahousehold that just sells assets when faced with unmanageable health care, or othercosts. For example we found that:
• There appears to be clear ‘preferencing’ in relation to the types of assets sold(e.g. luxury goods such as radios were sold first), but across household we foundthat the willingness to sell any assets were dependant upon the age andgeographical location (e.g. older household heads were substantially less willing,than younger headed households, to sell any livestock – firmly believing that theywere ‘looking after the assets on behalf of future generations’). It was clear thatsuch households realised that selling such assets would substantially reducecoping strategies in the future.
• However, such a process also involves an element of Asset Smoothing – e.g. inorder to pay for medical bills/transport etc., food consumption was commonlyfound to be reduced for a period of time. Only after experiencing reduced foodconsumption would assets then be sold.
Therefore, by combining the aggregated national level quantitative finding with anadmittedly small, but consistent, number of life histories it appears that virtually allhouseholds that resorted to ‘desperation sales’ (particularly as a result of terminalsickness which accentuated health costs), had firstly ‘asset smoothed’. In otherwords, all such households reduced food consumption in the first instance (many form3 to 2 meals per day, but some from 2 to 1 meal per day) prior to selling assets. It wascommon to find younger household heads to prefer asset smoothing by obtaining anMFI loan, and not reducing food consumption because they felt that they would beable to earn money to repay such loans in the future.
GenderWe have already seen how the quantitative data indicates that households headed byfemales who are ill face a higher probability of moving into poverty, compared withhouseholds headed by ill men. We now try and take this forward and see how thequantitative data can provide insights regarding issues such as asset inequality, acrossgender. For example, descriptive data in Table 5 would suggest that Women HeadedHouseholds (WHHs) are more likely than Male Headed Households (MHH), to reportsmaller areas of cultivatable land among their assets, as at 1992 (Columns 5 and 10),1999 and 2003.
Table 5 : Cultivated Land Assets – Disaggregated by Marital Status and Gender ofHousehold Head
Source: UNHS1999 (for 1992&1999 data) and UNHS 2002
Final Report
14
In addition, if we look at gender inequality issues, for example for health care access,we can see from Table 6 that within households adult women are more likely to besick (31.8%) than men (24.3%). If we consider health care demand relative to theincome of a household, using the 2002/3 data, we also find women in the poorestand richest households receive disproportionately less treatment, when sick,compared to men.9 Once again, however this tells us little regarding the process thatunderpins and explains WHY?
Table 6: Proportion of Men, Women, Boys and Girls Within Households –Sick (not) and Having Treatment (not)
Sick Not sick Treatment No Treatment10
Men 24.3% 75.7% 89.7% 10.3%Women 31.8% 68.2% 90.0% 10.0%
Boys 26.0% 74.0% 93.8% 6.2%Girls 26.7% 73.3% 93.9% 6.1%
Source: UNHS 2002/3
Although due to limiting sample sizes we were unable to further test whether WHH’sare were statistically associated with being chronically poor a number of genderassociated findings where observed.
In particular, the descriptive data suggested:• That there appeared to be an element of gender inequality, in favour of men,
when seeking health care. The life histories provide only limited support for this.For example, only in one instance (chronically poor household) was it highlightedthat women were discriminated against when medical care was being sought.Even in consistently poor households there appeared to be little gender bias inrelation to who received medical care.
• However, in several household the social safety nets of WHH’s appearedsubstantially less developed than those of MHH’s. There were several instances ofthis however one example of a ‘never poor’ household highlights this better thanmost.
The household was relatively comfortably off, but then her husband’s HIV/AIDSbegan to make him weak and he could not work much and she had to spendmore and more time taking care of him. The wife became the main provider. Ashe got weaker and could not go out (and 8 months before his death he becamebed ridden) “….friends visited and gave him a little money or gift - they neverhad a problem trying to get him sugar, milk, eggs, fruit, fish etc. because theywere commonly given as gifts. He had many friends because he used to drinkbeer in the evening and when they did not see him they would call around.”
However after the man died she found out that she had HIV/AIDS but she didnot receive similar support because “… being a woman, she spent more of her
9 Health care demand refers to the whether health care has been sought when an individual is sick.10 Unless otherwise stated – No treatment refers to no medical care of any type (i.e. not even hometreatment)
Final Report
15
time at home and did not make such wide social networks, therefore limitingempowerment….”.
The above partly explained the very common finding that few women, particularly inrural areas, were partaking in formal labour market activities. This supportseconometric findings that suggest potential gender bias in formal labour marketparticipation. When asked explicitly about this issue, several individuals commentedon their ‘limited contacts’, further supporting the social network finding (above).However, several of females also commented on the need to ‘sleep with employers’ toget a job.
Other FindingsOf the other finding being part of organisations, even if it was attending church on aregular basis appears to have increased peoples coping strategy, though increasedassistance networks. Of particular note of the other highlighted findings the issue ofbeiland eviction/lack of land access was mentioned regularly
Limited Access to Land, Loss/Eviction from Land was noted as a growing concernby several, mostly chronically poor, households but also in community groupparticipatory meetings. For example, one household had bought 5 acres of land in2001, and although they possesses a ‘letter of receipt’ the title holder sold off a verybig piece of land that included their 5 acres “….50-60 households on this land wereall chased off…”. Some households noted this to be a direct result of recent landreforms. Boxes 2 & 3 provide an example of how this has further impacted on achronically poor household.
BOX 2: (Abbreviated) Life History11 ….of a ‘Chronically Poor’ Household
‘A’ was born in 1947 in the village that he currently resides. He is the oldest of 4siblings (2 boys, 2 girls – one of which died at a very young age). When ‘A’ leftschool he looked after his father’s cattle (there were 2 cows when he started doingthis, but this increased to 40, by 1983). However, the “by the end of the war, in 1986,all of our cows had been stolen or had died”. “ ..we then tried to accumulate assetsonce again and in 1992 we bought 2 cows, by 1995 we had 6, but since then 4 of themdied and 2 were sold when the ‘old man’ was sick (and died in 1996). The entirefamily has recently been evicted from the land that they had occupied, without a landtitle, since 1959. This has de-stabilised their lives and created great uncertainty.Despite the household being headed by a hard working couple they are now unable tomake any agriculturally related medium term planing decisions.
Despite some ‘good times’ prevailing in the mid-1990’s (e.g. the number ofcows/assets increasing until the death of household members forced sales), tt is clearthat psychologically at least things are worse and the families long term incomeprospects are diminished due to land insecurity (see box 3).
11 See Separate ‘Time Line Information Box’ for further life history information on this individuals andhousehold.
Final Report
16
A common finding from many interviews was that several markedevents/depressions appeared to have compounded poverty/welfare decreases inhouseholds. This seems to be in direct support of (Bird and Shinyekwa 2003) whofound that a series of shocks/problems often compounded each other. Using a multi-line analysis of a chronically poor household (same as in box 2) we are able tohighlight through the recent economic, occupation, education, social andpsychological, migration history of a chronically poor household head.
BOX 3:Detailed Life History (1992-99) + Timeline Information12
…of a ‘Chronically Poor’ Household
Economic (and Occupation) HistoryIn 1992 the household bought, with his father, 2 cows and by 1995 they had 6 cows.“I remember that my father bought a bicycle that improved our well being (+3) andthe cows also (+2). During this period things were good and in 1993 we built anadditional room onto his house. This put me/us at a good level of well being (3 or 4).However 4 cows then died and 2 were sold when the ‘old man’ was sick (he died in1996).
The crops grew well during the mid-late 1990’s. (+1) but not since then (-1). Thehousehold size has increased from 6 (1999) to 9 (2005) this has created extraeconomic pressure on us (-2). In 2003, 3 goats died (-2) and in late 2003 one of mysons died after being in hospital for some time, we had to borrow 100,000 Ug Sh(30gbp) for hospital fees. (-3)
In 2004 we were evicted from the land/home that we had stayed on since the 1960’s,by the owner who put herdsman and cattle on the land. This resulted in a very largedecline in our wellbeing as we had to move and I had no job (-5). Since then the manacross the road from where we now live (next door to the plot of land from which thehousehold was evicted) said he could stay on his land (increase of +1) so we now stayhere. In addition I also rent 1 additional acre (increase of +1) to crop food. However, Iwould like to plant cash crops on this additional land but can’t as the owner wouldcharge me (at the moment I pay rent ‘in kind’ – by giving the landlord crops).”
From an occupational perspective several of the economic history events overlap, butas a herdsman for his father and as an agriculturist for most of his life, the householdheads occupation was relatively stable until the deterioration in crop output and lossof land.
Social, psychological and cultural“In 1996 my father was sick the family still ate 3 meals per day and we didn’t borrowmoney - at the time of the funeral none of the family, including his father owedmoney to anybody. When my father died, this left a gap at the head of the family butI’ve tried to fill this (-1)
In 1998 and December 2003, my two sons died. The latter of these died in hospital,but we had to borrow money for hospital fees that we have still not repaid (-3). This
12 The number in brackets represents the level of severity attributed to an event by the householdrespondent.
Final Report
17
resulted in a very large decline in well being. Shortly after this, in 2004, we wereevicted from our house and land and I moved the entire family to town (for 6 months)but I could not find a job this was a very bad time for all of us. We didn’t haveenough money and we could not afford to send the penultimate child to school (-4).”
Late in 2004 a former neighbour told the head that he could stay on his land so theymoved to a plot of land and house that is adjacent to the old one. However, he can’ttell how long he will be at this current household and plot of land, and has not askedthe owner as he does not want the landlord to consider this. Therefore, although thingshave improved (+1 increasing overall welfare to –6): There is a feeling of greatuncertainty regarding the future, “we don’t know how long we have here, and thingsare very uncertain and I dare not ask the owner how long we can stay as this might be‘tempting fate’.” He says that there have been no good events recently, other than achild having been born (+1).
Education historyThe head of this chronically poor household has 2 years of primary education and hasnot completed any subsequent training, formal or otherwise, and as such feels that hiseducational status/history has remained relatively stagnant over the period in questionand has not improved or decreased his well being.
NOTE: “ “ indicate quotations from the interviewee
Combining the above details reveals the overall combined impact of economic,social, education and occupation history of this Chronically Poor household.
Figure 2: Consolidated Time Line Analysis for 1992-2005 (Chronically Poor Household)
• Firstly, the death of the father in 1996 caused a negative short term psychologicaland economic impact. However, this period also coincided with the loss of 4 cowsdue to disease therefore substantially depleting reserves to call upon inemergencies. Combining such events with the lower crop production thatfollowed, this marked a period of generally lower levels of welfare – partlyexplaining why the poverty gap, over the period 1992-99, increased for thishousehold.13
• Secondly, although the occupation remains the same in the late 1990’s thereis further economic and social downturn as deteriorating rainfall and crop salesreduce crop productivity and sales, combined with the death of one son.
• These events are shortly followed by a third series of shocks in 2003 whenassets are further reduced (death of goats through disease) and one son dies andland eviction (2004) (economic and social impacts).
Overall therefore, and regardless of however complex the quantitative analysis, weare sometimes restricted by what, even national representative, panel and crosssection data can inform us of (particularly when there are only 2 waves of panel data).For example, we found the quantitative data to indicate that ill health was associatedwith chronic and transient poverty – but this did not reveal to us the potentially morepolicy relevant stories/understandings relating to issues such as if distress sales ofassets do occur then at what point do families resort to selling the assets? or if ahousehold ‘asset smooth’ before selling assets? When we combined the life historyinformation we were able to provide a far richer understanding regarding a few of themain PROPOGATORS, MAINTAINERS AND INTERRPUTORS of poverty.
Before concluding with a summary of the findings and some brief policy issues, it ishowever worth providing a more substantive methodological comment.
13 The shortfall of the welfare of this poor household from the poverty line, expressed as a proportionof the poverty line, increased from 0.67 (1992) to 0.75 (1999).
Final Report
19
5. Summary
The research represents a relatively rare attempt at obtaining qualitative informationfrom the same households for which multiple wave multiplex income and expendituresurveys have been completed. Many previous attempts at combining quantitative andqualitative research have rarely been genuinely integrated in such a way.
In this instance the sampling frame of the quantitative panel was adopted for the lifehistory interviews, and although the sample was too small to be nationallyrepresentative, the idea behind the work was to produce one of the first integratedworks to highlight how such methods could be used to explain some of thePropagators, Maintainers, and Interrupters of Poverty. In this case, and consideringthe very limited funding, we were able to focus on three main issues of ill health,assets and gender.
From a thematic perspective despite focusing on 3 main areas, we have (hopefully)been able to show how the combined ‘Q2’ approach can provide a roundedunderstanding regarding some of the Propagators, Maintainers and Interrupters ofPoverty. Although it is recognised that the sample is fairly small and themesrestricted, it would appear fairly clear that what the likes of Appleton and Boothadvised in terms of combining research methods really can provide a deeper and veryfuller understanding of important poverty/inequality/dynamics issues.
In particular the Q2 approach adopted here, has helped further explain a number ofissues that lay behind some of the ‘themed’ research areas highlighted by TheGovernment of Uganda. For example:
• There appears to be more than just an ‘association’ between sickness/ill health andpoverty dynamics. At least in the processes highlighted by the interviewed, thereappears to be direct causality between sickness and movements into poverty.
• There appears to be clear preference ordering in relation to the types of assetssold ‘in times of crisis’ (e.g. luxury goods such as radios were commonly soldfirst), but the willingness to sell any assets was dependant upon the age andgeographical location of the household/head (e.g. older household heads weresubstantially less willing to sell any livestock – firmly believing that they werelooking after the assets on behalf of future generations). Such householdsrecognised their limited potential in regenerating such assets and selling suchassets would substantially reduce future coping strategies.
• Asset Smoothing seems to be very common – e.g. in order to pay for medicalbills/transport etc., food consumption of the chronic and transiently poorhouseholds was virtually always reduced for a period of time, before selling assets(from a pure food poverty consumption measure perspective, this may mean thatthey immediately fall below the poverty line). However, asset smoothing wasfound to be highly dependent upon the age and geographical location of thehousehold. In some younger headed households both Asset and ConsumptionSmoothing occurred at the cost of obtaining a microfinance loan.
Final Report
20
• Hence, we found households avoided moving into (deeper) poverty by reducingfood consumption, selling assets, and taking loans, but the order and extent towhich these occurred varied by socio-economic characteristics.
• Gender inequality through social networks may be present and may at leastpartly explain some of the reasons for higher proportions of WHH’s beingchronically poor. “Limited contacts” in the job market also appear to partlyexplain why gender inequalities exist in formal labour market participation.
Of the other findings, not covered in detail above, we also found that:
• The national, panel and cross section, quantitative household data suggest that anincrease in household size is statistically associated with a movement into poverty.This was also supported by the life histories. A very common finding was forhouseholds to experience increased wealth (e.g. mid 1990’s coffee boom) and forhousehold sizes to increase. But it is only 5-6 years later (possibly when incomeshave fallen) that delayed costs of school fees etc. start causing a monetaryimpact/problems - some of which are solved by selling assets.
• The panel data analysis does not clearly ‘pick up’ potential vulnerabilityhouseholds i.e. the extent that households may be about to have to adopt or ‘coverfor’ sick brothers and sisters who have siblings and who are likely to be adoptedinto the family. The qualitative interviews allow both current and futurevulnerability to be assessed to a greater extent.
• ‘Disputed land’ was mentioned by several households, and in group participatorymeetings, as a growing concern in communities. For example, one household hadbought land of 5 acres in 2001 although he possesses a ‘letter of receipt’ the titleholder sold off a very big piece of land that included his 5 acres. “…..50-60households on this land were all chased off…”. Limited access to land wasparticularly prevalent amongst poorer households
From a policy perspective, perhaps the most topical, and controversial, finding relatesto that of land access, as these preliminary findings seem to indicate at the micro levelthere could be a limiting of agricultural productivity, due to lack of access/ability toplan long term. This was particularly the case for the poorer households.14 Further tothis, and perhaps equally as sensitive, but building on a steadily growing Ugandaspecific population growth literature, it is apparent that having a larger family, andparticularly larger dependency ratios, is associated with being chronic and transientlypoor.15 With such effects often greatly accentuated by illness and death, such findingperhaps point to the importance of social protection as a having key role to avoidpersistent poverty and inequality.
14 Further microeconometric evidence focusing on productivity would assist this claim.15 This is consistent with an array of cross country poverty dynamics evidence e.g. Baulch andMcCulloch for Pakistan etc.
Change number work aged 0.0061 (0.152) -0.0208 (-0.796) 0.0133 (0.375) 0.0014 (0.074)* Significant at 10% level** Significant at 5% level*** Significant at 1% levelDefaults – Missed Education (for head and spouse), Urban West, Non Agricultural Wage Employment; Obs 1005
Final Report
23
References:Adato, M, F. Lund and P Mhlongo, (2004), “Methodological Innovations in Researchon The Dynamics of Poverty: A Mixed-Method Longitudinal Sutdy in Kwa-ZuluNatal, South Africa”, Q-Squared in Practice Conference: A Conference onExperiences of Combining Qualitative and Quantitative Methods in PovertyAppraisal, University of Toronto.
Appleton, Simon and David Booth (2001) ‘Combining Participatory and Survey-based Approaches to Poverty Monitoring and Analysis’, Background Paper for theWorkshop to be held in Entebbe, Uganda, 30 May – 1 June.
Bird, K. and Shinyekwa, I. (2003), “Multiple Shocks and Downward Mobility:Learning From the Life Histories of Rural Ugandans”, Chronic Poverty ResearchCentre Working Paper no. 36.
Booth, David, I Holland, J. HentscheLand, P Lanjouw and A Herbert (1998), “Participation and Combined Methods in African Poverty Assessment: Renewing theAgenda”, Social Development Division, African Division, DFID London, February
Carvalho, S and Howard White (1997), “ Combining the Quantitative and QualitativeApproaches to Poverty Measurement and Analysis”, World Bank Technical Paper No.366
Chambers, Robert (2001), “Qualitative Approaches: Self Criticism and What Can BeGained from Quantitative Approaches”, presented at ‘Qual-Quant: Qualitative andQuantitative Poverty Appraisal: Complementarities, Tensions and The Way Forward’,held at Cornell University March 15-16.
Deininger K, and Okidi J, (2003), “Growth and Poverty Reduction in Uganda: 1999-2000: Panel Data Evidence”, Development Policy Review 21(4): 481-509.
Frank Ellis, Sarah Ssewanyana, Bereket Kebede and Eddie Allison (2006), “Patternsand Changes in Rural Livelihoods in Uganda 2001-05: Findings of the LADDER 2Project”, EPRC/ODG Report.
Kanbur, Ravi (2001), “A Commentary on Qualitative and Quantitative PovertyAppraisal”; presented at ‘Qual-Quant: Qualitative and Quantitative Poverty Appraisal:Complementarities, Tensions and The Way Forward’, held at Cornell UniversityMarch 15-16.
Kanbur, Ravi (2001a), “Qualitative and Quantitative Poverty Appraisal: The state ofPlay and Some Questions”, presented at ‘Qual-Quant: Qualitative and QuantitativePoverty Appraisal: Complementarities, Tensions and The Way Forward’, held atCornell University March 15-16.
Kanbur, Ravi and Paul Shaffer (2005), “Epistemology, Normative Theory andPoverty Analysis: Implications for Q-Squared in Practice” Q-Squared Working PaperNo. 2 , University of Toronto
Final Report
24
King, G. R.O. Keohane and S. Verba (1994), Designing Social Inquiry: ScientificInference in Qualitative Research, Princeton University
Lawson, David (2003), “Gender Analysis of the Ugandan National HouseholdSurveys (1992 – 2003)” Uganda – Revision of the Poverty Eradication Action Plan(PEAP) 2003.
Lawson, David (2004), ““How Important is Health in Influencing Persistent Poverty:Evidence from Uganda”, Chronic Poverty Research Working Paper No. 41.
Lawson, David, Andy McKay and John Okidi (Forthcoming - 2006), “PovertyPersistence and Transitions in Uganda: A Combined Qualitative and QuantitativeAnalysis”, Journal of Development Studies.
Okidi, J. (2004), “Trends in Ugandan Household Assets During the 1990’s”,Economic Policy Research Centre Working Paper, Makerere University.
Okidi, J. and G. Kempaka (2002), “An Overview of Chronic Poverty andDevelopment Policy in Uganda”, Chronic Poverty Research Centre Working PaperNo. 11, January.
McGee, Rosemary (2000), “Analysis of Poverty Assessment (PPA) and HouseholdSurvey Findings on Poverty Trends in Uganda”, Journal of Development Studies.
Parker B. and V. Kozel (2004), “Understanding Poverty and Vulnerability in India’sUttar Pradesh and Bihar: A Mixed Method Approach”, Q-Squared in PracticeConference: A Conference on Experiences of Combining Qualitative and QuantitativeMethods in Poverty Appraisal, University of Toronto.
Ravallion, Martin (2001), “Can Qualitative Methods of Help Quantitative PovertyMeasurement?”, presented at ‘Qual-Quant: Qualitative and Quantitative PovertyAppraisal: Complementarities, Tensions and The Way Forward’, held at CornellUniversity March 15-16.
Republic of Uganda (2000), Uganda Participatory Poverty Assessment Report:Learning From the Poor, Ministry of Finance, Planning and Economic Development,Kampala.
Republic of Uganda (2005), Moving out of Poverty Uganda Case Study:Understanding Growth and Democracy for the Bottom-Up – Concept Note: Ministryof Finance, Planning and Economic Development, Kampala.
Thorbecke, Erik (2001), “Tensions, Complementarities and Possible ConvergenceBetween the Qualitative and Quantitative Approaches to Poverty Assessment”,presented at ‘Qual-Quant: Qualitative and Quantitative Poverty Appraisal:Complementarities, Tensions and The Way Forward’, held at Cornell UniversityMarch 15-16.