Quantitative and qualitative demand for slum and non-slum housing in Delhi: Empirical evidences from household data Sohail Ahmad a, b, * , Mack Joong Choi c , Jinsoo Ko c a United Nations University Institute of Advanced Studies (UNU-IAS), 1-1-1 Minato Mirai, Nishi Ku, Yokohama 220-8502, Japan b Tokyo Institute of Technology, Meguro, Tokyo, Japan c Graduate School of Environmental Studies, Seoul National University, Republic of Korea Keywords: Housing demand Price and income elasticities Housings attributes Slum and squatter Delhi abstract This study estimates quantitative and qualitative demand for housing using household survey data in Delhi. Both housing demand and demand for housing attributes are further stratified by settlement typeeslum and non-slum, and by tenure e owner and renter. The estimation results indicate that housing demand is inelastic with respect to price and income, whereas the magnitude of price elasticity is overall smaller than that of income elasticity in absolute term. In slum households, however, price elasticity is larger than income elasticity. The estimates of housing attributes also show that floor area, availability of a separate kitchen, permanent material of roof, independent latrine, drainage, and flat type of dwelling structure, among others, are important determinants of rent. In slum households, however, only quantity variables matter while quality variables have little effect on rent. This study concludes with policy prescriptions including sufficient urban land supply, which is required to cope with income growth of non-slum households on one hand and to provide low cost dwelling for slum household on the other hand. Ó 2012 Elsevier Ltd. All rights reserved. Introduction Today, unprecedented in history, we are living in the urban world where urban population surpasses rural. Nevertheless, one-third of the global urban population live in the slum and squatter type of settlements and more than half of them live in Asia (UN-Habitat, 2003). In India, for example, 44% of urban households live in the slum (UN-Habitat, 2008, p. 264). Specially in Delhi, the capital city of India, the urbanization level reached 93% according to 2001 census data whereas housing shortage in urban Delhi was estimated as 1.13 million as on 2007. As a result, about three-fourth of Delhi’s population lives in uncontrolled urban settlements, including slums and squatters (Dupont, Tarlo, & Vidal, 2000; Kumar, 2006, 2008; Sivam, 2003). Urban and housing policies, in an effort to overcome the gap between demand and supply of urban housing, require adequate information about the characteristics of housing demand. In particular, empirical evidences on household preferences at disag- gregate level are useful for matching supply with demand effectively. Moreover, estimates for housing demand need to be area-specific because housing market is divided into submarkets by urban area due to location dependency. In this respect, while a number of studies have raised issues of housing supply constraints in Indian cities (Ahmad & Choi 2009, 2011; Kumar, 2008; Kundu, 2004; Pugh, 1991; Sivam 2003; Srirangam, 2000), empirical literatures on demand side are relatively rare. There are only three studies conducted to estimate housing demand at the national level (Bandyopadhyay, Kuvalekar, Basu, Baid, & Saha, 2008; Dholakia, 1980; Tiwari & Parikh, 1998). And only three studies have appeared at the city level in India, namely, Ahmedabad (Mehta & Mehta,1989), Bangalore (Malpezzi & Tewari, 1991) and Mumbai (Tiwari, Parikh, & Parikh, 1999). Furthermore, little is known on housing market in slum area. Our study attempts to fulfill this gap and helps to understand urban housing market in Delhi. Specifically, this study aims at empirically estimating housing demand, using household survey data in Delhi. Housing demand comprises both quantitative and qualitative levels, where the latter is estimated by demand for housing attributes for the first time for the local housing market in Delhi. In particular, distinguished from previous studies, the esti- mations are further stratified by slum and non-slum, in order to appropriate policy prescriptions, since there are significant differ- ences in characteristics of household, dwelling and neighborhood between the two types of settlement (for detail see Table 3). This study adopts slum definition by National Sample Survey Organization (NSSO) (2004) which includes JJ clusters 1 notified and non-notified * Corresponding author. United Nations University Institute of Advanced Studies (UNU-IAS), 1-1-1 Minato Mirai, Nishi Ku, Yokohama 220-8502, Japan. E-mail address: [email protected](S. Ahmad). 1 JJ stands for the Hindi words jhuggi jhopdi, a colloquial term for the hut of the poor. Contents lists available at SciVerse ScienceDirect Habitat International journal homepage: www.elsevier.com/locate/habitatint 0197-3975/$ e see front matter Ó 2012 Elsevier Ltd. All rights reserved. doi:10.1016/j.habitatint.2012.02.003 Habitat International 38 (2013) 90e99
Transcript
at SciVerse ScienceDirect
Habitat International 38 (2013) 90e99
Contents lists available
Habitat International
journal homepage: www.elsevier .com/locate/habitat int
Quantitative and qualitative demand for slum and non-slum housing in Delhi:Empirical evidences from household data
Sohail Ahmad a,b,*, Mack Joong Choi c, Jinsoo Ko c
aUnited Nations University Institute of Advanced Studies (UNU-IAS), 1-1-1 Minato Mirai, Nishi Ku, Yokohama 220-8502, Japanb Tokyo Institute of Technology, Meguro, Tokyo, JapancGraduate School of Environmental Studies, Seoul National University, Republic of Korea
Keywords:Housing demandPrice and income elasticitiesHousings attributesSlum and squatterDelhi
* Corresponding author. United Nations University(UNU-IAS), 1-1-1 Minato Mirai, Nishi Ku, Yokohama 2
0197-3975/$ e see front matter � 2012 Elsevier Ltd.doi:10.1016/j.habitatint.2012.02.003
a b s t r a c t
This studyestimates quantitative andqualitative demand for housing using household surveydata inDelhi.Both housing demand and demand for housing attributes are further stratified by settlement typeeslumand non-slum, and by tenure e owner and renter. The estimation results indicate that housing demandis inelastic with respect to price and income, whereas the magnitude of price elasticity is overall smallerthan that of income elasticity in absolute term. In slum households, however, price elasticity is larger thanincome elasticity. The estimates of housing attributes also show that floor area, availability of a separatekitchen, permanent material of roof, independent latrine, drainage, and flat type of dwelling structure,among others, are important determinants of rent. In slum households, however, only quantity variablesmatter while quality variables have little effect on rent. This study concludes with policy prescriptionsincluding sufficient urban land supply, which is required to cope with income growth of non-slumhouseholds on one hand and to provide low cost dwelling for slum household on the other hand.
� 2012 Elsevier Ltd. All rights reserved.
Introduction
Today, unprecedented in history, we are living in the urban worldwhere urban population surpasses rural. Nevertheless, one-third ofthe global urban population live in the slum and squatter type ofsettlements and more than half of them live in Asia (UN-Habitat,2003). In India, for example, 44% of urban households live in theslum (UN-Habitat, 2008, p. 264). Specially in Delhi, the capital city ofIndia, the urbanization level reached 93% according to 2001 censusdata whereas housing shortage in urban Delhi was estimated as 1.13millionason2007.As a result, about three-fourthofDelhi’spopulationlives inuncontrolledurban settlements, including slumsandsquatters(Dupont, Tarlo, & Vidal, 2000; Kumar, 2006, 2008; Sivam, 2003).
Urban and housing policies, in an effort to overcome the gapbetween demand and supply of urban housing, require adequateinformation about the characteristics of housing demand. Inparticular, empirical evidences on household preferences at disag-gregate level areuseful formatching supplywithdemandeffectively.Moreover, estimates for housing demand need to be area-specificbecause housing market is divided into submarkets by urban areadue to location dependency. In this respect, while a number ofstudies have raised issues of housing supply constraints in Indian
Institute of Advanced Studies20-8502, Japan.ad).
All rights reserved.
cities (Ahmad & Choi 2009, 2011; Kumar, 2008; Kundu, 2004; Pugh,1991; Sivam 2003; Srirangam, 2000), empirical literatures ondemand side are relatively rare. There are only three studiesconducted to estimate housing demand at the national level(Bandyopadhyay, Kuvalekar, Basu, Baid, & Saha, 2008; Dholakia,1980; Tiwari & Parikh, 1998). And only three studies have appearedat the city level in India, namely, Ahmedabad (Mehta&Mehta,1989),Bangalore (Malpezzi & Tewari, 1991) and Mumbai (Tiwari, Parikh, &Parikh, 1999). Furthermore, little is known on housing market inslum area.
Our study attempts to fulfill this gap and helps to understandurban housing market in Delhi. Specifically, this study aims atempirically estimating housing demand, using household surveydata in Delhi. Housing demand comprises both quantitative andqualitative levels, where the latter is estimated by demand forhousing attributes for the first time for the local housing market inDelhi. In particular, distinguished from previous studies, the esti-mations are further stratified by slum and non-slum, in order toappropriate policy prescriptions, since there are significant differ-ences in characteristics of household, dwelling and neighborhoodbetween the two types of settlement (for detail see Table 3). Thisstudyadopts slumdefinitionbyNational Sample SurveyOrganization(NSSO) (2004) which includes JJ clusters1 notified and non-notified
1 JJ stands for theHindiwords jhuggi jhopdi, a colloquial term for thehut of thepoor.
Note: *represents provisional data. Source: Data from various censuses of India.
S. Ahmad et al. / Habitat International 38 (2013) 90e99 91
while non-slum includes all other forms of settlementseformal andinformal.2 TheNSSO (2004:p. 7) defines slumas “a compact areawitha collection of poorly built tenements, mostly of temporary nature,crowded together usually with inadequate sanitary and drinkingwater facilities in unhygienic conditions in that compact area”. Suchan area is considered as a slum if at least 20 households live andsquatters if less than 20 households live. In addition, all areas notifiedas slums by the respective municipalities, corporations, local bodiesor development authorities are treated as ‘notified slums’. Slum hasbeen considered in urban area only. Separate estimations are alsocarriedout by tenure (ownerand renter) inorder to comparewith theprevious studies.
This study employs the data extracted from 58th round NationalSample Survey (NSS) on ‘housing condition of India’ conducted in2002byNSSO,Ministryof Statistics andProgramme Implementation.This is the latest availablemicodata,3 and the 1993 data are also usedfor an intertemporal comparison purpose. The data was collectedthrough stratified sampling. In 2002, a total of 1781 householdswereselected randomly from144UrbanFrameSurvey blocks inurban areaand 8 villages in rural area for Delhi (NSSO, 2004).
Next section describes housing conditions in Delhi, followed byhousing demand function and demand for housing attributes areestimated. Finally conclusions section summarizes the findings anddiscusses policy and planning implications.
Housing conditions in Delhi
Urbanization in Delhi
This section elaborates population growth and spatial expansionto explain urbanization in Delhi between 1951 and 2011. Urbanpopulation in Delhi has grown from1.4million to 16.3million in thelast six decades (Table 1). During these periods, the averagedecennial urban growth rate was 49.3%, varied between 21.0(2001e2011) to 64.2 (1951e1961). The population growth throughnet in-migration has contributed slightly more than the naturalgrowth in Delhi (Government of NCTD, 2009). Delhi has also expe-rienced urbanization in the form of urban sprawlwhere its core areahas experienced less population growth than its periphery both in1981e1991 and 1991e2001 (Dupont et al., 2000; Sivaramakrishnan,Kundu, & Singh, 2005). The National Capitals Territory of Delhi’s(NCTD) core area population grew at the rate of 3.6% in 1981e91while its periphery grew at the rate of 3.8% during the sameperiod. In 1991e2001, the core andperipheryarea grewat the rate of3.1 and4.1%, respectively. Thepopulationgrowth trend is presentingDelhi as a growing city (Kumar, 2006), however, recent censusshows remarkably low decennial growth rate (only 21%), even lessthan half to the last decade, attributed to a combination of decliningfertility and mass slum demolitions (TOI, 2011). Therefore, pop-ulation growth in Delhi should be understood in the context of thegrowth of Delhi Urban Agglomeration (DUA), for instance, Gurgaon,Faridabad, Ghaziabad and Noida, however, officially these cities arenot considered as a part of DUA due to nature of Delhi as a state.These towns can be seen in Fig. 1.
In term of physical expansion, Delhi has expanded from 201 km2
to 792 km2 between 1951 and 2009. Historically, it expandedthrough numerous events but major expansions took place duringthe re-establishment of Delhi as the capital of British India andconsequences of partition. After enactment of the Delhi
2 Non-slum also includes informal settlements, for instance, rural and urbanvillages, unauthorized colonies and JJ resettlements colonies (NSSO, 2004).
3 The next round survey was conducted during 2008e2009, however, row datawas not available at the time of this study.
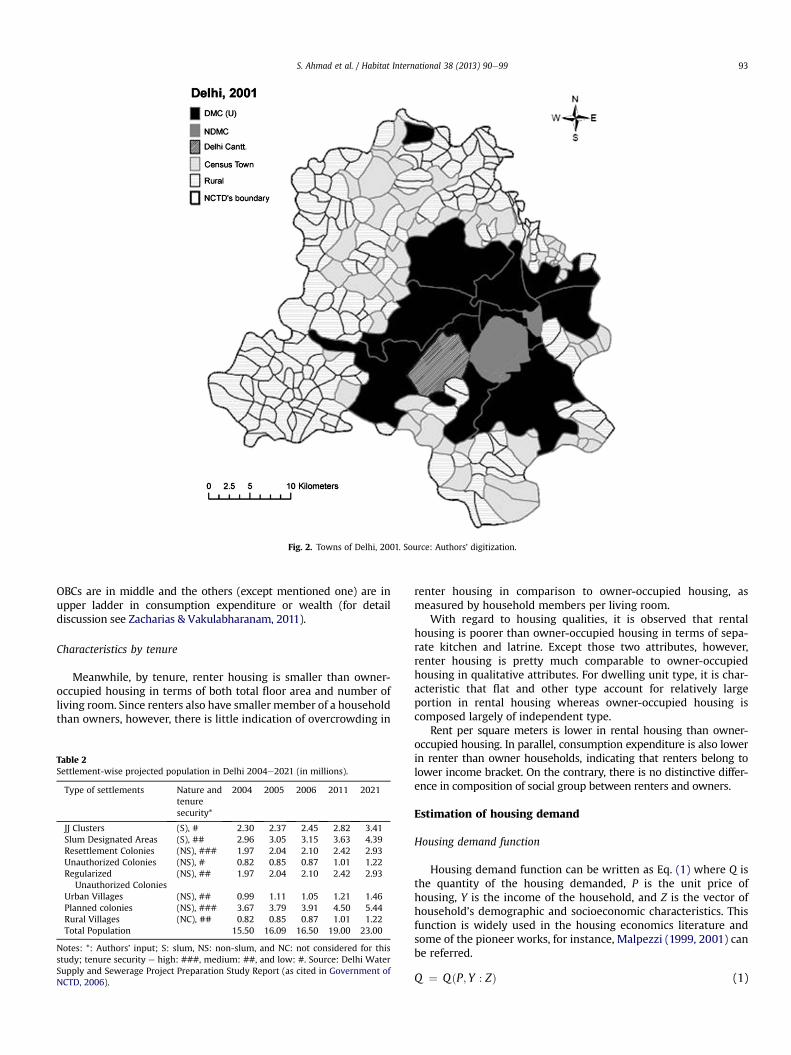
Development Authority (DDA) Act 1957 and consequently, planningintervention led to expansion up to 326.55 km2 in 1961, about 62.1%decennial growth. In 1990s, it was expanded to 624.28 km2 andtoday (2009) it is about 792 km2 out of total 1483 km2 area of NCTD,which approximately 53.4% area is urbanized. It is estimated that by2021, all the area under NCTD will be urbanized (Government ofIndia, 2007b). Fig. 2 shows urban and rural areas in NCTD,including various administrative controls over areas. The spatialspread of administrative control provides, somehow, difficulties incity governance, including provision of physical infrastructures.
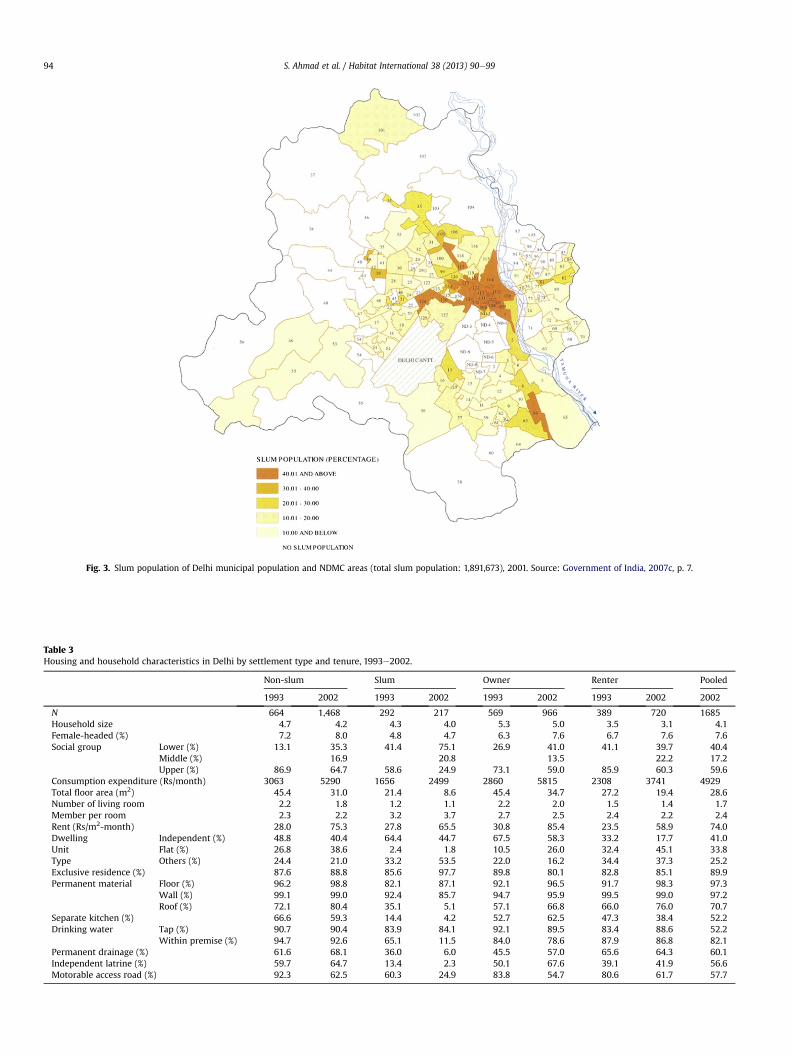
So far, we have discussed urbanization in Delhi both in terms ofurbanpopulationgrowthandphysical expansion;howeverour studydemands topresentdisaggregatedpopulationby settlement types. Inthis reference, Delhi water Supply and Sewerage Project PreparationStudy Report (as cited in Government of NCTD 2006: p. 364) esti-mated that slum (JJ clusters and slum designated areas) populationwas5.26millionwhich is expected to increase by 6.45million in2011and 7.8million in 2021 (Table 2). Although, the populationprojectionfor 2011 is over projected, nevertheless, it emphasizes severeproblem of slum growth in Delhi. Table 2 also presents perceivedlevel of tenure security in various types of settlements in Delhi. ItshowseJJ clusters and unauthorized colonies: low; slum designatedareas, regularized unauthorized colonies, urban villages and ruralvillages: medium; and resettlement colonies and planned colonies:highedegree of tenure security. Fig. 3 shows spatial spread of slumpopulationehighly concentrated in central part of Delhi.
Intertemporal changes
The NSS data provide various information regarding bothdwelling and household characteristics. Table 3 summarizes thesehousing and household characteristics in Delhi by settlement typeand tenure, as measured by means and frequency distributionsfrom 1993 and 2002 data. The 1993 and 2002 NSS data may not bedirectly comparable since they are not panel data derived fromrepeated sample. Nevertheless intertemporal changes indicate thathousing conditions in Delhi have not been improved, but rathertend to have worsened over time. As the most representative index,mean of total floor area each household occupies decreased from1993 to 2002, even though average monthly consumption expen-diture of households, which may be used as an income proxy,increased over the same period.
The NSS data also contain price information: rent for the renterhousing and imputed rent for the owner-occupied housing. It isnoticeable that rent per unit area (square meters) increasedsignificantly between 1993 and 2002 in line with the decrease infloor area. At the same time, housing quality, as represented byavailability of separate kitchen, drinking water within premises andmotorable access road for example, tend to have decreased overtime. Therefore, housing market in Delhi is characterized over timeby increase in housing price and decrease in housing consumptionin both quantitative and qualitative terms.
Fig. 1. Delhi metropolitan area in national capital region. Source: Government of India, 2007a.
4 For instance, reservation for education and jobs, and other venue like, inelectoral democracy.
S. Ahmad et al. / Habitat International 38 (2013) 90e9992
Characteristics by settlement type
By settlement type, it is clear that housing condition of slumdwellings is far inferior to that of non-slum dwelling. Moreover,slum area has overall experienced more severe deterioration ofhousing condition over time than non-slum area. As the result,slum dwellings are smaller in size than non-slum dwellings, asmeasured by total floor area. The number of living room is alsofewer in slum than non-slum housing. Therefore, as there is notmuch difference in household size between slum and non-slumhouseholds, members per living room is higher in slum thannon-slum dwellings, indicating overcrowded housing condition inslum settlements.
Besides these quantitative measures of housing consumption,slum dwellings have much lower qualities than non-slum dwell-ings, particularly in terms of roof material and availability ofa separate kitchen, drinking water within premise, drainage,independent latrine, and motorable access road. Among thesehousing attributes, shelters in slum severely lack permanent roof,separate kitchen, drinking water within premise, drainage, andindependent latrine. Only permanent materials of floor and wall aswell as tap water are relatively widely observed in slum shelters.Related to these housing qualities, it is characteristic that a greatportion of slum dwellings fall neither independent nor flat typewhile independent type decreased over time. In comparison, flattype of dwelling unit increased over time and composes relativelylarge portion for non-slum housing. Meanwhile, the proportion of
housing used exclusively for residence use is rather higher in slumthan non-slum dwellings, indicating relatively little mixed use.
Despite the quantitative and qualitative differences in housingconsumption, however, there is not much difference in rent persquaremeters between slumandnon-slumdwellings. In comparison,households of slum area have much lower average monthlyconsumption expenditure than those of non-slum area, reflectingtheir lower income level. Meanwhile, male headed householdsprevail, though the proportion of female-headedhousehold is slightlylower in slum than non-slum households. On the contrary, socialgroupshowsadistinctivedistributionpatternbetween slumandnon-slum households: the majority of slum households are composed oflower social group while upper social group constitutes the majorityof non-slum households. In this study, Scheduled Caste (SC) andScheduled Tribe (ST) households are named as the lower social group,Other BackwardClasses (OBCs) as themiddle social groupand the restas theupper social group, as Indian literatures use these abbreviationscomfortably in the academic discourses (Baud, Pfeffer, Sridharan, &Nainan, 2009; Baud, Sridharan, & Pfeffer, 2008). However, interpre-tations should be done with due consideration of facts and figures aswell as long standing affirmative discrimination4 to the SC andST, andtheOBCs households.Nevertheless, various studies have categoricallypointed out that the SC and ST households are in lower ladder, the
Fig. 2. Towns of Delhi, 2001. Source: Authors’ digitization.
S. Ahmad et al. / Habitat International 38 (2013) 90e99 93
OBCs are in middle and the others (except mentioned one) are inupper ladder in consumption expenditure or wealth (for detaildiscussion see Zacharias & Vakulabharanam, 2011).
Characteristics by tenure
Meanwhile, by tenure, renter housing is smaller than owner-occupied housing in terms of both total floor area and number ofliving room. Since renters also have smaller member of a householdthan owners, however, there is little indication of overcrowding in
Table 2Settlement-wise projected population in Delhi 2004e2021 (in millions).
Notes: *: Authors’ input; S: slum, NS: non-slum, and NC: not considered for thisstudy; tenure security e high: ###, medium: ##, and low: #. Source: Delhi WaterSupply and Sewerage Project Preparation Study Report (as cited in Government ofNCTD, 2006).
renter housing in comparison to owner-occupied housing, asmeasured by household members per living room.
With regard to housing qualities, it is observed that rentalhousing is poorer than owner-occupied housing in terms of sepa-rate kitchen and latrine. Except those two attributes, however,renter housing is pretty much comparable to owner-occupiedhousing in qualitative attributes. For dwelling unit type, it is char-acteristic that flat and other type account for relatively largeportion in rental housing whereas owner-occupied housing iscomposed largely of independent type.
Rent per square meters is lower in rental housing than owner-occupied housing. In parallel, consumption expenditure is also lowerin renter than owner households, indicating that renters belong tolower income bracket. On the contrary, there is no distinctive differ-ence in composition of social group between renters and owners.
Estimation of housing demand
Housing demand function
Housing demand function can be written as Eq. (1) where Q isthe quantity of the housing demanded, P is the unit price ofhousing, Y is the income of the household, and Z is the vector ofhousehold’s demographic and socioeconomic characteristics. Thisfunction is widely used in the housing economics literature andsome of the pioneer works, for instance, Malpezzi (1999, 2001) canbe referred.
Q ¼ QðP; Y : ZÞ (1)
Fig. 3. Slum population of Delhi municipal population and NDMC areas (total slum population: 1,891,673), 2001. Source: Government of India, 2007c, p. 7.
Table 3Housing and household characteristics in Delhi by settlement type and tenure, 1993e2002.
S. Ahmad et al. / Habitat International 38 (2013) 90e99 95
The quantity of the housing demanded (Q) is measured by totalfloor area. The unit price of the housing (P) is computed using rentfor the renter housing and imputed rent for the owner-occupiedhousing, since the NSS data provide such detailed information. Bothrent and imputed rent are measured in terms of monthly rent perunit area (square meters). The NSS data, however, do not containany information about income of the household (Y). Therefore, wetake average monthly consumption expenditure as a proxy variablefor permanent income. Since housing is a durable good, permanentincome, which can be measured by consumption expenditure assuggested by Friedman, can provide a better measure in explaininghousing demand than current income. Meanwhile, householdcharacteristics (Z) include household size (total member ofa household), gender of household head, and social group. The slumand non-slum settlement type, one of our main concerns, is alsoincluded as an independent variable, as necessary.
Housing demand function is estimated using the 2002 NSS data.We employ the log-linear functional form where both dependentvariable Q and independent variables P and Y take in logarithmicform so that the estimated coefficients can be directly interpretedas the price and income elasticity of housing demand. Logarithmicform is also taken for household size in order to adjust skeweddistribution with a long tail on the right hand side and therebyenhance normality of the distribution.5 Other independent vari-ables are treated as dummy variables. Similar form and proxyvariables are often selected, particularly studies originated fromdeveloping countries, where data are scarce (Arimah, 1992; Mehta,1989; Tiwari, 1999).
In total, five regression models are used for housing demandestimations e pooled, stratified by settlement type (non-slum andslum) and stratified by tenure (owner and renter). The sample sizefor pooled, non-slum, slum, owner and renter models are 1,646,
5 Single member of a household accounts for 18.6%, two members 7.8%, three 10.6%, four 20.1%, and five and more 42.8%.
1,430, 192, 940 and 706 respectively. Regressions are all based uponOrdinary Least Squares (OLS) method.
Estimation results
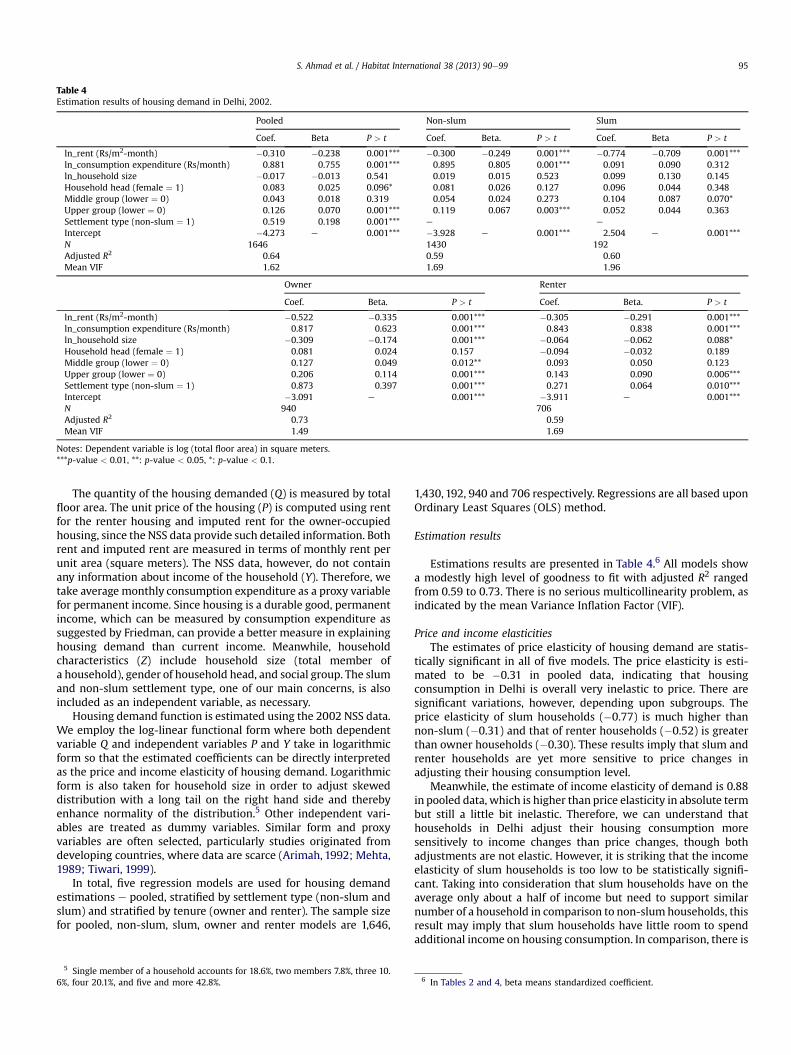
Estimations results are presented in Table 4.6 All models showa modestly high level of goodness to fit with adjusted R2 rangedfrom 0.59 to 0.73. There is no serious multicollinearity problem, asindicated by the mean Variance Inflation Factor (VIF).
Price and income elasticitiesThe estimates of price elasticity of housing demand are statis-
tically significant in all of five models. The price elasticity is esti-mated to be �0.31 in pooled data, indicating that housingconsumption in Delhi is overall very inelastic to price. There aresignificant variations, however, depending upon subgroups. Theprice elasticity of slum households (�0.77) is much higher thannon-slum (�0.31) and that of renter households (�0.52) is greaterthan owner households (�0.30). These results imply that slum andrenter households are yet more sensitive to price changes inadjusting their housing consumption level.
Meanwhile, the estimate of income elasticity of demand is 0.88in pooled data, which is higher than price elasticity in absolute termbut still a little bit inelastic. Therefore, we can understand thathouseholds in Delhi adjust their housing consumption moresensitively to income changes than price changes, though bothadjustments are not elastic. However, it is striking that the incomeelasticity of slum households is too low to be statistically signifi-cant. Taking into consideration that slum households have on theaverage only about a half of income but need to support similarnumber of a household in comparison to non-slum households, thisresult may imply that slum households have little room to spendadditional income on housing consumption. In comparison, there is
6 In Tables 2 and 4, beta means standardized coefficient.
Table 5Previous estimates of income and price elasticities of housing demand in India.
Author Study area (survey period) Price elasticity Income elasticity
Pooled Owner Renter Pooled Owner Renter
Dholakia (1980) Urban India (1988) �0.33 e e 0.58 e e
Tiwari and Parikh (1998) Urban India (1987/88) �1 �1 �1 0.75 0.9 0.9Bandyopadhyay et al. (2008) India (not known) �0.46 e e 0.6 e e
Malpezzi and Tewari (1991), p. 160 Bangalore (1975) e e e e 0.43 0.58Mehta and Mehta (1989) Ahmedabad (1988) e �0.4 �0.8 e 0.2 0.17e0.43Tiwari and Parikh (1997) Mumbai (1987/88) �0.47 �0.21 �0.75 0.34 0.33 0.38Tiwari et al. (1999) Mumbaia (1987/88) �1.2 �0.85 �1.02 1.12 1.18 1.07
Notes:All values are significant up to 90 percent confidence level.
a The data set for this study is similar to (Tiwari & Parikh, 1997), however, this study used permanent income for the estimation of housing demand rather than currentincome.
S. Ahmad et al. / Habitat International 38 (2013) 90e9996
not much difference in the income elasticity between owner (0.82)and renter households (0.84).
These estimates of price and income elasticities in Delhi aresomewhat consistent with previous results found in global andIndian context, although previous estimates did not pay an atten-tion to the differences between slum and non-slum. For developingcountries, both price and income elasticities have generally beenestimated to be inelastic as our estimates are, even though esti-mates of price elasticities are relatively rare due to difficulty inmeasuring prices (Malpezzi, 1991; Malpezzi & Mayo, 1987).Furthermore, our estimates match with the findings that ownerand renter income elasticities are similar (Malpezzi & Mayo, 1987).
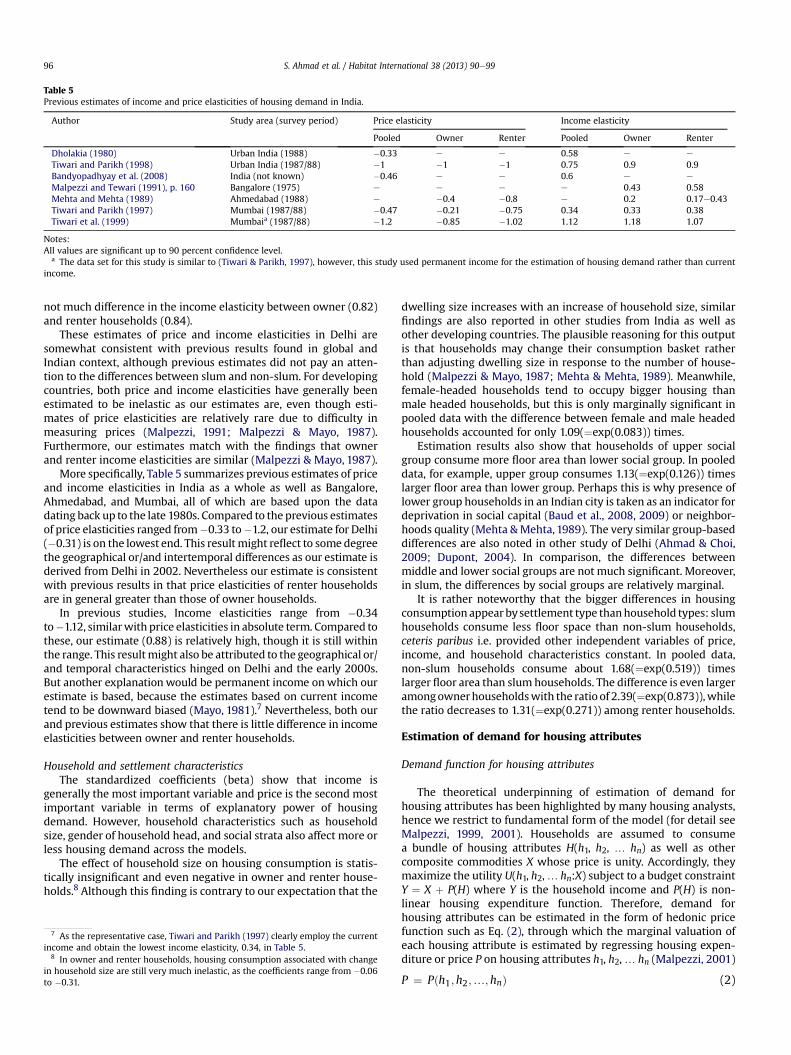
More specifically, Table 5 summarizes previous estimates of priceand income elasticities in India as a whole as well as Bangalore,Ahmedabad, and Mumbai, all of which are based upon the datadating back up to the late 1980s. Compared to the previous estimatesof price elasticities ranged from�0.33 to�1.2, our estimate for Delhi(�0.31) is on the lowest end. This resultmight reflect to some degreethe geographical or/and intertemporal differences as our estimate isderived from Delhi in 2002. Nevertheless our estimate is consistentwith previous results in that price elasticities of renter householdsare in general greater than those of owner households.
In previous studies, Income elasticities range from �0.34to�1.12, similarwith price elasticities in absolute term. Compared tothese, our estimate (0.88) is relatively high, though it is still withinthe range. This resultmight also be attributed to the geographical or/and temporal characteristics hinged on Delhi and the early 2000s.But another explanation would be permanent income onwhich ourestimate is based, because the estimates based on current incometend to be downward biased (Mayo, 1981).7 Nevertheless, both ourand previous estimates show that there is little difference in incomeelasticities between owner and renter households.
Household and settlement characteristicsThe standardized coefficients (beta) show that income is
generally the most important variable and price is the second mostimportant variable in terms of explanatory power of housingdemand. However, household characteristics such as householdsize, gender of household head, and social strata also affect more orless housing demand across the models.
The effect of household size on housing consumption is statis-tically insignificant and even negative in owner and renter house-holds.8 Although this finding is contrary to our expectation that the
7 As the representative case, Tiwari and Parikh (1997) clearly employ the currentincome and obtain the lowest income elasticity, 0.34, in Table 5.
8 In owner and renter households, housing consumption associated with changein household size are still very much inelastic, as the coefficients range from �0.06to �0.31.
dwelling size increases with an increase of household size, similarfindings are also reported in other studies from India as well asother developing countries. The plausible reasoning for this outputis that households may change their consumption basket ratherthan adjusting dwelling size in response to the number of house-hold (Malpezzi & Mayo, 1987; Mehta & Mehta, 1989). Meanwhile,female-headed households tend to occupy bigger housing thanmale headed households, but this is only marginally significant inpooled data with the difference between female and male headedhouseholds accounted for only 1.09(¼exp(0.083)) times.
Estimation results also show that households of upper socialgroup consume more floor area than lower social group. In pooleddata, for example, upper group consumes 1.13(¼exp(0.126)) timeslarger floor area than lower group. Perhaps this is why presence oflower group households in an Indian city is taken as an indicator fordeprivation in social capital (Baud et al., 2008, 2009) or neighbor-hoods quality (Mehta &Mehta, 1989). The very similar group-baseddifferences are also noted in other study of Delhi (Ahmad & Choi,2009; Dupont, 2004). In comparison, the differences betweenmiddle and lower social groups are not much significant. Moreover,in slum, the differences by social groups are relatively marginal.
It is rather noteworthy that the bigger differences in housingconsumption appear bysettlement type thanhousehold types: slumhouseholds consume less floor space than non-slum households,ceteris paribus i.e. provided other independent variables of price,income, and household characteristics constant. In pooled data,non-slum households consume about 1.68(¼exp(0.519)) timeslarger floor area than slum households. The difference is even largeramongownerhouseholdswith the ratio of 2.39(¼exp(0.873)),whilethe ratio decreases to 1.31(¼exp(0.271)) among renter households.
Estimation of demand for housing attributes
Demand function for housing attributes
The theoretical underpinning of estimation of demand forhousing attributes has been highlighted by many housing analysts,hence we restrict to fundamental form of the model (for detail seeMalpezzi, 1999, 2001). Households are assumed to consumea bundle of housing attributes H(h1, h2, . hn) as well as othercomposite commodities X whose price is unity. Accordingly, theymaximize the utility U(h1, h2,. hn:X) subject to a budget constraintY ¼ X þ P(H) where Y is the household income and P(H) is non-linear housing expenditure function. Therefore, demand forhousing attributes can be estimated in the form of hedonic pricefunction such as Eq. (2), through which the marginal valuation ofeach housing attribute is estimated by regressing housing expen-diture or price P on housing attributes h1, h2,. hn (Malpezzi, 2001)
P ¼ Pðh1;h2;.; hnÞ (2)
Table 6Estimation results of demand for housing attributes in Delhi, 2002.
Pooled Non-slum Slum
Coef. Beta P > t Coef. Beta. P > t Coef. Beta P > t
Total floor area (m2) �0.006 �0.252 0.001*** �0.006 �0.242 0.001*** �0.056 �0.781 0.001***Number of living room 0.025 0.038 0.302 0.023 0.033 0.372 0.353 0.314 0.004***Dwelling typeeindependent (others ¼ 0) 0.067 0.049 0.141 0.088 0.062 0.096* 0.015 0.018 0.806Dwelling typeeflat (others ¼ 0) 0.148 0.105 0.003*** 0.181 0.127 0.001*** e
Notes: Dependent variable is log (rent per square meter per month) in rupees.***p-value < .01, **: p-value < .05, *: p-value < .1.
9 Flat type of dwelling unit is also removed from slum model because there areonly 4 observations.
S. Ahmad et al. / Habitat International 38 (2013) 90e99 97
For dependent variable, the housing price (P) is defined in thesame way as the case of housing demand estimation: this studyuses rent for the renter housing and imputed rent for the ownerhousing, both measured by monthly rent per square meters. Asindependent variables, a variety of housing attributes are collectedfrom the NSS data as shown in Table 3. Total floor area, employedfor housing demand function, as well as number of living room aretaken to capture the quantitative characteristics of dwelling.Moreover, various quality measures of structure and facilities aretaken, including material of floor, wall, and roof as well as avail-ability of a separate kitchen, tap water, drinking water withinpremise, drainage, independent latrine, and motorable access road.Shelter typology is distinguished by structural type of dwelling unit(independent, flat, or others) and use of house (exclusive residenceor mixed). Finally, settlement type (slum and non-slum) is alsotaken into consideration in order to reflect collectively neighbor-hood quality.
We specify Eq. (2) into semi-log functional form by taking log-arithmic form for dependent variable P in order to enhancenormality of the distribution. Independent variables related tohousing qualities, except those associated with quantitative char-acteristics, are treated as dummy variables. Similar to the studyof housing demand function, we employ five regression models
i.e. pooled, stratified by settlement type (non-slum and slum) andby tenure (owner and renter), all based upon OLS method. Incomparison to housing demand estimation, sample size is slightlyreduced due to the use of large number of independent variableswhich have more missing values.9
Estimation results
Estimations results are summarized in Table 6. Goodness to fitranges from 0.15 to 0.37 in terms of adjusted R2 across the models.No serious multicollinearity problem is found.
Effect of each housing attribute on rentSince there are many independent variables, primary attention
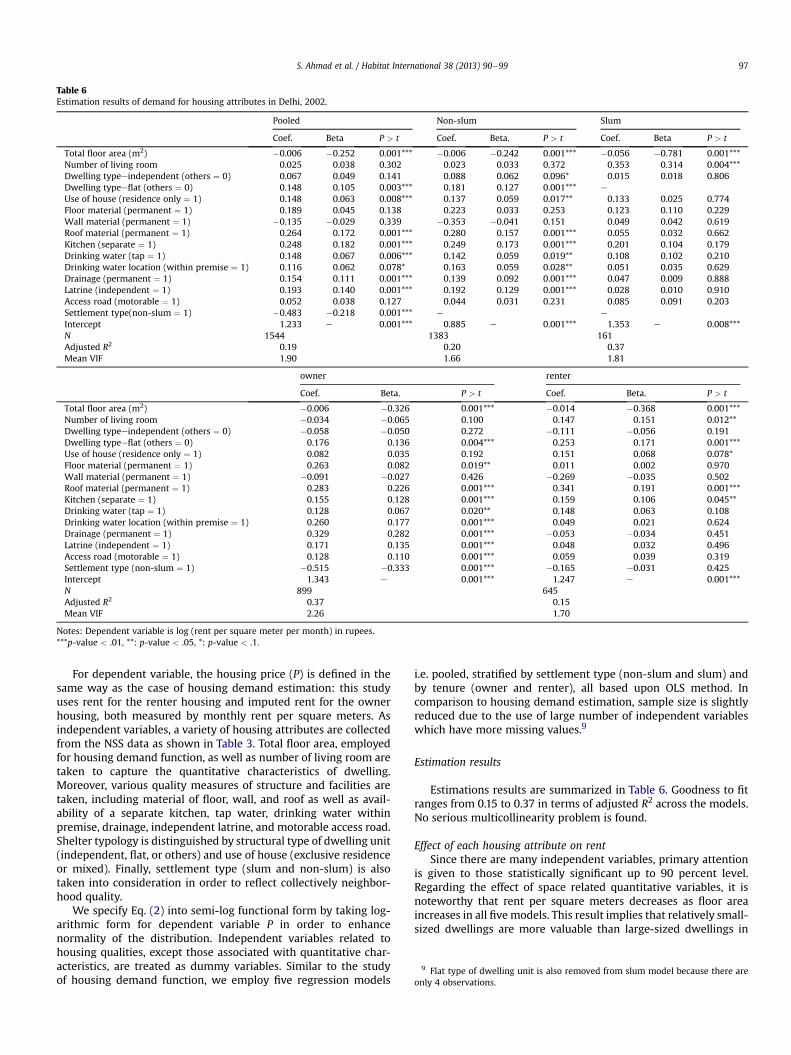
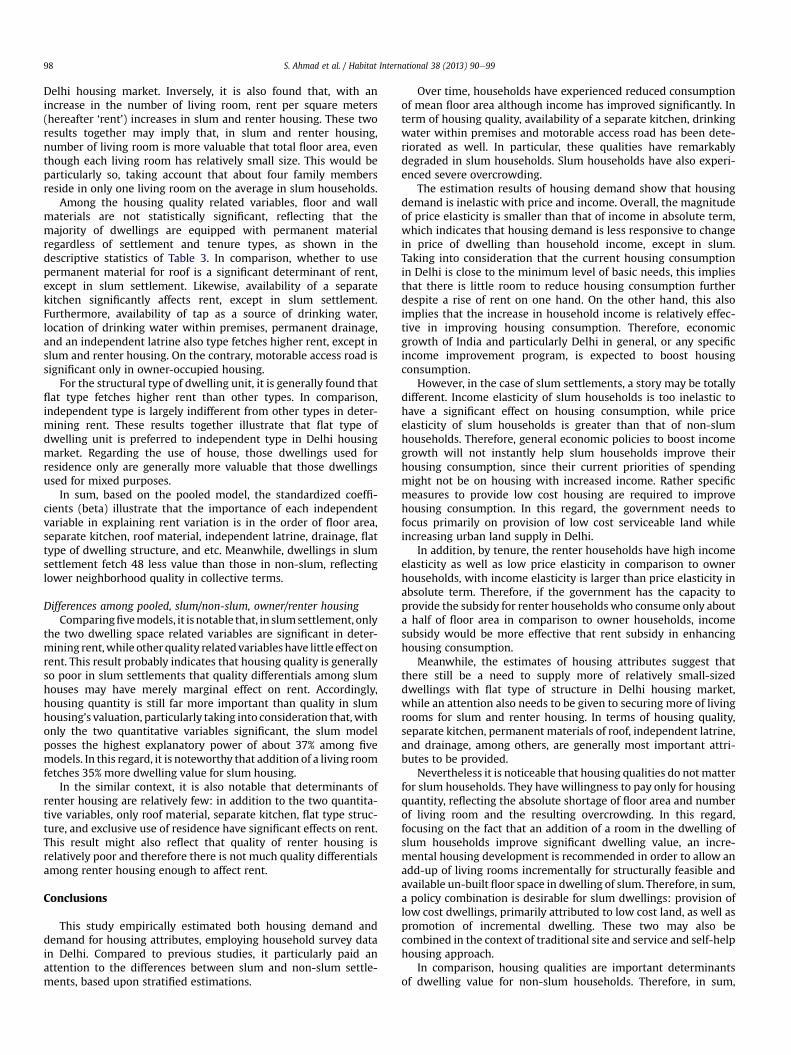
is given to those statistically significant up to 90 percent level.Regarding the effect of space related quantitative variables, it isnoteworthy that rent per square meters decreases as floor areaincreases in all five models. This result implies that relatively small-sized dwellings are more valuable than large-sized dwellings in
S. Ahmad et al. / Habitat International 38 (2013) 90e9998
Delhi housing market. Inversely, it is also found that, with anincrease in the number of living room, rent per square meters(hereafter ‘rent’) increases in slum and renter housing. These tworesults together may imply that, in slum and renter housing,number of living room is more valuable that total floor area, eventhough each living room has relatively small size. This would beparticularly so, taking account that about four family membersreside in only one living room on the average in slum households.
Among the housing quality related variables, floor and wallmaterials are not statistically significant, reflecting that themajority of dwellings are equipped with permanent materialregardless of settlement and tenure types, as shown in thedescriptive statistics of Table 3. In comparison, whether to usepermanent material for roof is a significant determinant of rent,except in slum settlement. Likewise, availability of a separatekitchen significantly affects rent, except in slum settlement.Furthermore, availability of tap as a source of drinking water,location of drinking water within premises, permanent drainage,and an independent latrine also type fetches higher rent, except inslum and renter housing. On the contrary, motorable access road issignificant only in owner-occupied housing.
For the structural type of dwelling unit, it is generally found thatflat type fetches higher rent than other types. In comparison,independent type is largely indifferent from other types in deter-mining rent. These results together illustrate that flat type ofdwelling unit is preferred to independent type in Delhi housingmarket. Regarding the use of house, those dwellings used forresidence only are generally more valuable that those dwellingsused for mixed purposes.
In sum, based on the pooled model, the standardized coeffi-cients (beta) illustrate that the importance of each independentvariable in explaining rent variation is in the order of floor area,separate kitchen, roof material, independent latrine, drainage, flattype of dwelling structure, and etc. Meanwhile, dwellings in slumsettlement fetch 48 less value than those in non-slum, reflectinglower neighborhood quality in collective terms.
Differences among pooled, slum/non-slum, owner/renter housingComparingfivemodels, it is notable that, in slumsettlement, only
the two dwelling space related variables are significant in deter-mining rent,while otherquality relatedvariableshave little effect onrent. This result probably indicates that housing quality is generallyso poor in slum settlements that quality differentials among slumhouses may have merely marginal effect on rent. Accordingly,housing quantity is still far more important than quality in slumhousing’s valuation, particularly taking into consideration that, withonly the two quantitative variables significant, the slum modelposses the highest explanatory power of about 37% among fivemodels. In this regard, it is noteworthy that addition of a living roomfetches 35% more dwelling value for slum housing.
In the similar context, it is also notable that determinants ofrenter housing are relatively few: in addition to the two quantita-tive variables, only roof material, separate kitchen, flat type struc-ture, and exclusive use of residence have significant effects on rent.This result might also reflect that quality of renter housing isrelatively poor and therefore there is not much quality differentialsamong renter housing enough to affect rent.
Conclusions
This study empirically estimated both housing demand anddemand for housing attributes, employing household survey datain Delhi. Compared to previous studies, it particularly paid anattention to the differences between slum and non-slum settle-ments, based upon stratified estimations.
Over time, households have experienced reduced consumptionof mean floor area although income has improved significantly. Interm of housing quality, availability of a separate kitchen, drinkingwater within premises and motorable access road has been dete-riorated as well. In particular, these qualities have remarkablydegraded in slum households. Slum households have also experi-enced severe overcrowding.
The estimation results of housing demand show that housingdemand is inelastic with price and income. Overall, the magnitudeof price elasticity is smaller than that of income in absolute term,which indicates that housing demand is less responsive to changein price of dwelling than household income, except in slum.Taking into consideration that the current housing consumptionin Delhi is close to the minimum level of basic needs, this impliesthat there is little room to reduce housing consumption furtherdespite a rise of rent on one hand. On the other hand, this alsoimplies that the increase in household income is relatively effec-tive in improving housing consumption. Therefore, economicgrowth of India and particularly Delhi in general, or any specificincome improvement program, is expected to boost housingconsumption.
However, in the case of slum settlements, a story may be totallydifferent. Income elasticity of slum households is too inelastic tohave a significant effect on housing consumption, while priceelasticity of slum households is greater than that of non-slumhouseholds. Therefore, general economic policies to boost incomegrowth will not instantly help slum households improve theirhousing consumption, since their current priorities of spendingmight not be on housing with increased income. Rather specificmeasures to provide low cost housing are required to improvehousing consumption. In this regard, the government needs tofocus primarily on provision of low cost serviceable land whileincreasing urban land supply in Delhi.
In addition, by tenure, the renter households have high incomeelasticity as well as low price elasticity in comparison to ownerhouseholds, with income elasticity is larger than price elasticity inabsolute term. Therefore, if the government has the capacity toprovide the subsidy for renter households who consume only abouta half of floor area in comparison to owner households, incomesubsidy would be more effective that rent subsidy in enhancinghousing consumption.
Meanwhile, the estimates of housing attributes suggest thatthere still be a need to supply more of relatively small-sizeddwellings with flat type of structure in Delhi housing market,while an attention also needs to be given to securing more of livingrooms for slum and renter housing. In terms of housing quality,separate kitchen, permanent materials of roof, independent latrine,and drainage, among others, are generally most important attri-butes to be provided.
Nevertheless it is noticeable that housing qualities do notmatterfor slum households. They have willingness to pay only for housingquantity, reflecting the absolute shortage of floor area and numberof living room and the resulting overcrowding. In this regard,focusing on the fact that an addition of a room in the dwelling ofslum households improve significant dwelling value, an incre-mental housing development is recommended in order to allow anadd-up of living rooms incrementally for structurally feasible andavailable un-built floor space in dwelling of slum. Therefore, in sum,a policy combination is desirable for slum dwellings: provision oflow cost dwellings, primarily attributed to low cost land, as well aspromotion of incremental dwelling. These two may also becombined in the context of traditional site and service and self-helphousing approach.
In comparison, housing qualities are important determinantsof dwelling value for non-slum households. Therefore, in sum,
S. Ahmad et al. / Habitat International 38 (2013) 90e99 99
provision of adequate infrastructures is also necessary in additionto an increase in income in order to enhance housing consump-tion for non-slum households. In this context, since it is generallyexpected that, by observing present economic scenario of Indiaand particularly Delhi, income is bound to increase, there shouldbe sufficient housing supply in Delhi in order to cope with anincrease in housing demand coupled with income growth in non-slum households. This in turn requires sufficient urban landsupply. Therefore, government policies need to be focusedcommonly and ultimately on enabling and encouraging strategiesto increase urban land supply for both non-slum and slumhouseholds: It is necessary to increase dwelling stocks equippedwith adequate infrastructures to cope with increasing housingdemand derived from income growth for non-slum households onone hand. It is also necessary to provide low cost serviceable land,coupled with incremental dwelling strategy, for slum householdson the other hand.
Acknowledgements
The authors are thankful to the anonymous reviewers for theiruseful feedback and also thankful to the National Sample SurveyOrganization, India, for providing data sets used in this study. Thearticle is the sole responsibility of the authors and does not expressthe views of the institutions authors are affiliated.
References
Ahmad, S., & Choi, M. J. (2009). Problems and prospects of uncontrolled urbansettlements in developing countries: a case study of Delhi. In Proceedings ofAsian Planning School Association (APSA) Congress 2009, Ahmedabad, India.
Ahmad, S., & Choi, M. J. (2011). The context of uncontrolled urban settlements inDelhi. ASIEN, 118, 75e90.
Arimah, B. C. (1992). Hedonic prices and the demand for housing attributes ina third world city: the case of Ibadan, Nigeria. Urban studies, 29(5), 639e651.
Bandyopadhyay, A., Kuvalekar, S. V., Basu, S., Baid, S., & Saha, A. (2008). A study ofresidential housing demand in India. NHBeNIBM. Monograph.
Baud, I., Pfeffer, K., Sridharan, N., & Nainan, N. (2009). Matching deprivationmapping to urban governance in three Indian mega-cities. Habitat International,33(4), 365e377.
Baud, I., Sridharan, N., & Pfeffer, K. (2008). Mapping urban poverty for localgovernance in an Indian mega-city: the case of Delhi. Urban Studies, 45(7),1385e1412.
Dholakia, B. (1980). The economics of housing in India. New Delhi: NBO.Dupont, V. (2004). Socio-spatial differentiation and residential segregation in Delhi:
a question of scale. Geoforum, 35(2), 157e175.Dupont, V., Tarlo, E., & Vidal, D. (2000). Delhi: Urban space and human destinies. New
Delhi: Manohar Pubns.
Government of India. (2007a). Evaluation study of DMA towns in national capitalregion (ncr) town and country planning organization. Ministry of Urban Devel-opment. Available from http://urbanindia.nic.in/theministry/subordinateoff/tcpo/DMA_Report/COVER_PAGE.pdf Accessed 05.01.11.
Government of India. (2007b). Master plan for Delhi, 2021. New Delhi: DelhiDevelopment Authority, Ministry of Urban Development.
Government of India. (2007c). DelhiePresentation of thematic maps on 2001 censusdata at ward level, map division. India: Office of the Registrar General.
Government of the National Capital Territory of Delhi. (2006). Economic survey ofDelhi, 2005e06. New Delhi: Planning Department.
Government of the National Capital Territory of Delhi. (2009). Economic survey ofDelhi, 2008e09. New Delhi: Planning Department, Development, GOI. 172.
Kumar, A. (2006). Violating, shortchanging and confusing: implications of planninga growing city on the poor. ITPI Journal, 3(1), 14e30.
Kumar, A. (2008). Inclusive planning and development in the national capitalterritory of Delhi. ITPI Journal, 5(4), 12e20.
Kundu, A. (2004). Provision of tenurial security for the urban poor in Delhi: recenttrends and future perspectives. Habitat International, 28(2), 259e274.
Malpezzi, S., & Mayo, S. (1987). The demand for housing in developing countries:empirical estimates from household data. Economic Development and CulturalChange, 35, 687e721.
Malpezzi, S., & Tewari, V. (1991). Cost and benefit of residential rent control in Ban-galore, India. World Bank. Infrastructure and Urban Development DepartmentDiscussion Paper 82.
Malpezzi, S. (1999). Economic analysis of housing markets in developing andtransition economies. In. Handbook of regional and urban economics, Vol. III (pp.1791e1864).
Malpezzi, S. (2001). Hedonic pricing models: a selective and applied review. Journalof Housing Economics, 10, 72e108.
Mayo, S. (1981). Theory and estimation in the economics of housing demand.Journal of Urban Economics, 10, 95e116.
Mehta, M., & Mehta, D. (1989). Metropolitan housing market: A study of Ahmedabad.Sage Publications.
NSSO. (2004). Housing condition in India, 2002: Housing stock and constructions. NSSReport No. 488. N. S. S. Organization, Ministry of Statistics and ProgrammeImplementation, Government of India.
Pugh, C. (1991). Housing and land policies in Delhi. Journal of Urban Affairs, 13(3),367e382.
Sivam, A. (2003). Housing supply in Delhi. Cities, 20(2), 135e141.Sivaramakrishnan, K. C., Kundu, A., & Singh, B. N. (2005). Handbook of urbanization
in India. New Delhi: Oxford University.Srirangan, K. (2000). Public land and property development and cross-subsidisation
for low-income housing in Delhi. In Delhi field studies and workshop: Guide togood practice in core area development, DFID Research Project R6860.
Times of India (TOI). (5April, 2011). Delhi’s population grows slowest in 100 yrs. Timesof India.
Tiwari, P., & Parikh, J. (1997). Demand for housing in the Bombay metropolitanregion. Journal of Policy Modeling, 19(3), 295e321.
Tiwari, P., & Parikh, J. (1998). Affordability, housing demand and housing policy inurban India. Urban Studies, 35(11), 2111e2119.
Tiwari, P., Parikh, K., & Parikh, J. (1999). Effective housing demand in Mumbai(Bombay) metropolitan region. Urban Studies, 36(10), 1783e1809.
UN-Habitat. (2003). The challenge of slumseGlobal report on human settlements2003. London: Earthscan Publications.
UN-Habitat. (2008).Stateof theWorld’s cities2008/2009:Harmonious cities. Earthscan.XVI.Zacharias, A., & Vakulabharanam, V. (2011). Caste stratification and wealth
inequality in India. World Development, 39(10), 1820e1833.