Quantitative Evaluation of NHS Grampian‘s Grow Well Choices Programme (September 2011 - July 2013) Emily Stevenson, Public Health ST2 Mary Bellizzi, Health Improvement Officer, Aberdeenshire Caroline Comerford, Health Improvement Co- ordinator Pauline Maloy, Primary Care & Public Health Analyst
Transcript
Quantitative Evaluation of NHS Grampian‘s Grow Well Choices
Programme (September 2011 - July 2013)
Emily Stevenson, Public Health ST2Mary Bellizzi, Health Improvement Officer, Aberdeenshire
Caroline Comerford, Health Improvement Co-ordinatorPauline Maloy, Primary Care & Public Health Analyst
Background to Child Healthy Weight
• 2008-2011, Health boards required to ensure a number of overweight children completed a weight management programme (Heat target H3).
• Further CHW target for April 2011 – March 2014. 1,556 overweight and obese children (BMI>91st centile) completed a CHW programme in Grampian (≥40% to children in two most deprived local SIMD quintiles)
• NHS boards have taken a range of approaches to achieving their individual targets.
• School-based approach supported by a more targeted programme has been the favoured model of delivery. Specific content varies greatly between boards.
Grow Well Choices (GWC)• GWC NHSG’s school based programme.• Based on NHS A&A’s ‘Jump Start Choices’.• Primary school children (largely P5-P7), whole class
approach. • Piloted September 2011, rolled out across Grampian in
October 2011.• HEAT target ceased in March 2014, but GWC continues to
run.
Delivery
• Run by 3 Community Health Partnerships (CHPs)• All schools invited to take part (N=243)• If accepted, head teacher selected class to participate.• Trained health coaches delivered weekly sessions over 7-8
weeks, each lasting one hour.• Prior to first session (pre-programme), at end of last session
(post-programme) and 6 months later (follow-up), children’s heights and weights were measured. Opt out to measurements.
• Results transcribed into CHSP-S. Information sent to ISD, report returned to health board with computed variables for BMI, BMI percentile, BMI standard deviation score (BMI-SDS)
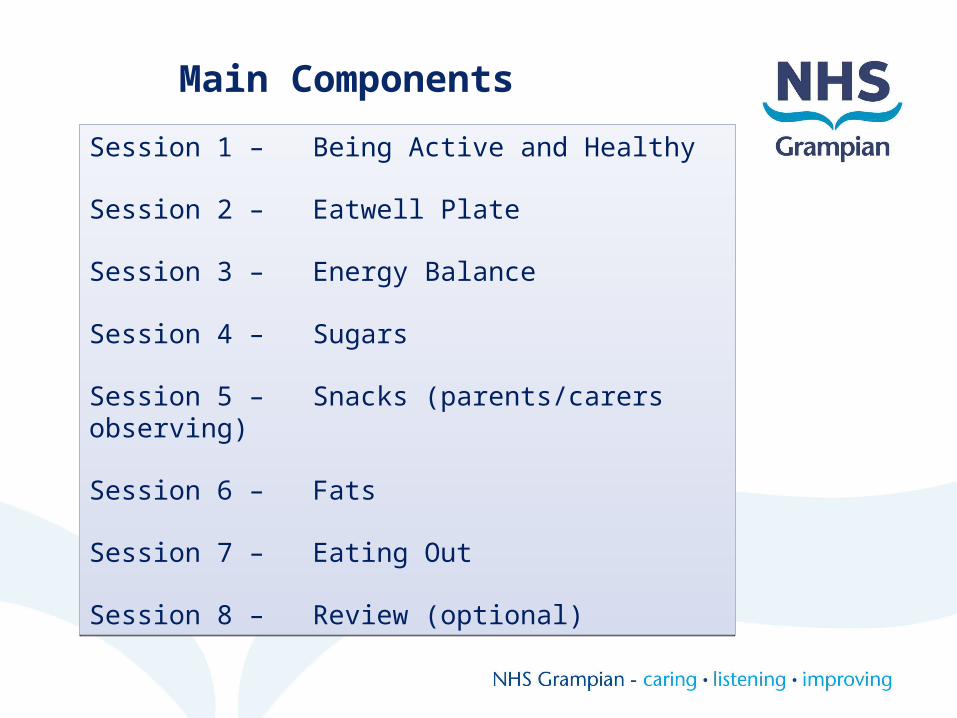
Session 1 – Being Active and Healthy
Session 2 – Eatwell Plate
Session 3 – Energy Balance
Session 4 – Sugars
Session 5 – Snacks (parents/carers observing)
Session 6 – Fats
Session 7 – Eating Out
Session 8 – Review (optional)
Session 1 – Being Active and Healthy
Session 2 – Eatwell Plate
Session 3 – Energy Balance
Session 4 – Sugars
Session 5 – Snacks (parents/carers observing)
Session 6 – Fats
Session 7 – Eating Out
Session 8 – Review (optional)
Main Components
Week 4 – Sugars and tooth hockey
Data Analysis• Pre and post programme data available from start of
programme until July 2013 (N=5365, 1186 were O/O)• Follow-up data was available from start of GWC until March
2013. However, >50% did not have 6 month measurements taken (N=2057, 439 were O/O)
• At time of analysis, 77% of all schools in Grampian had participated.
• Statistical analysis only performed on pre- and post-programme data.
• Analysis undertaken for whole group and O/O subgroup.• Follow-up data restricted to descriptive presentation. • BMI-SDS used – standardised measure
Results
• Mean age 10 years old. Majority of children from Primary 5 and 6.
• 77.7% of children were of a healthy weight, 0.2% were underweight, 12.8% overweight and 9.2% obese (including severely obese).
Comparison of pre- and post-programme BMI-SDS – Obese and overweight children
Table 2: Paired samples t-test for the population mean difference in BMI-SDS (overweight and obese children)
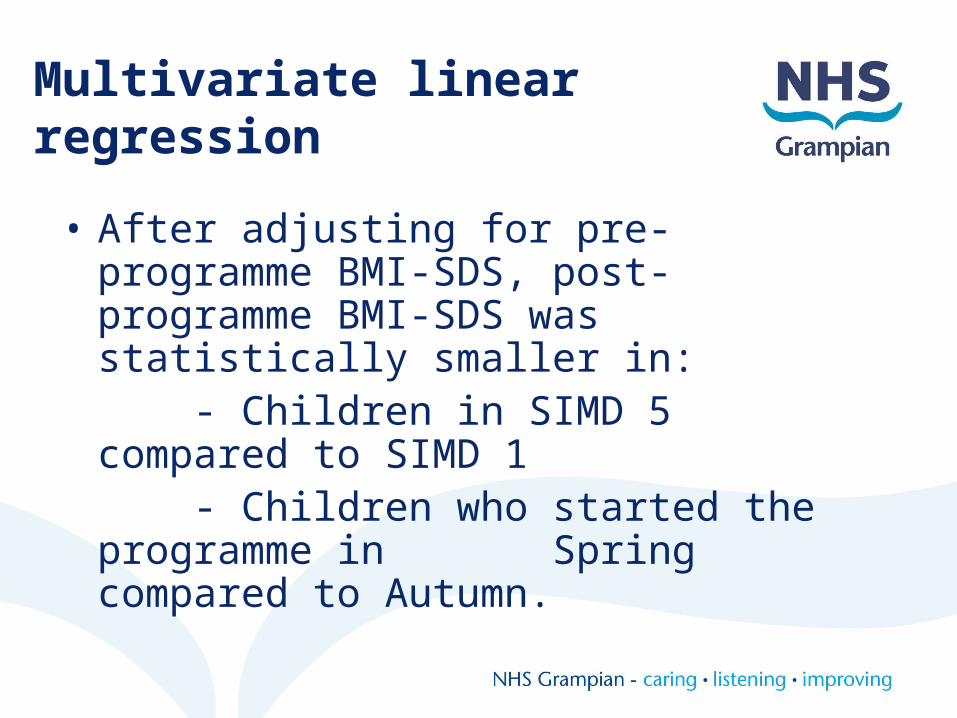
Multivariate linear regression
• After adjusting for pre-programme BMI-SDS, post-programme BMI-SDS was statistically smaller in:
- Children in SIMD 5 compared to SIMD 1
- Children who started the programme in Spring compared to Autumn.
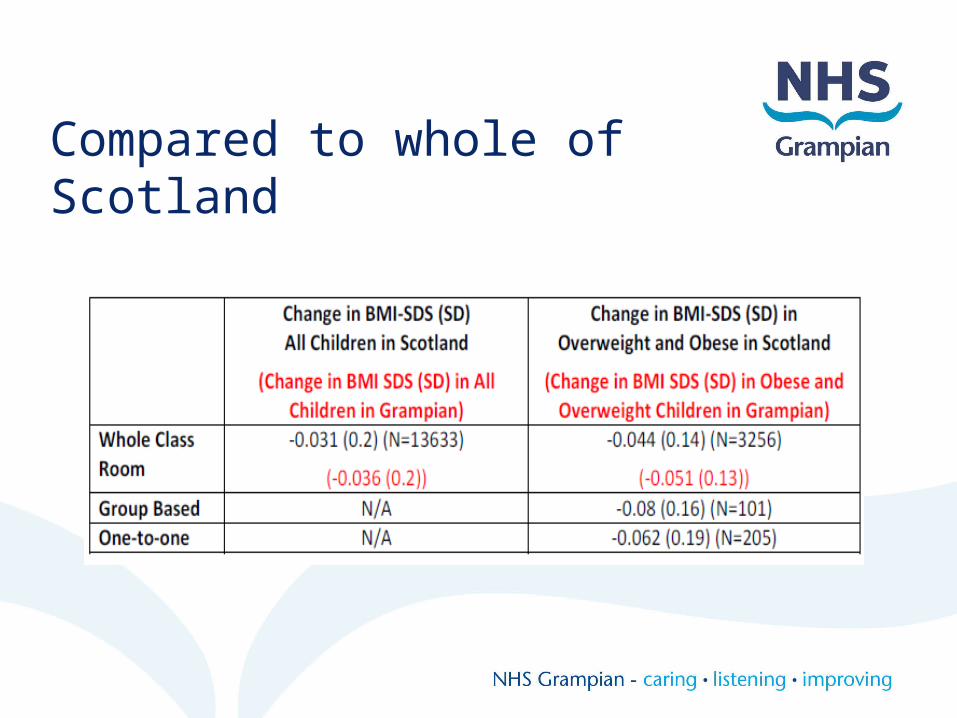
Compared to whole of Scotland
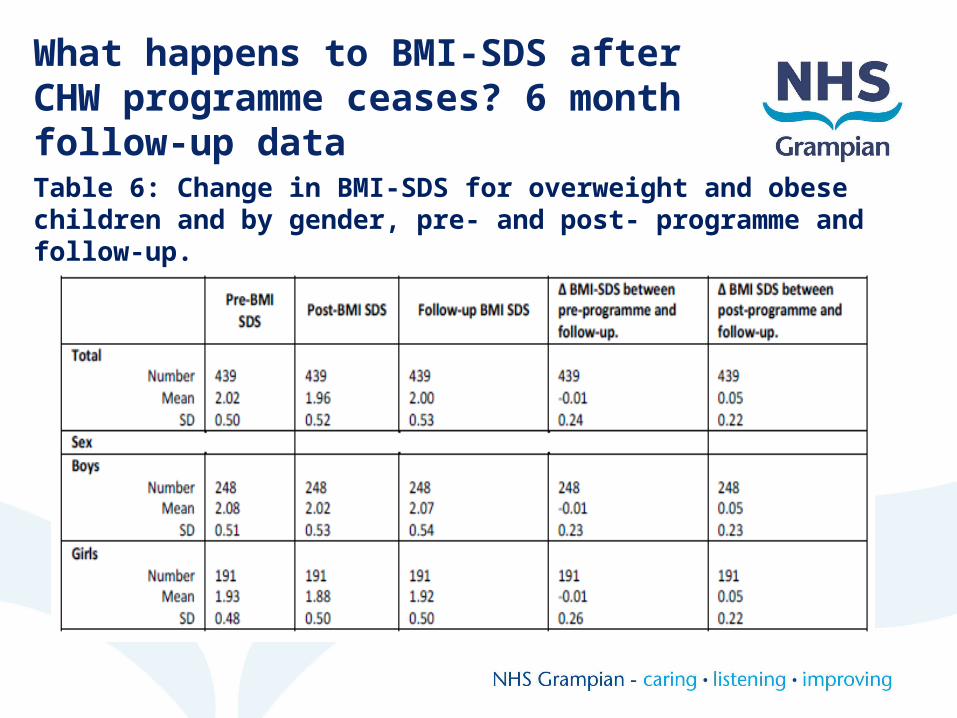
Table 6: Change in BMI-SDS for overweight and obese children and by gender, pre- and post- programme and follow-up.
What happens to BMI-SDS after CHW programme ceases? 6 month follow-up data
Pre-programme BMI-SDS by difference between follow-up and post programme BMI-SDS
Pre-programme BMI-SDS by difference between follow-up and pre-programme BMI-SDS
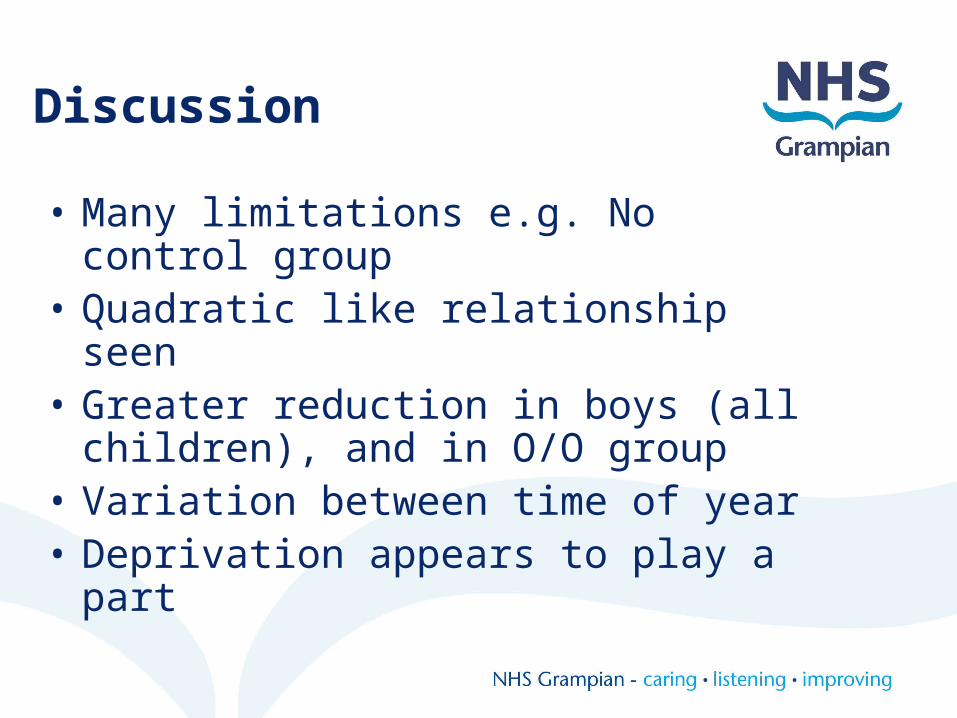
Discussion
• Many limitations e.g. No control group• Quadratic like relationship seen• Greater reduction in boys (all children), and in
O/O group• Variation between time of year• Deprivation appears to play a part
What these results add?
• Similar findings to the Scotland wide evaluation.
• Provides information on what happens to BMI-SDS in these children 6 months after the programme has ceased.
• Additional supporting evidence for effectiveness of GWC on BMI-SDS albeit illustrating potential need for a longer programme or more sustainable approach.
• Explores confounding factors.
Does a reduction of BMI-SDS of this size have a considerable impact on health?
Author Reduction in BMI-SDS associated with improvements in body composition and cardiometabolic measures
Ford et al. (2010) ≥0.25
Reinehr et al. (2004) ≥0.5
Kolsgaard et al. (2011) ≥0.0-<0.1
We found a change in BMI-SDS of 0.051 in overweight and obese children. Change in BMI-SDS relatively small, at a population level could have considerable importance if sustained over time.
With thanks to the GWC teams in the 3 CHPs, Dr Fiona Murray (NHSG Public Health Researcher), and Dr Neil Scott (University of Aberdeen
1. Ford A, Hunt L, Cooper A, Shield J. What reduction in BMI-SDS is required in obese adolescents to improve body composition and cardiometabolic health. Arch Dis Child 2010;95:256-261.
2. Reinehr T, Andler W. Changes in the atherogenic risk factor profile according to degree of weight loss. Arch Dis Child 2004;89:419-22.
3. Kolsgaard M, Joner G, Brunborg C, Anderssen S, Tonstad S, Andersen L. Reduction in BMI z-score and improvement in cardiometabolic risk factors in obese children and adolescents. The Oslo Adiposity Programme Study – a hospital/public health nurse combined treatment. BMC Pediatrics 2011, 11:47.


![GII Primary ST2[1]](https://static.documents.pub/doc/80x56/5534c5e04a7959ae4b8b4c08/gii-primary-st21.jpg)


