25
Quantitative foresight modeling to inform prioritization Keith Wiebe, IFPRI and GFSF ISPC, Rome, 15 September 2015
| Date post: | 12-Apr-2017 |
| Category: |
Science |
| Upload: | independent-science-and-partnership-council-of-the-cgiar |
| View: | 253 times |
| Download: | 3 times |

Quantitative foresight modeling to inform prioritization
Keith Wiebe, IFPRI and GFSF
ISPC, Rome, 15 September 2015

Outline
• Introduce the Global Futures & Strategic Foresight (GFSF) program
• Provide an update on discussions with partners and donors
• Reflect on how we might help inform decision making in the CGIAR
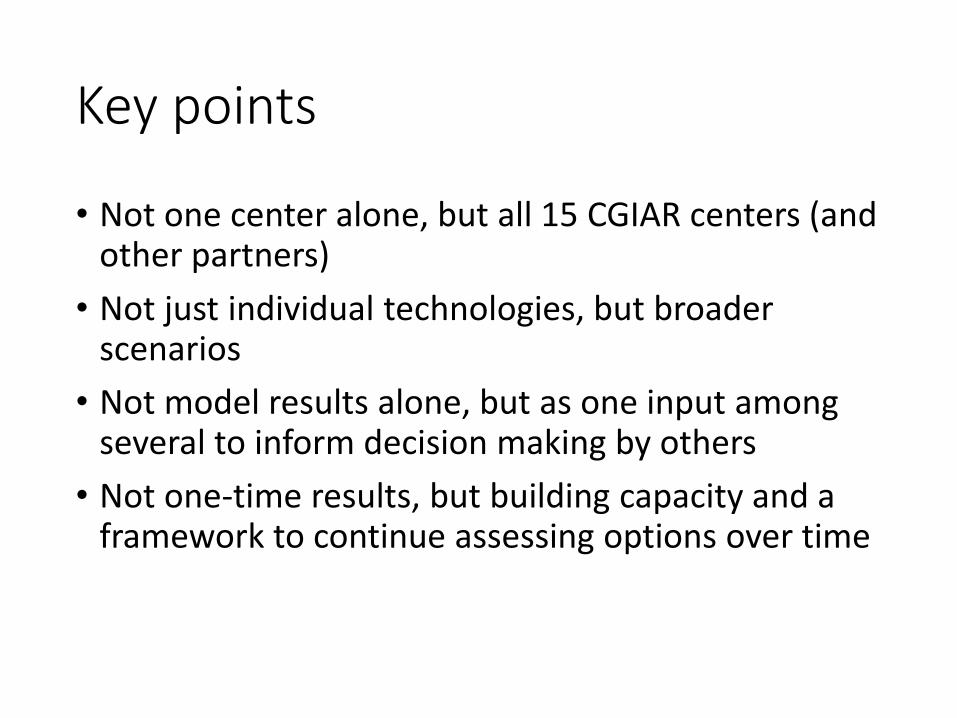
Key points
• Not one center alone, but all 15 CGIAR centers (and other partners)
• Not just individual technologies, but broader scenarios
• Not model results alone, but as one input among several to inform decision making by others
• Not one-time results, but building capacity and a framework to continue assessing options over time
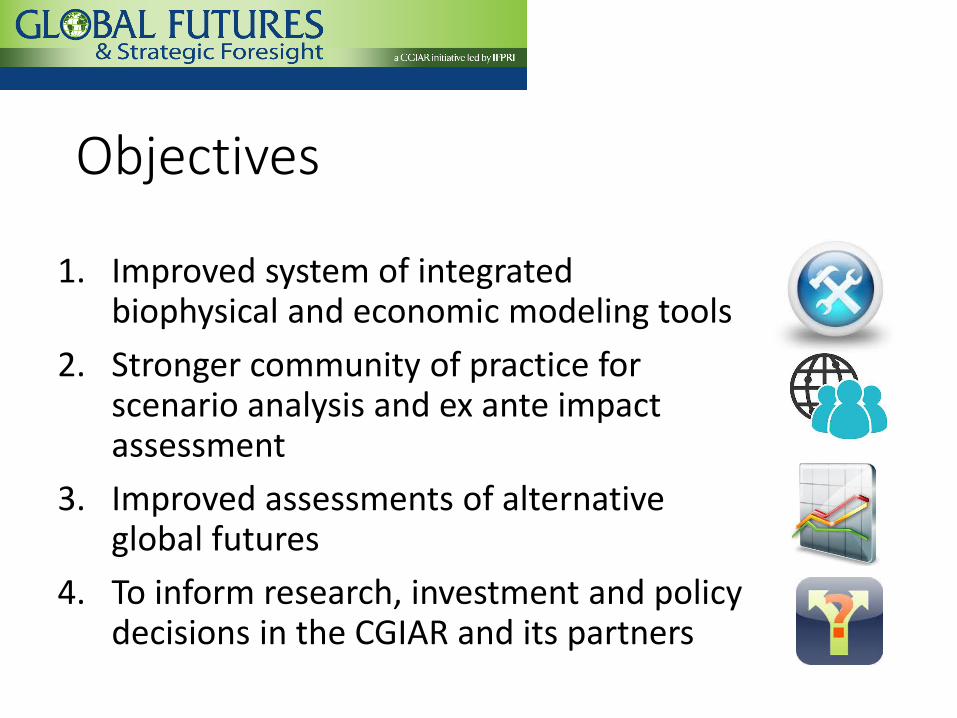
Objectives
1. Improved system of integrated biophysical and economic modeling tools
2. Stronger community of practice for scenario analysis and ex ante impact assessment
3. Improved assessments of alternative global futures
4. To inform research, investment and policy decisions in the CGIAR and its partners
All models are wrong, but some are useful
-- George Box and Norman Draper (1987)
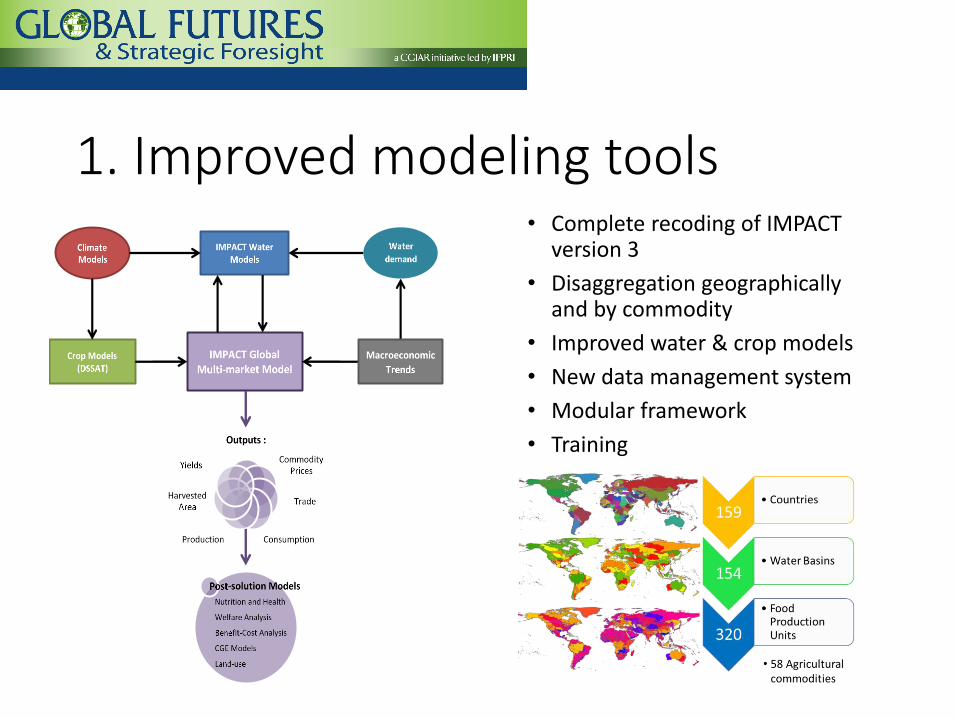
1. Improved modeling tools • Complete recoding of IMPACT
version 3
• Disaggregation geographically and by commodity
• Improved water & crop models
• New data management system
• Modular framework
• Training

2. Stronger community of practice
• All 15 CGIAR centers now participate in GFSF • Bioversity, CIAT, CIMMYT, CIP,
ICARDA, ICRAF, ICRISAT, IFPRI, IITA, ILRI, IRRI, IWMI, WorldFish; AfricaRice and CIFOR are joining
• Collaboration with other global economic modeling groups through AgMIP • PIK, GTAP, Wageningen, IIASA, UFL,
FAO, OECD, EC/JRC, USDA/ERS, …

• Role of agricultural technologies
• Africa regional reports
• Analyses by CGIAR centers
• CCAFS regional studies
• AgMIP global economic assessments
Rainfed Maize (Africa)
Irrigated Wheat (S. Asia)
Rainfed Rice (S. + SE. Asia)
Rainfed Potato (Asia)
Rainfed Sorghum (Africa + India)
Rainfed Groundnut (Africa + SE Asia)
Rainfed Cassava (E. + S. + SE. Asia)
3. Improved assessments

Source: Nelson et al., PNAS (2014)
Modeling climate impacts on agriculture: biophysical and economic effects
General
circulation models (GCMs)
Global
gridded crop models
(GGCMs)
Global
economic models
Δ Temp Δ Precip
…
Δ Yield (biophys)
Δ Area Δ Yield Δ Cons. Δ Trade
Climate Biophysical Economic

Promising CGIAR technologies Crop Center Trait Countries (Region) Final
Adoption
Maize CIMMYT Drought tolerance Angola, Benin, Ethiopia, Ghana, Kenya, Malawi, Mozambique, Uganda, United Republic of Tanzania, Zambia, Zimbabwe (M1)
30%
Heat tolerance Bangladesh, India, Nepal, Pakistan (M2) 30% Wheat CIMMYT Drought tolerance Iran, Turkey (W1) 35%
Heat tolerance India, Pakistan (W2) 30% Drought and heat tolerance Argentina, South Africa (W3) 30%
Potato CIP Drought tolerance Bangladesh, China, Kyrgyzstan, India, Nepal, Pakistan, Tajikistan, Uzbekistan (P1)
4-40% Heat tolerance 4-40% Drought and heat tolerance 4-40%
Sorghum ICRISAT Drought tolerance Burkina Faso, Eritrea, Ethiopia, India, Mali, Nigeria, Sudan, United Republic of Tanzania (S1)
20-80%
Groundnut ICRISAT Drought tolerance Burkina Faso, Ghana, India, Malawi, Mali, Myanmar, Niger, Nigeria, Uganda, United Republic of Tanzania, Viet Nam (G1)
40-60% Heat tolerance 40-60% Drought and heat tolerance, high yielding
40-60%
Cassava CIAT Mealybug control methods China, India, Indonesia, Lao People’s Democratic Republic, Myanmar, Thailand (C1)
NA
Source: Islam et al. (draft)

Yield impacts of selected technologies under climate change (percent difference from 2050 CC baseline without the new technologies)
Source: Islam et al. (draft)
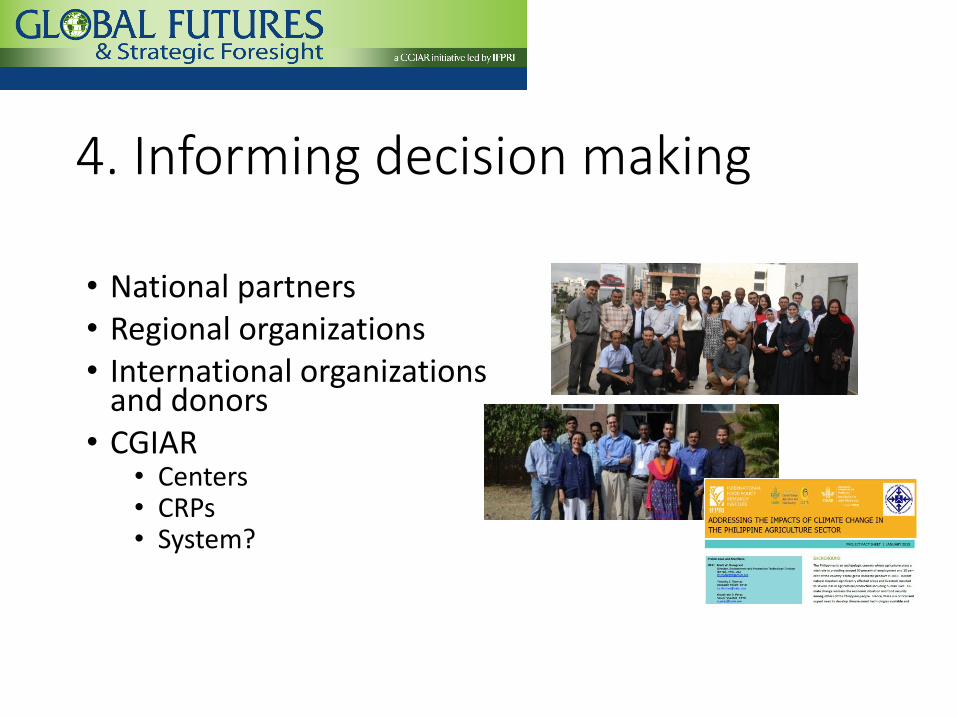
4. Informing decision making
• National partners • Regional organizations • International organizations
and donors • CGIAR
• Centers • CRPs • System?
Discussions with donors and partners
• IFAD proposal (February 2015)
• PIM, Gates, CCAFS (on-going support)
• GFSF partners (continuing engagement)
• AgMIP partners (continuing engagement)
• USAID? (under discussion)
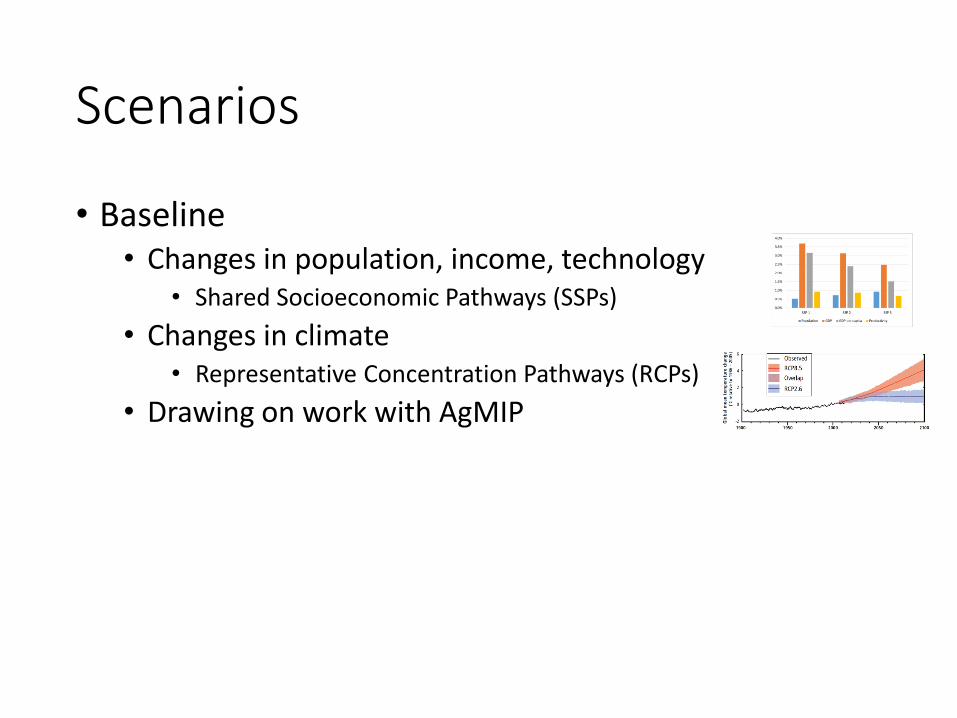
Scenarios
• Baseline • Changes in population, income, technology
• Shared Socioeconomic Pathways (SSPs)
• Changes in climate • Representative Concentration Pathways (RCPs)
• Drawing on work with AgMIP

Socioeconomic and climate drivers
Shared
Socioeconomic
Pathways (SSPs)
Representative
Concentration
Pathways (RCPs)
Source: Downloaded from the RCP Database version 2.0.5 (2015). RCP 2.6: van Vuuren et al. 2006; van Vuuren et al. 2007. RCP 4.5: Clark et al. 2007; Smith and Wigley 2006; Wise et al 2009. RCP 6.0: Fujino et al 2006; Hijioka et al 2008. RCP 8.5: Riahi and Nakicenovic, 2007.
CO2 eq. (ppm) Radiative forcing (W/m2)
Population (billion) GDP (trillion USD, 2005 ppp)
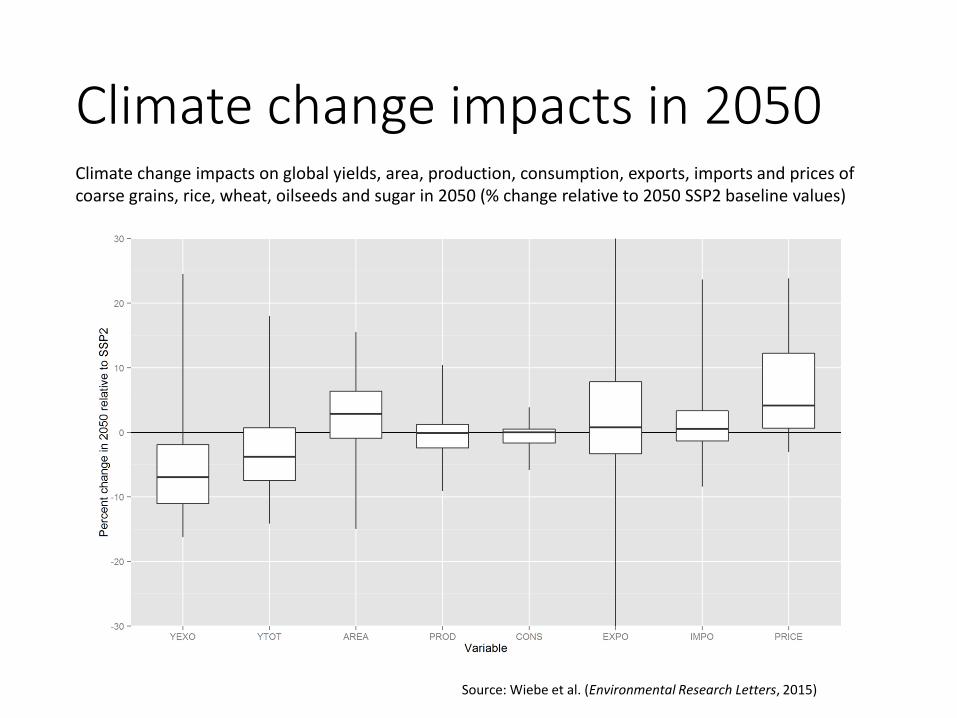
Climate change impacts in 2050 Climate change impacts on global yields, area, production, consumption, exports, imports and prices of coarse grains, rice, wheat, oilseeds and sugar in 2050 (% change relative to 2050 SSP2 baseline values)
Source: Wiebe et al. (Environmental Research Letters, 2015)
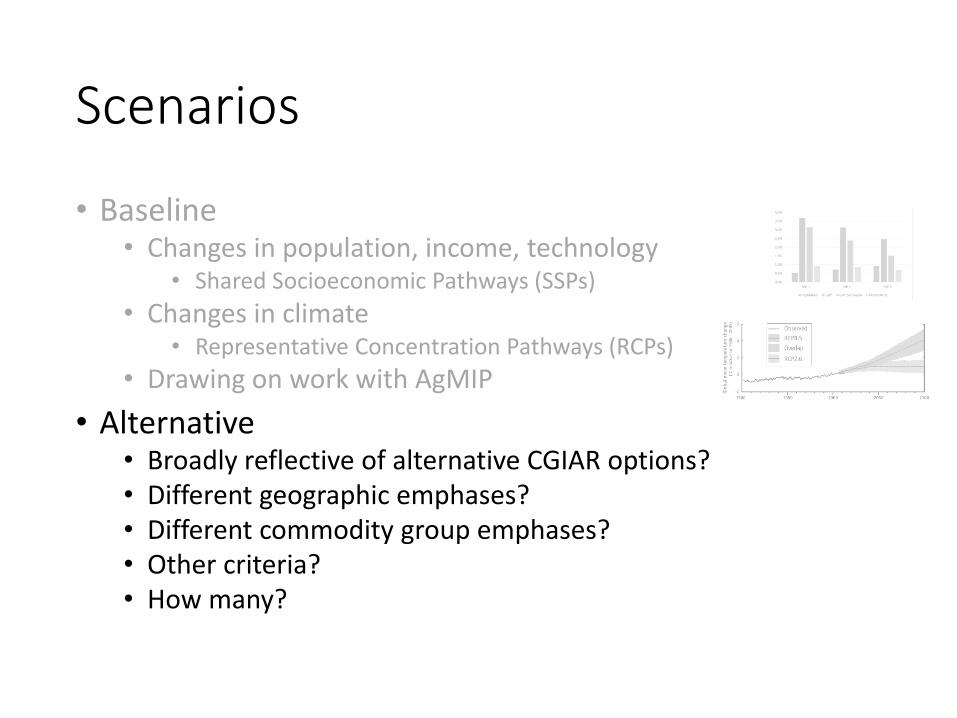
Scenarios
• Baseline • Changes in population, income, technology
• Shared Socioeconomic Pathways (SSPs)
• Changes in climate • Representative Concentration Pathways (RCPs)
• Drawing on work with AgMIP
• Alternative • Broadly reflective of alternative CGIAR options? • Different geographic emphases? • Different commodity group emphases? • Other criteria? • How many?
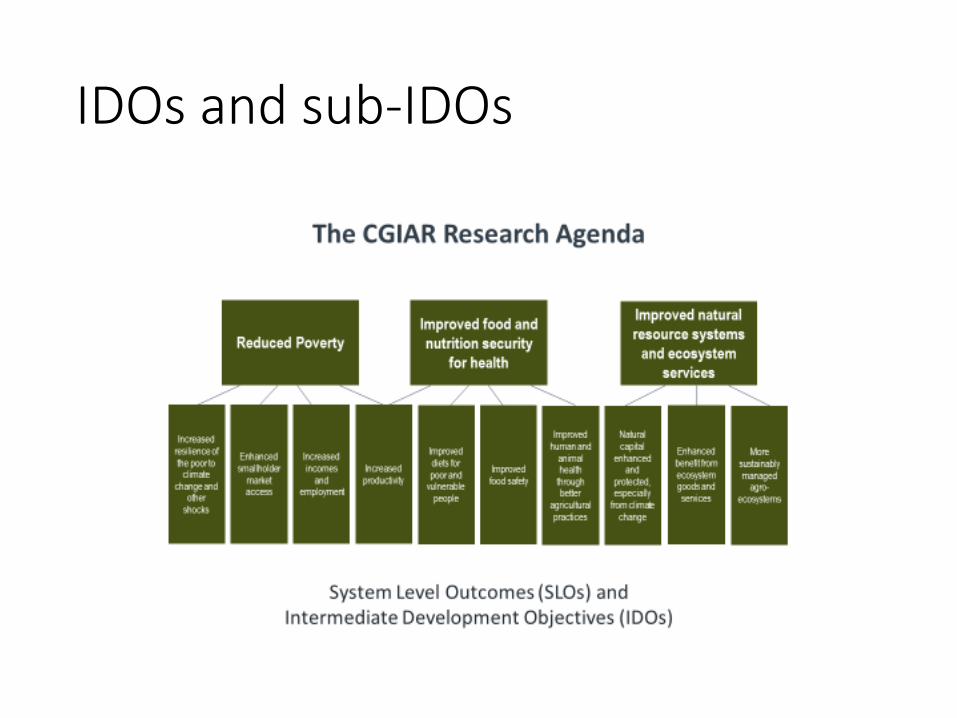
IDOs and sub-IDOs

Model improvements under way
• Livestock and fish
• Nutrition and health
• Variability
• Poverty
• Land use
• Environmental impacts
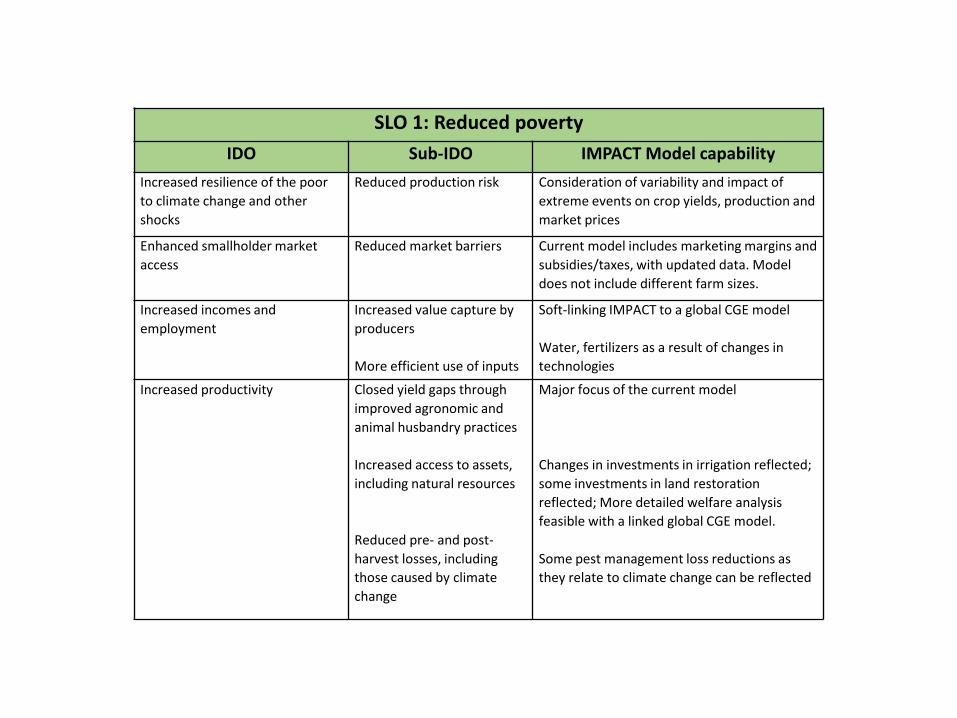
SLO 1: Reduced poverty
IDO Sub-IDO IMPACT Model capability
Increased resilience of the poor
to climate change and other
shocks
Reduced production risk Consideration of variability and impact of
extreme events on crop yields, production and
market prices
Enhanced smallholder market
access
Reduced market barriers Current model includes marketing margins and
subsidies/taxes, with updated data. Model
does not include different farm sizes.
Increased incomes and
employment
Increased value capture by
producers
More efficient use of inputs
Soft-linking IMPACT to a global CGE model
Water, fertilizers as a result of changes in
technologies
Increased productivity Closed yield gaps through
improved agronomic and
animal husbandry practices
Increased access to assets,
including natural resources
Reduced pre- and post-
harvest losses, including
those caused by climate
change
Major focus of the current model
Changes in investments in irrigation reflected;
some investments in land restoration
reflected; More detailed welfare analysis
feasible with a linked global CGE model.
Some pest management loss reductions as
they relate to climate change can be reflected
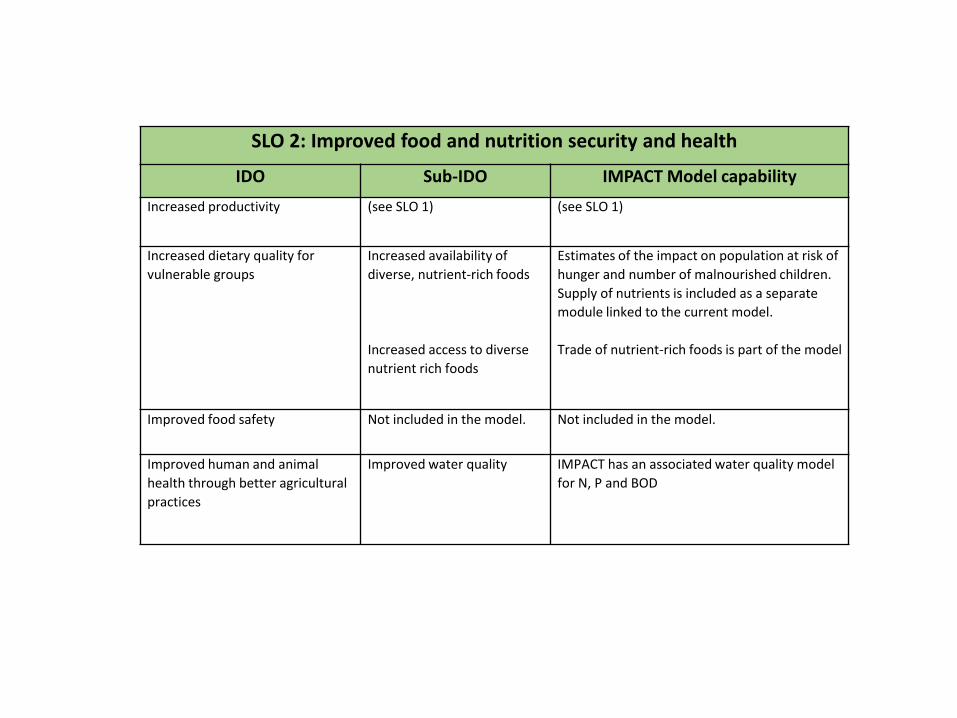
SLO 2: Improved food and nutrition security and health
IDO Sub-IDO IMPACT Model capability
Increased productivity (see SLO 1) (see SLO 1)
Increased dietary quality for
vulnerable groups
Increased availability of
diverse, nutrient-rich foods
Increased access to diverse
nutrient rich foods
Estimates of the impact on population at risk of
hunger and number of malnourished children.
Supply of nutrients is included as a separate
module linked to the current model.
Trade of nutrient-rich foods is part of the model
Improved food safety Not included in the model. Not included in the model.
Improved human and animal
health through better agricultural
practices
Improved water quality
IMPACT has an associated water quality model
for N, P and BOD
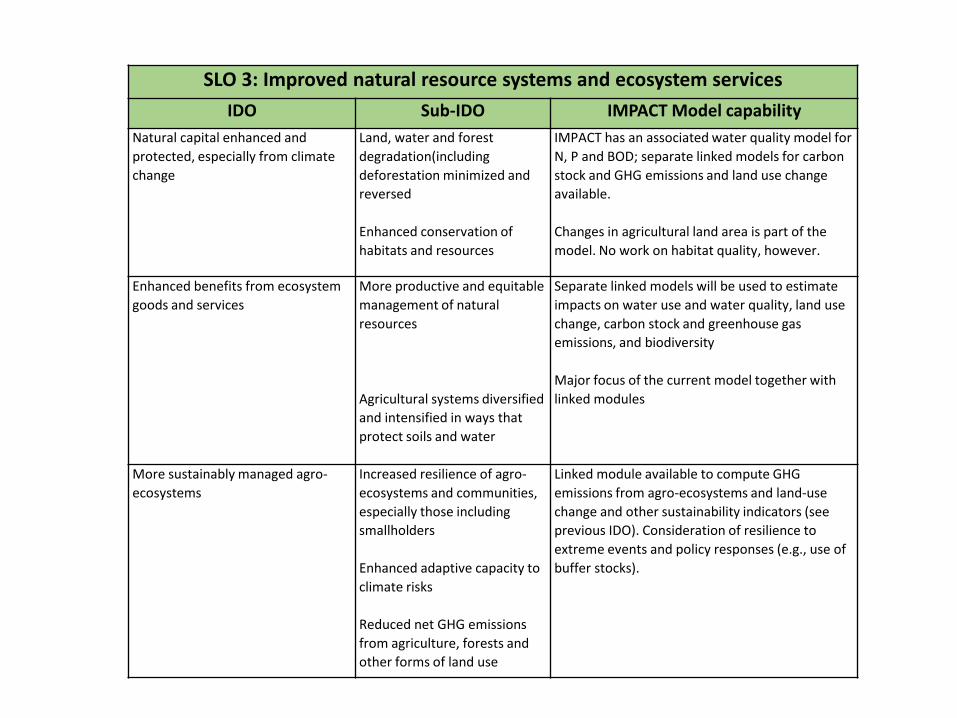
SLO 3: Improved natural resource systems and ecosystem services
IDO Sub-IDO IMPACT Model capability
Natural capital enhanced and
protected, especially from climate
change
Land, water and forest
degradation(including
deforestation minimized and
reversed
Enhanced conservation of
habitats and resources
IMPACT has an associated water quality model for
N, P and BOD; separate linked models for carbon
stock and GHG emissions and land use change
available.
Changes in agricultural land area is part of the
model. No work on habitat quality, however.
Enhanced benefits from ecosystem
goods and services
More productive and equitable
management of natural
resources
Agricultural systems diversified
and intensified in ways that
protect soils and water
Separate linked models will be used to estimate
impacts on water use and water quality, land use
change, carbon stock and greenhouse gas
emissions, and biodiversity
Major focus of the current model together with
linked modules
More sustainably managed agro-
ecosystems
Increased resilience of agro-
ecosystems and communities,
especially those including
smallholders
Enhanced adaptive capacity to
climate risks
Reduced net GHG emissions
from agriculture, forests and
other forms of land use
Linked module available to compute GHG
emissions from agro-ecosystems and land-use
change and other sustainability indicators (see
previous IDO). Consideration of resilience to
extreme events and policy responses (e.g., use of
buffer stocks).

To conclude
• Summary – GFSF, discussions, how to contribute?
• Conclusions – 4 key points • Collective effort • Appropriate scale of analysis • One input among many, to inform • On-going effort • Institutional considerations & managing expectations
• Questions • What scenarios? (baseline and alternative) • What indicators? (IMPACT standard, IDOs, sub-IDOs) • What process? (scenario definition, discussion of results)

globalfutures.cgiar.org


