26
Quantitative imaging of living biological samples by Peak Force Tapping atomic force microscopy Alexandre Berquand, Bruker Nano, August 17 2011

Quantitative imaging of living biological samples by Peak Force Tapping atomic force microscopy
Alexandre Berquand, Bruker Nano, August 17 2011

Why force measurements are essential in biology?
8/17/2011 2BRUKER CONFIDENTIAL
• Mechanical properties of cells are determined by the dynamic behavior of their cytoskeleton.
• Alterations of the mechanical phenotype of the cell can lead to severe malfunctions or disease (cancer, malaria, neurodegeneration).
• Cancer cells are known to be softer than their normal homologues.
• AFM is the tool of choice to measure cells mechanical properties ex vivo and to correlate a change in mechanical properties with:
• Drug treatment
• Aging
• Pathology

AFM under physiological conditions
• Different types of perfusion systems to keep cells alive for a non-limited period of time:
Regular fluid cell
Perfusing Stage Incubator

Tapping Mode and Phase imaging
8/17/2011 4BRUKER CONFIDENTIAL
• The phase shift just reflects the energy dissipated but is a contribution of several factors and is not quantitative
depends on AFM
parameters, surface and volume properties

8/17/2011 5BRUKER CONFIDENTIAL
Force Spectroscopy
• Main drawbacks: slow, poor resolution and lack of information
distance (nm)
forc
e (
nN
)
0
1
2
-1
5000
Single force
Force volume
Stiffness (Young’s
modulus)
Adhesion

8/17/2011 6BRUKER CONFIDENTIAL
Peak Force Tapping - principle
• Works with most standard AFM probes in the standard AFM cantilever holders.
• Z piezo is driven with sinusoidal waveform (not a triangle as in force-distance curves).
• Z drive frequency is 2 kHz (Catalyst 1 kHz). That’s far below the cantilever’s resonance.
• Z drive amplitude is fixed at typical value of 150 nm (300 nm peak-to-peak)
• Vertical motion of probe produces force-distance plots as it taps on the sample.
• Imaging feedback is based on the Peak Force of the force-distance curve.

8/17/2011 7BRUKER CONFIDENTIAL
Peak Force Tapping - features
• SCANASYST:
• uses automatic image optimization technology
• simplifies and speeds up expert-level image acquisition
• PEAKFORCE QNM:
• generates quantitative maps of nanoscale material properties
• does this simultaneously during imaging at consistently low force and high resolution
• Data extraction:

PeakForce QNM - Calibration
• Relative method
• Calculate the defl. Sens.
• Calculate the spring constant
• Image a ref. sample and adjust the tip radius
• Adjust the deformation
• Absolute method
• Calculate the defl. Sens.
• Calculate the spring constant
• Image a tip check sample and measure the tip radius

8/17/2011 BRUKER CONFIDENTIAL
PeakForce QNM - Modulus measurement
Choose probe type according to range of expected modulus
Requirements:
Probe needs to deform sample (minimum: a few nm)
Probe needs to be deflected by sample (minimum a few nm)

2: Elasticity
3: Adhesion
• PeakForce QNM works in both air and liquid
• Relevant and quantitative contrast on all the channels
• Applications in liquids have not been as thoroughly explored:
• DNA, most of polymers: OK
• Cells?
Typical example: DNA

8/17/2011 11BRUKER CONFIDENTIAL
Simon
Scheuring,
Physico-Chimie
Institut Curie ,
ScanAsyst lever, 0.4 N/m)
Scale bar
10 nm
Scheuring et al
Eur Biophys J
(2002)
Any compromise between measurement of mechanical properties and resolution?

8/17/2011 12BRUKER CONFIDENTIAL
Sea water samples: imaging of frustules
• 1st time that such sample is imaged by AFM
• Very detailed contrast in Young’s modulus and deformation

• First image of living diatoms with PFT and PFQNM.
• YM of different parts:
• Fibulae ~200 MPa
• Silica stripes ~44 MPa
• Core matrix ~21 MPa
• …
Under press (Journal of Phycology)
Sea water samples: imaging of diatoms

8/17/2011 14BRUKER CONFIDENTIAL
Imaging of E. coli K12
• Strain very hard to image by AFM because they move very fast when under stress
• b: 3d-height (10x10m) image of a necklace of living k12 acquired in 20 min.
• DMT modulus image of the same bacteria. Average Young’s modulus = 183 kPa

PFQNM study on human glioblastoma
U251-MG cells
(invasive)
1st site-specific
recombination:
Empty vector + GFP as
integration site
Selection of cells having
integrated the vector
2nd site-specific recombination:
Integration of expression vector
which carries the gene of interest,
inside the GFP site
Test with TP53 and PTEN
Possibly have ≠ mechanical properties

8/17/2011 16BRUKER CONFIDENTIAL
PFQNM High Resolution images on glioblastoma - display 2 channels simultaneously
40x40 µm PF error image 3d-height + deformation skin

Topography (z: 0-250 pN) Elasticity (z: 0-1.2 MPa) Adhesion (z: 0-800 pN)
Deformation (z: 0-250 nm)
• 128x128 images (5 min per image): averaging on a high number of images
• Highly quantitative
• No damage of the sample
PFQNM Low Resolution images on glioblastoma - statistics
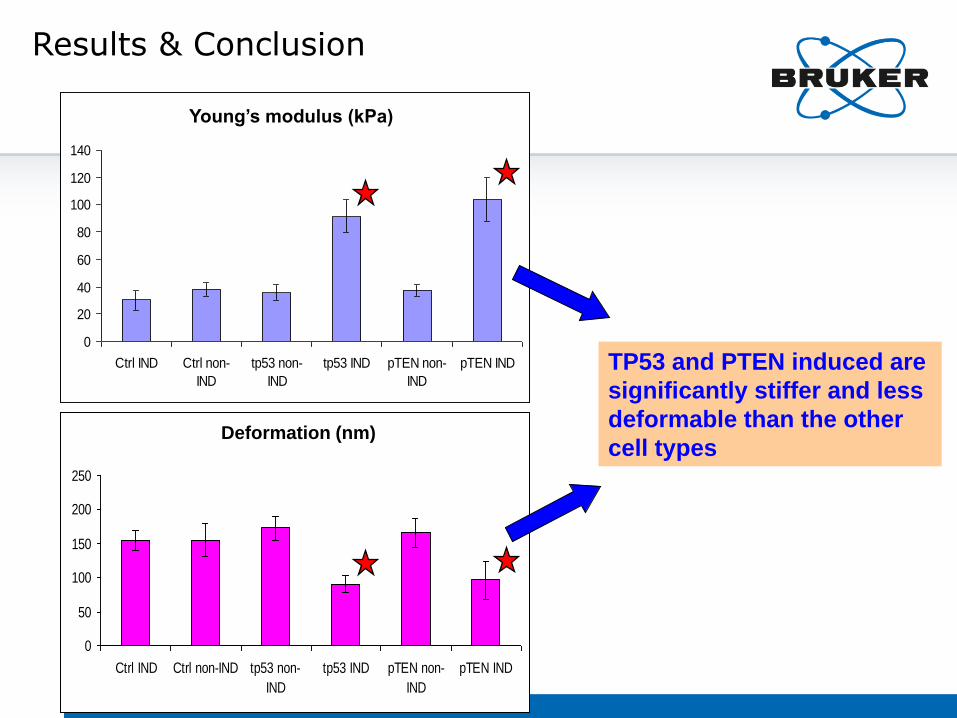
Elasticity (kPa)
0
20
40
60
80
100
120
140
Ctrl IND Ctrl non-
IND
tp53 non-
IND
tp53 IND pTEN non-
IND
pTEN IND
Deformation (nm)
0
50
100
150
200
250
Ctrl IND Ctrl non-IND tp53 non-
IND
tp53 IND pTEN non-
IND
pTEN IND
Young’s modulus (kPa)
Deformation (nm)
TP53 and PTEN induced are
significantly stiffer and less
deformable than the other
cell types
Results & Conclusion

8/17/2011 19BRUKER CONFIDENTIAL
Imaging of living HaCaT and effect of Glyphosate
Cell under stress:
retracting &
synthesizing stress
fibers
[Glyphosate]
increase of YM by
factor 3
Adhesion much
higher between the
cells than on the
cells
Average dissipation
= 1.3 keV = 2.10-16 J

MIRO: Overlay optical and AFM data in a few clicks
3) Overlay optical and AFM
images1) Import optical image into
Nanoscope
2) Target a location for the
AFM scan
Hela HaCaT

8/17/2011 21BRUKER CONFIDENTIAL
Combining MIRO and PFQNM
• a: overlay of fluorescence (nucleus + actin) and AFM (PF error + YM) images.
• b: PF error channel: 0-450 pN
• c: YM channel: 0-4 MPa
• d: deformation channel: 0-250 nm
• Offers nice perspectives in biology: correlate fluorescence and AFM signals simultaneously in response to drug treatment

8/17/2011 22BRUKER CONFIDENTIAL
Typical samples and corresponding probes - Summary
Calibration of Young’s Modulus by Gelatin or Agarose: ~1 to 100 kPa

8/17/2011 23BRUKER CONFIDENTIAL
Conclusions
• Since its development, Peak Force Tapping and PeakForce QNM have greatly improved to extend the range on biological samples
• Though it’s still not 100% quantitative for the softest samples, a very wide range of applications can be covered
• We are still working on expanding the range…
• Promising possibilities for recognition mapping with functionalized probes (still confidential)

8/17/2011 24BRUKER CONFIDENTIAL
New Application Note released…

Acknowledgements (sample providers)
• Vesna Svetlicic, Tea Radic and Galja Pletikapic (Rudjer Boskovic Institute, Zagreb, Croatia)
• Gregory Francius (LCPME, Nancy, France)
• Andreas Holloschi, Leslie Ponce, Ina Schaeffer, Hella-Monika Kuhn, Petra Kioshis and Mathias Hafner (University of Applied Sciences, Mannheim, Germany)
• Laurence Nicod, Celine Caille and Celine Heu (Institut FEMTO-ST, Besancon, France)

Contact information
+49 174 333 94 62
+49 621 842 10 66
• Contact email for Sales and Support
• Webinar Series
www.bruker-axs.com/atomic-force-microscopy-webinar-series
• PeakForce QNM
www.bruker-axs.com/PeakForceQNM
• ScanAsyst
www.bruker-axs.com/ScanAsyst
• BioScope Catalyst
www.bruker-axs.com/bioscope-catalyst-atomic-force-microscope
• Bruker NanoScale World Forum – Share, discuss, and learn about everything nano
http://nanoscaleworld.bruker-axs.com/nanoscaleworld/


