Occupational Exposure to Diacetyl and 2,3-Pentanedione 105 5 Quantitative Risk Assessment Based on Employee Data Taken together, the human and animal studies provide a compelling case for the respiratory toxicity of diacetyl and 2,3-pentanedione, and potentially other alpha diketones used in butter flavorings, of which diacetyl is the most thor- oughly studied. e clinical experience and employee population studies have revealed a clear association between diacetyl exposure and diminishing respiratory capacity that has been shown in some cases to become manifest as obliterative bronchiolitis. The expanding animal research on diacetyl clearly describes pathological changes specific to this compound that provide an ample mechanistic basis for anticipating respiratory disease in humans. In this chapter, a risk assessment is presented that begins with the established premise that diace- tyl causes irreversible respiratory damage. e analyses presented are designed specifically to describe that causal relationship for the purpose of predicting risk in working populations, not to prove that a causal relationship exists. us statistical significance is less important than insights provided into the nature of the rela- tionship between diacetyl and diminishing respiratory capacity. Other potentially reactive or toxic compounds can be present in association with diacetyl in flavoring applications, such as acetoin or acet- aldehyde. An NTP 90-day study on acetoin is in progress [National Toxicology Program 2013b] but the chosen maximum exposure level (generally representing the maximum tolerated dose) is 800 ppm whereas in the NTP 90-day diacetyl study the maximum exposure level is 100 ppm [National Toxicology Program 2013a]. is implies a considerably lower level of potency for acetoin toxicity. Furthermore, in the population on which the risk assess- ment was based, acetoin concentrations were an order of magnitude lower than diacetyl levels. Acetaldehyde is less consistently associ- ated with diacetyl and is oſten below the limit of detection. e goal of this chapter is first to present a numerical estimate of the risk of developing respiratory disease due to occupational expo- sure to diacetyl using standard epidemiological methods. is estimate is based on statistical models that describe the relationship between exposure to diacetyl and the development of impaired lung function in a known popula- tion of exposed employees. Exposure-response modeling requires making assumptions about the exposures of the persons studied over the course of their working lifetime, and about the mathematical form of the exposure-response relationship. Using these models, a further goal was to estimate an exposure level below which there would be a relatively low risk. One approach that is used (benchmark dose) is to estimate what additional proportion of a known population would have abnormal lung function if their past exposure corresponded to a lifetime of working at some specific expo- sure level. Another approach estimates how many new cases of abnormal lung function would develop over a lifetime (excess lifetime risk) as a result of working at various exposure levels. Finally, the various methods are used to develop a range of plausible risk estimates for occupational exposure to diacetyl.
Transcript
Occupational Exposure to Diacetyl and 2,3-Pentanedione 105
5 Quantitative Risk Assessment Based on Employee Data
Taken together, the human and animal studies provide a compelling case for the respiratory toxicity of diacetyl and 2,3-pentanedione, and potentially other alpha diketones used in butter flavorings, of which diacetyl is the most thor-oughly studied. The clinical experience and employee population studies have revealed a clear association between diacetyl exposure and diminishing respiratory capacity that has been shown in some cases to become manifest as obliterative bronchiolitis. The expanding animal research on diacetyl clearly describes pathological changes specific to this compound that provide an ample mechanistic basis for anticipating respiratory disease in humans. In this chapter, a risk assessment is presented that begins with the established premise that diace-tyl causes irreversible respiratory damage. The analyses presented are designed specifically to describe that causal relationship for the purpose of predicting risk in working populations, not to prove that a causal relationship exists. Thus statistical significance is less important than insights provided into the nature of the rela-tionship between diacetyl and diminishing respiratory capacity.
Other potentially reactive or toxic compounds can be present in association with diacetyl in flavoring applications, such as acetoin or acet-aldehyde. An NTP 90-day study on acetoin is in progress [National Toxicology Program 2013b] but the chosen maximum exposure level (generally representing the maximum tolerated dose) is 800 ppm whereas in the NTP 90-day diacetyl study the maximum exposure level is 100 ppm [National Toxicology Program
2013a]. This implies a considerably lower level of potency for acetoin toxicity. Furthermore, in the population on which the risk assess-ment was based, acetoin concentrations were an order of magnitude lower than diacetyl levels. Acetaldehyde is less consistently associ-ated with diacetyl and is often below the limit of detection.
The goal of this chapter is first to present a numerical estimate of the risk of developing respiratory disease due to occupational expo-sure to diacetyl using standard epidemiological methods. This estimate is based on statistical models that describe the relationship between exposure to diacetyl and the development of impaired lung function in a known popula-tion of exposed employees. Exposure-response modeling requires making assumptions about the exposures of the persons studied over the course of their working lifetime, and about the mathematical form of the exposure-response relationship. Using these models, a further goal was to estimate an exposure level below which there would be a relatively low risk. One approach that is used (benchmark dose) is to estimate what additional proportion of a known population would have abnormal lung function if their past exposure corresponded to a lifetime of working at some specific expo-sure level. Another approach estimates how many new cases of abnormal lung function would develop over a lifetime (excess lifetime risk) as a result of working at various exposure levels. Finally, the various methods are used to develop a range of plausible risk estimates for occupational exposure to diacetyl.
106 Occupational Exposure to Diacetyl and 2,3-Pentanedione
5 . Quantitative Risk Assessment Based on Employee Data
Although diacetyl causes obliterative bron-chiolitis, a debilitating and potentially fatal condition, it may be associated with a spec-trum of disorders. Clinical observations present a picture of largely obstructive disease with a combination of reduced FEV1 and FEV1/FVC ratio. However, it may also cause restrictive ven-tilatory impairment, characterized by reduced FEV1 and normal FEV1/FVC ratio [Akpinar-Elci et al. 2004; Kreiss 2007; Lockey et al. 2009]. FEV1 is the most commonly used outcome vari-able to assess lung function impairment caused by hazardous agents, regardless of the specific nature of impairment (obstructive or restric-tive or combined). American Thoracic Society/European Respiratory Society (ATS/ERS) rec-ommendations are to use FEV1 to assess the severity of any type of spirometric abnormality [Pellegrino et al. 2005]. The health effects out-comes of diacetyl exposure that NIOSH used in this risk assessment therefore included (1) reductions in FEV1 (which would be seen in either obstruction or restriction), (2) reduc-tions in FEV1/FVC (a measure more specific to obstruction), and (3) onset of cases defined by symptoms in employees whose FEV1 and/or FEV1/FVC are below their lower limits of normal, conditions that plausibly would include cases of developing obliterative bronchiolitis.
5.1 Methods: Study Population, Exposure Assessment, and Outcomes
5.1.1 Study Population
Six NIOSH HHEs conducted at workplaces producing microwave popcorn with diacetyl exposures were reviewed for possible use in risk assessment [NIOSH 2003a, b, c, 2004a, b, 2006]. Two of the HHEs had very small workforces involved in popcorn production (< 10 per shift) [NIOSH 2003b, c]. Four were determined to have the potential to provide sufficient work history, environmental assessment, and outcome information (pulmonary function) to support modeling of exposure response: Company G [NIOSH 2006], Company L [NIOSH 2004b], Company K [NIOSH 2004a], and Company N [NIOSH 2003a] (Table 5-1). In three of these HHEs a single episode of environmental and health outcomes assessment was conducted, but for Company G [NIOSH 2006] nine different surveys (eight with spirometry assessments) were performed, providing the possibility of a longitudinal analysis. With estimates of
Table 5-1. Study populations from NIOSH health hazard evaluations
Name G K N L
Number of surveys 9* 1 1 1Total workforce at survey 135–165 193 48 313Workforce evaluated (%) 363† (73–91) 157 (81) 35 (73) 206 (66)Date of survey Nov 2000–Jul 2003 Jul 2002 Nov 2002 Mar 2003
Start date for diacetyl use 1-Jul-1986 1-Jul-1988 1-Jul-1986 1-Jan-1994
Source: NIOSH health hazard evaluations*Nine exposure assessments and eight medical evaluations were performed.†Number of unique employees evaluated one or more times
Occupational Exposure to Diacetyl and 2,3-Pentanedione 107
5 . Quantitative Risk Assessment Based on Employee Data
the diacetyl exposure response, standard risk assessment procedures can be applied.
5.1.2 Environmental Assessment and Exposure Estimation
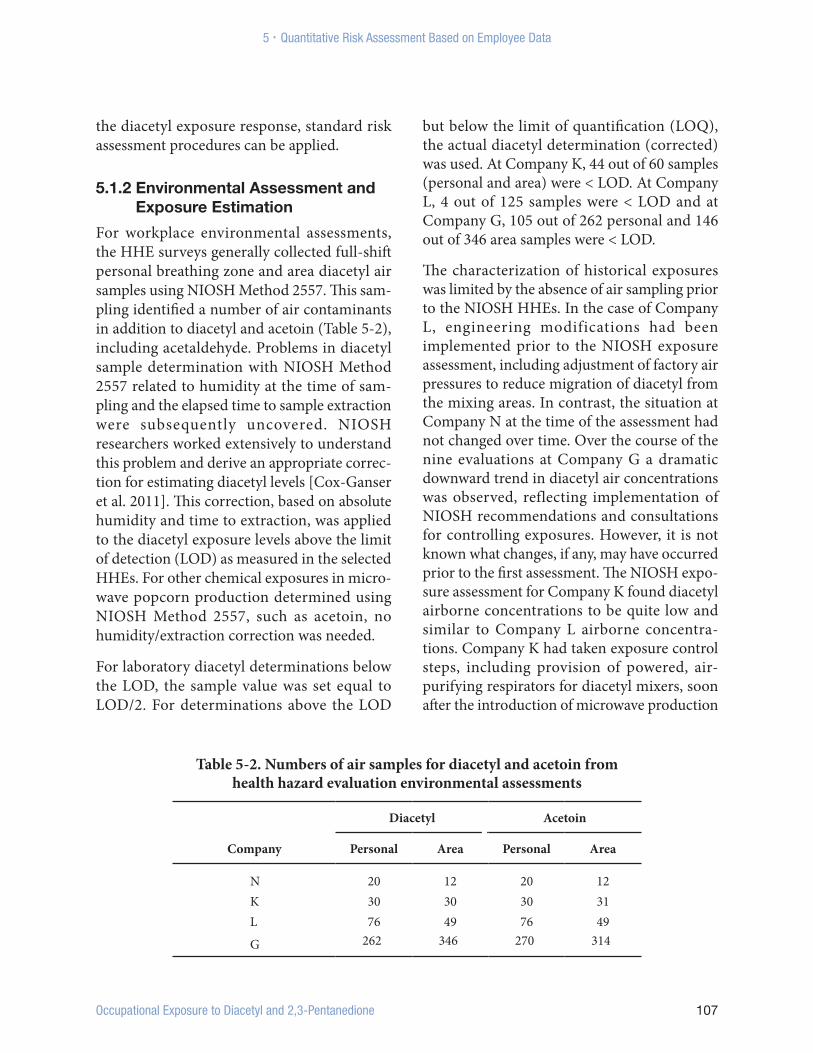
For workplace environmental assessments, the HHE surveys generally collected full-shift personal breathing zone and area diacetyl air samples using NIOSH Method 2557. This sam-pling identified a number of air contaminants in addition to diacetyl and acetoin (Table 5-2), including acetaldehyde. Problems in diacetyl sample determination with NIOSH Method 2557 related to humidity at the time of sam-pling and the elapsed time to sample extraction were subsequently uncovered. NIOSH researchers worked extensively to understand this problem and derive an appropriate correc-tion for estimating diacetyl levels [Cox-Ganser et al. 2011]. This correction, based on absolute humidity and time to extraction, was applied to the diacetyl exposure levels above the limit of detection (LOD) as measured in the selected HHEs. For other chemical exposures in micro-wave popcorn production determined using NIOSH Method 2557, such as acetoin, no humidity/extraction correction was needed.
For laboratory diacetyl determinations below the LOD, the sample value was set equal to LOD/2. For determinations above the LOD
but below the limit of quantification (LOQ), the actual diacetyl determination (corrected) was used. At Company K, 44 out of 60 samples (personal and area) were < LOD. At Company L, 4 out of 125 samples were < LOD and at Company G, 105 out of 262 personal and 146 out of 346 area samples were < LOD.
The characterization of historical exposures was limited by the absence of air sampling prior to the NIOSH HHEs. In the case of Company L, engineering modifications had been implemented prior to the NIOSH exposure assessment, including adjustment of factory air pressures to reduce migration of diacetyl from the mixing areas. In contrast, the situation at Company N at the time of the assessment had not changed over time. Over the course of the nine evaluations at Company G a dramatic downward trend in diacetyl air concentrations was observed, reflecting implementation of NIOSH recommendations and consultations for controlling exposures. However, it is not known what changes, if any, may have occurred prior to the first assessment. The NIOSH expo-sure assessment for Company K found diacetyl airborne concentrations to be quite low and similar to Company L airborne concentra-tions. Company K had taken exposure control steps, including provision of powered, air-purifying respirators for diacetyl mixers, soon after the introduction of microwave production
Table 5-2. Numbers of air samples for diacetyl and acetoin from health hazard evaluation environmental assessments
Company
Diacetyl Acetoin
Personal Area Personal Area
N 20 12 20 12K 30 30 30 31L 76 49 76 49
G 262 346 270 314
108 Occupational Exposure to Diacetyl and 2,3-Pentanedione
5 . Quantitative Risk Assessment Based on Employee Data
following an outbreak of eye irritation. NIOSH-measured diacetyl exposure levels for key process locations showed considerable varia-tion across the four selected HHE sites with higher levels at Company G and Company N (Table 5-3). The generally lower airborne con-centrations at Company K and Company L may have occurred because the mixing operations at those two plants were isolated from the produc-tion areas unlike the situations at Companies G and N.
Mean diacetyl exposures for the Company K, L, and N populations were calculated classifying by department and job (Appendix G, Tables G.1–G.3) based on the corrected air concentrations of diacetyl. The most extensive and representative diacetyl exposure data and the largest body of respiratory outcomes data were available from the HHE at the Company G microwave popcorn plant [Kullman et al. 2005; NIOSH 2006]. This population had
the largest number of air samples, over nine surveys, and based on their inquiries the HHE investigators determined that no significant control changes had been implemented prior to the first survey. For Company G, with repeated environmental assessments between November 2000 and July 2003 (2.7 years), to estimate employees’ diacetyl exposures over time within department/job combinations, a job exposure matrix (JEM) was constructed through collaboration between NIOSH and OSHA (Appendix H). Plant job titles were aggregated into eight exposure categories based on work and environmental similarities (Table 5-4) [Corn and Esmen 1979]. Starting with the humidity- and time-to-extraction-corrected personal breathing zone sample concentrations (in parts per million), means were calculated for the cells in the JEM (Appendix G, Table G.4). Arithmetic means of personal samples are the preferred measure of central tendency for estimating cumulative exposure in
Table 5-3. Arithmetic mean air concentrations (ppm) of diacetyl in major processes at four sites
Company
Mixing Production Quality control Maintenance
n, nND Mean (SD) n, nND Mean (SD) n, nND Mean (SD) n, nND Mean (SD)
Abbreviations: n = total number of samples, nND = number of non-detect samples, SD = standard deviation,—indicates lack of dataNote: Means are for corrected concentrations and given in parts per million (ppm); not all jobs fall within the four process
categories displayed.
Occupational Exposure to Diacetyl and 2,3-Pentanedione 109
5 . Quantitative Risk Assessment Based on Employee Data
chronic disease investigations [Smith 1992]. However, for the first industrial hygiene survey (November 2000), only area samples were collected. For this survey, personal-sample equivalents to the area samples were estimated using area and personal sampling data from surveys 2 and 3 for the higher-exposed jobs, and using other procedures for samples with the lower values (Appendix H, Table H.3). Unique exposure time periods were developed for each of the eight exposure categories to reflect impact of the exposure control changes implemented at the plant from November 2000 to July 2003. Within the time periods for each JEM exposure category, exposures were assumed to be constant. Exposure estimates in the JEM were assigned to employees based on their history of jobs performed, job duration, and the calendar time period. For work history prior to the first industrial hygiene survey, exposure estimates from the first time period were used. For some employees such as those in the mixers exposure category, the measured personal diacetyl exposure was adjusted for the use of respirators in selected exposure periods (Appendix H).
Problems in the retrospective exposure assess-ment for diacetyl include (1) uncertainty over when diacetyl was introduced and on
the extent of its use as a flavoring component over time (and therefore on employee expo-sure levels), (2) variation in diacetyl content across different product lines over time, (3) the relative presence of diacetyl as a vapor vs. mist, adsorbed to powders or encapsulated, and (4) seasonal variation in the role of natural ventilation. Cumulative exposure and other exposure metrics were calculated starting at the dates when diacetyl was estimated to have first been used in regular production at the four plants: Company K (July 1, 1988), Company L (January 1, 1994), Company G (July 1, 1986), and Company N (July 1, 1986). These dates are uncertain, particularly for Company N.
5.1.3 Work History
The employees studied were current employees at time of survey except at Company G where some former employees were also examined. All results presented are for current employees except at Company G where, due to repeated pulmonary testing over months or years, ini-tially current employees could become former employees at a subsequent survey. Participation was voluntary and generally quite high among current employees (66%–91%) (Table 5-1). Work history was routinely collected in HHEs by employee interview and consisted of
Table 5-4. Exposure categories used for constructing job exposure matrix at Company G
Exposure category Jobs included in exposure category
Warehouse Warehouse Maintenance Maintenance Outside processing/office Outside processing and office Polyethylene line Polyethylene packer and polyethylene stacker Microwave mixing Microwave mixer Microwave packaging line Machine operator, packer, stacker, supervisor, and inventory controlBag print Bag print
Quality control Quality control
110 Occupational Exposure to Diacetyl and 2,3-Pentanedione
5 . Quantitative Risk Assessment Based on Employee Data
successive periods in specific department and job title assignments with corresponding begin-ning and ending dates. Gaps in employment were treated as unexposed and not included in duration-of-exposure measures.
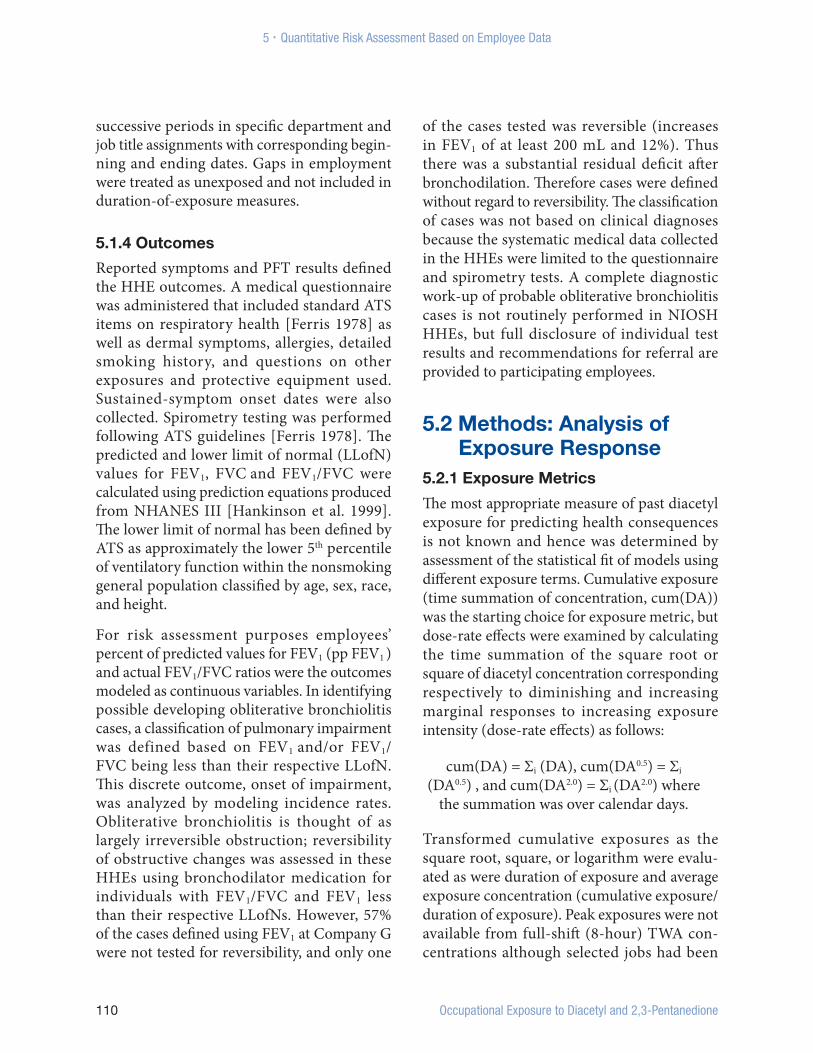
5.1.4 Outcomes
Reported symptoms and PFT results defined the HHE outcomes. A medical questionnaire was administered that included standard ATS items on respiratory health [Ferris 1978] as well as dermal symptoms, allergies, detailed smoking history, and questions on other exposures and protective equipment used. Sustained-symptom onset dates were also collected. Spirometry testing was performed following ATS guidelines [Ferris 1978]. The predicted and lower limit of normal (LLofN) values for FEV1, FVC and FEV1/FVC were calculated using prediction equations produced from NHANES III [Hankinson et al. 1999]. The lower limit of normal has been defined by ATS as approximately the lower 5th percentile of ventilatory function within the nonsmoking general population classified by age, sex, race, and height.
For risk assessment purposes employees’ percent of predicted values for FEV1 (pp FEV1 ) and actual FEV1/FVC ratios were the outcomes modeled as continuous variables. In identifying possible developing obliterative bronchiolitis cases, a classification of pulmonary impairment was defined based on FEV1 and/or FEV1/FVC being less than their respective LLofN. This discrete outcome, onset of impairment, was analyzed by modeling incidence rates. Obliterative bronchiolitis is thought of as largely irreversible obstruction; reversibility of obstructive changes was assessed in these HHEs using bronchodilator medication for individuals with FEV1/FVC and FEV1 less than their respective LLofNs. However, 57% of the cases defined using FEV1 at Company G were not tested for reversibility, and only one
of the cases tested was reversible (increases in FEV1 of at least 200 mL and 12%). Thus there was a substantial residual deficit after bronchodilation. Therefore cases were defined without regard to reversibility. The classification of cases was not based on clinical diagnoses because the systematic medical data collected in the HHEs were limited to the questionnaire and spirometry tests. A complete diagnostic work-up of probable obliterative bronchiolitis cases is not routinely performed in NIOSH HHEs, but full disclosure of individual test results and recommendations for referral are provided to participating employees.
5.2 Methods: Analysis of Exposure Response
5.2.1 Exposure Metrics
The most appropriate measure of past diacetyl exposure for predicting health consequences is not known and hence was determined by assessment of the statistical fit of models using different exposure terms. Cumulative exposure (time summation of concentration, cum(DA)) was the starting choice for exposure metric, but dose-rate effects were examined by calculating the time summation of the square root or square of diacetyl concentration corresponding respectively to diminishing and increasing marginal responses to increasing exposure intensity (dose-rate effects) as follows:
cum(DA) = Σi (DA), cum(DA0.5) = Σi (DA0.5) , and cum(DA2.0) = Σi (DA2.0) where
the summation was over calendar days.
Transformed cumulative exposures as the square root, square, or logarithm were evalu-ated as were duration of exposure and average exposure concentration (cumulative exposure/duration of exposure). Peak exposures were not available from full-shift (8-hour) TWA con-centrations although selected jobs had been
Occupational Exposure to Diacetyl and 2,3-Pentanedione 111
5 . Quantitative Risk Assessment Based on Employee Data
analyzed using a real-time method (FTIR) to assess time-variability.
5.2.2 Models of Percent Predicted FEV1 and FEV1/FVC
The spirometry determinations, (1) ppFEV1 and, (2) FEV1/FVC, were analyzed as continuous outcomes in multiple linear regression models. Terms in the models included gender, ethnicity (Hispanic/Non-Hispanic), race (African American/Other), ever-smoked, pack-years and pack-years squared as of the date of testing. Pack-years squared permits some nonlinearity in the smoking response as might occur with survival or susceptibility effects. Models of FEV1/FVC included age (centered at 40). Known potential confounders were retained in models regardless of statistical significance according to good epidemiologic practice. Models were assessed using overall model R2 as well as the P value for exposure metric terms. In the case of Company G with repeated survey outcomes, the last recorded spirometry was used for analyses unless stated otherwise. In models of ppFEV1, the expected intercept in the absence of exposure or employment selection effects would be 100 (in nonsmokers). Models were fit using PROC REG in SAS 9.2 [SAS Institute Inc. 2008].
To make full use of the serial spirometry determinations at Company G, a longitudinal analysis of ppFEV1 was performed in which exposure metrics were calculated from time of first diacetyl exposure up to the time of each successive spirometry determination. This analysis included employees with two or more spirometry results. All employees were active at their first survey but could have left employment prior to a subsequent survey. These models were fit using PROC MIXED in SAS 9.2 [SAS Institute Inc. 2008] with random effects permitted for individual employee’s intercepts and exposure responses. A second set of metrics was calculated with exposure cumulation
starting at the time of an employee’s first survey and used in a subsidiary longitudinal analysis along with the full cumulative exposure metric. This analysis permitted a test of homogeneity, i.e., (1) for exposure effects before and after the first survey and (2) for possible survivor bias.
Pooled analyses were conducted for two plant populations (Company K, L) with similar reported average exposures and estimated exposure responses. A plant effect was introduced to allow for systematic differences between the two sites, and there was a test of heterogeneity in the exposure effects.
5.2.3 Models of the Incidence of Pulmonary Obstruction
For analyses of onset of discrete adverse effect outcomes, conducted for the Company G population (n=361), three case-definitions of pulmonary impairment were applied:
Definitions 2 and 3 represent definitions more specific to obstruction. For the combined Company K and L populations, the case definition used for determining onset of pulmonary impairment was: FEV1 < LLofN (n=25). The definitions more specific to obstruction produced too few cases for meaningful analysis with the combined Company K and L populations.
In identifying cases, a date of onset for a condition resulting in impairment and possibly representing early obliterative bronchiolitis was estimated as the average of the dates on which the employee reported the start of one or more continuing symptoms (cough, wheezing, shortness of breath, tightness of chest or phlegm, based on questionnaire items),
112 Occupational Exposure to Diacetyl and 2,3-Pentanedione
5 . Quantitative Risk Assessment Based on Employee Data
provided those symptom dates were after their date of first exposure to diacetyl. The average date was chosen over the first date to be more robust for recalled dates. If no symptom date existed, then date of onset was set to the date of the first case-qualifying spirometry result (n=12, case definition 1; n=4, case definition 3 for Company G) unless this was the employee’s first survey in which case the employee was excluded from analysis (n=42, case definition 1; n=21, case definition 3 for Company G). These excluded employees may have had onset of impairment prior to exposure but, according to the participating HHE clinicians, may also have included asymptomatic cases caused by diacetyl exposure with unknown onset date.
The incidence of new cases was modeled using Poisson regression [Checkoway et al. 2004]. This method produces an estimate of the background rate needed for a life-table-based calculation of excess lifetime risk. Observation time was compiled beginning with date first exposed to diacetyl. Models were fit using PROC COUNTREG in SAS 9.2 [SAS Institute Inc. 2008] and model fit assessed with the likelihood ratio test. Employment duration and the other covariates (age, gender, smoking) were included in these models. This design has potential bias leading to underestimated rates arising from the departure of affected employees more often than others with similar exposure from employment. Incident cases are available for analysis only if the individual remains in employment until, and chooses to participate in, a spirometry-medical survey.
5.3 Results: Exposure Response
5.3.1 Cross-Sectional Pulmonary Function Changes
Multiple regression analyses for the Company G population (the largest group, n=361, with
the most extensive exposure assessment) controlling for gender, ethnicity, and smoking, revealed statistically significant declining ppFEV1 for all diacetyl exposure metrics, with Cum(DA) (p=10-6) and (p=4×10⁻⁷) performing considerably better than exposure duration alone, and with average exposure to diacetyl [Avg(DA)] and Cum(DA2.0) performing less well than duration (Table 5-5). The estimate for the exposure-response with Cum(DA) was a 0.50 reduction in ppFEV1 for each ppm-year of cumulative exposure (Tables 5-5, 5-6). (After 1 year at 1 ppm an employee’s ppFEV1, starting at 100, would be predicted to be 99.5.) For FEV1/FVC the percent reduction with 1 ppm-yr DA was 0.16.
Seventy-nine percent of the cross-sectional study population (n=286) had duration of employment of < 4 yr and 49% had less than 6 months, reflecting a high workforce turnover rate. Models restricted to < 4 yr duration produced considerably larger effect estimates; for ppFEV1: −1.07 (vs. −0.50) and for FEV1/FVC: −0.87 (vs. −0.16) (Table 5-5). With < 4 yr, the metric was a less strong predictor than Cum(DA).
In the models with the better predicting exposure metrics, gender and ethnicity (possible indicators of differential healthy employee selection) were unimportant predictors. Ever-smoking was associated with an increase in ppFEV1 but cumulative smoking, in pack-years, predicted a decline in ppFEV1 (implying that, initially, smokers may be healthier than nonsmokers); both effects were statistically significant (Table 5-6). Regression models based on the first Company G spirometry determination rather than the last yielded similar estimates of diacetyl effects (data not shown). The metric cumulative square root of diacetyl concentration was a slightly stronger predictor of spirometry changes than simple cumulative exposure (Table 5-6), implying that if there is any dose-rate effect it is
Occupational Exposure to Diacetyl and 2,3-Pentanedione 113
5 . Quantitative Risk Assessment Based on Employee Data
Table 5-5. Multiple regression models for percent predicted FEV1 and FEV1/FVC: various diacetyl exposure metrics for Company G
Percent predicted FEV1 FEV1/FVC (expressed as percent)
114 Occupational Exposure to Diacetyl and 2,3-Pentanedione
5 . Quantitative Risk Assessment Based on Employee Data
probably negative—higher exposures have less than proportional association with decreases in spirometry. Results for Company N, based on a small number (n=35) of employees and only 20 breathing-zone air samples, are not presented but were generally comparable to Company G results.
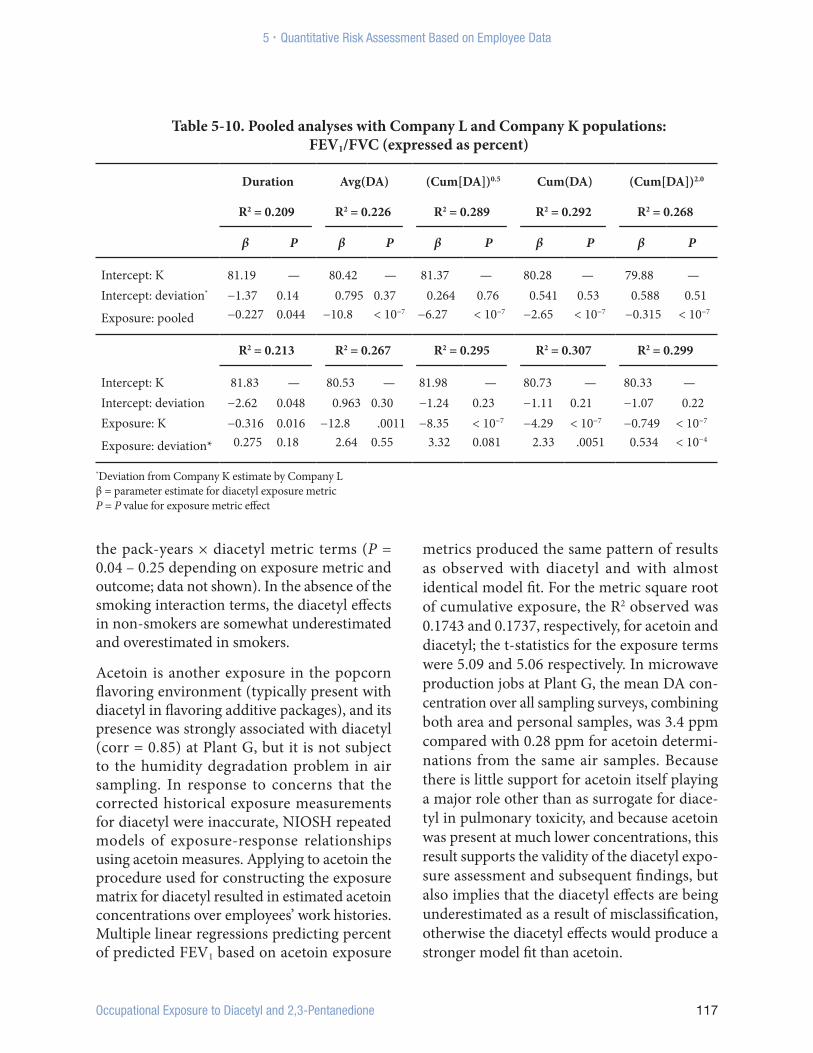
The best-predicting exposure metric depended on the HHE population analyzed (Tables 5-7, 5.8). In predicting FEV1/FVC the R-square values were consistently larger compared with the ppFEV1 regressions but the exposure effects were sometimes less significant. For Company G, Avg(DA) and were the better predictors of FEV1/FVC; for Company K, Cum(DA) was best while for Company L, Avg(DA), and Cum(DA2.0) were all equivalent better predictors. For ppFEV1, model fit at Company K was strongest for (Cum(DA))2.0, however, Cum(DA) provided a similar fit. For Company L, Avg(DA) was the strongest predictor of ppFEV1. In the pooled analysis of the Company K and Company L plants, the differences in exposure response (heterogeneity) between the plants for ppFEV1 and FEV1/FVC were highly significant for the better predicting metrics Cum(DA) and (Cum(DA)2 (Tables 5-9, 5-10). The pooled regression estimate for the Cum(DA) metric corresponded to a decline in ppFEV1 of 4.22 per ppm-yr of cumulative exposure (Table 5-9), almost an order of magnitude higher than the Company G estimated decline in ppFEV1 of 0.50 per ppm-yr of cumulative exposure (Table 5-6) but with very different estimates for the individual plants. For plant K, the estimated fall in ppFEV1 per ppm-yr was 7.83 while for Plant L the decrease in ppFEV1 was 2.70 (= −7.83+5.13) per ppm-yr. At these two plants, many of the environmental samples collected were below the limit of detection for diacetyl, and the HHE environmental assessments were cross-sectional and not necessarily reflective of exposures prior to the survey date. This may
explain the divergence in optimum exposure metrics compared with the Company G results. For example, if jobs with the highest exposures had been given priority for control interventions, then the subsequently measured levels would underestimate most of the jobs previously having the highest levels. Therefore, an exposure metric like Cum(DA2.0), which gives greater weight to high values, might better predict spirometry changes than Cum(DA), as was observed at Company K for ppFEV1 and FEV1/FVC, and at Company L for FEV1/FVC (Table 5-5). Because of the inconsistencies between them and less certain exposure histories, the results for Company K and Company L were not the final basis for the NIOSH risk assessment for diacetyl which, instead, relied on the Company G findings.
By far the highest exposures at Company G were among mixers (Table 5-3) raising the possibility that the observed losses in pulmonary function could be limited to that group. To examine this question, the basic multiple regression models (Table 5-6) were applied to the population at Plant G from which all employees who were ever mixers had been excluded. The result was slightly stronger estimates of the DA effect both for (1) the linear cumulative exposure term (β=0.61 vs. 0.50 for full population; R2=0.182 vs. 0.169, resp.) and (2) the square root of cumulative exposure (β=3.02 vs. 2.75 for full population; R2=0.182 vs. 0.173, respectively) (results not shown).
Another concern was the possibility of a diacetyl-smoking interaction, with smoking possibly enhancing the harmful effect of diacetyl. Models for ppFEV1 and FEV1/FVC including interaction terms (products of the diacetyl exposure metrics with the ever-smoking and pack-yrs terms) yielded statistically significant protective effects of ever-smoking on the linear and square root cumulative diacetyl exposures and small, mostly insignificant, additive interactions for
Occupational Exposure to Diacetyl and 2,3-Pentanedione 115
5 . Quantitative Risk Assessment Based on Employee Data
Tabl
e 5-
7. P
relim
inar
y re
gres
sion
mod
el re
sults
for p
erce
nt p
redi
cted
FEV
1 and
FEV
1/FV
C a
t Com
pani
es K
, L, a
nd G
Dur
atio
nAv
g(D
A)
Cum
(DA
0.5 )
Cum
(DA
)(C
um(D
A))
0.5
% p
red.
FEV
1
Com
pany
nβ
R2P
βR2
Pβ
R2P
βR2
Pβ
R2P
K16
1−0
.31
0.18
90.
20−2
1.7
0.21
70.
01−5
.26
0.30
6<
10−4
−7.7
70.
322
< 10
−7−1
4.3
0.28
610
−6
L21
5−0
.35
0.09
80.
31−1
8.6
0.15
70.
0001
−3.5
70.
135
0.00
18−3
.56
0.13
80.
0012
−9.1
50.
146
0.00
04
G36
1−0
.96
0.16
1<
10−5
−1.7
70.
128
0.02
−0.8
40.
172
< 10
−6−0
.50
0.16
910
−6−2
.77
0.17
4<
10−6
FEV
1/FV
C (e
xpre
ssed
as p
erce
nt)
K16
1−0
.28
0.32
30.
068
−13.
80.
357
0.00
09−2
.99
0.43
0<
10−7
−4.3
00.
449
< 10
−7−8
.24
0.42
0<
10−7
L21
5−0
.069
0.13
90.
70−9
.92
0.22
2<
10−5
−2.1
40.
197
< 10
4−2
.16
0.21
3<
10−5
−5.2
60.
212
< 10
−5
G35
8−0
.26
0.33
30.
035
−1.2
60.
348
0.00
04−0
.26
0.33
90.
0044
−0.1
60.
342
0.00
24−0
.98
0.34
60.
0007
β =
para
met
er es
timat
e for
dia
cety
l exp
osur
e met
ricR2
= R-
squa
red
mea
sure
of m
ultip
le re
gres
sion
mod
el fi
t P
= P
valu
e for
expo
sure
met
ric eff
ect
116 Occupational Exposure to Diacetyl and 2,3-Pentanedione
5 . Quantitative Risk Assessment Based on Employee Data
Table 5-8. Preliminary regression model results for percent predicted FEV1 and FEV1/FVC with quadratic exposure metrics at Companies K, L, and G
*Deviation from Company K estimate by Company Lβ = parameter estimate for diacetyl exposure metricP = P value for exposure metric effect
Occupational Exposure to Diacetyl and 2,3-Pentanedione 117
5 . Quantitative Risk Assessment Based on Employee Data
the pack-years × diacetyl metric terms (P = 0.04 – 0.25 depending on exposure metric and outcome; data not shown). In the absence of the smoking interaction terms, the diacetyl effects in non-smokers are somewhat underestimated and overestimated in smokers.
Acetoin is another exposure in the popcorn flavoring environment (typically present with diacetyl in flavoring additive packages), and its presence was strongly associated with diacetyl (corr = 0.85) at Plant G, but it is not subject to the humidity degradation problem in air sampling. In response to concerns that the corrected historical exposure measurements for diacetyl were inaccurate, NIOSH repeated models of exposure-response relationships using acetoin measures. Applying to acetoin the procedure used for constructing the exposure matrix for diacetyl resulted in estimated acetoin concentrations over employees’ work histories. Multiple linear regressions predicting percent of predicted FEV1 based on acetoin exposure
metrics produced the same pattern of results as observed with diacetyl and with almost identical model fit. For the metric square root of cumulative exposure, the R2 observed was 0.1743 and 0.1737, respectively, for acetoin and diacetyl; the t-statistics for the exposure terms were 5.09 and 5.06 respectively. In microwave production jobs at Plant G, the mean DA con-centration over all sampling surveys, combining both area and personal samples, was 3.4 ppm compared with 0.28 ppm for acetoin determi-nations from the same air samples. Because there is little support for acetoin itself playing a major role other than as surrogate for diace-tyl in pulmonary toxicity, and because acetoin was present at much lower concentrations, this result supports the validity of the diacetyl expo-sure assessment and subsequent findings, but also implies that the diacetyl effects are being underestimated as a result of misclassification, otherwise the diacetyl effects would produce a stronger model fit than acetoin.
Table 5-10. Pooled analyses with Company L and Company K populations: FEV1/FVC (expressed as percent)
*Deviation from Company K estimate by Company Lβ = parameter estimate for diacetyl exposure metricP = P value for exposure metric effect
118 Occupational Exposure to Diacetyl and 2,3-Pentanedione
5 . Quantitative Risk Assessment Based on Employee Data
5.3.2 Longitudinal Analyses of ppFEV1 at Company G
Longitudinal mixed effect models of ppFEV1 (where individual intercepts and responses are treated as random effects) show smaller effects for both Cum(DA) and exposure metrics (Table 5-11, models 1 and 2) compared to the analyses based on the FEV1 at last survey (Tables 5-7, 5-8); the effects remain statistically significant. Differences in the effects of employees’ exposures accruing from their initial evaluation (their first survey) until the current survey, compared to all exposures prior to the current survey, using either the metric Cum(DA) or , were small and not statistically significant (P > 0.7) (Table 5-11, models 3 and 4). This supports the conclusion that bias arising from cases preferentially leaving employment prior to the first survey is not different from that following the first survey when exposures were declining, suggesting that the bias in estimating the decline in ppFEV1 is not large.
5.3.3 Incidence of Pulmonary Impairment at Company G
Poisson regression analysis with the log-linear specification was applied to model incidence rates adjusted for gender, age, and smoking (race and ethnicity were not important predic-tors). The original sentinel cases of obliterative bronchiolitis reported from this plant were not present in this study population. For the first definition of case (FEV1< LLofN, n=36), exclud-ing (a) candidate cases for which no qualifying date of onset was available and (b) subjects with missing smoking data, left 314 subjects for analysis. Increasing duration of exposure or diacetyl cumulative exposure (Cum(DA)) both predicted diminishing onset (Table 5-12, models 1 and 2). Model fit improved with both terms in the model but the duration effect remained negative. Other diacetyl metrics per-formed similarly (Table 5-12) with avg(DA) and
cum(DA) providing the best fit (largest Δ-2lnL, smallest LRT P value). The negative duration term implies diminishing background rate with increasing duration.
Using case definition 2, (FEV1/FVC< LLofN, n=27) the same pattern was observed, with the negative duration effect (P=0.0004) and positive cumulative exposure effect (P=.00003) now highly statistically significant despite a smaller number of cases (Table 5-13, model 3). With the most stringent case definition 3, (FEV1< LLofN and FEV1/FVC< LLofN), the negative duration effect (P=0.023) and the cumulative exposure effect (P=.016) remained statistically significant now with 19 cases (Table 5-14, model 3). In this model, smoking effects were not statistically significant, and age and sex were marginally significant (Table 5-15). Three other metrics yielded strong associations based on likelihood ratio test, particularly
and (Avg(DA)) (both P=.003) although with average exposure, duration was no longer significant (Table 5-14).
5.3.4 Evidence of Variable Susceptibility to Diacetyl Effects
When the joint distribution of cases by exposure duration and cumulative exposure was examined (case definition 1; all jobs had exposures > 0.0), the pattern suggested the possible presence of a low-risk survivor population or variable susceptibility. For example, there were five cases in the cell with lowest duration and lowest exposure and another five cases in a different cell with comparable person-years of observation (89 years) in the highest exposure category and 2 to 4 years duration (Tables 5-16, 5-17). Thus similar rates were observed despite the greater than tenfold difference in cumulative exposure. Of the 36 cases, 22 occurred in the first 4 years of exposed employment, which encompassed about 80% of the study population. The rapid onset of this disease has been reported
Occupational Exposure to Diacetyl and 2,3-Pentanedione 119
5 . Quantitative Risk Assessment Based on Employee Data
Table 5-11. Longitudinal analyses of percent predicted FEV1 at Company G using random effects models
Random: ID Random: ID, DA-effect
Model no. β t P β t P
1 Cum(DA) −0.438 −4.49 0.0001 −0.427 −2.90 0.016
2 Cum(DA)0.5 −1.82 −3.35 0.007 −1.99 −3.07 0.012
3 Cum(DA) −0.436 −4.23 0.002 −0.437 −4.25 0.002Cum(DA) since first survey −0.0309 −0.07 0.95 −0.110 −0.18 0.86
4 Cum(DA)0.5 −2.59 −4.82 0.0007 −2.60 −4.83 0.0007Cum(DA)0.5 since first survey 0.718 0.37 0.71 0.766 0.34 0.74
Note: Cum(DA) is calculated up to each survey of an employee (two or more are in the analysis). Cum(DA) since first survey is calculated from an employee’s first survey up to each subsequent survey.
β = parameter estimate for diacetyl exposure metric t = t-statistic for exposure metric effectP = P value for exposure metric effect
Table 5-12. Company G incidence rate models: exposure metrics (case definition 1: FEV1 < LLofN; n=36)
— indicates no person-time in stratumBased on Table 5-12, model 3
[Akpinar-Elci et al. 2004; CDC 2007; Israel et al. 2009; Kreiss et al. 2002; NIOSH 2006, 2008]. Examination of onset graphically (data not shown) also suggested that many cases arose after relatively short employment duration. A similar pattern was exhibited in the 46 cases (defn 1) identified among former employees (no longer employed at the time of their first survey) (data not shown). The predicted baseline incidence (from the model with diacetyl exposure set = 0) in the same array (Table 5-18) has an elevated level in the early years of employment, falling from 0.061 (6.1% per year) in the first 6 months, to 0.022 (2.2% per year) after 4 years. Dividing the model-predicted total rate by a fixed baseline rate of 0.022 yields a rate ratio that appears to be systematically elevated at < 4 years vs. >= 4 years durations of exposure (employment after 1986) and at high cumulative exposures (Table 5-19). The same situation was observed in the pooled Company K and Company L populations using the first case definition. Out of 25 cases, 20 occur in the < 4 yr duration strata (Table 5-20), with elevated rate ratios predicted for low durations and high exposures
(Table 5-21). With the third case definition in the Company G population, the same pattern is observed but now with fewer cases (n=19 vs. 36) and 9 out of 19 in the < 4 yr duration group (Table 5-22). The predicted rate ratios relative to the long-duration baseline rate are again elevated at both low duration and high cumulative exposures (Table 5-23).
In the loglinear Poisson regression models using a (negative) duration term, the excess cases at short duration are actually being treated as part of the background rate, i.e., not attributable to diacetyl exposure. On the suspicion that susceptibility was declining with duration because low-risk individuals are remaining longer in employment, a different Poisson regression model was fit. Using a linear relative rate specification, this model included a term intended to capture excess risk arising from diacetyl exposures (1) in an unknown portion of the population declining with time that has higher susceptibility or (2) due to individual susceptibility declining with duration of exposure. An exponential decline was assumed and halflives of 0.5, 1, and 2 years were evaluated. Using case definition 3, a model
Occupational Exposure to Diacetyl and 2,3-Pentanedione 123
5 . Quantitative Risk Assessment Based on Employee Data
Table 5-19. Company G: rate ratio (case definition 1: FEV1 < LLofN) by duration and cumulative diacetyl
Predicted rate ratio (relative to fixed baseline: 0.022) cumulative diacetyl exposure (ppm-yrs)
Occupational Exposure to Diacetyl and 2,3-Pentanedione 125
5 . Quantitative Risk Assessment Based on Employee Data
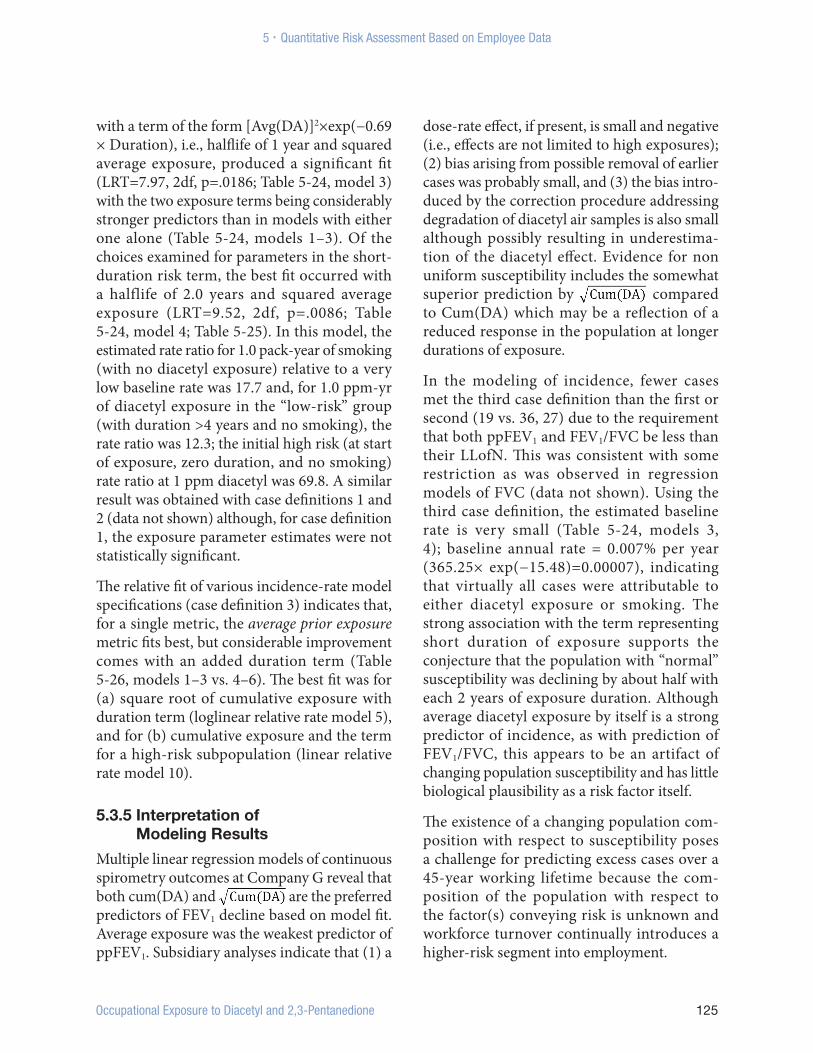
with a term of the form [Avg(DA)]2×exp(−0.69 × Duration), i.e., halflife of 1 year and squared average exposure, produced a significant fit (LRT=7.97, 2df, p=.0186; Table 5-24, model 3) with the two exposure terms being considerably stronger predictors than in models with either one alone (Table 5-24, models 1–3). Of the choices examined for parameters in the short-duration risk term, the best fit occurred with a halflife of 2.0 years and squared average exposure (LRT=9.52, 2df, p=.0086; Table 5-24, model 4; Table 5-25). In this model, the estimated rate ratio for 1.0 pack-year of smoking (with no diacetyl exposure) relative to a very low baseline rate was 17.7 and, for 1.0 ppm-yr of diacetyl exposure in the “low-risk” group (with duration >4 years and no smoking), the rate ratio was 12.3; the initial high risk (at start of exposure, zero duration, and no smoking) rate ratio at 1 ppm diacetyl was 69.8. A similar result was obtained with case definitions 1 and 2 (data not shown) although, for case definition 1, the exposure parameter estimates were not statistically significant.
The relative fit of various incidence-rate model specifications (case definition 3) indicates that, for a single metric, the average prior exposure metric fits best, but considerable improvement comes with an added duration term (Table 5-26, models 1–3 vs. 4–6). The best fit was for (a) square root of cumulative exposure with duration term (loglinear relative rate model 5), and for (b) cumulative exposure and the term for a high-risk subpopulation (linear relative rate model 10).
5.3.5 Interpretation of Modeling Results
Multiple linear regression models of continuous spirometry outcomes at Company G reveal that both cum(DA) and are the preferred predictors of FEV1 decline based on model fit. Average exposure was the weakest predictor of ppFEV1. Subsidiary analyses indicate that (1) a
dose-rate effect, if present, is small and negative (i.e., effects are not limited to high exposures); (2) bias arising from possible removal of earlier cases was probably small, and (3) the bias intro-duced by the correction procedure addressing degradation of diacetyl air samples is also small although possibly resulting in underestima-tion of the diacetyl effect. Evidence for non uniform susceptibility includes the somewhat superior prediction by compared to Cum(DA) which may be a reflection of a reduced response in the population at longer durations of exposure.
In the modeling of incidence, fewer cases met the third case definition than the first or second (19 vs. 36, 27) due to the requirement that both ppFEV1 and FEV1/FVC be less than their LLofN. This was consistent with some restriction as was observed in regression models of FVC (data not shown). Using the third case definition, the estimated baseline rate is very small (Table 5-24, models 3, 4); baseline annual rate = 0.007% per year (365.25× exp(−15.48)=0.00007), indicating that virtually all cases were attributable to either diacetyl exposure or smoking. The strong association with the term representing short duration of exposure supports the conjecture that the population with “normal” susceptibility was declining by about half with each 2 years of exposure duration. Although average diacetyl exposure by itself is a strong predictor of incidence, as with prediction of FEV1/FVC, this appears to be an artifact of changing population susceptibility and has little biological plausibility as a risk factor itself.
The existence of a changing population com-position with respect to susceptibility poses a challenge for predicting excess cases over a 45-year working lifetime because the com-position of the population with respect to the factor(s) conveying risk is unknown and workforce turnover continually introduces a higher-risk segment into employment.
126 Occupational Exposure to Diacetyl and 2,3-Pentanedione
5 . Quantitative Risk Assessment Based on Employee Data
Table 5-24. Incidence rate models using linear relative rate model with term for transient high-risk group (shortdur(DA)) at Company G (case definition 3: FEV1 < LLofN and FEV1/FVC < LLofN)
Occupational Exposure to Diacetyl and 2,3-Pentanedione 127
5 . Quantitative Risk Assessment Based on Employee Data
Table 5-25. Likelihood ratio tests and P values for choices of constants defining shortdur(DA) variable at Company G (case definition 3: FEV1 < LLofN and FEV1/FVC < LLofN)
LRT for cum(DA) and shortdur(DA) terms (p)
Half-life, b
1.0 2.0
Avg(DA) 5.93 (0.052) 6.37 (0.019)
(Avg(DA))2.0 7.97 (0.019) 9.52 (0.0086)
LRT = likelihood ratio test, 2df shortdur(DA) = (Avg Exp) a × e−0.693dur/b
Table 5-26. Relative fit of selected model specifications for incidence rate (case definition 3: FEV1 < LLofN and FEV1/FVC < LLofN)
Smaller deviance = better fit shortdur(DA) ~ [DA]2exp(−0.693dur/2) – for half-life = 2.0 yr
128 Occupational Exposure to Diacetyl and 2,3-Pentanedione
5 . Quantitative Risk Assessment Based on Employee Data
In a population with relatively uniform response to diacetyl exposure (uniform susceptibility), the early new cases resulting from diacetyl exposure would in general constitute individuals who were already very close to their LLofN. For a given age and height, this subpopulation is proportional to the height of the FEV1 distribution at the LLofN (Figure 5.1). With increasing cumulative exposure the FEV1 distribution would be shifted toward lower values and the segment at immediate risk of falling below the LLofN would be increasing as long as the mean (mode or peak) of the shifted distribution remains above LLofN. This is not what was observed; initially the rate of new cases is generally larger and declines with increasing duration or cumulative exposure (Tables 5-19, 5-21), implying variable susceptibility, i.e., most individuals in the
exposed population are losing FEV1 much faster than those with longer duration of exposure.
5.4 Human Data-based Assessment of Risks
Using the impairment findings from Company G NIOSH employed two approaches for assess-ing risk of diacetyl exposures. The first was the benchmark dose procedure, which is appropri-ate for cross-sectional population surveys with continuous health outcomes, and the second was calculation of excess lifetime risk, a life-table procedure which accounts for competing risks using a model for the rate of onset of a discrete outcome. In these calculations, three risk esti-mates were derived: for a life-time exposure (45 yr) and also for 2.5- and 10-year exposures
Figure 5-1. New cases expected from a hypothetical population with uniform susceptibility to diminishing percent predicted FEV1 with increasing cumulative exposure to diacetyl
Cumulative DA (ppm-yr)
Popu
latio
n de
nsity
40 60 80 100 120
0.0
0.01
0.02
0.03
0 ppm-yr5 ppm-yr10 ppm-yr15 ppm-yr20 ppm-yr
Lower limit of normal
New cases: 0–5 ppm-yr
New cases: 10–15 ppm-yr
Occupational Exposure to Diacetyl and 2,3-Pentanedione 129
5 . Quantitative Risk Assessment Based on Employee Data
(more typical employment durations and implying a larger workforce ever exposed). The nominal standard for acceptable risk used was one per thousand excess risk of impairment, a standard choice used in OSHA regulation for chronic diseases.
5.4.1 Benchmark Dose
5.4.1.1 Methods
For continuously distributed respiratory endpoints such as FEV1, the benchmark dose approach permits estimation of excess prevalence of impairment as a function of prior exposure history [Bailer et al. 1997; Clewell et al. 2003; Crump 1995; Park et al. 2006]. On the basis of regression models and population data on the distribution of FEV1 from NHANES III [CDC and NCHS 2011], the proportions of the workforce predicted to be impaired after working at specified exposure levels can be calculated. Unlike animal-based studies where exposures are in discrete levels, the analyses here utilized continuously distributed exposure metrics and a linear statistical model which made unnecessary the point-of-departure procedure commonly used in benchmark dose calculations. This method, however, does require specification of what degree of deficit constitutes impairment and the maximum increase in impairment prevalence that is considered acceptable, which are policy choices. The exposure resulting in a maximum allowable increase in impairment over some time period is called the benchmark dose (BMD).
5.4.1.2 Risk assessment with percent predicted FEV1 and FEV1/FVC
With the conventional benchmark dose procedure, the excess prevalence of an adverse condition is calculated using an exposure-response relationship derived from modeling. With the linear regression result for percent predicted FEV1 and Cum(DA) (coef.=−0.50, Table 5-6), the excess prevalence after 2.5, 10, or
45 years of exposure for falling below (1) 60% of predicted, or (2) the 5th percentile of normal, was calculated as a function of exposure level (Table 5-27). Given these two pulmonary impairments, a 1/1000 excess prevalence after 45 years was found for diacetyl exposures (BMDs, central tendency estimates) of about 0.04, and 0.007 ppm diacetyl, respectively. Using the exposure metric, , which better predicts ppFEV1 in the full population, substantially lower BMDs result (data not shown); 1/1000 excess risk for impairment at the 5th percentile after 45 years occurs with a diacetyl exposure concentration of less than 0.0001 ppm vs. 0.007 with the Cum(DA) metric (Table 5-27). These lower BMDs result from the increasing (negative) slope of the exposure response with diminishing exposure metric. Although better captures the risk of initially employed employees, extrapolation to decreasing durations with this nonlinear metric could introduce considerable error. For this reason NIOSH chose Cum(DA) over
as the basis for risk assessment using the BMD procedure. In addition, to address the same issue for early exposures, the BMD was also calculated based on results from the < 4 yr population (Table 5-28) but also for a 45 yr. working lifetime. The resulting excess prevalence estimates were about double those based on the full population.
For impairment defined in relation to LLofN as opposed to some fixed threshold such as the 5th percentile of ppFEV1, the BMD proce-dure is less direct because LLofN is specific to age, height, gender and race. The distribution of various functions of FEV1 and LLofN, such as FEV1/LLofN or (FEV1– LLofN)/(ppFEV1 – LLofN) are not readily specifiable. An alternate approach was taken: in the NHANES popula-tion [CDC and NCHS 2011], the cumulative exposure (Cum(DA)) that would reduce an individual’s FEV1 to their LLofN was calculated using the exposure-response estimates from the
130 Occupational Exposure to Diacetyl and 2,3-Pentanedione
5 . Quantitative Risk Assessment Based on Employee Data
preferred regression models of ppFEV1 (coef.=-0.50, -1.07 (< 4 yr); Table 5-6). The prevalence of individuals predicted to be below their LLofN was then calculated in the NHANES III population as a function of exposure over 2.5, 10 or 45 years. This “empirical” BMD procedure (using the empirical, nonparametric distri-bution of the NHANES population) yielded BMDs for both FEV1 and FEV1/FVC for the full population and for < 4 yr (Table 5-29). For FEV1 below the LLofN (FEV1) the BMD values were similar to those calculated the traditional way for ppFEV1 in relation to impairment at the 5th percentile of normal; the excess prevalence
after 45 years at 0.01 ppm diacetyl was 2.5/1000 and 1.5/1000, respectively (Tables 5-27, 5-29). BMDs for FEV1/FVC below the LLofN (FEV1/FVC) were comparable to those for FEV1 (Table 5-29). In the pooled Company K and Company L population, where reported exposures were lower than at Company G, the estimated 1/1000 BMDs for 45 yr were much lower: for FEV1, 0.0005 ppm and FEV1/FVC, 0.0004 ppm (Table 5-30). Using the less satisfactory, average exposure, Avg(DA), as the predicting metric in the Company G population, the excess preva-lence was estimated to be considerably lower (Table 5-31), and of course, did not depend on
Table 5-27. Benchmark dose, based on exposure response with cum(DA) for full population at Company G
Baseline prevalence for < 60% of predicated = 0.0053, for <5th percentile = 0.0498
Occupational Exposure to Diacetyl and 2,3-Pentanedione 131
5 . Quantitative Risk Assessment Based on Employee Data
duration of work. The 1/1000 BMD for FEV1, was correspondingly higher: 0.05 ppm diacetyl.
5.4.2 Excess Lifetime Risk for Pulmonary Impairment
5.4.2.1 Methods
Using the life-table approach as implemented in the Biological Effects of Ionizing Radiation IV report [Committee on the Biological Effects of Ionizing Radiation 1988] together with the observed exposure-response relationship from models of incidence rate, one can estimate the excess numbers of cases of diacetyl-associated
impairment that would occur as a result of lifetime exposures at various concentrations. This method assumes irreversibility and removes incident cases from the population at risk with increasing age along with deaths arising from the usual causes in the general population. Although typical applications of the excess lifetime risk calculation are for deaths arising from chronic diseases, the method can be applied to incidence of an irreversible condition provided a baseline incidence rate for the condition is known and an estimate of the exposure-related incidence rate ratio is available. In this analysis, Poisson regression
Table 5-28. Benchmark dose, based on exposure response with cum(DA) for duration less than 4 yrs at Company G
Baseline prevalence for < 60% of predicated = 0.0055, for <5th percentile = 0.0500
132 Occupational Exposure to Diacetyl and 2,3-Pentanedione
5 . Quantitative Risk Assessment Based on Employee Data
models formed the basis of the calculation (Table 5-24, model 4, and the related model without terms for smoking), with the model intercept describing the baseline risk.
5.4.2.2 Risk assessment: excess lifetime risk
A national life-table constructed from Social Security data [SSA 2005] was used. The surviving population (living but not yet a case) was calculated annually assuming exposure starts at age 20 and ceases at age 65, for a 45-yr exposure. For 2.5 and 10 years of exposure, the life-table exposures start at age 20. Because
smoking information was used in modeling, several variants for lifetime risk are presented (Table 5-32). For example, at 0.01 ppm diacetyl, using an incidence rate model (case definition 3) that ignores smoking determinants, the excess lifetime risk (analogous to excess prevalence in the BMD approach) was 3.2/1000. With the model that includes smoking determinants, the excess lifetime risk at 0.01 ppm diacetyl for nonsmokers was 11.2/1000, while for smokers (one pack/day) it was 2.2/1000. Smokers have a smaller lifetime risk because (1) smoking reduces the amount of additional impairment caused by diacetyl over and above that caused by smoking, (2) smoking is a strong competing
Table 5-29. Empirical benchmark dose, FEV1 and FEV1/FVC based on exposure response with cum(DA) for all employees and for those < 4 yr duration, at Company G
Empirical BMD Excess prevalence < lower limit of normal (per thousand)
FEV1 all FEV1 duration < 4 yr FEV1/FVC allFEV1/FVC
duration < 4 yr
DA ppm 2.5 yr 10 yr 45 yr 2.5 yr 10 yr 45 yr 2.5 yr 10 yr 45 yr 2.5 yr 10 yr 45 yr
134 Occupational Exposure to Diacetyl and 2,3-Pentanedione
5 . Quantitative Risk Assessment Based on Employee Data
cause for becoming a case, and, (3) smoking was assumed to continue after age 65.
A number of investigations have observed that declining pulmonary function is a risk factor for mortality independent of other pos-sibly associated risk factors such as age, sex, smoking, and body mass index – BMI. Three such studies investigated rate of decline in pulmonary function as a predictor of mortal-ity [Mannino and Davis 2006; Mannino et al. 2006; Rodriguez et al. 1994] and five others pre-dicted mortality using current FEV1 [Bang et al. 1993; Hole et al. 1996; Ryan et al. 1999; Sabia et al. 2010; Schunemann et al. 2000; Sin et al. 2005]. Three studies provide estimates of rate
ratios (RRs) that can be applied to a life-table analysis of excess lifetime risk [Bang et al. 1993; Ryan et al. 1999; Schunemann et al. 2000]. The estimates range from 1.010 to 1.019 per percent decline in FEV1 in men, and from 1.01 to 1.025 in women. Assuming a RR of 1.015 per percent decline in FEV1, and using the exposure response for FEV1 from the full population and from the < 4 yr group, a life-table analysis pro-duced estimates of excess lifetime risk (Table 5-33) that were comparable (fortuitously) to those based on the incidence of pulmonary impairment, e.g., FEV1 falling below LLofN (Table 5-32). These estimates of excess mortal-ity are the result of a generic effect of declining FEV1 on mortality not specific to obliterative
Table 5-32. Excess lifetime risk based on incidence rate model (case definition 3) with term for short duration group at Company G
case definition 3: FEV1 < LLof N and FEV1/FVC < LLof NModel a: no smoking terms in model of case incidence (Table 5-24, model 4)Model b: smoking terms in model of case incidence (Table 5-24, model 4) but risk calculated separately for nonsmokers and
smokers: 1 pack/day
Occupational Exposure to Diacetyl and 2,3-Pentanedione 135
5 . Quantitative Risk Assessment Based on Employee Data
bronchiolitis. This generic effect would not adequately predict mortality proceeding from advancing obliterative bronchiolitis disease itself with high exposures to diacetyl.
5.5 Sensitivity Analyses and Alternate Hypotheses
NIOSH conducted sensitivity analyses to the impact of various parameters, variables and assumptions on risk estimates. NIOSH evalu-ated many different statistical models and procedures using continuous and discrete outcomes based on different definitions of impairment, different exposure metrics, and data from different plants. For Company G, the risk estimates are similar for the different modeling approaches and the diacetyl levels
estimated for a given level of lifetime preva-lence or risk are generally pretty close, within an order of magnitude.
Models where percent predicted FEV1 or FEV1/FVC were used as the response to occupational diacetyl exposure showed declines in pulmonary function with increasing exposure, no matter which exposure metric was used. Similarly, when models looking at the incidence rate of pulmonary impairment, defined three different ways, were compared, the same pattern was observed revealing an unexpected elevation of effect in the low duration group compared to long durations. Exposures in mixers by themselves were shown not to account for the declining respiratory measures in the Company G population, and smoking did not exacerbate the diacetyl effects (actually
Table 5-33. Excess lifetime risk of mortality due to FEV1 deficit arising from 45 yrs diacetyl exposure
Based on multiple regression model of fall in percent predicted FEV1 with diacetyl ex-posure (0.5% per ppm-yr diacetyl) and on published estimates of all-cause mortality dependence on FEV1 after controlling for age, sex, BMI, smoking, and various car-diovascular risk factors (1.5% increase in mortality rate per 1% decline in FEV1)
136 Occupational Exposure to Diacetyl and 2,3-Pentanedione
5 . Quantitative Risk Assessment Based on Employee Data
was protective). Alternate formulations such as for dose-rate, comparing exposure effects pre- and post-first survey, comparing prediction based on diacetyl vs. acetoin, a surrogate for diacetyl, all supported the final choices utilized in the risk assessment.
On the question of exposure uncertainties prior to the NIOSH surveys, particularly the date when widespread diacetyl exposures commenced at Company G, analyses specify-ing different years for the start of exposures suggested that the optimum starting year was about 1994 instead of 1986, but this assump-tion had only a small impact on the estimated exposure response because most employees surveyed were hired after 1994.
In constructing the exposure matrix for the plants studied, the decision was made not to apply the humidity correction for air samples below the LOD. To determine if this choice affected the analytical results, analyses were repeated having applied the correction to all air samples. The resulting difference in parameter estimate for the model of percent predicted FEV1 with the cumulative exposure term was very small: −0.500 vs. −0.499. For the metric, square root of cumulative exposure, the parameter estimate is slightly larger when samples < LOD are corrected: −2.77 (uncorrected) vs. −2.82 (corrected). For the models of FEV1/FVC there was no change. Therefore there was no impact on risk estimates which were based on these parameter estimates.
Several alternate explanations were considered for the apparent variability in susceptibility:
(1) The proportion of Hispanic employees was higher among the short duration cases: Hispanics also comprised a higher proportion among recent hires and the cross-sectional surveys tended to reflect more recent employees due to high turnover.
(2) Bias from candidate cases lacking styptom onset: using the date of their first qualifying spirometry would tend to increase rather than decrease the estimate of duration of exposure until onset and thus would not account for the short-duration cases.
(3) Recall bias on symptom onset: employees with fast onset probably estimated symptom onset in relation to hire date, which is gen-erally precisely known, not in relation to survey date. For example, an employee with 3 years employment probably would recall that symptoms began after about 6 months on the job, not 2.5 years ago.
(4) Jobs with peak exposures would favor an early onset: this would happen only if the cumulative exposure metric was underes-timating the relevant exposure. This could occur with a positive dose-rate effect, but what was observed was, if anything, a negative dose-rate effect (Table 5-5) where summing the square root of air concentra-tions over time was a much better predictor than summing the square of concentra-tions. Serious exposure misclassification could cause a pattern indistinguishable from variable susceptibility; employees whose exposures were substantially under-estimated would appear to respond more strongly (faster) with adverse health effects and conversely for employees whose expo-sures are overestimated. However, the “high risk” cases were not largely associated with specific job groups such as mixers or quality control; many came from the general pro-duction line, and excluding mixers did not reduce affect estimates. Undoubtedly misclassification was present but a system-atic discrepancy in risk by a factor of 10, as observed between the short and long duration groups and others arising from misclassification is implausible.
In summary, these sensitivity analyses substantiated the parameters, variables, and
Occupational Exposure to Diacetyl and 2,3-Pentanedione 137
5 . Quantitative Risk Assessment Based on Employee Data
assumptions used in the final risk assessment and provide confidence in the risk estimates.
5.6 DiscussionThe NIOSH HHE investigations in popcorn manufacturing were not specifically designed for quantitative risk assessment and have limitations in terms of unknown selection of study subjects and limited historical exposure information. Nonetheless, these observations of diacetyl-exposed employees have proved useful for risk assessment. The likelihood that the Company G population represents a survivor cohort together with the relatively high participation rate implies that underestimation of effects has probably resulted. Further underestimation has resulted from exclusion of asymptomatic cases in the analyses of incidence. Acting against bias from selection of a surviving population and missing cases is the possibility that participants may have included a more than representative proportion of cases. However, the high participation rate (~80%) limits this potential participation bias.
The exposure metric, average exposure, which is simply the cumulative exposure divided by duration of exposure (employment duration since start of diacetyl use) was a strong predictor of pulmonary impairment in some analyses. It is implausible that average exposure, in a homogeneous population, would predict impairment without consideration of duration. Rather, a more credible explanation for the association of impairment with average exposure is the changing composition of the population over time since exposures began. The more responsive individuals leaving the population sooner than others would diminish the apparent importance of cumulative exposure. Thus average exposure might predict impairment, but it could be very population-specific depending on duration of observation and how the particular plant
population changed over time, and would not be a generalizable exposure response. For this reason average exposure was not utilized in the risk assessment procedures.
Appropriate in the risk assessment and development of the REL for diacetyl is consideration that the health effects should be viewed in the complementary contexts of an individual employee’s risk of impairment which is the clinician’s measure of impact, and the risk incurred by the population of employees with diacetyl exposure. The American Thoracic Society, in a statement on the effects of air pollution, concluded that shifts in the respiratory health of a population, resulting from some exposure, that diminish individual reserve function, are adverse “even in the absence of the immediate occurrence of frank illness” [ATS 2000]. In the clinical context, if an employee’s FEV1/FVC is less than 0.7 (or FEV1 less than or equal to 80%), that would be considered mild COPD [GOLD 2011]. Similarly, if diacetyl exposure decreases the mean pulmonary function of the exposed population by some small increment, this too could be considered an adverse event [ATS 2000].
The health significance of small spirometry changes, such as a 1% decline in FEV1 after 2 years of exposure at 1 ppm diacetyl, depends partly on whether such changes are early indications of lung pathology that eventually would manifest as obliterative bronchiolitis. In studies of obliterative bronchiolitis arising from lung transplantation, unrelenting irreversible FEV1 decrements are observed that ultimately lead to the diagnosis of obliterative bronchiolitis and fatal disease [Heng et al. 1998]. However, incomplete knowledge concerning the natural history of obliterative bronchiolitis development with diacetyl exposure is a limitation in the present risk assessment. Not only is risk for mortality increased, as estimated in this risk assessment,
138 Occupational Exposure to Diacetyl and 2,3-Pentanedione
5 . Quantitative Risk Assessment Based on Employee Data
quality of life is degraded [Ferrer et al. 2002] and risk is increased for cardiovascular disease and progressive respiratory disease [Cullen et al. 1983; Ebi-Kryston et al. 1989; Knuiman et al. 1999; Kuller et al. 1989; Schroeder et al. 2003; Wise 2006]. The decrease in FEV1 predicted after working for 10 years in diacetyl exposures of 0.2 ppm (about 1% loss) is comparable to changes observed in children, a more vulnerable population, exposed to levels of air pollution that lead to clinical impairment in later life [Gauderman et al. 2004].
Variation in susceptibility poses issues for risk assessment. If less-susceptible individuals are remaining in employment longer, the estimated exposure response for long durations when applied to a hypothetical population of 1,000 employees employed 45 years, will generate excess risk values that understate the true risk of a workforce that turns over more often.
All of the risk assessment procedures used here assume some degree of low-dose linearity, with effects diminishing proportionally with decreasing exposure levels that are held constant over 10 or 45 years. Model linearity was observed particularly after limiting the population to < 4 yr duration. Moreover a significant fraction of career-average exposures fell below 0.01 ppm (17% of employees) a factor of only 2.0 higher than the proposed REL. Thus low-dose extrapolation was limited. Below 0.01 ppm, there can be some significant departure
from linearity although diversity in response would tend to favor linearity to lower levels [Clewell and Crump 2005; National Research Council 2009].
5.7 Conclusion Excess prevalence (BMD) and lifetime risk estimates variously derived for 45 years of diacetyl exposure were similar, based on Company G analyses (Table 5-34). Impairment has been defined here as pulmonary function falling below the lower limit of normal. The BMD estimates for excess prevalence of FEV1
impairment are within a factor of 2.0 of the life-table estimates of excess lifetime risk (1) using case definitions 2 and 3 (ignoring smoking) and (2) for excess mortality. Excess risk of 1/1,000 corresponds to approximately 0.001–0.005 ppm diacetyl (3.5-17.5 µg/m3) in the full Company G population. NIOSH has selected Company G risk estimates as the basis for a recommended REL because Company G had the most extensive and representative diacetyl exposure data and largest body of respiratory outcomes data. In the pooled Company K-L population, determined by NIOSH to be a less adequate basis for risk assessment, the benchmark dose analysis for 1/1,000 excess risk corresponds to approximately 0.0004–0.0005 ppm diacetyl. Diacetyl exposures predicted to result in various levels of risk are displayed in Table 5-35.
Occupational Exposure to Diacetyl and 2,3-Pentanedione 139
5 . Quantitative Risk Assessment Based on Employee Data
Table 5-34. Risk assessment synthesis: excess prevalence or lifetime risk (per thousand) for 45-yr exposure to diacetyl
Diacetyl ppm
Method
BMD—Excess prevalence of impairment (per thousand)
case definition 2: FEV1/FVC < LLofN case definition 3: FEV1 < LLofN and FEV1/FVC < LLofN BMD: Based on empirical benchmark dose procedure, the predicted number of individuals with FEV1 or FEV1/FVC < lower limit of nor-
mal that would be prevalent in a population of 1000 with 45 yr exposureExcess Lifetime Risk: Based on life-table analysis, the predicted number of new cases in a population of 1,000 starting with exposure at age
20 through 65, until age 85 1/1000 risk exposures in bold; based on rate model not including smoking determinants.
140 Occupational Exposure to Diacetyl and 2,3-Pentanedione
5 . Quantitative Risk Assessment Based on Employee Data
Table 5-35. Risk assessment synthesis: diacetyl exposure levels (ppm) over 45 yrs predicting excess prevalence or lifetime risk
case definition 3: FEV1 < LLofN and FEV1/FVC < LLofN BMD: Based on benchmark dose procedures, the exposure for 45 yr predicted to confer the specified excess prevalence of FEV1 or FEV1/
FVC < lower limit of normal Excess Lifetime Risk: Based on life-table analysis, the exposure at age 20 through 65 predicted to confer the specified excess life-time risk < 4 yrs: analyses based on population with < 4 yr exposure to DA, thought to be less affected by healthy employee survivor effect1/1000 risk exposures in bold.
Occupational Exposure to Diacetyl and 2,3-Pentanedione 141
ReferencesAkpinar-Elci M, Travis WD, Lynch DA, Kreiss K [2004]. Bronchiolitis obliterans syndrome in popcorn produc-tion plant employees. Eur Respir J 24(2):298–302.
ATS (American Thoracic Society) [2000]. What consti-tutes an adverse health effect of air pollution? Official statement of the American Thoracic Society. Am J Respir Crit Care Med 161(2 Pt 1):665–673.
Bailer AJ, Stayner LT, Smith RJ, Kuempel ED, Prince MM [1997]. Estimating benchmark concentrations and other noncancer endpoints in epidemiology studies. Risk Anal 17(6):771–780.
Bang KM, Gergen PJ, Kramer R, Cohen B [1993]. The effect of pulmonary impairment on all-cause mortality in a national cohort. Chest 103(2):536–540.
CDC (Centers for Disease Control and Prevention) [2007]. Fixed obstructive lung disease among employ-ees in the flavor-manufacturing industry—California, 2004–2007. MMWR 56(16):389–393.
CDC, NCHS (Centers for Disease Control and Prevention, National Center for Health Statistics) [2011]. National Health and Nutrition Examination Survey. http://www.cdc.gov/nchs/nhanes.htm. Date accessed: March 2011.
Checkoway H, Pearce N, Kriebel D [2004]. Research methods in occupational epidemiology. 2nd ed. New York: Oxford University Press, pp. 101–105.
Clewell HJ, Crump KS [2005]. Quantitative estimates of risk for noncancer endpoints. Risk Anal 25(2):285–289.
Clewell HJ, Lawrence GA, Calne DB, Crump KS [2003]. Determination of an occupational exposure guideline for manganese using the benchmark method. Risk Anal 23(5):1031–1046.
Committee on the Biological Effects of Ionizing Radiation [1988]. Health risks of radon and other inter-nally deposited alpha-emitters: biological effects of ionizing radiation (BEIR) IV. Washington, DC: National Academy Press.
Corn M, Esmen NA [1979]. Workplace exposure zones for classification of employee exposures to physical and chemical agents. Am Ind Hyg Assoc J 40(1):47–57.
Cox-Ganser J, Ganser G, Saito R, Hobbs G, Boylstein R, Hendricks W, Simmons M, Eide M, Kullman G, Piacitelli C [2011]. Correcting diacetyl concentrations from air samples collected with NIOSH Method 2557. J Occup Environ Hyg 8(2):59–70.
Crump KS [1995]. Calculation of benchmark doses from continuous data. Risk Anal 15(1):79–89.
Cullen K, Stenhouse NS, Wearne KL, Welborn TA [1983]. Multiple regression analysis of risk factors for cardiovas-cular disease and cancer mortality in Busselton, Western Australia—13-year study. J Chronic Dis 36(5):371–377.
Ebi-Kryston KL, Hawthorne VM, Rose G, Shipley MJ, Gillis CR, Hole DJ, Carmen W, Eshleman S, Higgins MW [1989]. Breathlessness, chronic bronchitis and reduced pulmonary function as predictors of cardiovascular disease mortality among men in England, Scotland and the United States. Int J Epidemiol 18(1):84–88.
Ferrer M, Villasante C, Alonso J, Sobradillo V, Gabriel R, Vilagut G, Masa JF, Viejo JL, Jimenez-Ruiz CA, Miravitlles M [2002]. Interpretation of quality of life scores from the St George’s Respiratory Questionnaire. Eur Respir J 19(3):405–413.
Gauderman WJ, Avol E, Gilliland F, Vora H, Thomas D, Berhane K, McConnell R, Kuenzli N, Lurmann F, Rappaport E, Margolis H, Bates D, Peters J [2004]. The effect of air pollution on lung development from 10 to 18 years of age. N Engl J Med 351(11):1057–1067.
GOLD (Global Initiative for Chronic Obstructive Lung Disease) [2011]. COPD diagnosis and management at-a-glance desk reference. http://www.goldcopd.org/uploads/users/files/GOLD_AtAGlance_2010.pdf. Date accessed: August 2011.
142 Occupational Exposure to Diacetyl and 2,3-Pentanedione
Hankinson JL, Odencrantz JR, Fedan KB [1999]. Spirometric reference values from a sample of the general U.S. population. Am J Respir Crit Care Med 159(1):179–187.
Hole DJ, Watt GC, Davey-Smith G, Hart CL, Gillis CR, Hawthorne VM [1996]. Impaired lung function and mortality risk in men and women: findings from the Renfrew and Paisley prospective population study. BMJ 313(7059):711–715; discussion 715–716.
Israel L, Kim T, Prudhomme J, Bailey R, Harber P [2009]. Workplace spirometry: early detection ben-efits individuals, employee groups and employers. http://www.thoracic.org/clinical/ats-clinical-cases/pages/workplace-spirometry-early-detection-benefits-individuals,-employee-groups-and-employers.php. Date accessed: September 2010.
Knuiman MW, James AL, Divitini ML, Ryan G, Bartholomew HC, Musk AW [1999]. Lung function, respiratory symptoms, and mortality: results from the Busselton Health Study. Ann Epidemiol 9(5):297–306.
Kreiss K, Gomaa A, Kullman G, Fedan K, Simoes EJ, Enright PL [2002]. Clinical bronchiolitis obliterans in employees at a microwave-popcorn plant. N Engl J Med 347(5):330–338.
Kuller LH, Ockene JK, Townsend M, Browner W, Meilahn E, Wentworth DN [1989]. The epidemiology of pulmonary function and COPD mortality in the multiple risk factor intervention trial. Am Rev Respir Dis 140(3 Pt 2):S76–81.
Kullman G, Boylstein R, Jones W, Piacitelli C, Pendergrass S, Kreiss K [2005]. Characterization of respiratory exposures at a microwave popcorn plant with cases of bronchiolitis obliterans. J Occup Environ Hyg 2(3):169–178.
Lockey JE, Hilbert TJ, Levin LP, Ryan PH, White KL, Borton EK, Rice CH, McKay RT, LeMasters GK [2009]. Airway obstruction related to diacetyl exposure at microwave popcorn production facilities. Eur Respir J 34(1):63–71.
Mannino DM, Davis KJ [2006]. Lung function decline and outcomes in an elderly population. Thorax 61(6):472–477.
Mannino DM, Reichert MM, Davis KJ [2006]. Lung function decline and outcomes in an adult population. Am J Respir Crit Care Med 173(9):985–990.
National Research Council [2009]. Science and decisions: advancing risk assessment. Washington, DC: National Academies Press.
National Toxicology Program [2013a]. Testing Status of 2,3-Butanedione (Diacetyl). http://ntp.niehs.nih.gov/?objectid=BDAAC16E-123F-7908-7B81117E04E12A40. Date accessed: August 2013.
National Toxicology Program [2013b]. Testing Status of Acetoin. http://ntp.niehs.nih.gov/?objectid=BDC958F4-123F-7908-7B566135E40DAE85. Date accessed: August 2013.
NIOSH [2003a]. Hazard evaluation and technical assis-tance report: Agrilink Foods Popcorn Plant, Ridgway, IL. By Sahakian N, Choe K, Boylstein R, Schleiff P. Cincinnati, OH: U.S. Department of Health and Human Services, Centers for Disease Control and Prevention, National Institute for Occupational Safety and Health, NIOSH HETA Report No. 2002–0408–2915.
NIOSH [2003b]. Hazard evaluation and technical assis-tance report: B.K. Heuermann Popcorn, Inc, Phillips, NE. By Kanwal R, Martin S. Cincinnati, OH: U.S. Department of Health and Human Services, Centers for Disease Control and Prevention, National Institute for Occupational Safety and Health, NIOSH HETA Report No. 2001–0517.
NIOSH [2003c]. Hazard evaluation and technical assis-tance report: Nebraska Popcorn, Clearwater, NE. By Kanwal R. Cincinnati, OH: U.S. Department of Health and Human Services, Centers for Disease Control and Prevention, National Institute for Occupational Safety and Health, NIOSH HETA Report No. 2002–0089.
NIOSH [2004a]. Hazard evaluation and technical assis-tance report: American Pop Corn Company, Sioux City, IA. By Kanwal R, Boylstein R, Piacitelli C. Cincinnati, OH: U.S. Department of Health and Human Services, Centers for Disease Control and Prevention, National Institute for Occupational Safety and Health, NIOSH HETA Report No. 2001–0474–2943.
Occupational Exposure to Diacetyl and 2,3-Pentanedione 143
OH. By Kanwal R, Kullman G. Cincinnati, OH: U.S. Department of Health and Human Services, Centers for Disease Control and Prevention, National Institute for Occupational Safety and Health, NIOSH HETA Report No. 2003–0112–2949.
NIOSH [2006]. Hazard evaluation and technical assis-tance report: Gilster-Mary Lee Corporation, Jasper, MO. By Kanwal R, Kullman G, Fedan K, Kreiss K. Cincinnati, OH: U.S. Department of Health and Human Services, Centers for Disease Control and Prevention, National Institute for Occupational Safety and Health, NIOSH HETA Report No. 2000–0401–2991.
NIOSH [2008]. Hazard evaluation and technical assis-tance report: Gold Coast Ingredients, Inc., Commerce, CA. By Bailey R, McKernan L, Dunn K, Sahakian N, Kreiss K. Cincinnati, OH: U.S. Department of Health and Human Services, Centers for Disease Control and Prevention, National Institute for Occupational Safety and Health, NIOSH HETA Report No. 2007–0033–3074.
Park RM, Bowler RM, Eggerth DE, Diamond E, Spencer KJ, Smith D, Gwiazda R [2006]. Issues in neurological risk assessment for occupational exposures: the Bay Bridge welders. Neurotoxicology 27(3):373–384.
Pellegrino R, Viegi G, Brusasco V, Crapo RO, Burgos F, Casaburi R, Coates A, van der Grinten CP, Gustafsson P, Hankinson J, Jensen R, Johnson DC, MacIntyre N, McKay R, Miller MR, Navajas D, Pedersen OF, Wanger J [2005]. Interpretative strategies for lung function tests. Eur Respir J 26(5):948–968.
Rodriguez BL, Masaki K, Burchfiel C, Curb JD, Fong KO, Chyou PH, Marcus EB [1994]. Pulmonary function decline and 17-year total mortality: the Honolulu Heart Program. Am J Epidemiol 140(5):398–408.
Ryan G, Knuiman MW, Divitini ML, James A, Musk AW, Bartholomew HC [1999]. Decline in lung function
and mortality: the Busselton Health Study. J Epidemiol Community Health 53(4):230–234.
Sabia S, Shipley M, Elbaz A, Marmot M, Kivimaki M, Kauffmann F, Singh-Manoux A [2010]. Why does lung function predict mortality? Results from the Whitehall II Cohort Study. Am J Epidemiol 172(12):1415–1423.
SAS Institute Inc. [2008]. SAS® 9.2 Enhanced Logging Facilities. Cary, NC: SAS Institute Inc.
Schroeder EB, Welch VL, Couper D, Nieto FJ, Liao D, Rosamond WD, Heiss G [2003]. Lung function and inci-dent coronary heart disease: the atherosclerosis risk in communities study. Am J Epidemiol 158(12):1171–1181.
Schunemann HJ, Dorn J, Grant BJ, Winkelstein, W Jr., Trevisan M [2000]. Pulmonary function is a long-term predictor of mortality in the general population: 29-year follow-up of the Buffalo Health Study. Chest 118(3):656–664.
Sin DD, Wu L, Man SF [2005]. The relationship between reduced lung function and cardiovascular mortality: a population-based study and a systematic review of the literature. Chest 127(6):1952–1959.
Smith TJ [1992]. Occupational exposure and dose over time: limitations of cumulative exposure. Am J Ind Med 21(1):35–51.
SSA (Social Security Administration) [2005]. Life table for the United States Social Security Area 1900-2100: actuarial study #120. Table 6. http://www.ssa.gov/OACT/NOTES/as120/LifeTables_Tbl_6_2000.html. Date accessed: May 2010.
Wise RA [2006]. The value of forced expiratory volume in 1 second decline in the assessment of chronic obstruc-tive pulmonary disease progression. Am J Med 119(10 Suppl 1):4–11.