60
Quantitative Structure-Activity Relationships Quantitative Structure-Property-Relationships Alexandre Varnek Faculté de Chimie, ULP, Strasbourg, FRANCE QSAR/QSPR modeling
| Date post: | 02-Jan-2016 |
| Category: |
Documents |
| Upload: | shanna-hutchinson |
| View: | 218 times |
| Download: | 1 times |

Quantitative Structure-Activity Relationships Quantitative Structure-Property-Relationships
Alexandre VarnekFaculté de Chimie, ULP, Strasbourg, FRANCE
QSAR/QSPR modeling

• Development
• Validation
• Application
QSAR/QSPR models
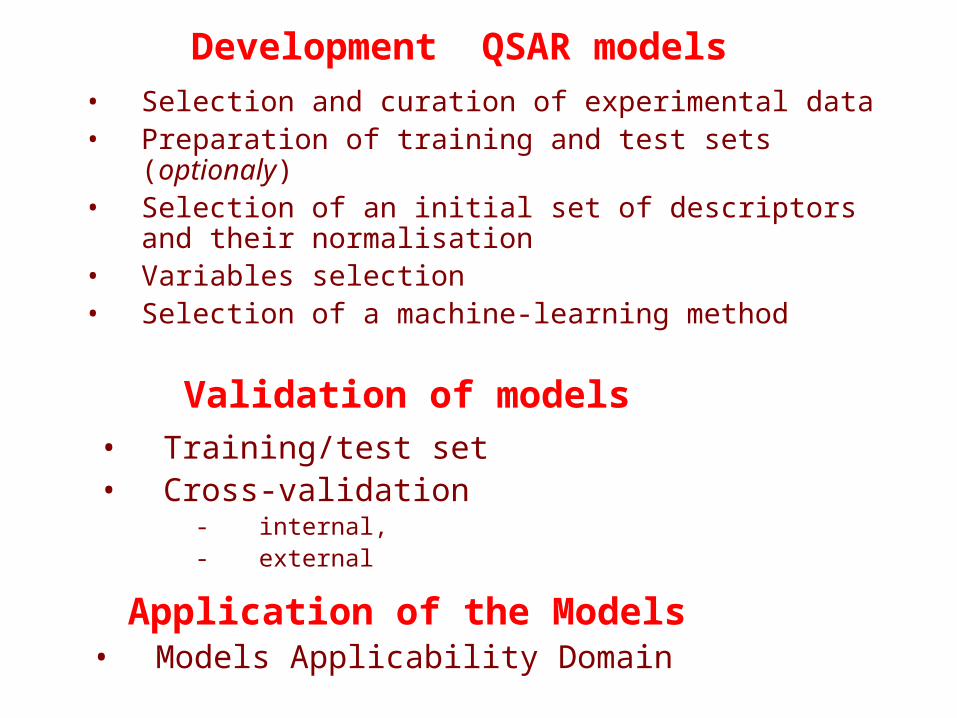
Development QSAR models
• Selection and curation of experimental data• Preparation of training and test sets (optionaly)• Selection of an initial set of descriptors and their
normalisation• Variables selection• Selection of a machine-learning method
Validation of models• Training/test set• Cross-validation
- internal,- external
Application of the Models• Models Applicability Domain
Development the QSAR models
• Experimental Data
• Descriptors
• Mathematical techniques
• Statistical criteria

Preparation of training and test sets
Building of structure - property models
Selection of the best models according to statistical criteria
Splitting of an initial data set into training and test sets
Train
ing set
Test
Initial d
ata set
“Prediction” calculations using the best structure - property models
10 – 15 %

Recommendations to prepare a test set
• (i) experimental methods for determination of activities in the training and test sets should be similar;
• (ii) the activity values should span several orders of magnitude, but should not exceed activity values in the training set by more than 10%;
• (iii) the balance between active and inactive compounds should be respected for uniform sampling of the data.
References: Oprea, T. I.; Waller, C. L.; Marshall, G. R. J. Med. Chem. 1994, 37, 2206-2215
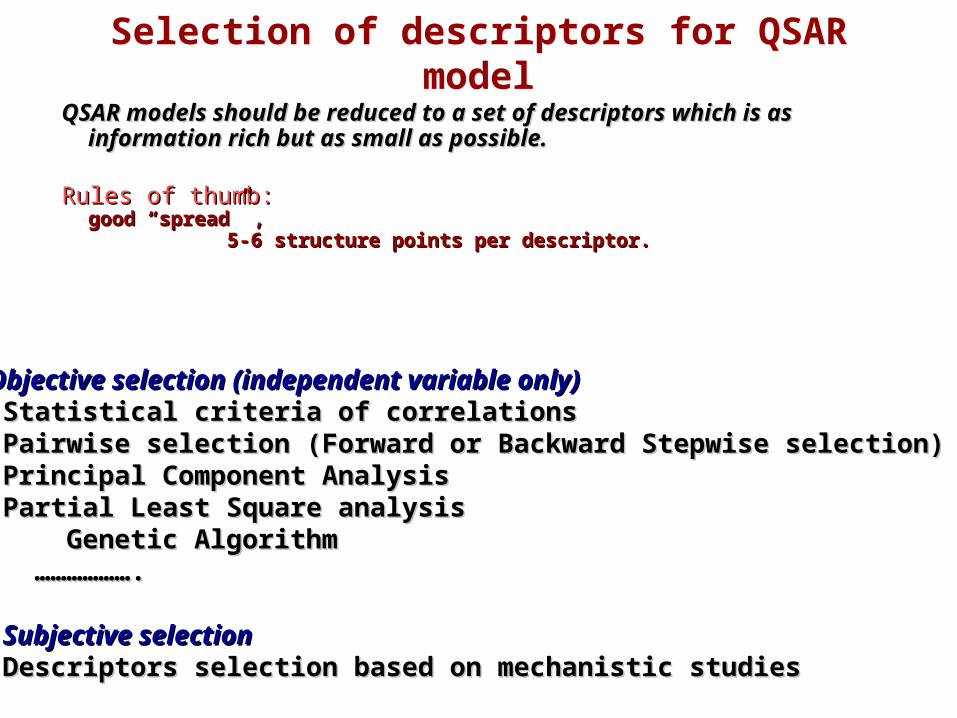
Selection of descriptors for QSAR model
QSAR models should be reduced to a set of descriptors which is as information QSAR models should be reduced to a set of descriptors which is as information rich but as small as possible.rich but as small as possible.
Rules of thumb:Rules of thumb: good “spread” ,good “spread” ,
5-6 structure points per descriptor.5-6 structure points per descriptor.
Objective selection (independent variable only) Objective selection (independent variable only) Statistical criteria of correlations Statistical criteria of correlations Pairwise selection (Forward or Backward Stepwise selection) Pairwise selection (Forward or Backward Stepwise selection) Principal Component AnalysisPrincipal Component Analysis Partial Least Square analysisPartial Least Square analysis
Genetic AlgorithmGenetic Algorithm………………………………..
Subjective selection Subjective selection Descriptors selection based on mechanistic studiesDescriptors selection based on mechanistic studies
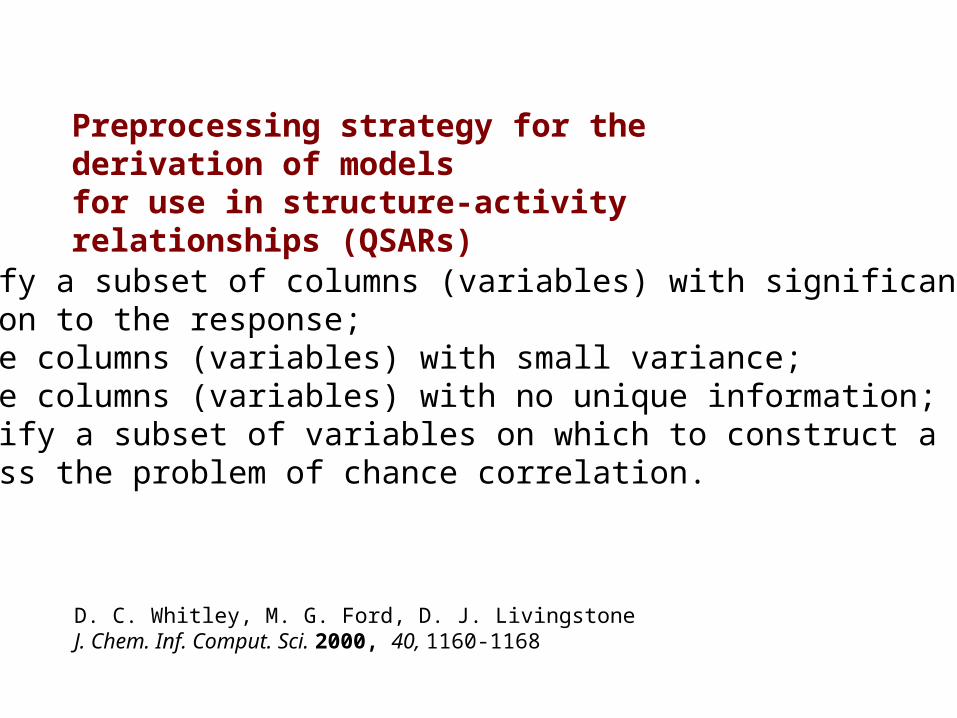
1. identify a subset of columns (variables) with significantcorrelation to the response; 2. remove columns (variables) with small variance; 3. remove columns (variables) with no unique information; 4. identify a subset of variables on which to construct a model; 5. address the problem of chance correlation.
D. C. Whitley, M. G. Ford, D. J. LivingstoneJ. Chem. Inf. Comput. Sci. 2000, 40, 1160-1168
Preprocessing strategy for the derivation of modelsfor use in structure-activity relationships (QSARs)

Machine-Learning Methods

Fitting models’ parameters
The goal is to minimize Residual Sum of Squared (RSS)
N
iicalci yyRSS
1
2,exp, )(
Y = F(ai , Xi )
Xi - descriptors (independent variables)
ai - fitted parameters
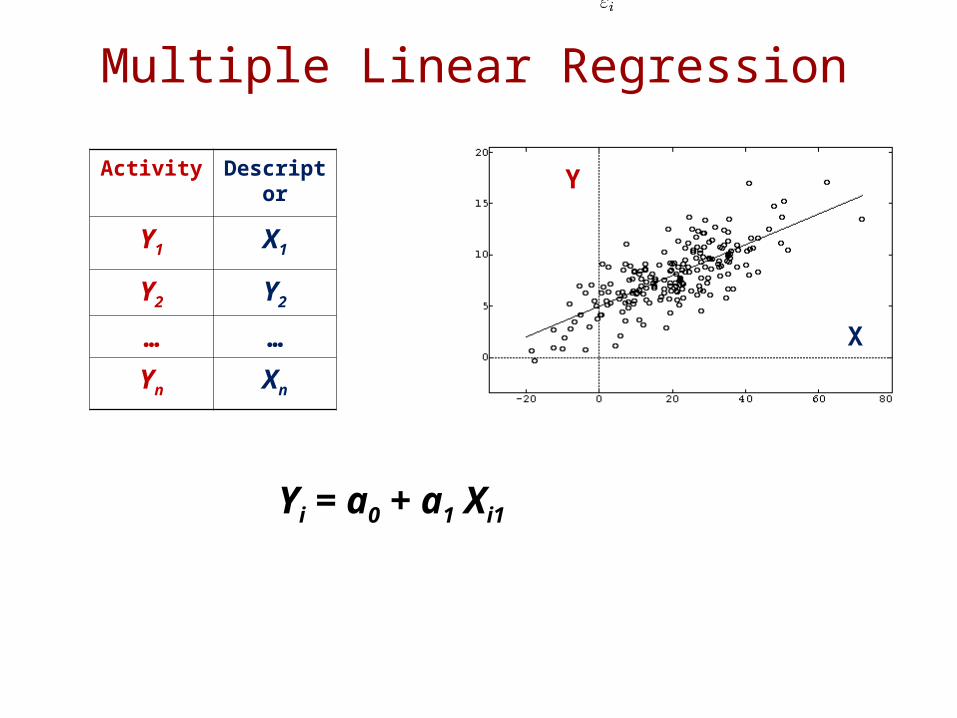
Multiple Linear Regression
Activity Descriptor
Y1 X1
Y2 Y2
… …
Yn Xn
Y
X
Yi = a0 + a1 Xi1

Multiple Linear Regression
y=ax+b
a
b
Residual Sum ofSquared (RSS)
N
iicalci yyRSS
1
2, )(

Multiple Linear Regression
Activity Descr 1 Descr 2 … Descr m
Y1 X11 X12 … X1m
Y2 X21 X22 … X2m
… … … … …
Yn Xn1 Xn2 … Xnm
Yi = a0 + a1 Xi1 + a2 Xi2 +…+ am Xim
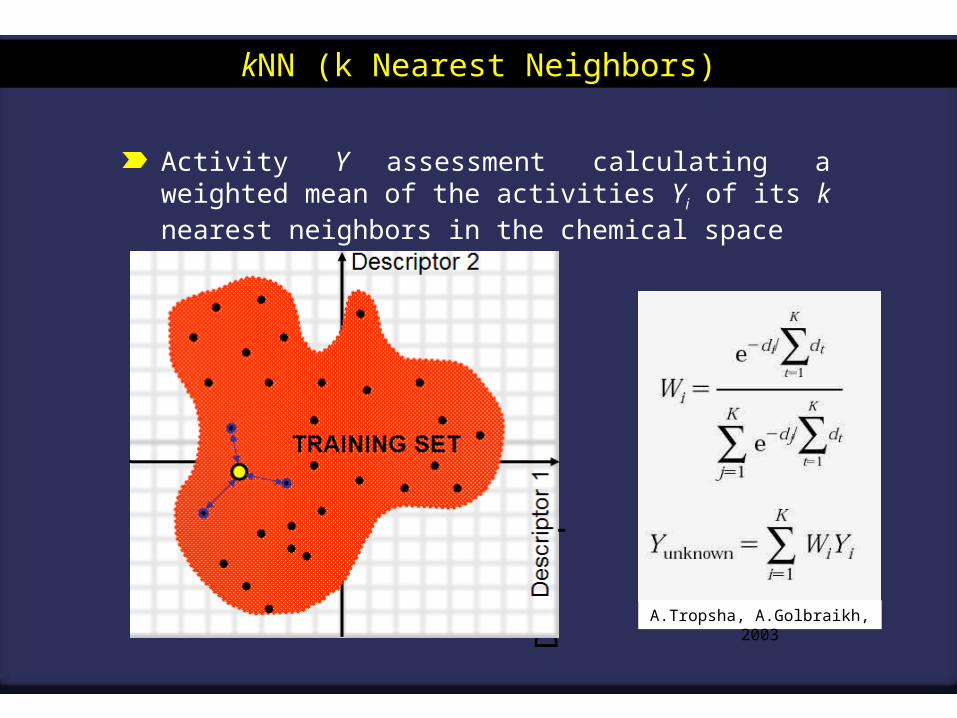
kNN (k Nearest Neighbors)
Activity Y assessment calculating a weighted mean of the activities Yi of its k nearest neighbors in the chemical space
A.Tropsha, A.Golbraikh, 2003Des
crip
tor
1
Descriptor 2
TRAINING SET
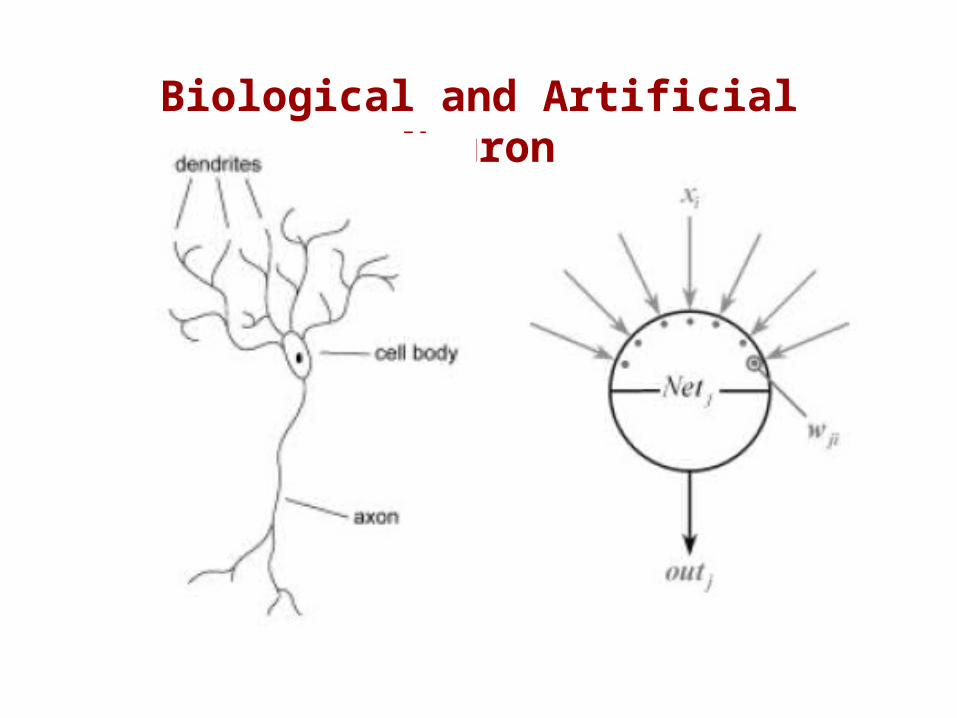
Biological and Artificial Neuron

Multilayer Neural Network
Neurons in the input layer correspond to descriptors, neurons in the output layer – to properties being predicted, neurons in the hidden layer – to nonlinear latent variables
• Development
• Validation
• Application
QSAR/QSPR models

Validating the QSAR Equation
actual
predicted
r2 is the fraction of the total variation in the dependent variables that is explained by the regression equation.
How well does the model predicts the activity of known compounds?
For a perfect model:• All data points would reside on the diagonal.• All variance existing in the original data is explained by the
model.
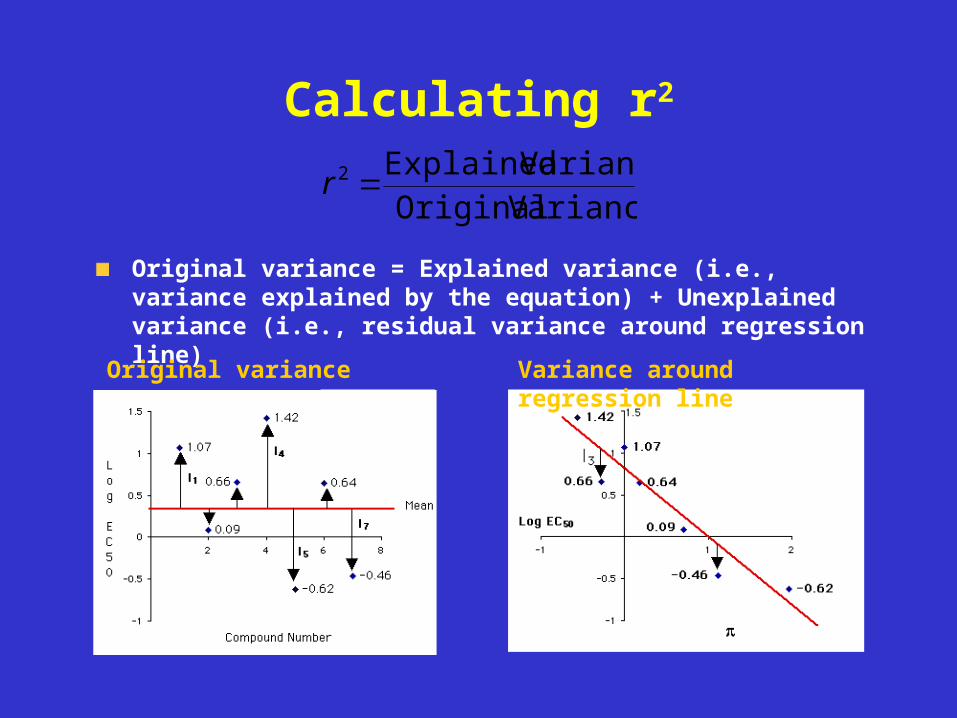
Calculating r2
Variance OriginalVariance Explained2 r
Original variance = Explained variance (i.e., variance explained by the equation) + Unexplained variance (i.e., residual variance around regression line)
Original variance Variance around regression line

Calculating r2
Compound Number Log EC50
Calculated
Log EC50 Residual
1 1.07 0.79 0.282 0.09 0.21 -0.123 0.66 1.02 -0.364 1.42 1.26 0.165 -0.62 -0.81 0.196 0.64 0.65 -0.017 -0.46 -0.12 -0.348 ?? 1.6 ??
TSSRSS
TSSRSSTSS
TSSESS
r 12
89.049.309.3
49.340.049.32 r
Original variance:
N
ii yyTSS
1
2)(
Explained variance:Improvement in predicting y from just using the mean of y
N
icalci yyESS
1
2, )(
N
iicalci yyRSS
1
2, )(Variance around regression line:
F-test
Tests the assumption that a significant portion of the original variance has been explained by the model.
In statistical terms tests that the ratio between the explained variance (ESS/k; k = number of parameters) and the original variance (RSS/N-k-1; N = number of data points) significantly differs from 0. This implies that ESS = 0, i.e., the model didn’t explain any of the variance.
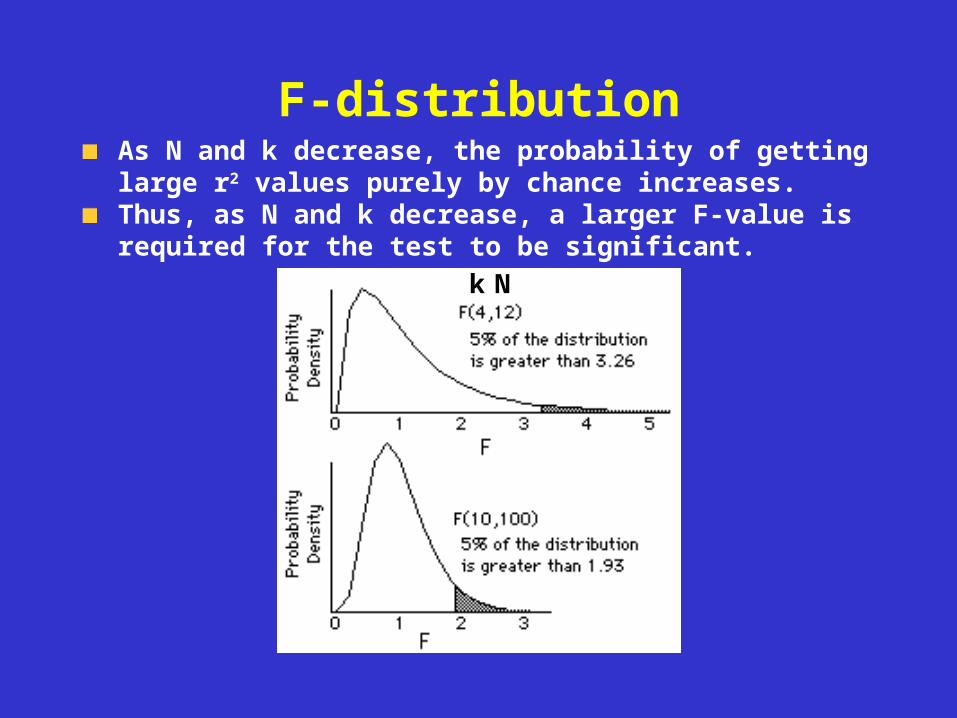
F-distributionAs N and k decrease, the probability of getting large r2 values purely by chance increases.Thus, as N and k decrease, a larger F-value is required for the test to be significant.
Nk
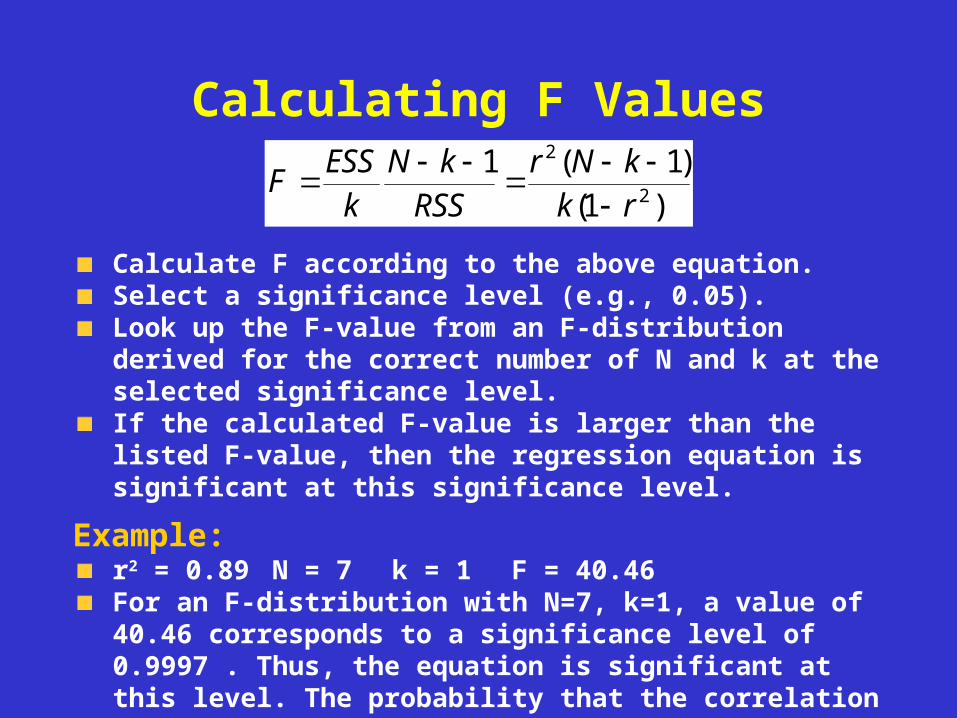
Calculating F Values
Calculate F according to the above equation.Select a significance level (e.g., 0.05).Look up the F-value from an F-distribution derived for the correct number of N and k at the selected significance level.If the calculated F-value is larger than the listed F-value, then the regression equation is significant at this significance level.
Example:r2 = 0.89 N = 7 k = 1 F = 40.46For an F-distribution with N=7, k=1, a value of 40.46 corresponds to a significance level of 0.9997 . Thus, the equation is significant at this level. The probability that the correlation is fortuitous is < 0.03%
)1()1(1
2
2
rkkNr
RSSkN
kESS
F
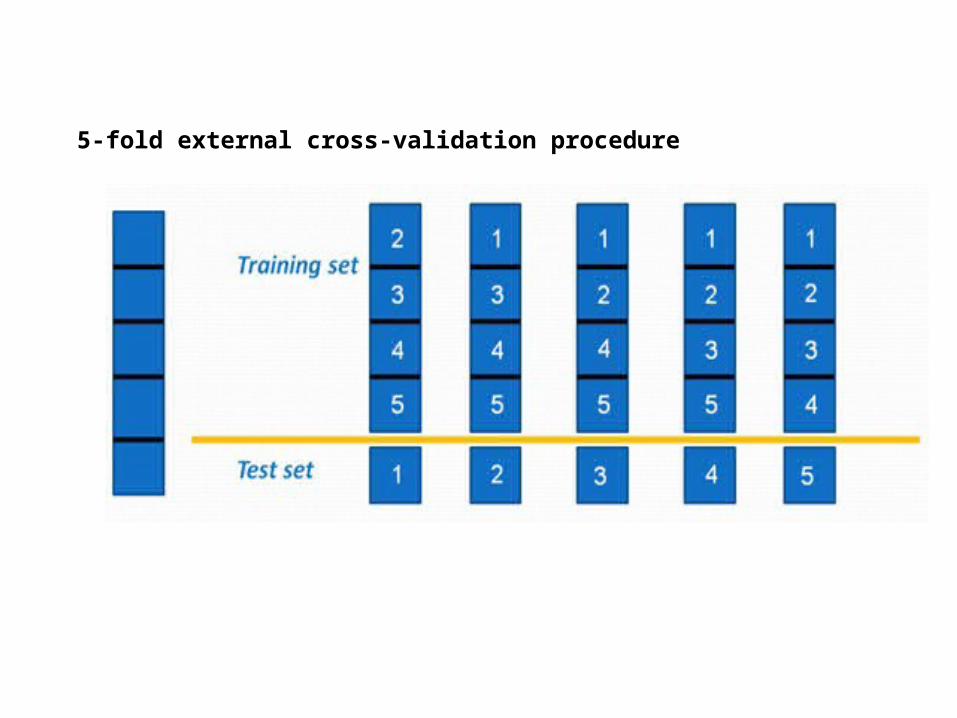
5-fold external cross-validation procedure
Validation of Models

Cross Validation
N
iiipredN
i i
yyPRESSyy
PRESSQ
1
2,
1
2
2 ;)(
1
N
iiicalcN
i i
yyRSSyy
RSSr
1
2,
1
2
2 ;)(
1
A measure of the predictive ability of the model (as opposed to the measure of fit produced by r2).
r2 always increases as more descriptors are added.Q2 initially increases as more parameters are added but then starts to decrease indicating data over fitting. Thus Q2 is a better indicator of the model quality.
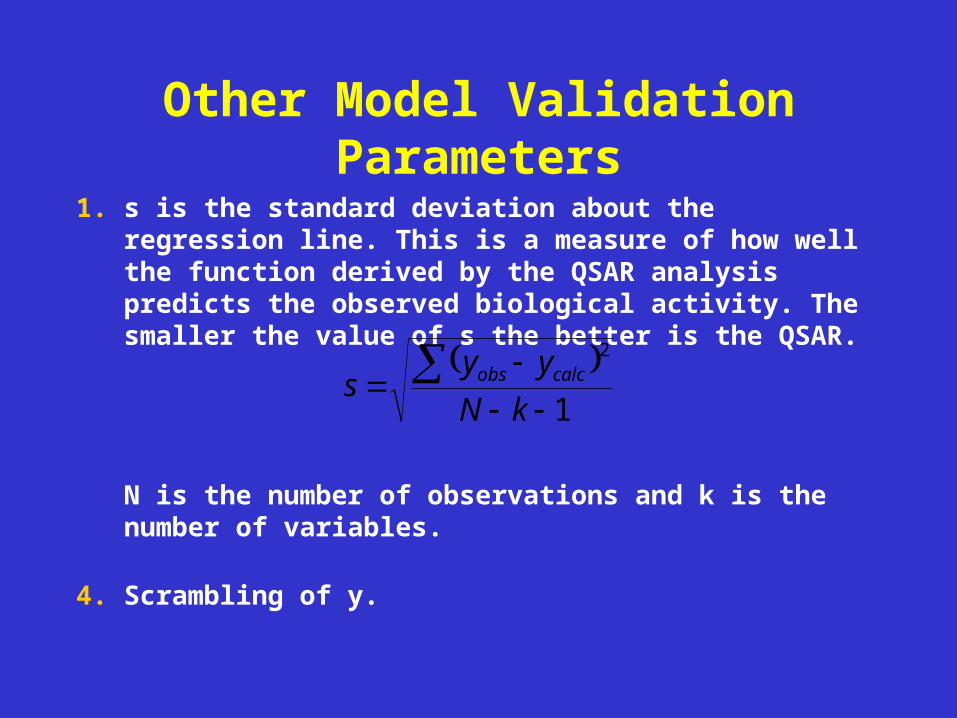
Other Model Validation Parameters
1. s is the standard deviation about the regression line. This is a measure of how well the function derived by the QSAR analysis predicts the observed biological activity. The smaller the value of s the better is the QSAR.
N is the number of observations and k is the number of variables.
4. Scrambling of y.
1
2
kN
yys calcobs

Scrambling:to mix randomly:• Y values (Y-scrambling), or • X values (X-scrambling), or • simulteneously Y and X values (X,Y-scrambling)
Statistical tests for « chance correlations »
Randomization:to generat random number s: • from Ymin to Ymax (Y – randomization),
• from Xmin to Xmax (X – randomization),• or do this simulteneously for Y and X (X, Y – randomization)
Calculate statistical parameters of correlations and compare them with those obtained for the model

Scrambling
Struc.1
Struc.2
Struc.n
..
..
Pro.1
Struc.3
..
..
Pro.2
Pro.3
Pro.n
Struc.1
Struc.2
Struc.n
..
..
Pro.1
Struc.3
..
..
Pro.2
Pro.3
Pro.n
-0.1
0
0.1
0.2
0.3
0.4
0.5
0.6
0.7
0 10 20 30 40 50 60 70
Number of Variables
q2
The lowest q2 = 0.51 in the top 10 models
The highest q2 =0.14 for randomized datasets
-0.1
0
0.1
0.2
0.3
0.4
0.5
0.6
0.7
0 10 20 30 40 50 60 70
Number of Variables
q2
The lowest q2 = 0.51 in the top 10 models
The highest q2 =0.14 for randomized datasets

• Development
• Validation
• Application
QSAR/QSPR models
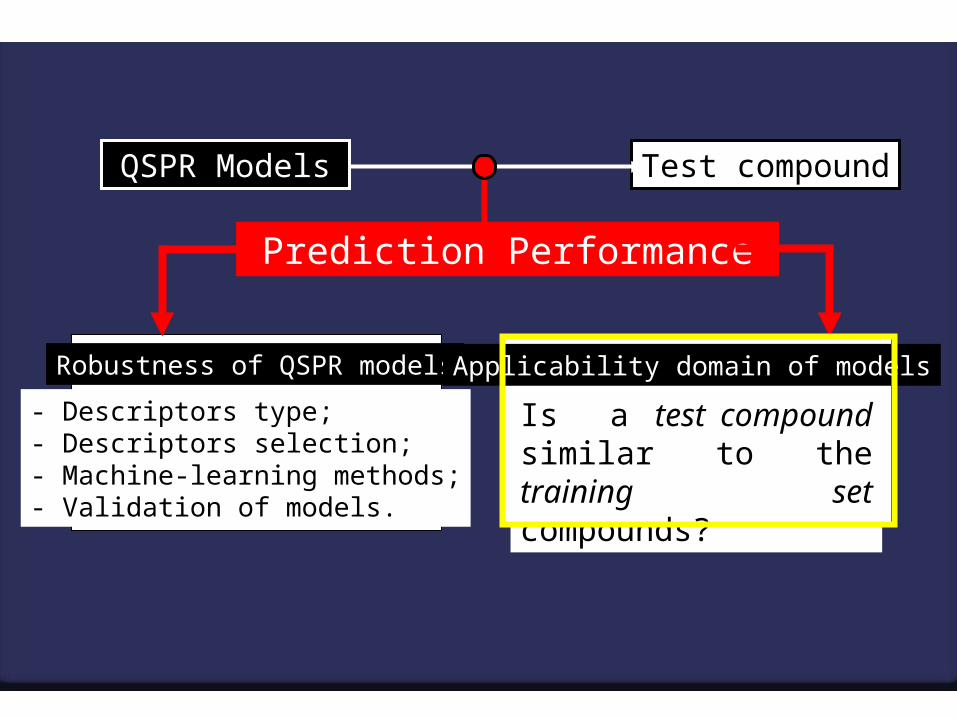
Is a test compound similar to the training set compounds?
- Descriptors type;- Descriptors selection;- Machine-learning methods;- Validation of models.
Prediction Performance
QSPR Models Test compound
Robustness of QSPR models Applicability domain of models
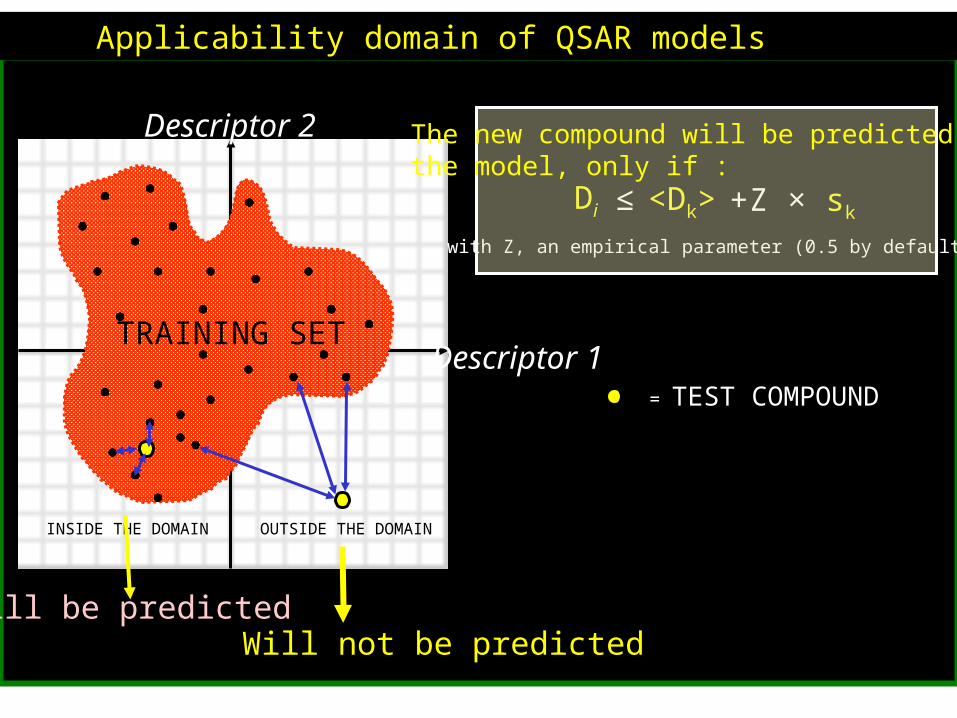
Applicability domain of QSAR models
= TEST COMPOUNDDescriptor 1
Descriptor 2
TRAINING SET
OUTSIDE THE DOMAIN
Will not be predicted
Di ≤ <Dk> + Z × sk
with Z, an empirical parameter (0.5 by default)
The new compound will be predicted bythe model, only if :
INSIDE THE DOMAIN
Will be predicted

Range –based methods
Bounding Box (BB)
Applicability domain of QSAR models
ensemble modeling
Should one use only one individual model or many models ?
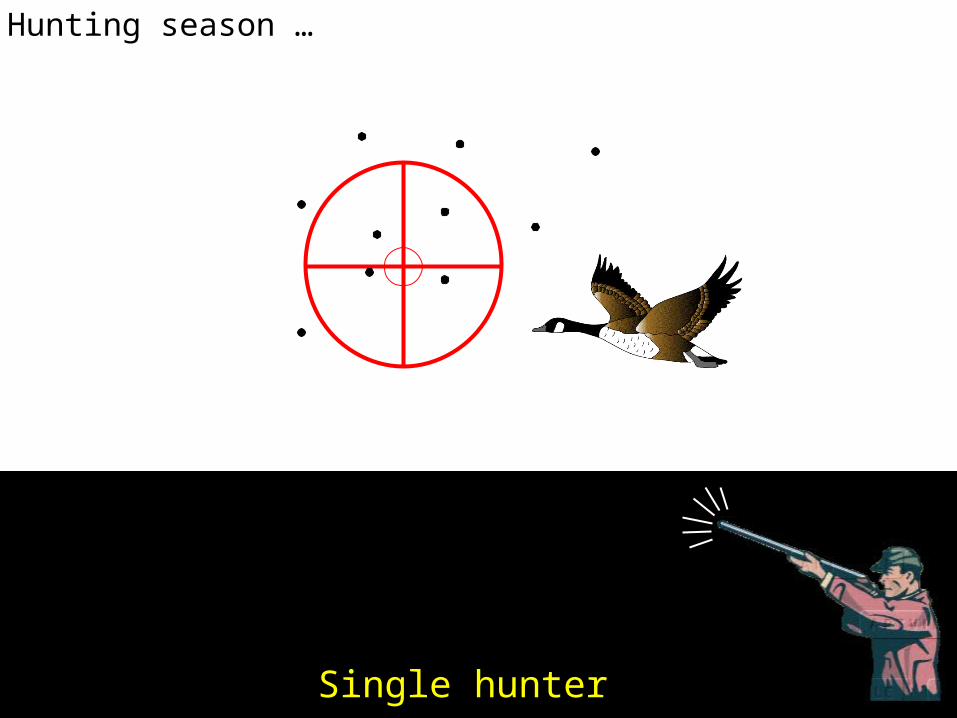
Hunting season …
Single hunter
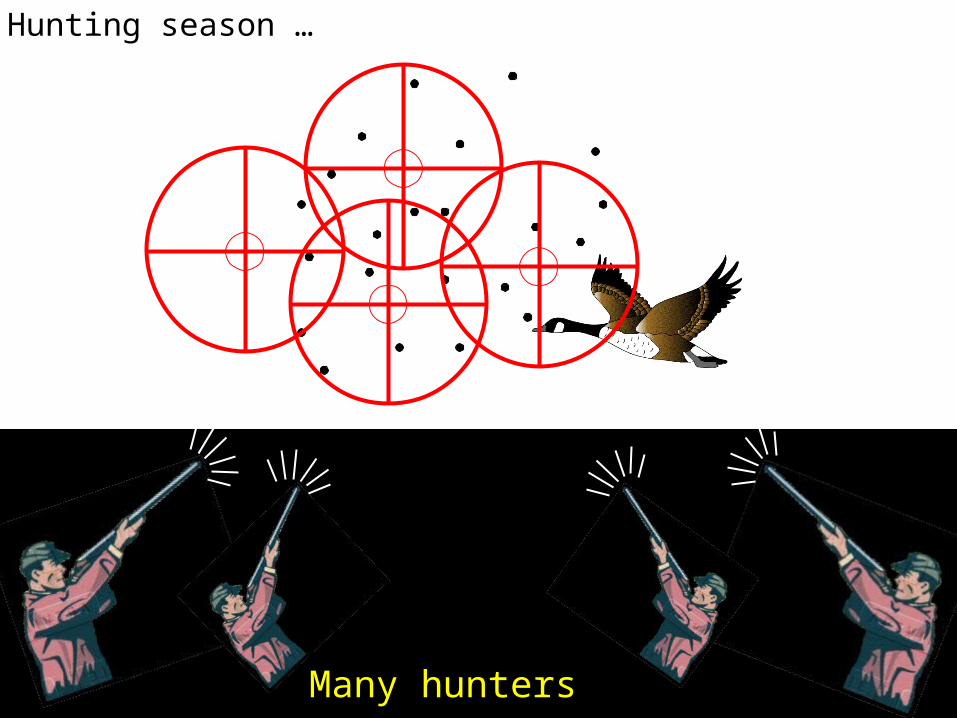
Hunting season …
Many hunters
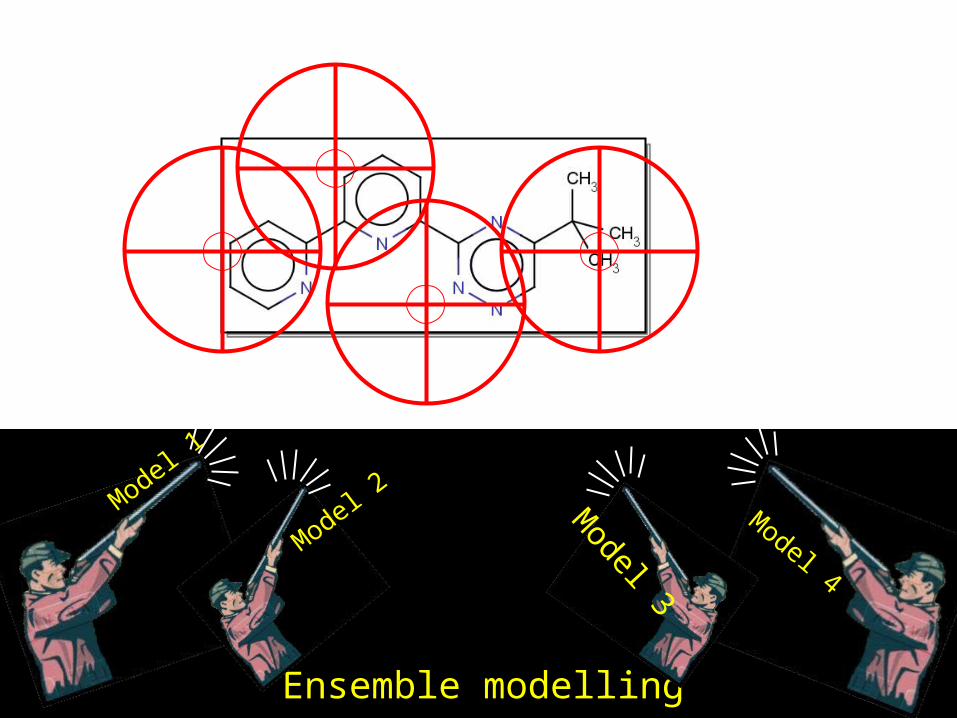
Ensemble modelling
Model 1
Model 2
Model 3
Model 4
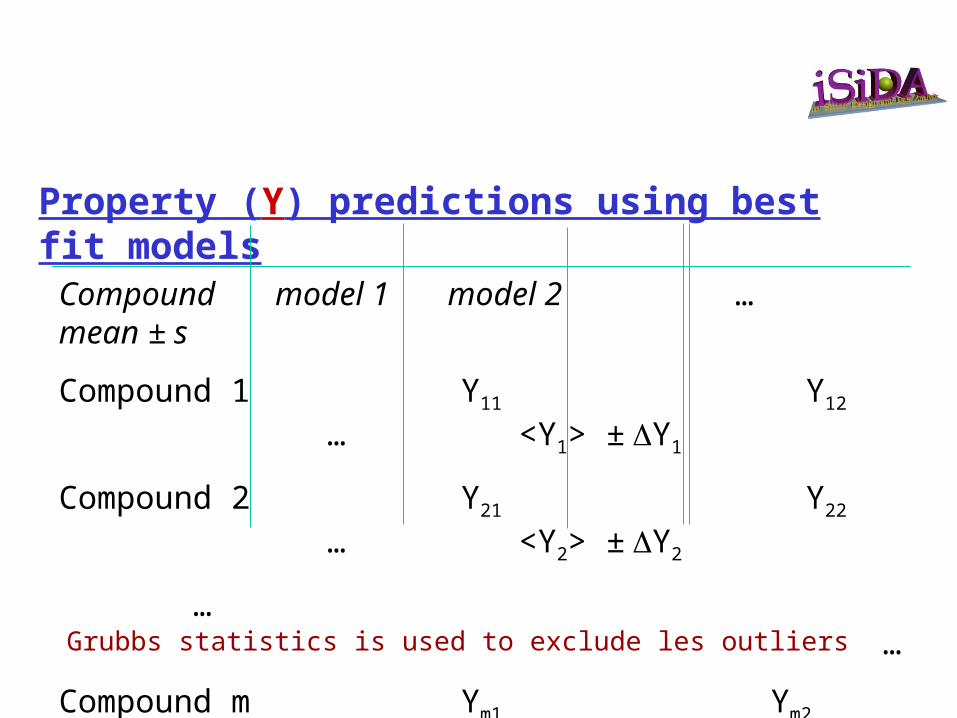
Property (Y) predictions using best fit models
Compound model 1 model 2 … mean ± s
Compound 1 Y11 Y12 … <Y1> ± Y1
Compound 2 Y21 Y22 … <Y2> ± Y2
… …
Compound m Ym1 Ym2 … <Ym> ± Ym
Grubbs statistics is used to exclude les outliers
N
O
N
O
N
O
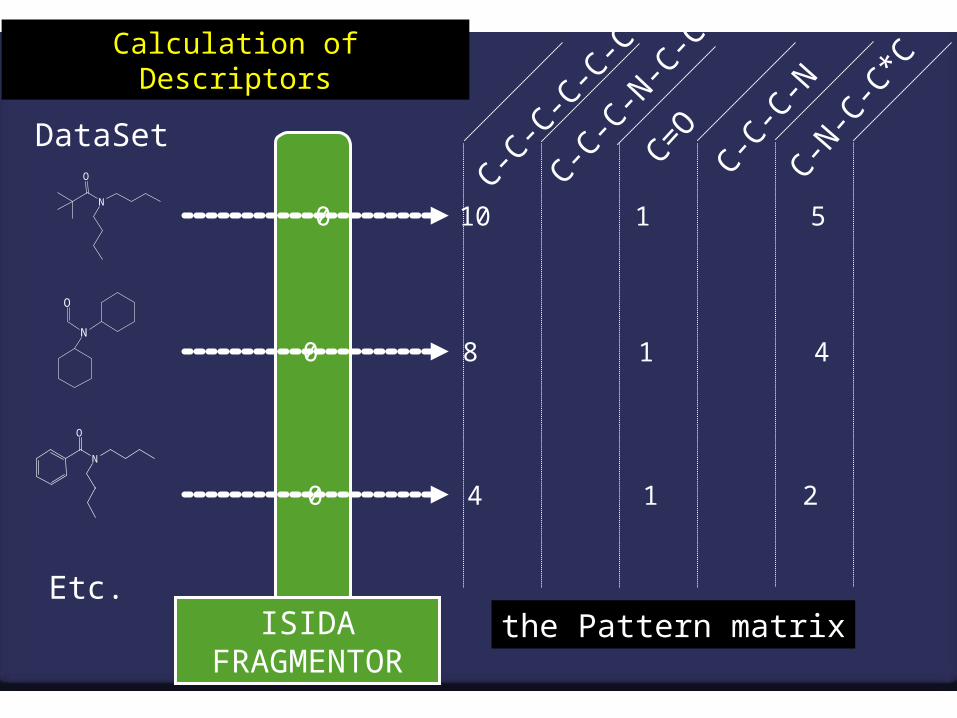
Etc.
DataSet
C-C-C
-C-C
-CC-C
-C-N
-C-C
C=O
C-C-C
-NC-N
-C-C
*C
ISIDA FRAGMENTOR
0 10 1 5 0
0 8 1 4 0
0 4 1 2 4
the Pattern matrix
Calculation of Descriptors

+
PATTERN MATRIX PROPERTY VALUES
-0.222
0.973
-0.066
LEARNING STAGEBuilding of models
QSAR models
VALIDATION STAGEQSAR models filtering ->
selection of the most predictive ones

Example : linear QSPR model
Daa i
k
ii.Propriété
10
Property
PROPERTYcalc = -0.36 * NC-C-C-N-C-C + 0.27 * NC=O + 0.12 * NC-N-C*C + …

Virtual screening with QSAR/QSPR models
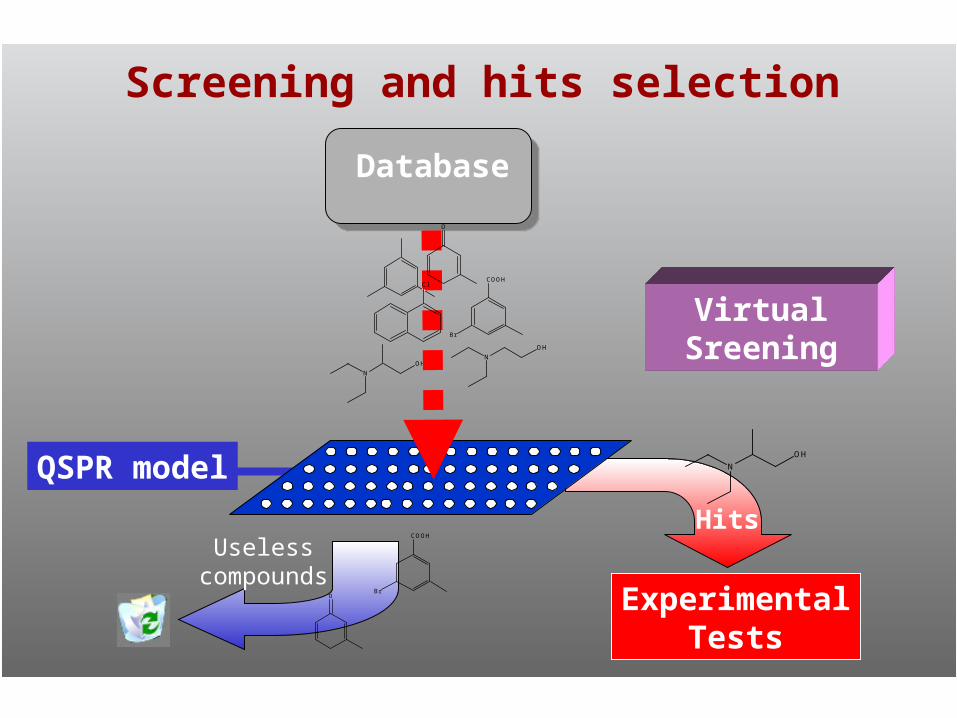
VirtualSreening
Database
ExperimentalTests
Hits
N
OH
N
OH
N
OH
O
COOH
Br
Screening and hits selection
QSPR model
Uselesscompounds
O
ClCOOH
Br

Combinatorial Library Design
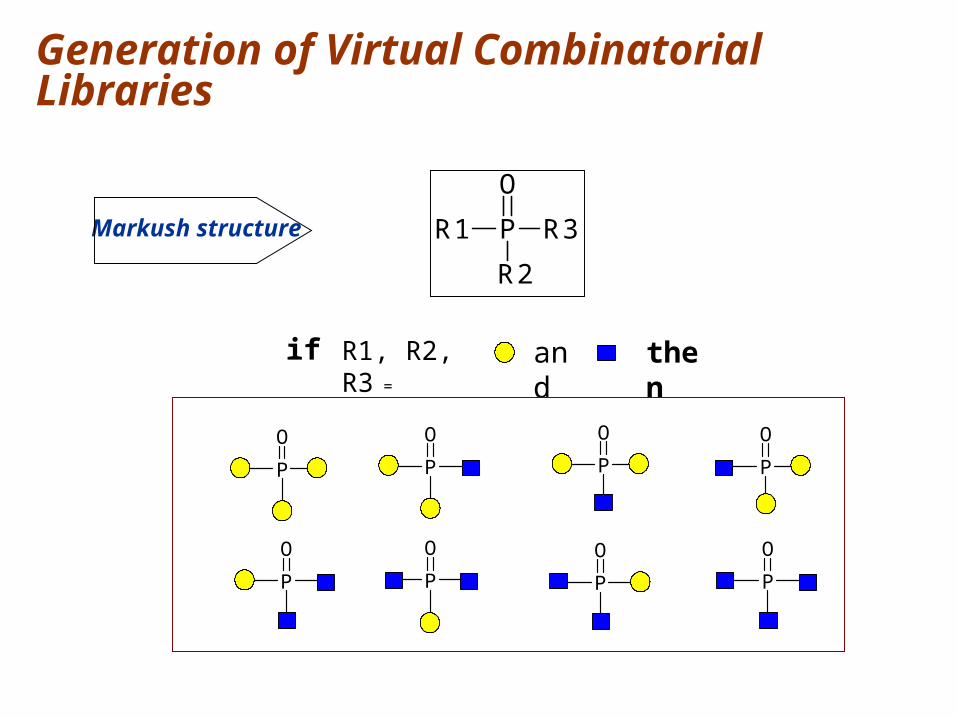
Generation of Virtual Combinatorial Libraries
if R1, R2, R3 = and then
Markush structure P
O
R1 R3
R2
P
O
P
O
P
O
P
O
P
O
P
O
P
O
P
O
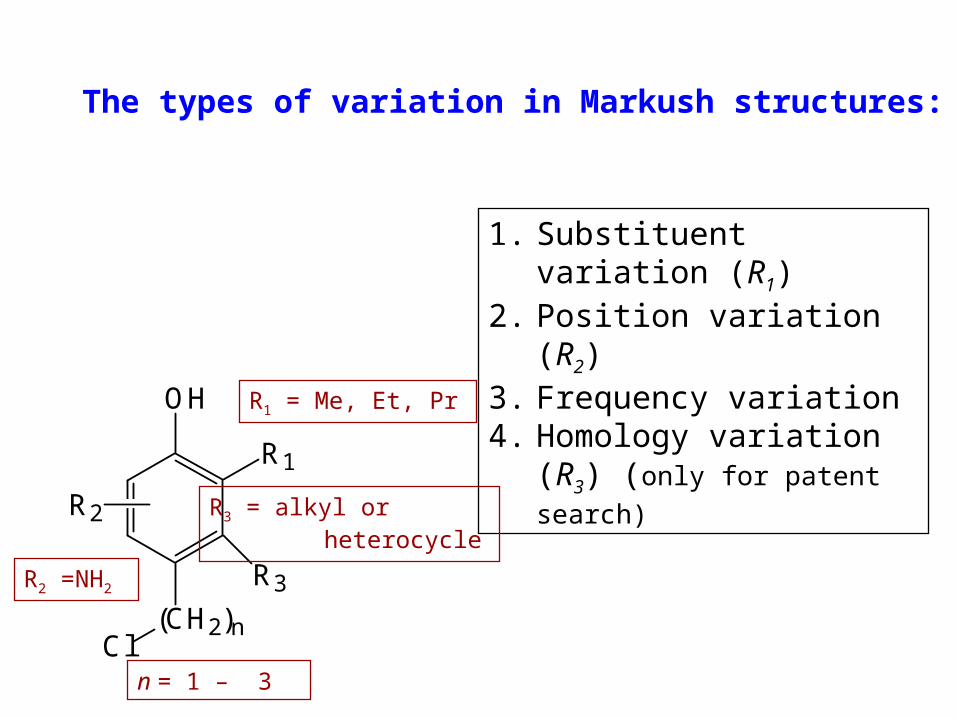
1. Substituent variation (R1)2. Position variation (R2)3. Frequency variation 4. Homology variation (R3) (only
for patent search)OH
R1
R3
(CH2)nCl
R2
n = 1 – 3
R2 =NH2
R3 = alkyl or heterocycle
R1 = Me, Et, Pr
The types of variation in Markush structures:

IN SILICO design of new compounds

- Acquisition of Data;
- Acquisition of Knowledge;
- Exploitation of Knowledge
« In silico » design of new compounds
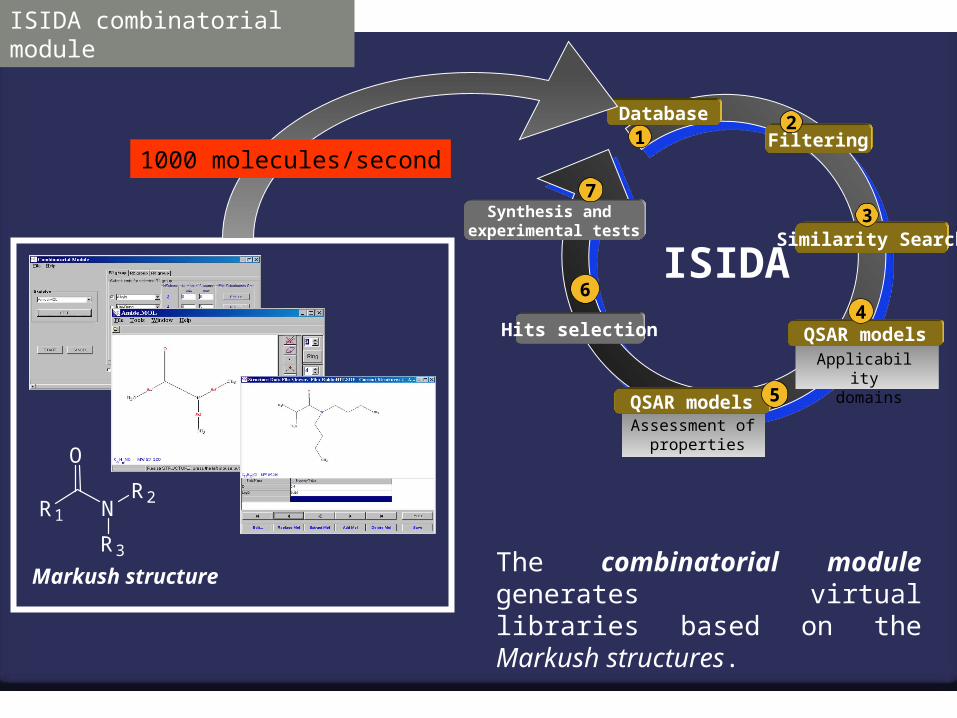
Markush structureThe combinatorial module generates virtual libraries based on the Markush structures.
R1 NR2
O
R3
ISIDA combinatorial module
Database
Filtering2
Hits selection
6
Synthesis and experimental tests
7
QSAR models
1
Similarity Search
QSAR models 5
Assessment of properties
Applicability domains
4
3
ISIDA
1000 molecules/second
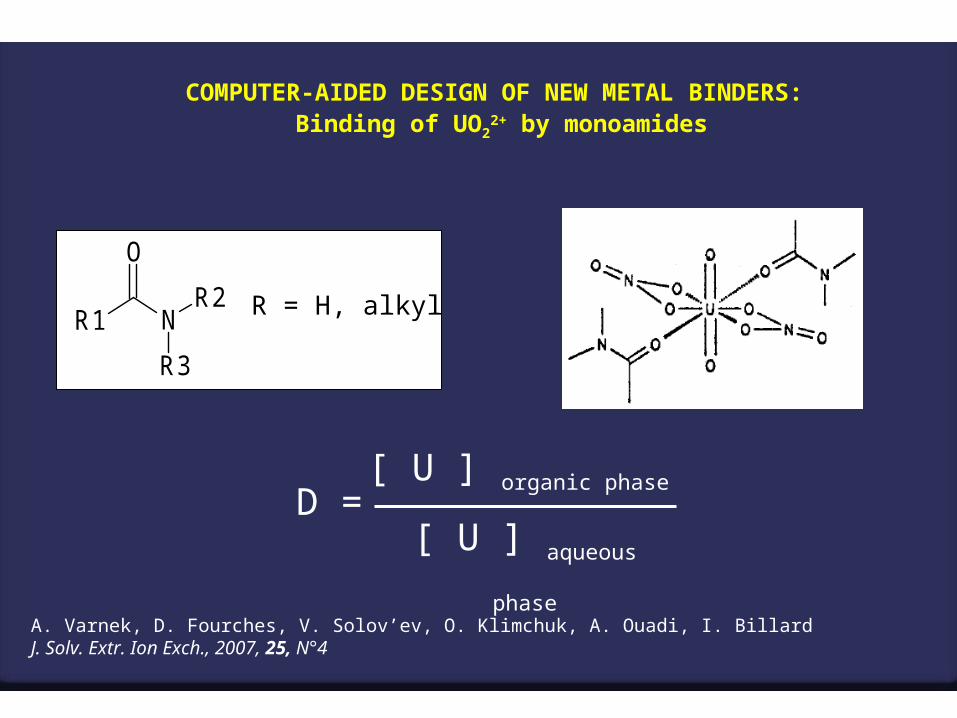
COMPUTER-AIDED DESIGN OF NEW METAL BINDERS: Binding of UO2
2+ by monoamides
R1 NR2
O
R3
R = H, alkyl
A. Varnek, D. Fourches, V. Solov’ev, O. Klimchuk, A. Ouadi, I. Billard J. Solv. Extr. Ion Exch., 2007, 25, N°4
D =[ U ] organic phase
[ U ] aqueous phase
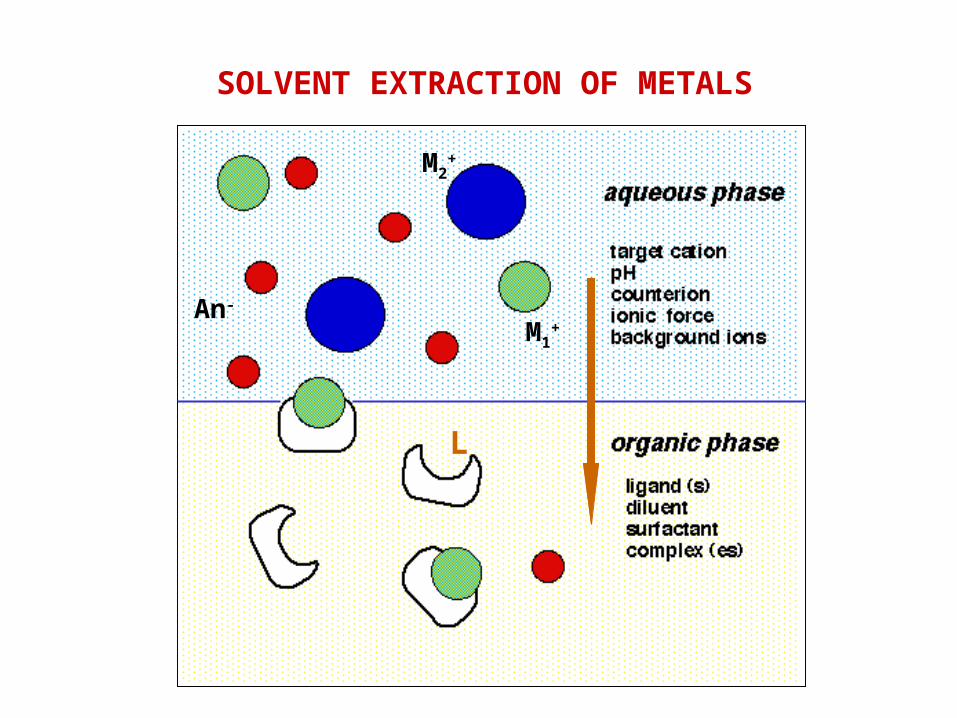
SOLVENT EXTRACTION OF METALS
M1+
M2+
An-
L
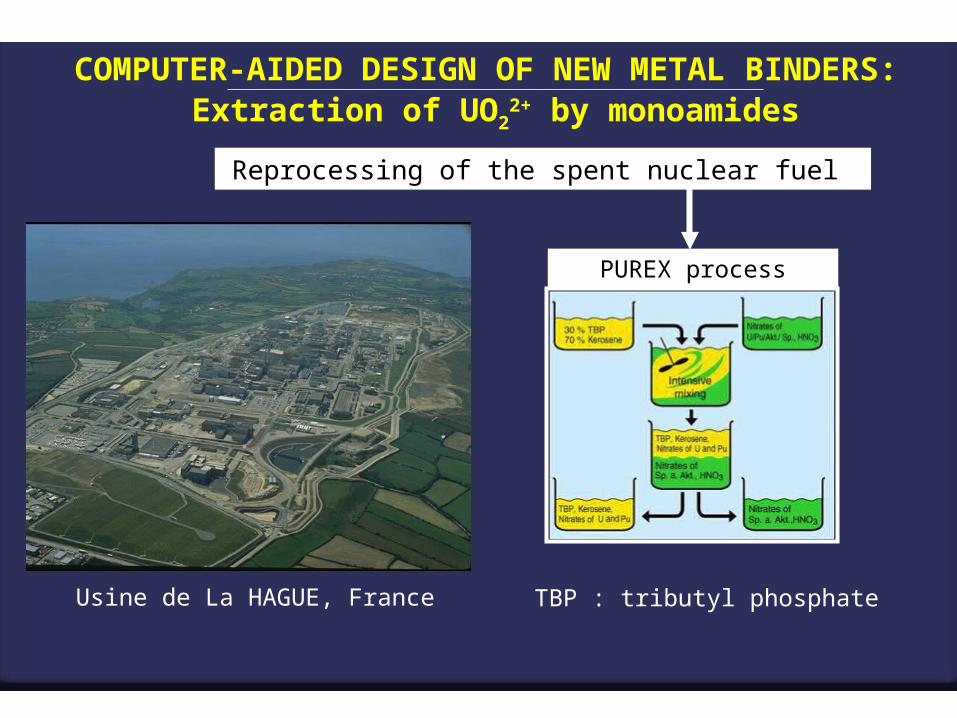
COMPUTER-AIDED DESIGN OF NEW METAL BINDERS: Extraction of UO2
2+ by monoamides
Usine de La HAGUE, France
Reprocessing of the spent nuclear fuel
PUREX process
TBP : tributyl phosphate
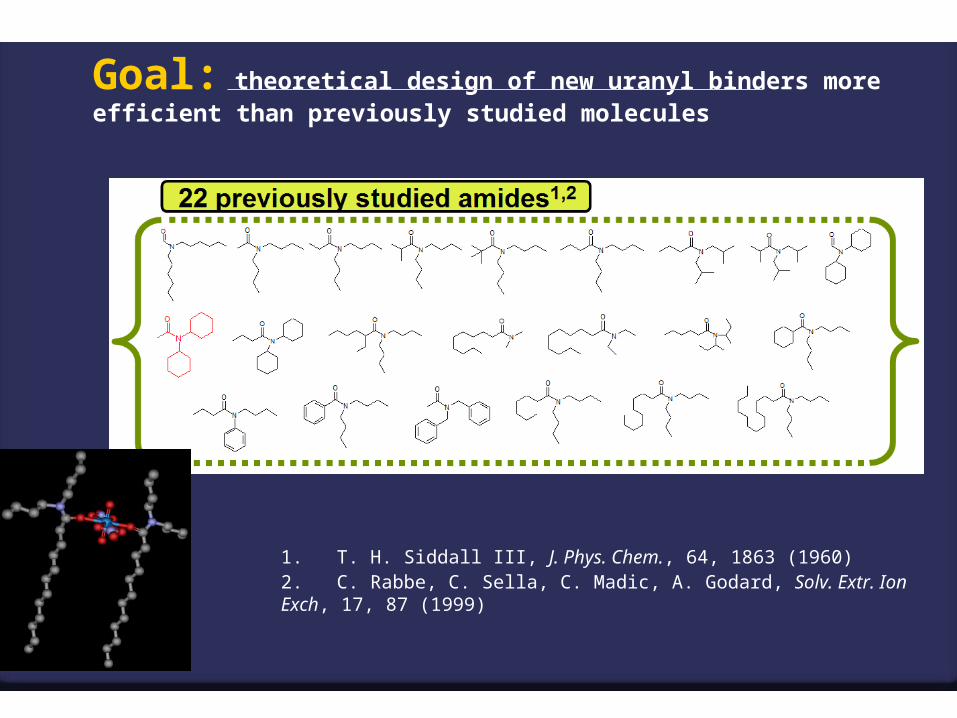
1. T. H. Siddall III, J. Phys. Chem., 64, 1863 (1960)2. C. Rabbe, C. Sella, C. Madic, A. Godard, Solv. Extr. Ion Exch, 17, 87 (1999)
Goal: theoretical design of new uranyl binders more efficient than previously studied molecules
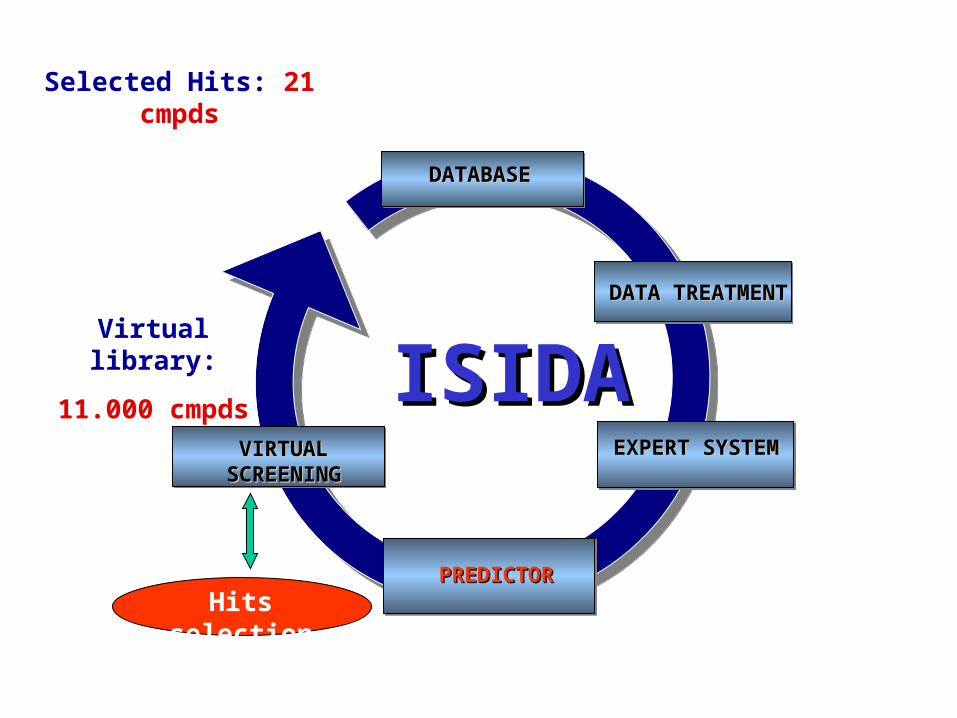
Selected Hits: 21 cmpds
EXPERT EXPERT SYSTEMSYSTEM
DATABASEDATABASE
DATA TREATMENTDATA TREATMENT
PREDICTORPREDICTOR
VIRTUAL VIRTUAL SCREENINGSCREENING
Hits selection
ISIDAISIDAVirtual library:
11.000 cmpds
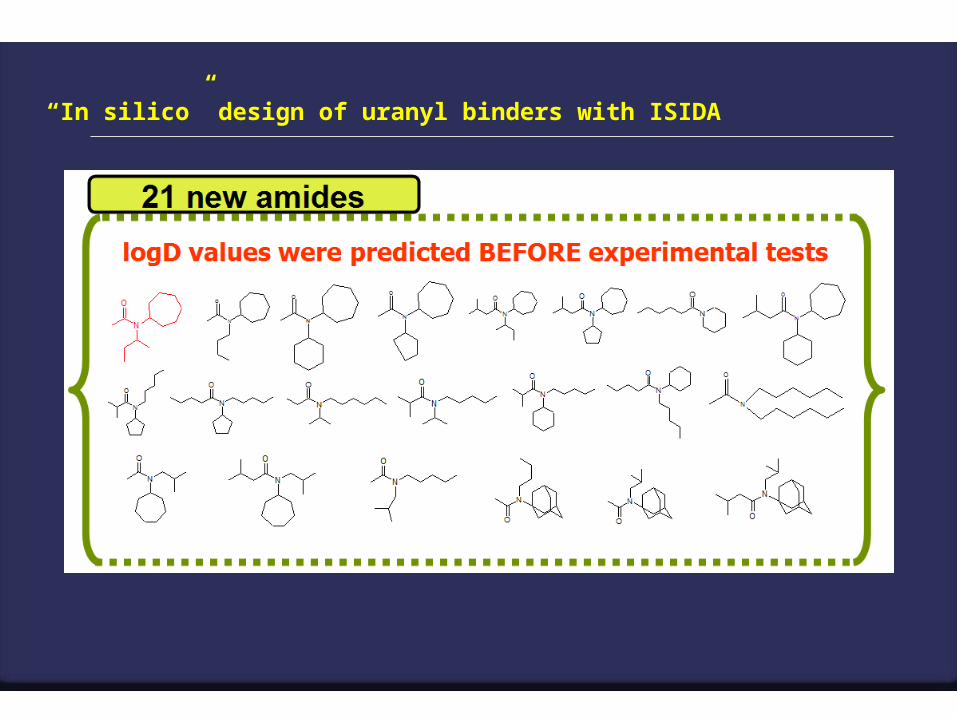
“In silico” design of uranyl binders with ISIDA
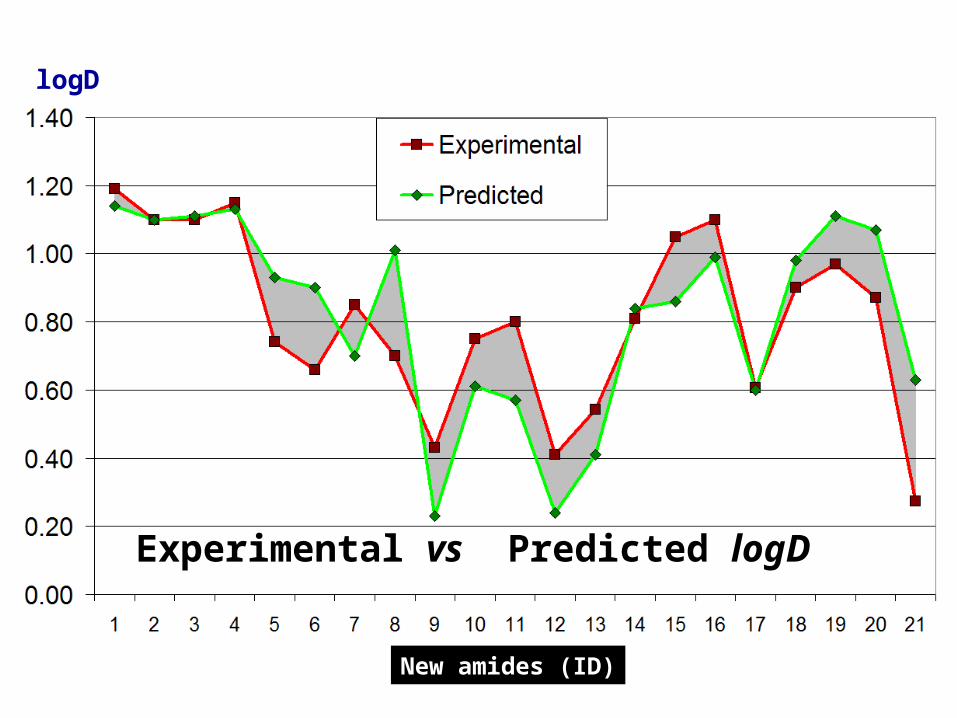
New amides (ID)
logD
Experimental vs Predicted logD
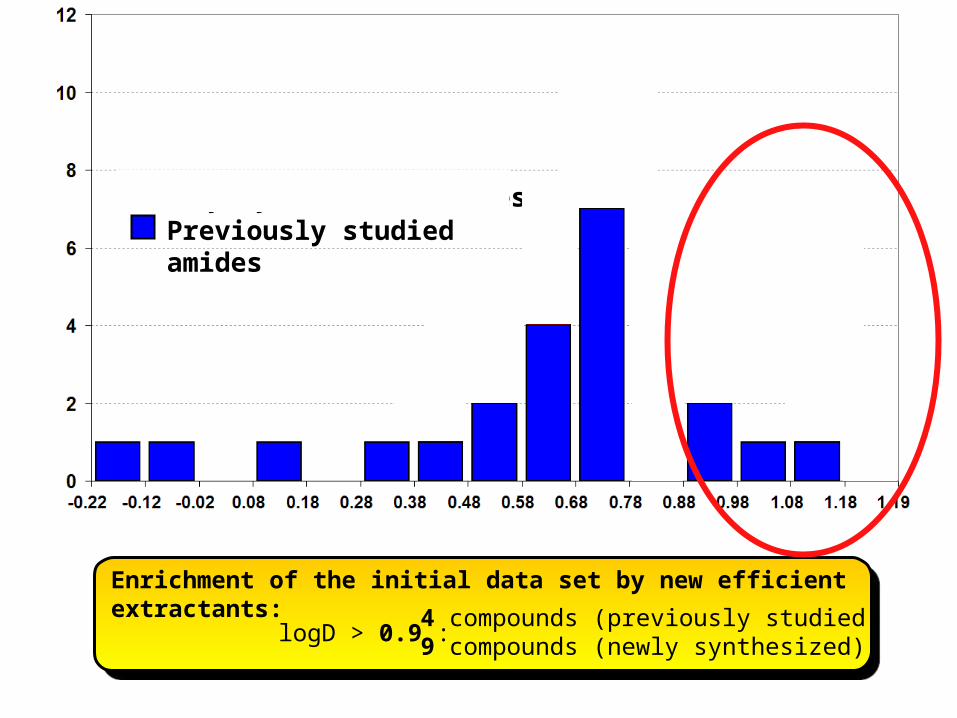
logD
Nu
mb
er
of
com
pou
nd
s
Previously studied amidesNewly synthesized amides
4 compounds (previously studied)9 compounds (newly synthesized)
Enrichment of the initial data set by new efficient extractants:
logD > 0.9 :

Classification Models
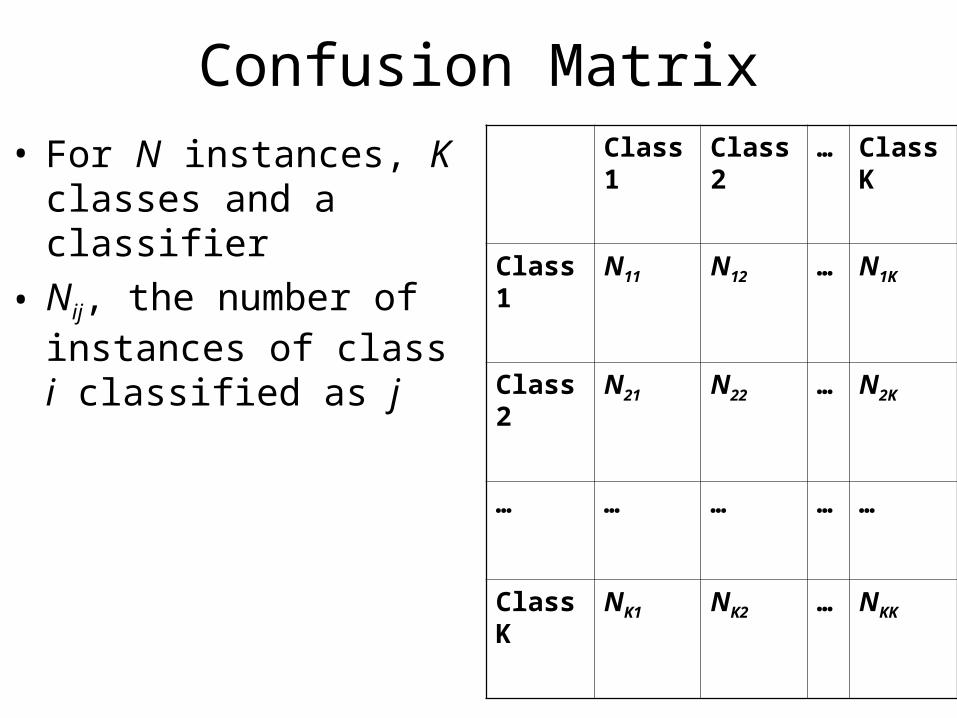
Confusion Matrix• For N instances, K classes
and a classifier
• Nij, the number of instances of class i classified as j
Class1 Class2 … ClassK
Class1 N11 N12 … N1K
Class2 N21 N22 … N2K
… … … … …
ClassK NK1 NK2 … NKK
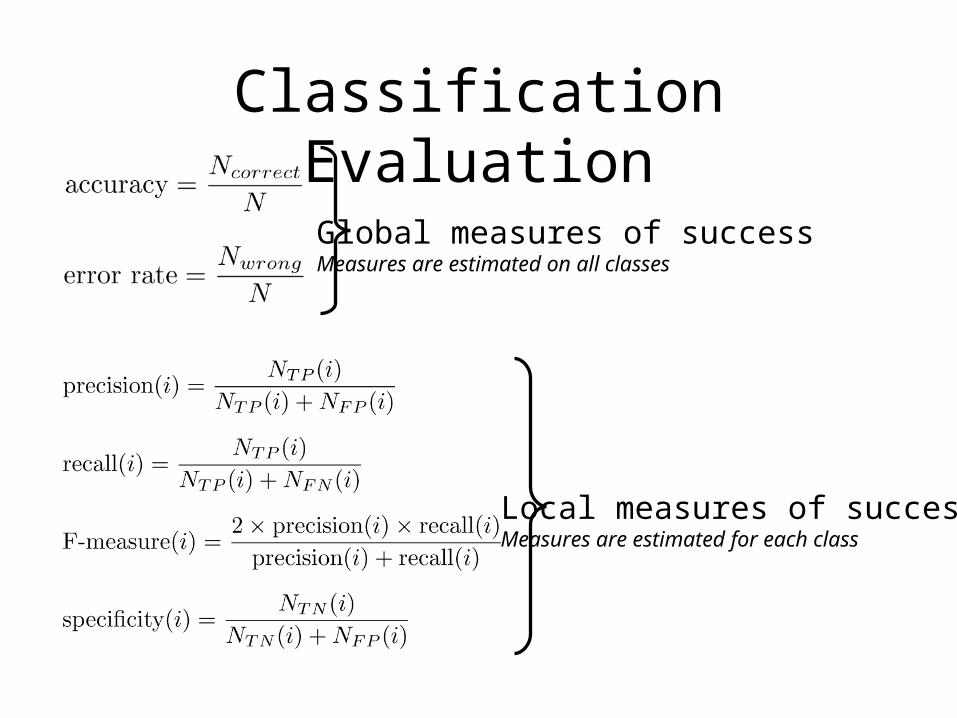
Classification Evaluation
Global measures of successMeasures are estimated on all classes
Local measures of successMeasures are estimated for each class

The most fundamental and lasting objective of synthesis is not
production of new compounds but production of properties
George S. HammondNorris Award Lecture, 1968


