A validated stability-indicating thin-layer chromatographic (TLC) method of the analysis of azithromycin (AZT) in bulk and capsule forms is developed. Both AZT potential impurity and degradation products can be selectively and accurately estimated in both raw material and product onto one precoated silica-gel TLC plate 60F254. The development system used is n-hexane–ethyl acetate–diethylamine (75:25:10, v/v/v). The separated bands are detected as brown to brownish red spots after spraying with modified Dragendorff’s solution. The R f values of AZT, azaerythromycin A, and the three degradation products are 0.54, 0.35, 0.40, 0.20, and 0.12, respectively. The optical densities of the separated spots are found to be linear in proportion to the amount used. The stress testing of AZT shows that azaerythromycin A is the major impurity and degradation product, accompanied by three other unknown degradation products. The stability of AZT is studied under accelerated conditions in order to provide a rapid indication of differences that might result from a change in the manufacturing process or source of the sample. The forced degradation conditions include the effect of heat, moisture, light, acid–base hydrolysis, sonication, and oxidation. The compatibility of AZT with the excipients used is also studied in the presence and absence of moisture. The amounts of AZT and azaerythromycin A are calculated from the corresponding linear calibration curve; however, the amounts of any other generated or detected unknown impurities are calculated as if it were AZT. This method shows enough selectivity, sensitivity, accuracy, precision, linearity–range, and robustness to satisfy Federal Drug Administration/International Conference of Harmonization regulatory requirements. The method developed can also be used for the purity testing of AZT raw material and capsules, content uniformity testing, dissolution testing, and stability testing of AZT capsules. The potential impurity profiles of both active AZT material and capsule forms are found comparable. The linear range of AZT is between 5 and 30 mcg/spot with a limit of quantitation of 2 mcg/spot. The intraassay relative standard deviation percentage is not more than 0.54%, and the day-to-day variation is not more than 0.86%, calculated on the amounts of AZT RS recovered using different TLC plates. Introduction Azithromycin (AZT) (Figure 1) is a subclass of macrolide antibiotics. Physically, AZT as a dihydrate is a white crystalline powder. AZT in an aqueous or chloroform solution has insignif- icant UV absorption properties; also, it is very difficult to find a suitable active reagent to enhance its UV absorptivity with no byproducts or degradation of the intact compound. Attention should also be paid to the fact that AZT dihydrate–acidic solu- tion is rapidly decomposed via intramolecular dehydration to form erythromycin-6,9-hemiketal and then anhydroery- thromycin (1). Therefore, United States Pharmacopoeia (USP) 24 and most plasma work have used high-performance liquid chromatographic (HPLC) methods and tracing with electro- chemical detectors (2,3). This official method depends pri- marily on the liability of certain reaction centers of AZT to oxidation without sample pretreatment. Alternatively, only one Abstract Alaa Khedr and Mahmoud Sheha Faculty of Pharmacy, Assiut University, Assiut, Egypt Reproduction (photocopying) of editorial content of this journal is prohibited without publisher’s permission. 10 Journal of Chromatographic Science, Vol. 41, January 2003 Quantitative Thin-Layer Chromatographic Method of Analysis of Azithromycin in Pure and Capsule Forms Figure 1. Azithromycin dihydrate (C 38 H 72 N 2 O 12 • 2 H 2 O, fw = 785.0): (2R,3S,4R,5R,8R,10R,11R,12S,13S,14R)-13-[(2,6-dideoxy-3-C-methyl-3- O-methyl- α- L-ribo-hexopyranosyl)oxy]-2-ethyl-3,4,10-trihydroxy- 3,5,6,8,10,12,14-heptamethyl-11-[[3,4,6-trideoxy-3-(dimethylamino)- α-D- xylo-hexopyranosyl]oxy]-1-oxa-6-azacyclopentadecan-15-one. Downloaded from https://academic.oup.com/chromsci/article/41/1/10/374909 by guest on 26 December 2021
Transcript
A validated stability-indicating thin-layer chromatographic (TLC)method of the analysis of azithromycin (AZT) in bulk and capsuleforms is developed. Both AZT potential impurity and degradationproducts can be selectively and accurately estimated in both rawmaterial and product onto one precoated silica-gel TLC plate60F254. The development system used is n-hexane–ethylacetate–diethylamine (75:25:10, v/v/v). The separated bands aredetected as brown to brownish red spots after spraying withmodified Dragendorff’s solution. The Rf values of AZT,azaerythromycin A, and the three degradation products are 0.54,0.35, 0.40, 0.20, and 0.12, respectively. The optical densities of theseparated spots are found to be linear in proportion to the amountused. The stress testing of AZT shows that azaerythromycin A isthe major impurity and degradation product, accompanied bythree other unknown degradation products. The stability of AZT isstudied under accelerated conditions in order to provide a rapidindication of differences that might result from a change in themanufacturing process or source of the sample. The forceddegradation conditions include the effect of heat, moisture, light,acid–base hydrolysis, sonication, and oxidation. The compatibilityof AZT with the excipients used is also studied in the presence andabsence of moisture. The amounts of AZT and azaerythromycin Aare calculated from the corresponding linear calibration curve;however, the amounts of any other generated or detectedunknown impurities are calculated as if it were AZT. This methodshows enough selectivity, sensitivity, accuracy, precision,linearity–range, and robustness to satisfy Federal DrugAdministration/International Conference of Harmonizationregulatory requirements. The method developed can also be usedfor the purity testing of AZT raw material and capsules, contentuniformity testing, dissolution testing, and stability testing of AZTcapsules. The potential impurity profiles of both active AZTmaterial and capsule forms are found comparable. The linearrange of AZT is between 5 and 30 mcg/spot with a limit ofquantitation of 2 mcg/spot. The intraassay relative standarddeviation percentage is not more than 0.54%, and the day-to-dayvariation is not more than 0.86%, calculated on the amounts ofAZT RS recovered using different TLC plates.
Introduction
Azithromycin (AZT) (Figure 1) is a subclass of macrolideantibiotics. Physically, AZT as a dihydrate is a white crystallinepowder. AZT in an aqueous or chloroform solution has insignif-icant UV absorption properties; also, it is very difficult to finda suitable active reagent to enhance its UV absorptivity with nobyproducts or degradation of the intact compound. Attentionshould also be paid to the fact that AZT dihydrate–acidic solu-tion is rapidly decomposed via intramolecular dehydration toform erythromycin-6,9-hemiketal and then anhydroery-thromycin (1). Therefore, United States Pharmacopoeia (USP)24 and most plasma work have used high-performance liquidchromatographic (HPLC) methods and tracing with electro-chemical detectors (2,3). This official method depends pri-marily on the liability of certain reaction centers of AZT tooxidation without sample pretreatment. Alternatively, only one
Abstract
Alaa Khedr and Mahmoud ShehaFaculty of Pharmacy, Assiut University, Assiut, Egypt
Reproduction (photocopying) of editorial content of this journal is prohibited without publisher’s permission.10
Journal of Chromatographic Science, Vol. 41, January 2003
Quantitative Thin-Layer Chromatographic Method ofAnalysis of Azithromycin in Pure and Capsule Forms
Journal of Chromatographic Science, Vol. 41, January 2003
11
publication has described a precolumn derivatization proce-dure of AZT with 9-fluorenylmethyloxycarbonyl chloride toyield a stoichiometric amount of fluorescence derivative forseparation by an HPLC method (4). This method depends onthe stoichiometric reactivity of the five hydroxyl groups withthe reagent.However, the spectrophotometric method described by
Bebawy et al. (5) using 7,7',8,8'-tetracyanoquinodimethane isbased on the measurement of the charge–transfer complex. Allof these methods are not described as stability indicating. How-ever, the USP 24 assay method described azaerythromycin A asthe only potential impurity expected in the bulk material. Inorder to estimate the shelf life, the suitability of the packagingmaterial, the compatibility with the combined excipients, orthe validation of batch processing, a well-validated stabilityindicating assay method should be used.In order to meet the regulatory guidance of the Federal
Drug Administration/International Conference of Harmoniza-tion (ICH), the material should be forcibly degraded until10–30% of the major compound degrades (6). The methodshould be able to detect and quantitatively estimate the degra-dation products generated. In this work, a stability-indicatingassay procedure is described to estimate the potential impurityA (azaerythromycin A) and other possible degradation prod-ucts. Also, the compatibility, impurities profile, and applica-bility are investigated. From a regulatory point of view, themethod developed can also be used to fulfill the essential sim-ilarity and drug-development criteria as part of the summaryof product characteristics required by notes to an applicant (7).
Experimental
EquipmentThe UVP scanner and software (GelWorks 1D Advanced Ver-
sion 3.01) were from Ultra Violet Products (Cambridge, U.K.).A test tube atomizer (12 mL) from Desaga GmbH (Wiesloch,Germany) was connected with the positive-pressure outletvalve of a membrane pump. A thin-layer chromatographic(TLC) spotting syringe (25 µL) was obtained from Hamilton(Reno, NV). Nylon-sample filtration discs (0.45 µm) were used.A TLC Tank (standard type) and minivials lined with a silylatedtetrafluoroethylene cap (1 mL) were from Alltech (Deerfield,IL).
MaterialsTLC aluminum sheets precoated with silica gel 60F254 (20
× 20 cm, 0.25-mm layer thickness) were obtained from E.Merck (Darmstadt, Germany). HPLC-grade solvents and otherchemicals were of analytical grade. AZT dihydrate RS andazaerythromycin A (impurity A) RS were from USP RS(Rockville, MD). AZT dihydrate active in bulk was a freesample from Orchid Chemicals and Pharmaceutical (Chennai,India). Zithromax (250-mg capsules, batch no. 9114) (Pfizer,Cairo, Egypt) and Azalid (250-mg capsules, pilot batch) (T3AIndustrial, Assiut, Egypt) were obtained directly from themanufacturer.
ChromatographyPreparation of developing systemA mixture of n-hexane (75 mL), ethyl acetate (25 mL), and
99% diethylamine (10 mL) was prepared and 50 mL of thismixture was poured into a TLC tank. The tank was then cov-ered with a lined lid and presaturated with the solvent vaporsystem for at least 30 min at room temperature before use.
LoadingThe samples were applied to the marked start edge of the
TLC plate (1.5-cm height) using the specified TLC–Hamiltonglass syringe (25-µL capacity). The sample volumes for theassay experiments were 10 µL, and the volumes spotted for thepurity or stability testing were 20 µL. The plate was thenallowed to air-dry for 10 min and then inserted into the TLCtank for development. The TLC plate was developed for no lessthan a 15-cm migration distance of the solvent from the startline.
Preparation of detection reagentForty grams of potassium iodide was dissolved in 100 mL of
water (solution 1), and approximately 850 mg of bismuth sub-nitrate was dissolved in 50 mL glacial acetic acid (20% inwater) (solution 2). Five grams of sodium nitrite was dissolvedin 100 mL water (solution 3). Immediately before use, a mix-ture of 10 mL of solution 1, 10 mL of solution 2, and 20 mL ofglacial acetic acid was prepared and diluted to 100 mL withwater in a 100-mL volumetric flask (Dragendorff’s reagent)(solution 4).After drying the developed TLC plate (at room temperature
for approximately 20 min), the detection reagent (solution 4)was sprayed (~ 8 mL was consumed), the plate was air-dried for10 min, and then the plate was sprayed with solution 3 (5%sodium nitrite). The entire plate was turned a brown color.The plate was allowed to air-dry for no less than 30 min at
room temperature. The plate was then scanned and integratedto allow lanes and bands identification and quantitation. Thescanning and data integration were performed by using a Gel-works 1D UVP instrument. The concentrations of the elutedspots were correlated to the light intensity (pixels).
ProcedureStandard preparation of AZT RS solutionApproximately 52.4 mg of AZT dihydrate USP RS was accu-
rately weighed into a 25-mL volumetric flask. It was then dis-solved and diluted to the mark with dichloromethane (2 µg/µLas AZT).
Standard solution of azaerythromycin AApproximately 20 mg of azaerythromycin A was accurately
weighed into a 25-mL volumetric flask. It was then dissolvedand diluted to volume with dichloromethane (0.8 µg/µL).AZT sample solutions for assay were prepared as described
under standard preparation (0.8 µg/µL).
Sample solution for purity testingApproximately 262 mg of AZT dihydrate (equivalent to 250
mg AZT) was accurately weighed and dissolved in 5 mL
Dow
nloaded from https://academ
ic.oup.com/chrom
sci/article/41/1/10/374909 by guest on 26 Decem
ber 2021
Journal of Chromatographic Science, Vol. 41, January 2003
12
dichloromethane into a 5-mL volumetric flask (1 mg/20 µL).
Zithromax (250-mg capsule solution)The content of one capsule was transferred into a 5-mL vol-
umetric flask. An aliquot of approximately 4 mL dichloro-methane was then added and the flask shaken forapproximately 2 min. It was then diluted to the mark with thesame solvent. The contents of the flask were filtered withsyringe filtration disks (0.45 µm) (solution 5).An accurate volume of 20 µL was then applied to the TLC
plate for purity testing (1 mg/spot).Two milliliters of solution 5 was then further diluted to
yield a claimed concentration of 2 mg/mL of AZT. An accuratevolume of 10 µL of this later solution was applied to the TLCfor assay of 250-mg capsules of Zithromax.
Standard calibration of AZT solutionFive concentration levels of AZT USP RS were prepared in
dichloromethane. A 10-µL volume of each level was applied tothe TLC plate (5, 10, 15, 20, and 30µg/spot).
Forced degradationBoilingA sample solution of AZT for purity testing (1 mg/20 µL) was
prepared in water, and 1 mL of this solution was heated to100°C in capped minivials inserted in a temperature-controlledblock heater for 30 min. The vials were cooled before opening,and a volume of 20 µL was applied to the TLC plate (equivalentto 1 mg AZT/spot) in order to estimate and detect the degra-dation products generated. Another portion of the boiledsample solution was diluted to yield a claimed concentration of20 µg/spot of AZT. This was to estimate the remaining amountsof the intact drug.
Acid and alkali hydrolysis of AZTA sample solution of AZT (150 mg/mL) was prepared in
dichloromethane. In a minivial, an equivalent volume (0.2 mLeach) of this latter solution was mixed with 0.05N hydrochloricacid. In another vial the same concentration of AZT using anequivalent volume of 1N sodium hydroxide was prepared. In bothcases, the prepared solution was heated at 60°C for 30 min withintermittent shaking. The samples were cooled to room temper-ature, neutralized with an amount of acid or base equivalent tothat previously added, and 20 µL was applied to the TLC plate(the claimed AZT concentration is 1 mg/spot). Furthermore, aportion of both solutions was diluted to get a claimed concen-tration of 20 µg/10 µL, and a 10-µL volume of the sample wasloaded to estimate the remaining amounts of the intact drug.
OxidationAn aliquot of 0.2 mL of an AZT sample solution (150 mg/mL
prepared in CH2Cl2) was mixed with 0.4 mL of a hydrogenperoxide solution (10%) in a minivial capped and heated at60°C for 30 min with intermittent shaking. A volume of 20 µLwas applied to the TLC plate.
SonicationA sample solution of AZT for purity testing (1 mg/20 µL) was
prepared in water, and 5 mL of this solution was sonicated inan ultrasonic bath for 30 min (47 kHz). A volume of 20 µL wasapplied to the TLC plate.
Heating of 250-mg capsules of ZithromaxTwo glass vials were used, each containing a content of one
250-mg capsule of Zithromax. One was mixed with 10 µL ofwater. Both vials were capped tightly and allowed to stand in aheating incubator at 60°C for 14 days. The vial contents wereextracted by dichloromethane, filtered with syringe filtrationdisks, and diluted to obtain a claimed concentration of 1 mg/20µL AZT. A volume of 20 µL was applied to the TLC plate. Thesame procedure was repeated but using 250 mg Azalid.In all of the stress cases, the same plate included the other
reference spots at three levels within the calibration curve (5,10, and 25 µg/spot) in addition to the spot of azaerythromycinA (8 µg/spot). The plate was then allowed to air-dry for 10 minbefore the development. After development, the plate was thenallowed to dry, sprayed with both developed reagents (solution4 and solution 3 as described previously), and the detectedspots evaluated by using the UVP instrument. The gray scanand one-dimensional mode was applied. The spot lanes andbands were defined, detected, and integrated quantitatively.
Results and Discussion
AZT has insignificant UV absorbance even in high concen-tration. Therefore, this work was designed to separate AZTfrom its possible degradation products or its potential impuri-ties. We went through three phases to achieve our goals, whichwere the development and optimization, validation, and applic-ability of the method. Several mobile systems were tried; how-ever, a suitable separation of AZT on a TLC plate could best beachieved by using a development system as described in the“Experimental” section. In order to detect the eluted spots,freshly prepared Dragendorff’s reagent was sprayed on the air-dried plate. Upon using this reagent the spots corresponded toAZT only, were colored orange, and rapidly faded to colorlessbands. After spraying with Dragendorff’s reagent (solution 4)and re-drying the plate, a solution of 5% sodium nitrite wassprayed. The plate then became fully brown as a result of theregeneration of iodine. After standing at room temperaturefor approximately 30 min, a brown band corresponding to AZTand any degradation products persisted on the plate with alight yellow background. The separated spots were almost cir-cular with no tailing, which allowed for the accurate mea-suring of the Rf value. The validity of this procedure was testedfor the following parameters: limit of detection (LOD), limit ofquantitation (LOQ), linearity, range, precision, accuracy, selec-tivity, robustness, ruggedness, and sample solution stability.Before starting the evaluation of the separated bands, the fol-
lowing steps have to be followed in order to get an accuraterepresentative chromatogram using Gelworks UVP 1D soft-ware: (a) open the Gelworks 1D software and download thescan of TLC as a new file, (b) start to assign a lane for each bandpathway, (c) start band detection, (d) remove the background
Dow
nloaded from https://academ
ic.oup.com/chrom
sci/article/41/1/10/374909 by guest on 26 Decem
ber 2021
in order to get an accurate start and end of each band, (e) theobtained chromatogram can then be evaluated quantitatively,(f) assign standard spot band and define both the strength andmeasuring unit and type of quantitation (i.e., linear, nonlinear,or matching), and (g) use the calibration curve generated inorder to calculate all other unknown or unmatched bands thatwere detected.
Linearity and rangeThe results obtained revealed a good linear calibration fit
between the band volume (concentration in micrograms) andlight intensity as pixels (raw volume) in the range of 5 to 30µg/spot. The calibration curve was generated automaticallyonce the method of calculation was defined (Figure 2). The cal-ibration equation calculated was:
y = 7.79E–005x + 0.05944 Eq. 1
where y is the strength and x corresponds to the band rawvolume (response) with a square regression coefficient valueequal to approximately 0.9957.The calibration curve was valid only for the calculation of an
unknown AZT concentration separated on the same platebecause the brown color of the bands faded proportionally andslowly.
LOD and LOQThe LOD was estimated for nine bands that could be detected
from the TLC background. The LOD found was 0.3 µg/spot.
However, the lower LOQ was estimated after the spotting ofAZT RS (1.0 µg/spot) nine times and calculation of the relativestandard deviation (RSD) value of the response (raw volume).The RSD value of the band raw volume was no more than 3%.The LOD value of azaerythromycin A was 1.4 µg/spot, and theLOQ was estimated on the basis of the expected maximumlimit (which was 0.8%) to correspond with 8 µg/spot (Table I).
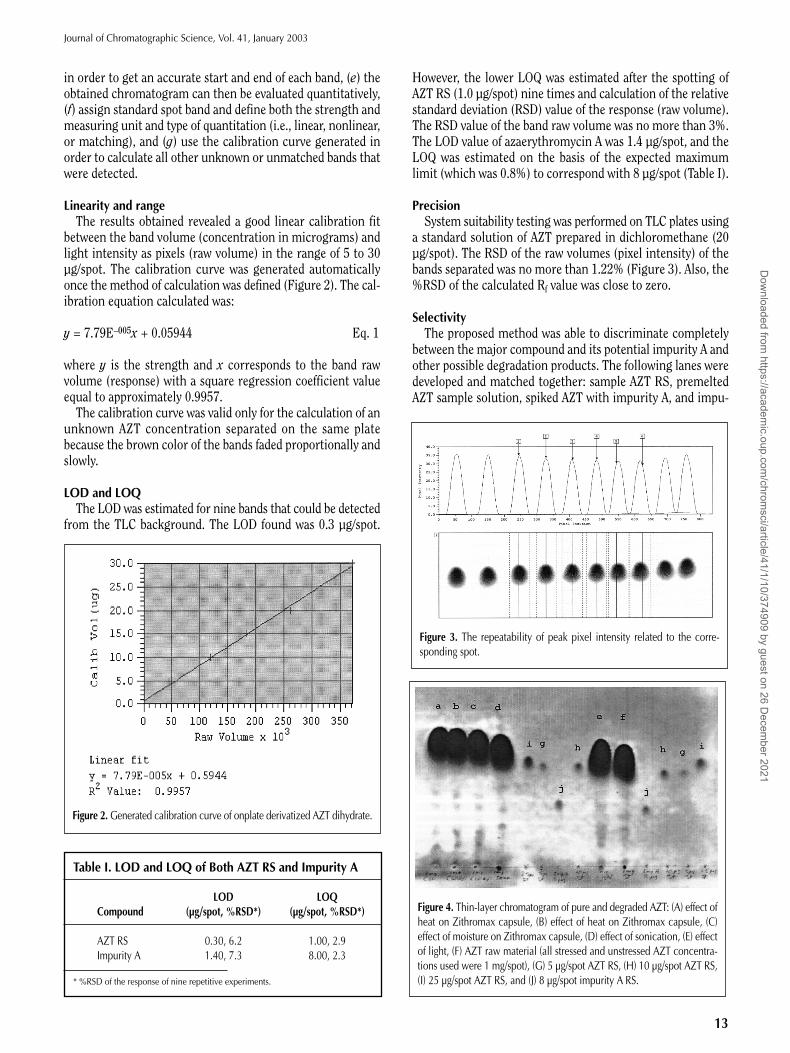
PrecisionSystem suitability testing was performed on TLC plates using
a standard solution of AZT prepared in dichloromethane (20µg/spot). The RSD of the raw volumes (pixel intensity) of thebands separated was no more than 1.22% (Figure 3). Also, the%RSD of the calculated Rf value was close to zero.
SelectivityThe proposed method was able to discriminate completely
between the major compound and its potential impurity A andother possible degradation products. The following lanes weredeveloped and matched together: sample AZT RS, premeltedAZT sample solution, spiked AZT with impurity A, and impu-
Journal of Chromatographic Science, Vol. 41, January 2003
13
Figure 2. Generated calibration curve of onplate derivatized AZT dihydrate.
Table I. LOD and LOQ of Both AZT RS and Impurity A
LOD LOQCompound (µg/spot, %RSD*) (µg/spot, %RSD*)
AZT RS 0.30, 6.2 1.00, 2.9Impurity A 1.40, 7.3 8.00, 2.3
* %RSD of the response of nine repetitive experiments.
Figure 3. The repeatability of peak pixel intensity related to the corre-sponding spot.
Figure 4. Thin-layer chromatogram of pure and degraded AZT: (A) effect ofheat on Zithromax capsule, (B) effect of heat on Zithromax capsule, (C)effect of moisture on Zithromax capsule, (D) effect of sonication, (E) effectof light, (F) AZT raw material (all stressed and unstressed AZT concentra-tions used were 1 mg/spot), (G) 5 µg/spot AZT RS, (H) 10 µg/spot AZT RS,(I) 25 µg/spot AZT RS, and (J) 8 µg/spot impurity A RS.
Dow
nloaded from https://academ
ic.oup.com/chrom
sci/article/41/1/10/374909 by guest on 26 Decem
ber 2021
rity A RS. The strength of all sampleswas 1 mg/spot, and impurity A RSloading was 8 µg/spot. The same chro-matographic profile of the degradationproducts of the stressed AZT wasobtained in order to confirm methodselectivity.
AccuracyFive concentration levels of AZT RS
(including LOQ) were prepared andanalyzed by the proposed method andcalculated from the calibration curvederived on the same TLC plate.Because the recovered amounts of AZTRS were within the acceptable range of100% ± 5% of the claimed amount, themethod was deemed to be accurate(Table II).
RobustnessIn order to measure the extent of the
method robustness, the most criticalparameters were interchanged whilekeeping the other parametersunchanged, and in parallel the chro-matographic profile was observed andrecorded. The chromatographic para-meters (including spot area, rawvolume, migration distance, and reso-lution of the intact drug from its degra-dation products) were observed. Theparameters interchanged (in the rangeof 10%) were included as well as thecomposition of the mobile system alter-natively, spray amounts of Dragendorff’sreagent, the amount and strength ofsodium nitrite solution, drying time,and drying temperature. The resolutionand detection of the analyzed spot mate-rial was relatively acceptable in all con-ditions, except that the drying timeshould be adequate before development,derivatization, and scanning. Also, theplate should be left to dry in the open airat room temperature without anyheating. If the plate were to be heated inan oven at approximately 40°C, the spotcolor and background will fade, butnonproportionally.
RuggednessThe ruggedness of the method was
evaluated by applying the analysis ofZithromax capsule solutions using twodifferent TLC plates from two differentmanufacturers [Merck and Fluka
Journal of Chromatographic Science, Vol. 41, January 2003
14
Table II. Accuracy of the Developed Method Using AZT RS
Spiked concentration Measured concentration*(µg/spot) (µg/spot, mean ± SD) %RSD %Deviation†
* Mean of 3 experiments.† %Deviation = [(spiked concentration – mean measured concentration) × 100] / spiked concentration.
Figure 5. Representative one-lane chromatogram of forced degraded AZT (effect of sonication): (A)AZT, (B) unknown impurity, (C) degradation product matched with impurity A, and (D) unknownimpurity.
Figure 6. Linear calibration curve of AZT (A), and one-level calibration fit of standard impurity A (B). Thedata of both curves were retrieved from the same TLC plate.
Dow
nloaded from https://academ
ic.oup.com/chrom
sci/article/41/1/10/374909 by guest on 26 Decem
ber 2021
Journal of Chromatographic Science, Vol. 41, January 2003
15
Chemie GmbH (Reisenhofen, Germany)] of different layerthicknesses (0.25 and 0.20 mm). Both plates yielded the sameresolution efficiency and Rf values; however, the thinner-layerplate required a longer time for the solvent to reach the markedfront. A compact band zone without tailing was observed inboth cases.The percentage recoveries of the capsule content using two
different TLC plates were found comparable (~ 100% ± 1.5%).Awareness should be paid to the amount of samples deliveredfrom the spotting syringe because this step expresses the mate-rial concentration. A calibrated autospotting device could beuseful to avoid sample volume variation. However, the loadedvolume area variation did not make any difference in theresults.
Sample solution stabilityAs per the experimental procedure described, the develop-
ment of approximately 20 samples on one plate will consumeapproximately 30 min, which is not enough time to allow formuch material degradation. The proposed procedure did notshow any degradation products resulting from experimentalerror or run time. However, freshly prepared samples wereused within 2 h, and the sample solutions should not beallowed to stand until analysis.
Forced degradation of AZTA working standard of AZT was used for this study. This
was to confirm that the proposed method was able to detectand analyze the major compound in the presence of anypossible degradation product or in-process impuritiesresulting from the manufacturing procedure. Both rawmaterial and capsule form were included in this study. Arelatively high concentration of AZT was prepared indichloromethane or water, following the stress conditionsapplied. As described in the “Experimental” section, differentstress cases were applied in order to include the effect ofboiling, heat, acid, base hydrolysis, sonication, oxidation,and excipient compatibility with the drug. A chromatogramof stressed samples illustrated in Figure 4 shows that the
degradation products and impurity profiles in all cases weresimilar with the complete separation of degradation productsfrom the major drug spot. In order to estimate the unknowndegradation products, a three-point calibration curve wasused on the same plate. Also, in order to estimate the knownimpurity (azaerythromycin A), one level concentration wasused to estimate the matched detected impurity A releasedfrom the raw material or product. Figure 5 is an example ofhow to detect and evaluate the one-lane degradation profile.Also, as in Figure 6, the calibration curves were calculatedon the same plate. From this investigation, it was clear thatAZT was very sensitive toward acid, and if the hydrolysistime or acid strength increased, the entire compound wouldbe completely degraded with no spot corresponding to AZT.In contrast, the compound was relatively stable in an alkalimedium. Table III shows the recovered amounts of impurityA and total impurities in all stress conditions. As per ICHguidelines and drug dose, the limit of impurity A should notbe more than 1% (0.8% was used as an acceptable limit),unknown impurities no more than 0.5%, and total impuri-ties no more than 2.0%.Two strengths of AZT were prepared from the same Zithro-
max and Azalid capsules or raw material stock solutions. Thehigher strength (1 mg/spot) was spotted to evaluate the puritylevel of the sample. However, the diluted solution (20 µg/spot)was spotted to assay the content of material that remained.The stress testing results revealed that AZT was compatible
with the combined excipients and degraded to a limit of nomore than 3.55% for 250-mg capsules of both Zithromax andAzalid.
Conclusion
The method developed was valid for purity testing, a sta-bility-indicating assay, and content-uniformity testing. Also,this method could be used for the quantitation of pure mate-rial and capsule form. The developed method was able to esti-
mate the dissolution profile ofZithromax capsules applying the USPmethod, but using 500 mL dissolutionmedia instead of 900 mL. This methodcould be useful for the study of purematerial and product shelf life. All pro-posed analytical procedures should becompleted at room temperature. This isto avoid inconsistency of the developedbrown color.
Acknowledgments
The authors acknowledge Dr. TarekEl-Hady, chairman of T3A Industrial, forhis encouragement and funding of theproject.
Table III. Calculated Amount Percentages of Impurity A and Total Impurities*
* The amount of total impurities was calculated from the calibration curve of AZT RS, and the amount of impurityA was calculated from the calibration fit of impurity A RS.
Dow
nloaded from https://academ
ic.oup.com/chrom
sci/article/41/1/10/374909 by guest on 26 Decem
ber 2021
Journal of Chromatographic Science, Vol. 41, January 2003
16
References
1. E.F. Fiese and S.H. Steffen. Comparison of the acid stability ofazithromycin and erythromycin A. J. Antimicrob. Chemother.25(suppl. A): 39–47 (1990).
2. United States Pharmacopoeia 24, USP-NF, Rockville, MD, 2000,p. 185.
3. F. Kees, S. Spangler, and M. Wellenhofer. Determination ofmacrolides in biological matrices by high-performance liquidchromatography with electrochemical detection. J. Chromatogr.A 812: 287–93 (1998).
4. J.S. Torano and H.J. Guchelaar. Quantitative determination ofthe macrolide antibiotics erythromycin, roxithromycin,azithromycin and clarithromycin in human serum by high-per-
formance liquid chromatography using pre-column derivatizationwith 9-fluorenylmethyloxycarbonyl chloride and fluorescencedetection. J. Chromatogr. B Biomed. Sci. Appl. 720: 89–97 (1998).
5. L.I. Bebawy, K. el Kelani, L. Abdel Fattah, and A.K. Ahmad. Studyof 7,7’,8,8’-tetracyanoquinodimethane charge transfer complexeswith some lone-pair-donating drugs. J. Pharm. Sci. 86: 1030–33(1997).
6. “Stability Testing of New Active Substances and Medicinal Prod-ucts, ICH Topic Q1A”. ICH Harmonized Tripartite Guidelines.ICH, Surrey, U.K., 1996. CPMP/ICH/280/95.
7. “Eudralex, Notice to Applicants, Medicinal Products for HumanUse”. Presentation and Content of Dossier, October 25, 2001.European Commission, Brussels, Belgium, Vol. 2B.