Quantum simulations of the hydrogen molecule on ammonia clusters Massimo Mella and E. Curotto Citation: J. Chem. Phys. 139, 124319 (2013); doi: 10.1063/1.4821648 View online: http://dx.doi.org/10.1063/1.4821648 View Table of Contents: http://jcp.aip.org/resource/1/JCPSA6/v139/i12 Published by the AIP Publishing LLC. Additional information on J. Chem. Phys. Journal Homepage: http://jcp.aip.org/ Journal Information: http://jcp.aip.org/about/about_the_journal Top downloads: http://jcp.aip.org/features/most_downloaded Information for Authors: http://jcp.aip.org/authors
Transcript
Quantum simulations of the hydrogen molecule on ammonia clustersMassimo Mella and E. Curotto Citation: J. Chem. Phys. 139, 124319 (2013); doi: 10.1063/1.4821648 View online: http://dx.doi.org/10.1063/1.4821648 View Table of Contents: http://jcp.aip.org/resource/1/JCPSA6/v139/i12 Published by the AIP Publishing LLC. Additional information on J. Chem. Phys.Journal Homepage: http://jcp.aip.org/ Journal Information: http://jcp.aip.org/about/about_the_journal Top downloads: http://jcp.aip.org/features/most_downloaded Information for Authors: http://jcp.aip.org/authors
THE JOURNAL OF CHEMICAL PHYSICS 139, 124319 (2013)
Quantum simulations of the hydrogen molecule on ammonia clustersMassimo Mella1,a) and E. Curotto2,b)
1Dipartimento di Scienze ed Alta Tecnologia, Università degli Studi dell’Insubria, via Valleggio 11,22100 Como, Italy2Department of Chemistry and Physics, Arcadia University, Glenside, Pennsylvania 19038–3295, USA
(Received 8 May 2013; accepted 5 September 2013; published online 30 September 2013)
Weak interactions between adsorbed molecules and solidsurfaces, including the ones inside nano-pores or nano-cavities, are at the heart of many possible scientific inter-ests and applications. For instance, spectroscopically study-ing both the surface and adsorbed species may allow a moredetailed characterization of the surface structure and howthe latter facilitates or induces specific reactions. As typi-cal examples, there are the studies on molecular adsorptionon water ice, with H2
1–8 and HX (X = Cl, Br)9–17 beingperhaps the most studied ad-species. Ammonia18 and smallhydrocarbons19 have also been studied for their peculiarity orrelevance. In a few cases, the thrust behind this effort has beenprovided by the need for modeling processes in the interstellarmedium20–23 or in regions of earth atmosphere.24–26
Weak surface-small molecule interactions are also fun-damental in separation science. For example, isotopic sep-aration can be achieved exploiting a chromatographic-likeapproach based on differences in binding energy induced bynuclear spin statistics,2, 3, 5, 27 or intermolecular forces.28, 29 In-terestingly, separation can be kinetically achieved exploitingthe coupling between quantum translational and rotationalmotions.30–33 In the latter case, the effect is magnified bysmall pores and leads to a ramping up of the selectivity toa ratio of 50:1 for the pair T2/H2.31
Weak interactions between gases and nano- or porousmaterials also bear relevance to the development of gas stor-age methods employing mild conditions, the latter require-ment being particularly important for the development of
a)Author to whom correspondence should be addressed. Electronic mail:[email protected]
hydrogen fuel economy and the safe transportation of dan-gerous gasses. Whether inside metal organic frameworks(MOF)28, 34, 35 or in clathrates,36–39 the stored gas must betrapped in liquid or solid phases tuning the balance betweenthe gas–gas and the gas–surface interactions. Thus, material–gas forces must be sufficiently strong to nearly freeze oneor a few gas layers, therefore eliminating the size-dependentchange in melting and boiling points well known in clusterphysics.40, 41
Different from the driving forces that guide the formationof solid materials (see, e.g., the MOF case42), the fundamen-tal rules that govern the effects of the interaction between gasmolecules and material surfaces are far less clear despite afew obvious guidelines based on gas molecular properties.28
This is especially true for quantum species such as H2 andits isotopomers,43 which require an appropriate treatmentfor several juxtaposing effects.2, 3, 5, 27, 30–33, 37, 38, 44 In the con-text just presented, we thus consider interesting to investi-gate the structure and energetics of small and medium sizedH2–(NH3)n aggregates. Apart from the lack of basic in-formation on these systems, which include the generalstudy of the importance of quantum effects in describingmolecular aggregates, there are several interconnected and di-rectly supporting motivations for applying ourselves to thistask:
1. Ammonia ice micro-grains compose clouds in the at-mosphere of several planets and satellites45–47 providingthe mechanical support for chemical reactions involvingmolecular species of several kind (among which H2).
2. Radiation damage of ammonia ice48, 49 may be a directsource of molecular hydrogen as it is methane ice dust,50
a product that can be thermalized and adsorbed on thesurface.
124319-2 M. Mella and E. Curotto J. Chem. Phys. 139, 124319 (2013)
3. Hydrogen atoms may recombine into H2 on the sur-face of ammonia ice, a common species in interstellarspace, as it happens on water ice,51, 52 the detailed under-standing of the possible mechanism requiring energeticsdetails.53
4. Condensed mixtures of ammonia and hydrogenmolecules, whether as clathrates or “slush,” may be use-ful for automotive transportation employing ammoniafueled engines.
5. Since H2 adsorption properties of ammonia ice woulddepend on its surface or micropore morphology as ithappens for water ice,2, 3 a better understanding of theadsorption energy as a function of the surface struc-tural motifs would be useful in interpreting possibleexperiments.
6. H2 tagging can be used as a useful probe of localstructure if the substrate–H2 binding energy is of thecorrect order of magnitude;54 forming mixed H2–NH3
species in cold environment may thus help elucidatingthe structural details of ammonia clusters formed in gasphase55–58 and He droplets.59, 60
Given the items discussed above, the explicit aims of thepresent work are exploring (a) the possible structural effectsof adding a H2 molecule to a (NH3)n, if any, (b) the bindingsites on the cluster surface to understand the relationship be-tween the local features and adsorption binding energy, and(c) the quantum effects intrinsically associated with the libra-tional motion of adsorbed H2. The latter can, in fact, modifythe classical energy landscape.
As the interaction energy between the hydrogen and am-monia molecules is rather small in magnitude compared withthe one between two ammonia molecules,61–63 it has a neg-ligible influence on the internal structure of NH3 and H2.63
This ought to be true also for the structure of ammonia clus-ters, which are held together by stronger intermolecular forcesthan between H2 and ammonia. It is however possible thatthe energy landscape of the mixed clusters does not closelyfollow the one for the pure species, the chance of reorderingbeing high in our case since the pure systems may presentnearly degenerate isomers (vide infra Secs. II B and III A)as suggested in Ref. 64. Thus, our work starts with an exten-sive search of putative global minima from preformed (NH3)n
aggregates (n = 3 − 20) over which H2 lands. This searchis conducted using a fully dimensional (i.e., 5D) rigid-rotorpotential energy surface (PES) and its 3D counterpart, spheri-cally averaged over the orientation of H2.63 A selected subsetof clusters is subsequently simulated to investigate possiblequantum effects. A “vis á vis” comparison of the classicaland quantum results coming from the two PESs would alsoaid in assessing the shortcomings introduced by the sphericalaverage from the quantitative viewpoint.65
II. METHODS
A. Potential energy surfaces
As customary with these kinds of studies, we employ apairwise potential to describe the interaction between the am-monia molecules and the single H2 molecule in our species.
Specifically, we opted for using the PES recently developedby us on the basis of MP4 calculations,63 for which a full5D treatment of the rigid hydrogen molecule, and a rota-tionally averaged 3D version (i.e., assuming uniform spatialorientation for the para-H2) are readily available. As to the3D surface, it is worth mentioning that it represents a point-wise approximation of the true interaction when it is assumedthat the rotational motion of an interacting H2 is identical toits free-rotor (i.e., non-interacting and decoupled) counterpartat any location of its center of mass with respect to NH3.The effect of such approximation has recently become bet-ter quantified,66 so that its impact on the quantum treatmentof the remaining (vibrational) degrees of freedom is now rec-ognized to be in the range of a few cm−1.
The 5D model is built as a sum of four sources forelectrostatic, dispersion, and repulsion interactions on am-monia and one on the hydrogen molecule, each source be-ing described with a short multipolar expansion whose termsare weighted by distance depending exponential terms. Thechoice of a pairwise model is in this case justified by thelow polarizability of the hydrogen molecule (α‖ = 6.383 andα⊥ = 4.577 a.u.67), and thus by the expected small impactof a self-consistent description of the induction approach.68
However, the direct polarization term is effectively introducedby means of the multipolar expansion employed to describethe electrostatic component of the surface. The 5D analyti-cal surface63 presents a global minimum geometry with thehydrogen molecule aligned to the ammonia C3 axis and onthe side of the nitrogen, with a De of roughly 0.7 kcal/mol(245 cm−1). A second minimum (De ∼ 0.26 kcal/mol or92.0 cm−1) is also found on the H-side of ammonia, withthe center of mass of H2 along a N–H vector and its bondaxis being nearly perpendicular to the latter. Upon reducingthe dimensionality of the PES by averaging over a uniformdistribution for the spherical angles (i.e., assuming decou-pling between rotational and intermolecular vibrational mo-tions for para-H2), the energetic ordering is inverted. In fact,the minimum along the N–H vector has a De ∼ 0.18 kcal/mol(63.4 cm−1), while the one along the C3 axis on the N-sidehas a De ∼0.08 kcal/mol (23.7 cm−1). It is also worth remem-bering that there is another minimum for para-H2 along theC3 axis and located on the H-side with De =0.081 kcal/mol(28.3 cm−1). From the data mentioned, it therefore appearsthat the stronger quadrupole–dipole interaction between theH atoms in H2 and the nitrogen accounted for by the 5D sur-face is effectively “washed out” by the rotational average.
To describe the interaction between ammonia molecules,we employed a rigid model including point charges, dis-persion, and repulsion terms on all atoms, as well as aninduction term based on a single-step “charge on spring”(CoS) model.64, 69 This PES, parameterized against extensiveMP2 calculations, has been used previously to study boththe energetics64, 70, 71 and isomer formation probabilities60 ofmedium sized (NH3)n. When compared to BSSE-correctedMP2/aug-cc-pVTZ calculation,72 the polarizable interactionmodel appeared capable of correctly predicting the trend inbinding energy and global minimum structure as a functionof the number of ammonia molecules for (NH3)n (n = 2–5).It also demonstrated the capability of correctly suggesting the
124319-3 M. Mella and E. Curotto J. Chem. Phys. 139, 124319 (2013)
presence of high lying minima never studied previously forn =5 and 6.60 For the sake of the ensuing discussion, wemention that VNH3 (Y1, . . . , Yn) predicts a fragmentation en-ergy De ∼ 2.85 and 9.06 kcal/mol for the ammonia dimer andtrimer, respectively. A vis à vis comparison between these twovalues clearly indicates the substantial many-body nature en-gendered by the single-step CoS induction term.
Employing the aforementioned models, the PES for ageneral H2–(NH3)n system ought to be written as
V (Y1, . . . , Yn, YH2 ) = VNH3 (Y1, . . . , Yn)
+n∑
i=1
VH2−NH3 (Yi , YH2 ), (1)
where VNH3 (Y1, . . . , Yn) is the interaction potential be-tween all the ammonia molecules, VH2−NH3 (Yi , YH2 ) isthe potential between the hydrogen molecule and theith ammonia molecule, Yi ≡ (xi, yi, zi, αi, βi, γi) and YH2
≡ (xH2 , yH2 , zH2 , φ, θ ). Here, the Cartesian coordinates indi-cate the position of the molecular center of mass, while theEuler or polar angles describe the molecular orientation withrespect to the laboratory frame. Importantly, the pairwise na-ture of the ammonia–hydrogen surface, and the single-stepCoS model for induction in VNH3 (Y1, . . . , Yn) allow one toanalytically derive the force vector, which is needed for theenergy minimization employed during the search for putativeglobal minima as a function of n (vide infra Sec. II B).
B. Energy minimization
The structures and energies of the minima for the pureammonia clusters (NH3)2−20 have been determined in ourprevious studies.64, 70 However, the complexity of the po-tential energy surface for the NH3–NH3 interaction createschallenges for the traditional implementation of the geneticalgorithm.73–77 The typical 40 generation with 100 childrenfor generation employed on the dodecamer, for example, isnot sufficient to find the second minimum we had obtainedin our earlier work.70 Therefore, before attempting to mini-mize the full system in Eq. (1), we rerun a parallelized ver-sion of the genetic algorithm on the pure ammonia clusters(NH3)2−20, so that 11 000 children are created and minimizedfor every generation. Two parents are selected using the low-est energy criteria as best fitness, and the children are createdusing a two point crossover operator.76
We use T = 0 Brownian dynamics to minimize the chil-dren using finite differences to estimate the gradient of theLagrangian as we did in earlier work,64 and we end the Brow-nian trajectory when the size of the potential energy gradientis smaller than one part in 107. Notice that at T = 0 there isno stochastic component in the dynamics, making it similarto the steepest descent method with a fixed fractional step-length; thus, the only advantage that comes from the approachused by us for the minimization is related to code availability.Each set of children is added to the pool of parent structures,compared structurally, sorted energetically, and the bottom100 distinct minima in this new list become the parent struc-tures for the new generation. We terminate the search whensuccessive generations yield the same lowest 100 energy
TABLE I. Potential energy Vd0 for the H2–(NH3)n putative global minimum,
the vertical H2 binding energy Dv , the H2 binding energy De with respect tothe parent (NH3)n, and the relaxation energy �r of (NH3)n from the structurein the optimal H2–(NH3)n to its closest minimum. Data obtained using thefull 5D PES for H2–NH3, in cm−1.
levels. We explore several variants on the parallel strategy andgreater detail on the exploration of the bare ammonia clusterspotential energy surface will be the subject of an upcomingpublication where structures for systems as large as (NH3)27
will be presented.The ammonia–hydrogen interaction is significantly
smaller than the ammonia–ammonia interaction. As men-tioned in Sec. I, we expect the hydrogen molecule to onlylightly perturb the structure of the ammonia cluster. There-fore, the strategy we use to explore the minima of the po-tential energy surface in Eq. (1) is slightly different. Assum-ing that the presence of one hydrogen molecule would pro-duce only a perturbation on the structure of the minima ofthe bare system, we search for minima by running trajecto-ries with the hydrogen molecule starting some distance awayfrom a minimum of (NH3)3−20 located at the center of thelaboratory frame. The structures of (NH3)3−20 correspondingto the lowest five energy minima are selected as reasonablestarting points. For each ammonia cluster structure, a total of110 trajectories are started by placing the para-H2 moleculerandomly on a sphere of radius R0 = 14.7 bohrs. For the 5Dhydrogen–ammonia surface, the starting orientation of the hy-drogen molecule is selected randomly, the center of the hy-drogen molecule is placed randomly on a sphere of radiusR0 = 16.7 bohrs, and this process is repeated 110 times aswell. For each trajectory, we seek the nearest minimum byusing T = 0 Brownian dynamics using the same terminatingcriteria as for the pure ammonia systems. The lowest minimafound for each H2–(NH3)3−20 are further quenched by tight-ening the size of the gradient to one part in 108 to produce thevalues of V d
0 in Tables I and II. Additionally, since the globalminimum of the ammonia dodecamer and hexadecamer arehollow cages, we start one trajectory for the full 5D surfaceand one trajectory for the rotationally averaged surface with
124319-4 M. Mella and E. Curotto J. Chem. Phys. 139, 124319 (2013)
TABLE II. Potential energy Vd0 for the H2–(NH3)n putative global mini-
mum, the vertical H2 binding energy Dv , the H2 binding energy De withrespect to the parent (NH3)n, and the relaxation energy �r of (NH3)n fromthe structure in the optimal H2–(NH3)n to its closest minimum. Data obtainedusing the spherically averaged 3D PES for H2–NH3, in cm−1.
the hydrogen in their respective centers. In all our minimasearches, we allow the degrees of freedom of the ammoniacluster to relax and become distorted by the presence of thehydrogen molecule, and we measure the ammonia–ammoniacontribution to the overall potential at the putative global min-ima for each system. The difference between the latter numberand the energy of the global minimum of the bare cluster isthe perturbation energy �r reported in Tables I and II.
C. Quantum simulations
In this work, we employed the diffusion Monte Carlo(DMC) method to investigate the most fundamental quan-tum effects (zero point motion and energy, ZPE) for the titlesystems. The reason for this choice is twofold. First, zero-temperature simulations appear as the most precise approachto investigate potential transferability as they are expected tobe more sensitive to the “wiggles and bumps” of the PES com-pared to path-integral MC (PIMC) due to the exclusion of thethermal effects. Second, the risk of broken ergodicity whilesimulating highly quantum object such as H2 is reduced forDMC compared to PIMC, which would require the use ofvery long “bead and spring” chains to guarantee convergencefor states close to the ground state. Also, the ground state en-ergy E0, which is the negative of the adiabatic dissociation en-ergy D0, would represent better the relative stability of the dif-ferent aggregates and the evolution of the former with respectto the ammonia cluster size. Besides, E0 (or D0) would be thequantity to compare with experimental results on adiabaticdesorption processes. Since DMC methods are well describedin the literature,78, 79 we provide only the details needed to un-derstand the results presented in the following.
In our simulations, H2 is treated as a rigid rotor withantisymmetric nuclear spin pairing (i.e., the para spin isomer
form) when using the 5D PES, or as a point particle whendescribed by the 3D surface. This choice is due to, first,the orders of magnitude difference between vibrational fre-quency of the H2 covalent bond and the rotational constant,and, second, to the possible conversion from ortho-H2 topara-H2 in presence of a spin center. The sufficiently stronginteraction between ammonia and hydrogen molecules allowsus to dispense with the use of a guiding wave function, achoice that is expected to reduce the risk of introducingstructural biases in the sampled ground state wave functionψ0; thus, the branching step during a DMC simulation iscarried out employing the “bare” interaction potential in Eq.(1) as in the original algorithm.78 We take care, however, inminimizing the “step to step” error during simulations68 as-sociated with weight truncation, and employed the symmetricw = exp[−δt{V (Ri) + V (Rf )}/2] form to define the branch-ing weight of each walker. Here, δt is the time step used in thesimulation, whereas V (Ri,f ) is the value of the interactionpotential of the walker before (i) and after (f) the diffusionstep. The diffusion of the H2 center of mass is simulatedsampling Gaussian distributed displacements with varianceδt/m, with m = 3672.4 a.u. being the molecular mass of thehydrogen molecule; the rotational diffusion of H2 needed inthe simulations employing the full 5D ammonia–hydrogenmolecules surface is simulated employing a recently pro-posed algorithm80 capable of reducing the single step errorto second order in the time step δt and third in the curvatureR. This choice guarantees a robust second order error for theaverage potential estimator of E0, which is employed in thiswork due to the absence of the trial wave function.
The simulations are all run using a time step δt =100 a.u.and employing 10 000–20 000 walkers to represent the sam-pled ψ0 in the attempt of minimizing the population bias as-sociated with the finite size ensemble of replicas. To avoid anypossible structural bias due to initial conditions, simulationsare started sampling the location of the center of mass of theH2 molecules randomly inside a cube with side 20–30 bohrs;for the simulations treating explicitly the rotational degrees offreedom of H2, the initial orientation of each molecule is cho-sen sampling a uniform distribution in φ and cos θ . Hydrogenmolecules with too much overlap with ammonia molecules(creating too much repulsion) are discarded automatically bythe DMC simulations when starting the latter with a zero ref-erence energy. To investigate the main characteristics of ψ0,we opted for visualizing the CoM distribution of the hydro-gen molecule as sampled during the DMC runs. Althoughmore accurate approaches converging to the appropriate limitof sampling ψ2
0 are available,81, 82 our simple approach hasbeen found useful already in extracting qualitative informa-tion for systems that are reasonably strongly bound.80, 83 Wewill show in the following that this is the case also for the titlesystems.
III. RESULTS
A. Optimization
Tables I and II show the energetic data for the putativeglobal minima obtained as described in Sec. II B. We report
124319-5 M. Mella and E. Curotto J. Chem. Phys. 139, 124319 (2013)
the total potential energy Vd0 for H2–(NH3)n species, the ver-
tical dissociation Dv energy for H2 (i.e., the difference be-tween Vd
0 and the potential for (NH3)n frozen in the optimalH2–(NH3)n geometry), the adiabatic dissociation energy De
of H2 with respect to the optimized parent cluster, and the re-laxation energy �r for the pure ammonia aggregate from theH2–(NH3)n geometry to the optimal parent ammonia cluster.The reasons that led us to include information on Dv and �r
are related to the possibility of a dissociation process (perhapsmediated by photon adsorption) faster than the relaxation ofthe ammonia aggregates, whose restructuring would have �r
as driving force.We begin the discussion on the optimization results by
noticing that �r is found to be substantially larger when H2
is treated as a classical rigid body object (rb–H2, i.e., whendescribed by the 5D PES) than in the case of the sphericallyaveraged potential. We also highlight the 5D relaxation en-ergy for n = 8 and 20 that gives indication of a slightly moremarked deformations associated to the “landing” of rb–H2.The larger values of �r from the 5D PES are the direct con-sequence of its interaction strength (nearly five times strongerthan for the 3D PES) in the attractive regions, and its capa-bility of distorting more the underlying ammonia cluster. Inthe case of the spherically averaged PES, a few �r valuestake a negative signs despite an expected positive value. Byrestarting trajectories, we were able to confirm that the smallnegative �r for n = 15 and 20 in Table II are indeed relatedto the optimization threshold; in fact, reducing the maximumsize of the gradient led to �r values smaller in magnitude.
For both Dv and De, it appears evident the effect of thespherical average, which eliminates the anisotropy due to theelectrostatic quadrupole of H2 from the NH3–H2 interaction.Nevertheless, it is clear from Figure 1 that the De versus nlandscape painted by the two model interactions is fairly sim-ilar, with energy differences between neighbor species beingscaled downward by the weaker 3D PES. n = 14 and 20 de-viates from the mentioned rule as a difference in “curvature”in De (or Dv) versus n is present. A fairer comparison would,however, only be possible using the quantum simulation re-sults, as in the latter case one would also include the quantum
FIG. 1. Vertical and adiabatic dissociation energy (Dv and De, in cm−1) forH2–(NH3)n as a function of the number n of ammonia molecules. The leftaxis refers to species containing para-H2, while the right axis refers to speciescontaining the rigid-body H2 described by the 5D PES.
rotational motion of rb–H2. Since doing so allows one to un-derstand better the interplay between rotational averaging andvibrational motion, we shall discuss DMC results with thispoint of view in mind (vide infra Sec. III B).
As for the relative fluctuation of the binding energy ver-sus n, we notice that these are spread over a range of roughly30% of the largest De in magnitude for both PESs whenn ≥ 7. Thus, no major size effects appear in this range. Thebinding energy is, instead, substantially lower when n < 7.It is also worth highlighting and bearing in mind the casesof para-H2–(NH3)17 and para-H2–(NH3)18, for which thelarge magnitude of De may indicate possible surface peculiar-ities. To investigate the root cases for the mentioned finding,Figures 2–5 show the structure of the putative global minimafor H2–(NH3)n (n =3–20).
From these, we notice that the lower magnitude of De
for n < 7 is related to a different location of H2 than in thelarger systems. In fact, both PESs collocate H2 externally onthe plane of the ring when n = 3–5, and over a tetrameric ringof the “book” form64 for n = 6. Albeit small differences arepresent in term of the precise location between the two PESs,
FIG. 2. Putative global minimum structure for H2–(NH3)n (n = 3–7). (Top row) rb–H2 described by the 5D PES; (bottom row) para-H2.
124319-6 M. Mella and E. Curotto J. Chem. Phys. 139, 124319 (2013)
FIG. 3. Putative global minimum structure for H2–(NH3)n (n = 8–12). (Top row) rb–H2 described by the 5D PES; (bottom row) para-H2.
there is an overall agreement between the main features (also,vide infra for DMC simulations).
For the para-H2–(NH3)n species with n ≥ 7, the putativeglobal minima are mainly characterized by a surface bind-ing motif built by rhomboidal ammonia tetramers (hence-forth “rhombus”) containing two double donor (DD) andtwo double acceptor (AA) molecules (e.g., see the topmostface of H2–(NH3)8). Notice that with this spatial disposi-tion, the DD ammonia molecules interact with para-H2 viaPES minimum along the C3 axis on the molecular H-side(De = −28.3 cm−1); the two AA molecules, instead, inter-act via the N-side minimum (De = −23.7 cm−1). Deviationsfrom this common motif are found for n = 13, 14, and 17–20.In the case of n = 13, there is an open ring as a result of oneof the DD molecules being connected with an ammonia sit-ting in a layer underneath the one of the rhombus interacting
with H2; aside from this detail, the overall structure is main-tained. H2–(NH3)14, instead, has a different H-bond topology,containing two donor–acceptor (DA) molecules as part of thetetrameric ring together with a DD and an AA molecule. Thedifferences in the larger clusters emerge from the more com-plicated surface structure, which features adsorbed moleculeswith unsaturated H-bond that can be donated directly to H2
without competing with other molecules. This is particularlyevident for N = 17 in Figure 4; retrospectively, such findingrationalizes the higher binding energy for the larger speciesseen in Figure 1. Similarly, the nearly constant Dv for specieswith N = 8–16 is well supported by the common H2 bindingmotif, with deviation being correlated mainly to differencesin the distances and angles of the surface tetramer.
Similar conclusions emerge for the case of rb–H2–(NH3)n (n = 8–20). In other words, the binding location
FIG. 4. Putative global minimum structure for H2–(NH3)n (n = 13–17). (Top row) rb–H2 described by the 5D PES; (bottom row) para-H2.
124319-7 M. Mella and E. Curotto J. Chem. Phys. 139, 124319 (2013)
FIG. 5. Putative global minimum structure for H2–(NH3)n (n = 18–20). (Toprow) rb–H2 described by the 5D PES; (bottom row) para-H2.
presents always an interaction between rb–H2 with the afore-mentioned rhomboidal ring. Even in this case, the oscillationsin De and Dv versus n are to be attributed to differences inthe local structure of the tetrameric ring and, consequently,to the final orientation of rb–H2. In many of the cases shownin Figures 2–5, the dominant interaction mode seems to bethe one related to the deepest minimum of the rb–H2–(NH3)potential,63 with rb–H2 donating a hydrogen bond to the lonepair side of vicinal ammonia molecules. The only deviationfrom a “rhombus” landing site is represented by the presenceof an ad-ammonia absorbed nearby in (NH3)20 (see the topface of H2–(NH3)20 in Figure 5). Such feature represents anadditional source of interaction for the rigid-body H2, whichcan thus increase its binding energy with the ammonia cluster.It is such additional stabilization that rationalizes the largermagnitude of the vertical binding energy seen for n = 20 inFigure 1.
B. DMC simulations
From the species obtained using the optimization stagedescribed in Sec. III A, we selected a few systems for fur-ther investigation by means of the DMC method. The cri-teria for the selection were based on the opportunities tobetter comprehend the competition between the most attrac-tive structural motif (rhombus-like) present in the globallyoptimized species, and the most likely ones (trimeric andtetrameric rings) emerging from the simulation of ultra-coldcluster formation.60 As indicated above, the vast majoritiesof the putative global minima are derived from the adsorp-tion of H2 on the cluster surface in correspondence with aclosed rhomboidal disposition of two AA and two DD am-monia molecules and without any substantial rearrangementin (NH3)n. Thus, our DMC simulations employed the globalminimum structure for the parent ammonia clusters keepingthe latter frozen. The rationale behind this choice is related tothe strong binding energy in ammonia clusters, the high in-terconversion barriers between their isomers,70 and the struc-tural stability indicated by DMC calculations for pure clus-ters other than the pentamer.71 This choice, obviously, also
TABLE III. DMC E0 (=−D0), De binding energy (from Table I) and anhar-monic ZPE for rb–H2–(NH3)n with the hydrogen molecule described usingthe full 5D PES. Data in cm−1; the standard error of the data is smaller thanthe last digit shown.
a(NH3)12 with the same structure found for the global minimum of H2–(NH3)12.b(NH3)12 with the same structure found for the global minimum of pure (NH3)12.
excludes possible effects due to the couplings (if any, giventhe difference in energy84, 85) between intramolecular ammo-nia modes and H2 quantum motion.
Since the ammonia moiety in the global minimum for rb–H2–(NH3)12 differs from the global minimum of (NH3)12, wedeviated from the above prescription and employed both am-monia skeletons. For comparative purposes, a similar strategyis also applied to para-H2–(NH3)12, simulating ψ0 of both thefirst and second lowest minima obtained using the 3D PES.We notice that the second lowest minimum for the latter sur-face is structurally equivalent to the global minimum of thefull 5D one; in other words, there is an inversion of the rela-tive structural stability, albeit the potential energy differenceis only ∼70 cm−1.
In the simulation set, we also included the ammonia hep-tadecamer as it has an ammonia molecule sitting on the sur-face of the clusters with unsaturated N–H group close to arhombus. Our optimization employing the 3D PES suggestedthe latter to be the preferential adsorption site. Finally, we alsoincluded H2–(NH3)3 and H2–(NH3)4 for the sake of complete-ness, employing the cyclic global minima as they are oftenpresent in species formed in ultra-cold conditions.60
Tables III and IV show the results obtained with the DMCsimulations, together with the dissociation energy De definedbefore (see Sec. III A). We begin by indicating that the spher-ically averaged PES appears perfectly able to reproduce the
TABLE IV. DMC E0 (=−D0), De binding energy (from Table II) and an-harmonic ZPE for H2–(NH3)n with the hydrogen molecule described as aspherical object using the rotationally averaged PES for para-H2. Data incm−1; the standard error of the data is smaller than the last digit shown.
a(NH3)12 with the same structure found for the global minimum of para-H2–(NH3)12
and (NH3)12.b(NH3)12 with the same structure in the second lowest minimum of para-H2–(NH3)12,which is similar to the global minimum for H2–(NH3)12.
124319-8 M. Mella and E. Curotto J. Chem. Phys. 139, 124319 (2013)
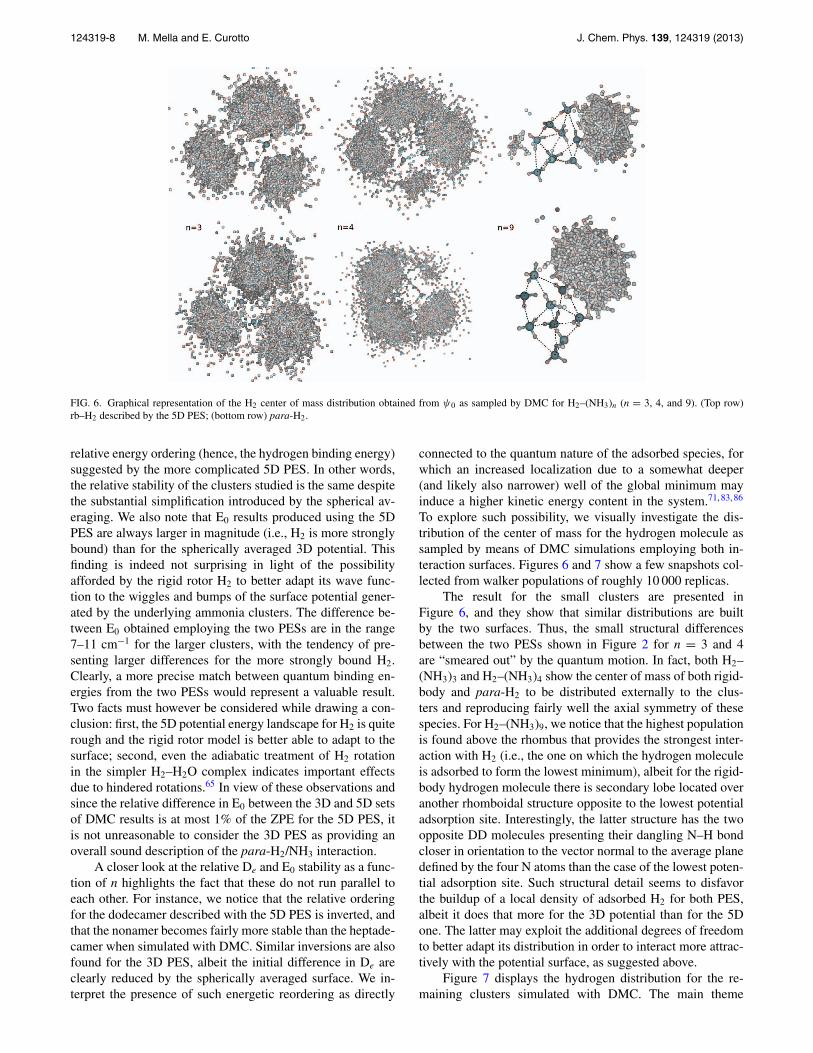
FIG. 6. Graphical representation of the H2 center of mass distribution obtained from ψ0 as sampled by DMC for H2–(NH3)n (n = 3, 4, and 9). (Top row)rb–H2 described by the 5D PES; (bottom row) para-H2.
relative energy ordering (hence, the hydrogen binding energy)suggested by the more complicated 5D PES. In other words,the relative stability of the clusters studied is the same despitethe substantial simplification introduced by the spherical av-eraging. We also note that E0 results produced using the 5DPES are always larger in magnitude (i.e., H2 is more stronglybound) than for the spherically averaged 3D potential. Thisfinding is indeed not surprising in light of the possibilityafforded by the rigid rotor H2 to better adapt its wave func-tion to the wiggles and bumps of the surface potential gener-ated by the underlying ammonia clusters. The difference be-tween E0 obtained employing the two PESs are in the range7–11 cm−1 for the larger clusters, with the tendency of pre-senting larger differences for the more strongly bound H2.Clearly, a more precise match between quantum binding en-ergies from the two PESs would represent a valuable result.Two facts must however be considered while drawing a con-clusion: first, the 5D potential energy landscape for H2 is quiterough and the rigid rotor model is better able to adapt to thesurface; second, even the adiabatic treatment of H2 rotationin the simpler H2–H2O complex indicates important effectsdue to hindered rotations.65 In view of these observations andsince the relative difference in E0 between the 3D and 5D setsof DMC results is at most 1% of the ZPE for the 5D PES, itis not unreasonable to consider the 3D PES as providing anoverall sound description of the para-H2/NH3 interaction.
A closer look at the relative De and E0 stability as a func-tion of n highlights the fact that these do not run parallel toeach other. For instance, we notice that the relative orderingfor the dodecamer described with the 5D PES is inverted, andthat the nonamer becomes fairly more stable than the heptade-camer when simulated with DMC. Similar inversions are alsofound for the 3D PES, albeit the initial difference in De areclearly reduced by the spherically averaged surface. We in-terpret the presence of such energetic reordering as directly
connected to the quantum nature of the adsorbed species, forwhich an increased localization due to a somewhat deeper(and likely also narrower) well of the global minimum mayinduce a higher kinetic energy content in the system.71, 83, 86
To explore such possibility, we visually investigate the dis-tribution of the center of mass for the hydrogen molecule assampled by means of DMC simulations employing both in-teraction surfaces. Figures 6 and 7 show a few snapshots col-lected from walker populations of roughly 10 000 replicas.
The result for the small clusters are presented inFigure 6, and they show that similar distributions are builtby the two surfaces. Thus, the small structural differencesbetween the two PESs shown in Figure 2 for n = 3 and 4are “smeared out” by the quantum motion. In fact, both H2–(NH3)3 and H2–(NH3)4 show the center of mass of both rigid-body and para-H2 to be distributed externally to the clus-ters and reproducing fairly well the axial symmetry of thesespecies. For H2–(NH3)9, we notice that the highest populationis found above the rhombus that provides the strongest inter-action with H2 (i.e., the one on which the hydrogen moleculeis adsorbed to form the lowest minimum), albeit for the rigid-body hydrogen molecule there is secondary lobe located overanother rhomboidal structure opposite to the lowest potentialadsorption site. Interestingly, the latter structure has the twoopposite DD molecules presenting their dangling N–H bondcloser in orientation to the vector normal to the average planedefined by the four N atoms than the case of the lowest poten-tial adsorption site. Such structural detail seems to disfavorthe buildup of a local density of adsorbed H2 for both PES,albeit it does that more for the 3D potential than for the 5Done. The latter may exploit the additional degrees of freedomto better adapt its distribution in order to interact more attrac-tively with the potential surface, as suggested above.
Figure 7 displays the hydrogen distribution for the re-maining clusters simulated with DMC. The main theme
124319-9 M. Mella and E. Curotto J. Chem. Phys. 139, 124319 (2013)
FIG. 7. Graphical representation of the H2 center of mass distribution obtained from ψ0 as sampled by DMC for H2–(NH3)n (n = 12, 16, and 17). The label12a refers to the simulations run using the ammonia skeleton that gives the lowest minimum for n = 12 while using the 5D PES (distorted bicubic structure),while 12b indicates simulations run using the lowest minimum of the pure ammonia cluster. (Top row) rb–H2 described by the 5D PES; (bottom row) para-H2.
emerging from the pictures appears to be, again, the localiza-tion of the density above the rhombus motifs on the surface,with a complete disregard for the structural motifs that aremore likely to appear under ultra-cold formation conditions.60
The asymmetries present in the distribution for n = 12 and16 are justified by both the presence of slight structural dif-ferences and by the fact that DMC is expected to be able toproduce a perfectly balanced coverage only in the limit of asinfinite number of replicas. It is only in this case that the popu-lation bias introduced by the population control87 and by non-completeness of the basis set used vanishes.68 In presence oflarge energy barriers separating the attractive regions of thepotential, one should thus not be surprised by an unbalanceddistribution as we indeed obtained; the latter, however, stillpresents a population over all energetically similar minima.
In the case of (NH3)12 highlighted above due to the inver-sion of stability between the two isomers, we notice that theglobal minimum of rb–H2–(NH3)12 contains only four rhom-buses, each separated from the other three by a tetrameric ringmotif as in Figure 6. The global minimum for the reducedPES, instead, presents six rhombuses sharing all vertex am-monia molecules, together with eight trimer rings. Overall,the second species is characterized by a higher curvature of itssurface, which has the net effect of affording a larger volumeover each rhombus before H2 is forced to overlap with a lessbinding (or repulsive) region above a cyclic trimer motif. Thelower curvature of the global minimum rb–H2–(NH3)12 hasalso, and perhaps more importantly, the net effect of forcingthe dangling N–H bonds of the two AA ammonia moleculesin the skeleton to be more perpendicular with respect to therhombus plane than in the case of the dodecahedral moiety;the same happens for the two competing rhombuses in thenonamer (vide supra).
Extending the same analysis to the other systems, itemerges that there is a striking correlation between the rel-ative stability, defined by E0 in Tables III and IV, and thewidth of the rhomboidal well over which the highest H2 den-sity dwells (see Figures 6 and 7). The width is gauged usingthe distance between the H atoms in the upward pointing dan-gling N–H bonds of the two AA molecules. Direct inspec-tion of the cluster structures, in fact, gives 5.09, 4.91, 4.75,4.46, and 4.39 Å, respectively, for the most and least pop-ulated rhombuses in H2–(NH3)9, the most symmetric dode-camer, the heptadecamer, and both the hexadecamer and theleast symmetric dodecamer. Such ordering clearly runs paral-lel to the relative stability ranking obtained by DMC for bothPESs, the difference in energetic position between the hex-adecamer and the least symmetric dodecamer being definedby subtler effects such as the fact that the rhombus on thehexadecamer is surrounded only by trimer rings. Accordingto our energy data, these afford an improved stability to theadsorbed species compared to the tetrameric rings surround-ing the adsorption site in the dodecamer.
Turning to the case of the heptadecamer, it is striking thatthe global minimum region for the 3D PES is indeed not pop-ulated at all despite its 22 cm−1 lower classical De than for thenonamer; the whole population of replica is in fact displacedonto the surface rhombus interacting with H2 in the globalminimum of the 5D PES. Inspecting the rhombus underlyingthe global minimum for the reduced PES indeed provides ajustification for the DMC results, as the hydrogen atoms of thetwo AA dangling N–H bonds sit at 4.20 Å from each other, adistance that is clearly shorter than the one in the populatedrhombus in (NH3)17 and, for what it matters, any other pop-ulated rhombus among the investigated clusters. In our eyes,this is a staggering indication that the stronger confinement
124319-10 M. Mella and E. Curotto J. Chem. Phys. 139, 124319 (2013)
required to para-H2 in order to populate the surface region ofthe global potential minimum plays indeed the key role, in-ducing a quantum spill-over into surface regions with morerelaxed or absent geometrical restraints.
C. Clathrate-like species: H2@(NH3)12 and H2@(NH3)16
One of the long term reasons for developing a H2/NH3
PES and using it in quantum simulations of H2–NH3 mixturesis to foster a better understanding of their thermodynamicsand phase diagram with a view toward fuel storage. There-fore, we decided to investigate the energetics of species whosewater counterparts may play a role in developing hydrogenstorage technology. Recognizing that the global minima of(NH3)12 and (NH3)16 are hollow cages, we thus run DMCsimulations with H2 placed inside these clusters in a clathrate-like configuration. Our initial unbiased search for potentialenergy minima showed no indication for these species amongthe stationary structures obtained. Therefore, one might be ledto conclude that confining the hydrogen molecule may be en-ergetically expensive compared to the surface adsorption. In-deed, a local optimization starting from the preformed am-monia dodecamer and hexadecamer gave a binding energy,respectively, of +351(+702) and +65(+330) cm−1 for the5D(3D) PES. By itself, this conclusion is already non-trivial,as the internal width of the cages and the features of both the5D and 3D PESs would, at least in principle, allow a stabi-lizing superposition of attractive regions of the H2–NH3 PES.Notice that the volume inside (NH3)12 and (NH3)16 is smallerthan the one inside the water dodecahedron found in clathratehydrates,39 where an overall attractive region for a single H2
is found.37, 38 It must, however, be recalled that such accom-modating structure is created at the expenses of a substantialamount of work (P∼200 MPa, T = 249 K) employed to re-structure the spatial distribution of water molecules.36
Congruently with the classical data, our DMC results in-dicate that H2 is not stable inside the two cages investigated.For the 5D PES, we found E0 = 1097.2(3) and 658.1(4) cm−1
for the dodecamer and the hexadecamer, respectively. The3D PES, instead, gave E0 = 1123.6(1) and 698.9(1) cm−1.Comparing the two sets of results, we observe good cor-respondence between the two models in terms of the ener-getic ordering they predict. In terms of the ZPE of the en-gulfed molecules, the ammonia cages represent indeed muchstronger confining regions than the water clathrates previouslystudied,37, 38 for which it is found that ZPE = 177.2 cm−1 andthat it is possible to include two molecules while still havingE0 < 0.
With respect to the possible fate of the two clathrate-likespecies under discussion, we notice that they resemble a par-ticle (H2) inside a nearly spherical well, which has E0∝1/R2,with R being the average radius. Thus, H2 inside the cagesis akin to a gas that exerts a pressure p onto the internal sur-face of a container of volume V ∝ R3, as −kBT ( ∂ ln Z
∂V)T (the
statistical mechanics definition of pressure) is non-zero evenat T = 0 K. The mechanical energy pV stored in the sys-tem may, in principle, lead to a cage expansion, possibly itsbreakup or, more likely, a restructuring of its hydrogen bond
network. The maximum amount of mechanical energy storedin the system available for carrying out work would, however,be E0 (the difference between the ground state energy of thecaged and un-caged H2), which is at most 1.9 kcal/mol. Asbreaking a single hydrogen bond in ammonia clusters is ex-pected to require more than 4 kcal/mol, it appears that thecaged species ought to be considered metastable as they donot contain sufficient energy for breaking up. In other words,such species may be kinetically stable and able to survive atlow temperature if formed, thus behaving in a way similarto the hydrogen clathrates. The latter remain stable upon de-creasing the pressure to 100 KPa from the 200 MPa neededfor the synthesis provided T remains below 248 K. Clearly, amore definitive conclusion should be sought by simulating thequantum ground and low temperature states of our clathrate-like species employing either DMC or a curved manifolds ver-sion of the ring polymer dynamics.88
IV. DISCUSSION AND CONCLUSIONS
Guided by general and specific interests in describingmolecules weakly interacting with solid surfaces, we haveexplored the classical and quantum energy landscape of theH2–(NH3)n systems, n = 3–20. Employing both 5D and ro-tationally averaged 3D PESs to locate putative global min-ima for the mentioned systems, we found that the two PESsprovide similar energy landscapes with H2 physisorbed onthe clusters, and that the most common adsorption site has arhomboidal disposition of the N atoms belonging to two AAand two DD ammonia molecules. Albeit usually topologicallyconnected by hydrogen bonds, the DD molecules donate a hy-drogen bond to a NH3 outside the rhomboidal structure in afew cases. The preferential orientation of rb–H2 with respectto the rhomboidal plane is found to be guided by the dona-tion of a hydrogen bond to a nitrogen. No marked changesin structure are found for the ammonia moiety in H2–(NH3)n
compared to pure clusters.Similar adsorption sites are found for both rb–H2 and
para-H2 when simulated using DMC, the correlation of D0
with the width of the hydrogen rim in each rhombus indicat-ing the key role played by confining forces. Frequently, the H2
density is located onto the classical minimum adsorption site;only occasionally it also dwells over rhombuses with higherpotential energy, but with lower density (see n = 9 and 17).However, neither rb–H2 nor para-H2 are ever found with den-sity on rhombuses with a surface adsorbed NH3 nearby, andthis is despite the fact that these sites are the most stronglybound from the classical potential point of view. Notice thatthe strong correlation between E0 (or D0) and the width ofthe hydrogen rim over the rhombuses, together with the lackof H2 population on top of square and triangular motifs al-low one to predict the H2 adsorption energy on the surfaces oflarger aggregates as ammonia ices. It would be, in fact, suffi-cient to measure the distance between the dangling H atomsof the DD molecules in a rhombus to obtain an estimate forE0 from our data.
Finally, clathrate-like species (i.e., the hollow (NH3)12
and (NH3)16 filled with a single H2) are not stable whencompared to the parent clusters plus hydrogen molecule.
124319-11 M. Mella and E. Curotto J. Chem. Phys. 139, 124319 (2013)
However, the “quantum pressure” exerted by the engulfed H2
does not seem to be sufficiently strong to force a hydrogen-bond breaking and its consequent escape. This conclusion,however, needs to be carefully tested against simulations de-scribing the ammonia skeleton as fully flexible, which oughtto involve additional development for DMC or the curvedmanifolds version of the ring polymer dynamics.88 Workalong these directions is in progress in our laboratories.
The direct comparison of the 5D and 3D PESs data high-lights an overall good capability of the reduced potential inproviding qualitatively (in terms of the location) and semi-quantitatively (maximum error in E0 of ∼1% of the ZPE gen-erated by using the 5D PES) correct results. The discrepancybetween the two models is mainly due to the absent ability ofpara-H2 to adapt to the local surface “nuances.” Worth men-tioning is the finding that rb–H2 remains hydrogen bondedto the nitrogen of NH3 during DMC simulations; para-H2
prefers instead the region along the C3 axis on the H-side (re-sults not shown). Comparing the latter results indicates thatrb–H2 may behave as a very anharmonic pendulum.
To contextualise our work, it is useful to compare withthe case of H2 adsorbed on water ice. We begin noticingthat our global minima involving rb–H2 have a larger De
than found for a model of rigid amorphous ice (deviationsin the range 75–310 cm−1).1 This is due to a deeper well inour ammonia–H2 surface compared to the water–H2 model,89
the latter being too weakly binding compared to more recentsurfaces.90 Besides, the amorphous ice has a rougher surfacethan our molecular-size grains. Despite the relative interactionstrengths and the surface disorder, our DMC results providesmaller D0 than obtained simulating H2 on the amorphous ice(175–640 cm−1).2 As it seems that H2 adsorbs onto the ice inlocation structurally similar to the ones on our clusters, andthat the E0 = −20.98 cm−1 for H2–NH3 obtained with the5D PES compares well with E0 = −34.74 cm−1 for H2–H2Ocomputed using a PES with a well of De = −234.15 cm−1,90
we find the discrepancy in D0 somewhat puzzling and difficultto reconcile. Unfortunately, no direct comparison with exper-imental results is possible, as the approach used for modelingempirical H2 desorption data from water ice implies a com-plicated ensemble average.7 As possible explanation, we sug-gest that the amorphous ice surface might be rich on under-coordinated O atoms, which would represent a preferential H2
adsorption site2 due to the stronger interaction. An equivalentsituation, with surface N atoms exposing their uncumberedside outward, is not present in our systems.
Turning to the H2 tagging employed to improve spectro-scopic resolution, we notice that our quantum binding ener-gies (−40/−22 cm−1, or −62/−34 K) support the possibilityof adding H2 to a pre-formed ammonia cluster inside a Hedroplet. It should also be possible to tag clusters in molec-ular beams studies, albeit aggregates may need to be suffi-ciently cold. Importantly, our data indicate a marked prefer-ence for the rhomboidal motif, which is seldom found whena fast energy dissipation is expected.60 Nevertheless, the mostfrequent (and least bound, see Tables III and IV) tetramericmotif60 should bind H2 strongly enough to generate a stableadduct. A competition for H2 between this motif and trimericrings, also present in clusters formed under strong dissipation
regime,60 should however be expected based on the relativestability and frequency. Such peculiarity may be exploited toshed some light on the ammonia clusters formed by seedingHe droplets by recording the rotational spectrum of the ad-sorbed H2.3
We would like to conclude recalling that the thrust for de-veloping a H2–NH3 PES is the study of their condensed phaseaggregates, hoping to find phases or conditions useful in fuelstorage technology. In this respect, it seems fair to comparethe interaction strength of the 5D PES with possible storagematerials as aromatic frameworks.91 We thus notice that cor-related calculation on a few aromatic species92 place the De ofH2 in the 290–350 cm−1 range, which is lower than for the 5DPES (see Table I). Thus, it may seem that pores in amorphousammonia ice might be capable of binding more strongly a fewhydrogen molecules than graphene nanostructures,91 zeoliteimidazolate frameworks,93 but not carbon foams.94
ACKNOWLEDGMENTS
E.C. acknowledges the donors of the Petroleum ResearchFund, administered by the ACS (Grant No. 48146-B6), TheStacy Ann Vitetta ’82 Professorship Fund, and The EllingtonBeavers Fund for Intellectual Inquiry from Arcadia Univer-sity for support of this research. M.M. acknowledges fundingfrom the Università dell’Insubria under the scheme “Fondi diAteneo per la Ricerca di Base.”
1H. G. Hixson, M. J. Wojcik, M. S. Devlin, J. P. Devlin, and V. Buch, J.Chem. Phys. 97, 753 (1992).
2V. Buch and J. P. Devlin, J. Chem. Phys. 98, 4195 (1993).3V. Buch, S. C. Silva, and J. P. Devlin, J. Chem. Phys. 99, 2265 (1993).4H. B. Perets, O. Biham, G. Manicó, V. Pirronello, J. Roser, S. Swords, andG. Vidali, Astrophys. J. 627, 850 (2005).
5F. Dulieu, L. Amiaud, S. Baouche, A. Momeni, J.-H. Fillion, and J.Lemaire, Chem. Phys. Lett. 404, 187 (2005).
6L. Hornekær, A. Baurichter, V. V. Petrunin, A. C. Luntz, B. D. Kay, and A.Al-Halabi, J. Chem. Phys. 122, 124701 (2005).
7L. Amiaud, J. H. Fillion, S. Baouche, F. Dulieu, A. Momeni, and J. L.Lemaire, J. Chem. Phys. 124, 094702 (2006).
8J.-H. Fillion, L. Amiaud, E. Congiu, F. Dulieu, A. Momeni, and J.-L.Lemaire, Phys. Chem. Chem. Phys. 11, 4396 (2009).
9V. Buch, J. Sadlej, N. Aytemiz-Uras, and J. P. Devlin, J. Phys. Chem. A106, 9374 (2002).
10J. P. Devlin, D. B. Gulluru, and V. Buch, J. Phys. Chem. B 109, 3392(2005).
11P. Ayotte, P. Marchand, J. L. Daschbach, R. S. Smith, and B. D. Kay, J.Phys. Chem. A 115, 6002 (2011).
12V. F. McNeill, F. M. Geiger, T. Loerting, B. L. Trout, L. T. Molina, and M.J. Molina, J. Phys. Chem. A 111, 6274 (2007).
13M. Kondo, H. Kawanowa, Y. Gotoh, and R. Souda, J. Chem. Phys. 121,8589 (2004).
14B. Henson, K. Wilson, J. Robinson, C. Noble, J. Casson, and D. Worsnop,J. Chem. Phys. 121, 8486 (2004).
15P. Parent and C. B. Laffon, J. Phys. Chem. B 109, 1547 (2005).16S.-C. C. Park and H. Kang, J. Phys. Chem. B 109, 5124 (2005).17J. Devlin, V. Buch, F. Mohamed, and M. Parrinello, Chem. Phys. Lett. 432,
462 (2006).18N. Uras, V. Buch, and J. P. Devlin, J. Phys. Chem. B 104, 9203 (2000).19C. Manca and A. Allouche, J. Chem. Phys. 114, 4226 (2001).20Q. Chang and E. Herbst, Astrophys. J. 759, 147 (2012).21A. Al-Halabi and E. F. Van Dishoeck, Mon. Not. R. Astron. Soc. 382, 1648
(2007).22B. Barzel and O. Biham, Astrophys. J. Lett. 658, L37 (2007).23M. E. Palumbo, J. Phys.: Conf. Ser. 6, 211 (2005).24T. Huthwelker, M. Ammann, and T. Peter, Chem. Rev. 106, 1375 (2006).25C. Girardet and C. Toubin, Surf. Sci. Rep. 44, 159 (2001).
124319-12 M. Mella and E. Curotto J. Chem. Phys. 139, 124319 (2013)
26P. G. Sennikov, S. K. Ignatov, and O. Schrems, ChemPhysChem 6, 392(2005).
27L. Amiaud, A. Momeni, F. Dulieu, J. Fillion, E. Matar, and J.-L. Lemaire,Phys. Rev. Lett. 100, 056101 (2008).
28J.-R. Li, R. Kuppler, and H.-C. Zhou, Chem. Soc. Rev. 38, 1477 (2009).29A. Battisti, S. Taioli, and G. Garberoglio, Microporous Mesoporous Mater.
143, 46 (2011).30G. Garberoglio, EPJdirect 51, 185 (2009).31G. Garberoglio and J. Johnson, ACS Nano 4, 1703 (2010).32H. Kagita, T. Ohba, T. Fujimori, H. Tanaka, K. Hata, S.-I. Taira, H. Kanoh,
D. Minami, Y. Hattori, T. Itoh, H. Masu, M. Endo, and K. Kaneko, J. Phys.Chem. C 116, 20918 (2012).
33H. Tanaka, D. Noguchi, A. Yuzawa, T. Kodaira, H. Kanoh, and K. Kaneko,J. Low Temp. Phys. 157, 352 (2009).
34D. Liu, W. Wang, J. Mi, C. Zhong, Q. Yang, and D. Wu, Ind. Eng. Chem.Res. 51, 434 (2012).
35G. Garberoglio and R. Vallauri, Microporous Mesoporous Mater. 116, 540(2008).
36W. L. Mao, H.-K. Mao, A. F. Goncharov, V. V. Struzhkin, Q. Guo, J. Hu,J. Shu, R. J. Hemley, M. Somayazulu, and Y. Zhao, Science 297, 2247(2002).
37M. Xu, Y. S. Elmatad, F. Sebastianelli, J. W. Moskowitz, and Z. Bacic, J.Phys. Chem. B 110, 24806 (2006).
38F. Sebastianelli, M. Xu, Y. S. Elmatad, J. W. Moskowitz, and Z. Bacic, J.Phys. Chem. C 111, 2497 (2007).
39T. C. W. Mak and R. K. McMullan, J. Chem. Phys. 42, 2732 (1965).40T. Castro, R. Reifenberger, E. Choi, and R. P. Andres, Phys. Rev. B 42,
8548 (1990).41M. Schmidt, R. Kusche, B. von Issendorff, and H. Haberland, Nature
(London) 393, 238 (1998).42M. O’Keeffe, Chem. Soc. Rev. 38, 1215 (2009).43L. J. Murray, M. Dinca, and J. R. Long, Chem. Soc. Rev. 38, 1294 (2009).44I. Matanovic, J. L. Belof, B. Space, K. Sillar, J. Sauer, J. Eckert, and Z.
Bacic, J. Chem. Phys. 137, 014701 (2012).45S. K. Pope, M. G. Tomasko, M. S. Williams, M. L. Perry, L. R. Doose, and
P. H. Smith, Icarus 100, 203 (1992).46M. E. Brown and W. M. Calvin, Science 287, 107 (2000).47L. Slobodkin, I. Buyakov, R. Cess, and J. Caldwell, J. Quant. Spectrosc.
Radiat. Transf. 20, 481 (1978).48L. J. Lanzerotti, W. L. Brown, K. J. Marcantonio, and R. E. Johnson, Nature
(London) 312, 139 (1984).49M. J. Loeffler, U. Raut, and R. A. Baragiola, J. Chem. Phys. 132, 054508
(2010).50J. He, K. Gao, G. Vidali, C. J. Bennett, and R. I. Kaiser, Astrophys. J. 721,
1656 (2010).51G. Manic, G. Ragun, V. Pirronello, J. E. Roser, and G. Vidali, Astrophys.
J. Lett. 548, L253 (2001).52J. E. Roser, G. Manic, V. Pirronello, and G. Vidali, Astrophys. J. 581, 276
(2002).53T. Hama, K. Kuwahata, N. Watanabe, A. Kouchi, Y. Kimura, T. Chigai, and
V. Pirronello, Astrophys. J. 757, 185 (2012).54M. Z. Kamrath, E. Garand, P. A. Jordan, C. M. Leavitt, A. B. Wolk, M.
J. Van Stipdonk, S. J. Miller, and M. A. Johnson, J. Am. Chem. Soc. 133,6440 (2011).
55J. G. L. C. A. Schmuttenmaer, R. C. Cohen, M. J. Elrod, D. W. Steyert, R.J. Saykally, R. E. Bumgarner, and G. A. Blake, J. Chem. Phys. 97, 4727(1992).
56F. Huisken and T. Pertsch, Chem. Phys. 126, 215 (1998).
57B. Heijmen, A. Bizzarri, S. Stolte, and J. Reuss, Chem. Phys. 126, 201(1988).
58U. Buck, R. Krohne, and S. Schoette, J. Chem. Phys. 106, 109 (1997).59M. N. Slipchenko, B. G. Sartakov, A. F. Vilesov, and S. S. Xantheas, J.
Phys. Chem. A 111, 7460 (2007).60M. Patrone and M. Mella, Chem. Phys. Lett. 514, 16 (2011).61S. Maret, A. Faure, E. Scifoni, and L. Wiesenfeld, Mon. Not. R. Astron.
Soc. 399, 425 (2009).62M. Mladenovic, M. Lewerenz, G. Cilpa, P. Rosmus, and G. Chambaud,
Chem. Phys. 346, 237 (2008).63J. Sheppleman, Jr., G. Smizaski, E. Curotto, and M. Mella, Chem. Phys.
Lett. 535, 49 (2012).64P. Janeiro-Barral, M. Mella, and E. Curotto, J. Phys. Chem. A 112, 2888
(2008).65T. Zeng, H. Li, R. J. L. Roy, and P.-N. Roy, J. Chem. Phys. 135, 094304
(2011).66H. Li, P.-N. Roy, and R. J. L. Roy, J. Chem. Phys. 133, 104305 (2010).67W. Kolos and L. Wolniewicz, J. Chem. Phys. 46, 1426 (1967).68P. Slavicek and M. Lewerenz, Phys. Chem. Chem. Phys. 12, 1152
(2010).69T. P. Straatsma and J. A. McCammon, Mol. Simul. 5, 181 (1990).70C. Lubombo, E. Curotto, P. Janeiro Barral, and M. Mella, J. Chem. Phys.
131, 034312 (2009).71E. Curotto and M. Mella, J. Chem. Phys. 133, 214301 (2010).72P. E. Janeiro-Barral and M. Mella, J. Phys. Chem. A 110, 11244 (2006).73B. Hartke, J. Chem. Phys. 97, 9973 (1993).74Y. Zeiri, Phys. Rev. E 51, R2769 (1995).75D. M. Deaven and K. M. Ho, Phys. Rev. Lett. 75, 288–291 (1995).76D. M. Deaven, N. Tit, J. R. Morris, and K. M. Ho, Chem. Phys. Lett. 256,
195 (1996).77J. A. Niesse and H. R. Mayne, J. Chem. Phys. 105, 4700 (1996).78J. B. Anderson, J. Chem. Phys. 63, 1499 (1975).79B. L. Hammond, W. A. Lester, and P. J. Reynolds, Monte Carlo
Methods in Ab Initio Quantum Chemistry (World Scientific, Singapore,1994).
80M. Mella, J. Chem. Phys. 135, 114504 (2011).81M. H. Kalos, J. Comput. Phys. 1, 257 (1966).82V. Buch, P. Sandler, and J. Sadlej, J. Phys. Chem. B 102, 8641 (1998).83M. Mella and D. C. Clary, J. Chem. Phys. 119, 10048 (2003).84J. K. Gregory and D. C. Clary, Chem. Phys. Lett. 228, 547 (1994).85E. Curotto, D. L. Freeman, and J. D. Doll, J. Chem. Phys. 128, 204107
(2008).86M. Mella, J.-L. Kuo, D. C. Clary, and M. L. Klein, Phys. Chem. Chem.
Phys. 7, 2324 (2005).87M. Mella, G. Morosi, and D. Bressanini, Phys. Rev. E 61, 2050 (2000).88S. Wolf and E. Curotto, J. Chem. Phys. 137, 014109 (2012).89Q. Zhang, L. Chenyang, Y. Ma, F. Fish, M. M. Szczesniak, and V. Buch, J.
Chem. Phys. 96, 6039 (1992).90P. Valiron, M. Wernli, A. Faure, L. Wiesenfeld, C. Rist, S. Kedžuch, and J.
Noga, J. Chem. Phys. 129, 134306 (2008).91S. Patchkovskii, J. S. Tse, S. N. Yurchenko, L. Zhechkov, T. Heine, and G.
Seifert, Proc. Natl. Acad. Sci. U.S.A. 102, 10439 (2005).92O. Hübner, A. Glöss, M. Fichtner, and W. Klopper, J. Phys. Chem. A 108,
3019 (2004).93B. Assfour, S. Leoni, S. Yurchenko, and G. Seifert, Int. J. Hydrogen Energy
36, 6005 (2011).94A. Martínez-Mesa, L. Zhechkov, S. N. Yurchenko, T. Heine, G. Seifert, and
J. Rubayo-Soneira, J. Phys. Chem. C 116, 19543 (2012).


![Referências bibliográficas - DBD PUC RIOªncias bibliográficas [1] Tielens, ... R. A. Haring, A. Haring, and F. W. Saris. ... ammonia ionic clusters produced by 252Cf fragment impact](https://static.documents.pub/doc/80x56/5ac0812c7f8b9a1c768bcaf2/referncias-bibliogrficas-dbd-puc-bibliogrficas-1-tielens-r-a-haring.jpg)


