39
August 2021 Business Overview Second Quarter 2021

August 2021
Business OverviewSecond Quarter 2021

SAFE HARBORThis presentation has been prepared by VTEX (“we,” “us,” “our,” “VTEX” or the “Company”).
This presentation may contain forward-looking statements relating to such matters as continued growth prospects for the Company, industry trends and product and technology initiatives.
These statements are based on currently available information and our current assumptions, expectations and projections about future events. While we believe that our assumptions, expectations and projections are reasonable in view of currently available information, you are cautioned not to place undue reliance on these forward-looking statements. Forward-looking statements regarding VTEX involve known and unknown risks, uncertainties and other factors that may cause VTEX’s actual results, performance or achievements to be materially different from any future results, performances or achievements expressed or implied by the forward-looking statements. Certain of these risks and uncertainties are described under “Risk Factors” and “Cautionary Statement Regarding Forward-Looking Statements” sections of VTEX’s registration statement on Form F-1 and certain of VTEX’s other filings with the U.S. Securities and Exchange Commission. You should read this information together with the sections of VTEX’s prospectus entitled “Selected Financial and Other Information” and “Management’s Discussion and Analysis of Financial Condition and Results of Operations,” our audited consolidated financial statements and our unaudited interim condensed consolidated financial statements and their respective notes, which are available on our investor relations website (https://www.investors.vtex.com/).
Unless required by law, VTEX undertakes no obligation to publicly update or revise any forward-looking statements to reflect circumstances or events after the date hereof.
his presentation also contains estimates and other statistical data made by independent parties and by us relating to market size and other data about our industry. This data involves a number of assumptions and limitations, and you are cautioned not to give undue weight to such data and estimates. In addition, projections, assumptions and estimates of our future performance and the future performance of the markets in which we operate are necessarily subject to a high degree of uncertainty and risk. Neither we nor our affiliates, advisors or representatives makes any representation as to the accuracy or completeness of that data or undertake to update such data after the date of this presentation. In addition to financial information prepared in accordance with generally accepted accounting principles in the United States (“GAAP”), we use certain non-GAAP financial measures to clarify and enhance our understanding, and aid in the period-to-period comparison, of our performance. We believe that these non-GAAP financial measures provide supplemental information that is meaningful when assessing our operating performance because they exclude the impact of certain amounts that our management and board of directors do not consider part of core operating results when assessing our operational performance, allocating resources, preparing annual budgets, and determining compensation. The non-GAAP measures have limitations, including that they may not be directly comparable to other companies, and you should not consider them in isolation or as a substitute for or superior to our GAAP financial information. See the Appendix to this presentation for a reconciliation of non-GAAP financial measures to their nearest GAAP equivalent
All of the information included in this presentation is updated as of June 30, 2021, except annual information updated as of December 31, 2020.
Except as may be required by applicable law, we assume no obligation to publicly update or revise our statements. Numbers have been calculated using whole amounts rather than rounded amounts. This might cause some figures not to total due to rounding.
02

VTEX provides a software-as-a-servicedigital commerce platform for enterprise brands and retailers.
03
04
We are building the infrastructure that enables brands to be relevant for the convenience-driven consumer.

We are a SaaS commerce platform for enterprises.
Apparel Accessories
HomeAppliances
Electronics Beauty & Health
Food & Grocery
05(1) As of December 31, 2020. Per active online store.
84% of our ARR comes from enterprise customers(1).
Each generating at least $25K ARR, with an average of $127K in ARR(1).
05

VTEX at a glance Non-GAAP(1)
subscription gross margin (2Q21 LTM)
68%GMV B2C (2Q21 LTM in USD)
$9.1 BRevenue(2Q21 LTM in USD)
$114 M
Number of active online stores(2)
(FY 2020)
> 2.5kCountries with active online stores(2)
(FY 2020)
32
Financial stats
Company metrics
> 2.0k
6(1) Please see appendix for reconciliation of non-GAAP metrics.(2) Active online stores means the number of unique domains generating gross merchandise value. 06
Number of customers(FY 2020)

10 years of continuouslearning
Ecommerce platformprovider for Walmart
in BrazilEstablished
revenue sharing business model
Whirlpool deploystheir marketplace
In annual GMV
In annual GMV
In annual GMV
Cencosud implementsVTEX across LatAm
The first omnichanneloperation
VTEX continues investing in
North America& Europe
Commerce platformprovider for Carrefour
in Brazil
15 offices across the world
Samsungis deployed
in 5 countries
ARR over
$100 M
International expansion
LatAm
$1 billion
$2.4 billion
$7.5 billion
2000 2008 2010 2011 2012 2013 2014 2015 2016 2017 2018 2019 2020 2021
Smart checkout& cloud-native microservices architecture
Omnichannel/click and collect/
delivery from store
Founded in Rio de Janeiro by recently
graduated engineers
0707

*Includes CX employees
A founder-led, future-drivenculture of integrity
Integrity We honor our word
Extraordinary Commitment We are in it for something bigger than ourselves
AuthenticityWe are free to be who we are
On the Playing Field We make ourselves responsible for success
Employee headcount
2Q20
2Q21
790
1,486
08

VTEX is the gateway to the fastest-growing ecommerce market in the world
Source: eMarketer; Insider Intelligence
EcommercePenetration
14%
8%
28%
13%
3%
18%
6%
+$3T in 5 years
+$3T in 10 years
Worldwide retail ecommerce sales ($ trillion)
Ecommerce Growth (2020)
Ecommerce is accelerating globally
VTEX is leading ecommerce in LatAm
Brazil RoWLatAm ex-BRA
LatAm is the fastest-growing region
Revenue breakdown (%) per region
. . . . . .
09

10
Source: Insider Intelligence
$6.4TWorldwide
ecommerce market (2024)
$4.3TWorldwide
ecommerce market (2020)
$85bnLatAm
ecommerce market(2020)$9.1bn GMV(1)
Addressing a massive market with significantroom for further penetration
Source: eMarketer
(1) As of June 30, 2021 LTM

Customization
Spe
ed to
Mar
ket
Low
Highly scalable
Highly flexible and customizable
Long implementation
Slow to keep up with ecosystem evolution
Born SMB
Rapid time to revenue
Low total cost of ownership
Limited customizability
Lacks feature depth
Born on-premise
Current offerings force enterprises to choose between deep customization or speed to market.
Customization meets Speed to Market
Born SaaS for EnterprisesExtensive out-of-the-box capabilities = speed
Collaborative = multiple go-to-market strategies
Composable = customizable & fast evolving
High
Low
Hig
h
11

Traditional CoreCommerce
VTEX Out-of-the-box Core
Pricing Promotions
Product Management
VTEX IO Development Platform
Marketplace & Seller
Management
Payment Gateway
We deliver unprecedentedtime to revenue with an extensive set of out-of-the-box commerce capabilities.
Distributed Order
Management
Channel Management
Content Management
AI-poweredSearch
OnlineStore
In Store Point of
Sale
MobileApp
Marketplace POS
WMS
CRM
ERP
Login Cart
Checkout
1212

13
13
Our Collaborative Commerce approach enables enterprises to explore multiple ways to sell and fulfill.
Sales Channels Fulfillment Channels
3rd party fulfillment
Physical stores
1st party fulfillment
Dropship partners
3rd party sellersMarketplaces
Live commerce
Field sales
Physical location
Mobile
Web
Distributed OMS
Native Marketplace
13

14
Our Composable Commerce technology is flexible and extensible by design.
VTEX IO low-code development
Multi-tenant architecture
API-first services
14

We leverage the network effect of a unique ecosystem of partners.
1,000+ Integrated solutions
200+System integrators
100+Marketplaces
80+Payment solutions
50+Logistics companies
10%+of GMV from CollaborativeCommerce transactions
50%+of GMV from customers using Collaborative Commerce integrations
9,500+Monthly active users accessingVTEX developer portal
200+Deploys by 3rd parties inVTEX IO on average per day
Payment
Shipping
Fraud & Lending
Marketplace
POS & Omnichannel
Search & Merchandising
Marketing Automation
Note: ecosystem data as of 2Q21 15

Greenfield Displacements
Our Competitive Advantages...
Extensive out of the box solutions
· Looking to start quickly
· Limited experience. Need to evolve as they learn
Collaborative commerce strategy Composable commerce technology Vibrant ecosystem
FROM ENTERPRISE PLATFORMS FROM SMB PLATFORMS
· Prioritizing a solution that can scale as they grow
· Looking for an ecosystem to minimize building solutions on their own
· Looking to innovate and evolve
· Facing scalability issues given legacy structures’ limitations
· Searching for new go-to-market strategies to drive sales growth
· Looking to upgrade to a more robust solution
· Facing challenges given lack of feature depth on SMB-focused platforms
… Attract Customers at Different Stages of Maturity
16

We are recognized as a global leader.
Leader in IDC MarketScape: Worldwide B2C Digital Commerce Platforms
Source: IDC, 2020
Participants
Contenders
Major Players
Leader
Microsoft
Shopify
Skava
Elastic Path
commercetoolsKibo CommerceHCL
2Checkout
Softline
TrueCommerce
Sitecore
Spryker
EpiserverOracle
SAP
Salesforce
Adobe
BigCommerce
17

The age of standalone software is gone – modern software is as valuable as the network it powers.
18

We have a disciplined go- to-market and scaling strategy
Commerce Ecosystem
Ecommerce Software
Higher win rateLower win rate
More than half of leadsfrom ecosystem or in-bound
All leadsfrom the VTEX sales team
Testing the market by getting a first reference customer
Build cases and start recruiting talent
Create momentum by increasing sales and brand awareness
Drive towards leadership, scaling efficiently
19
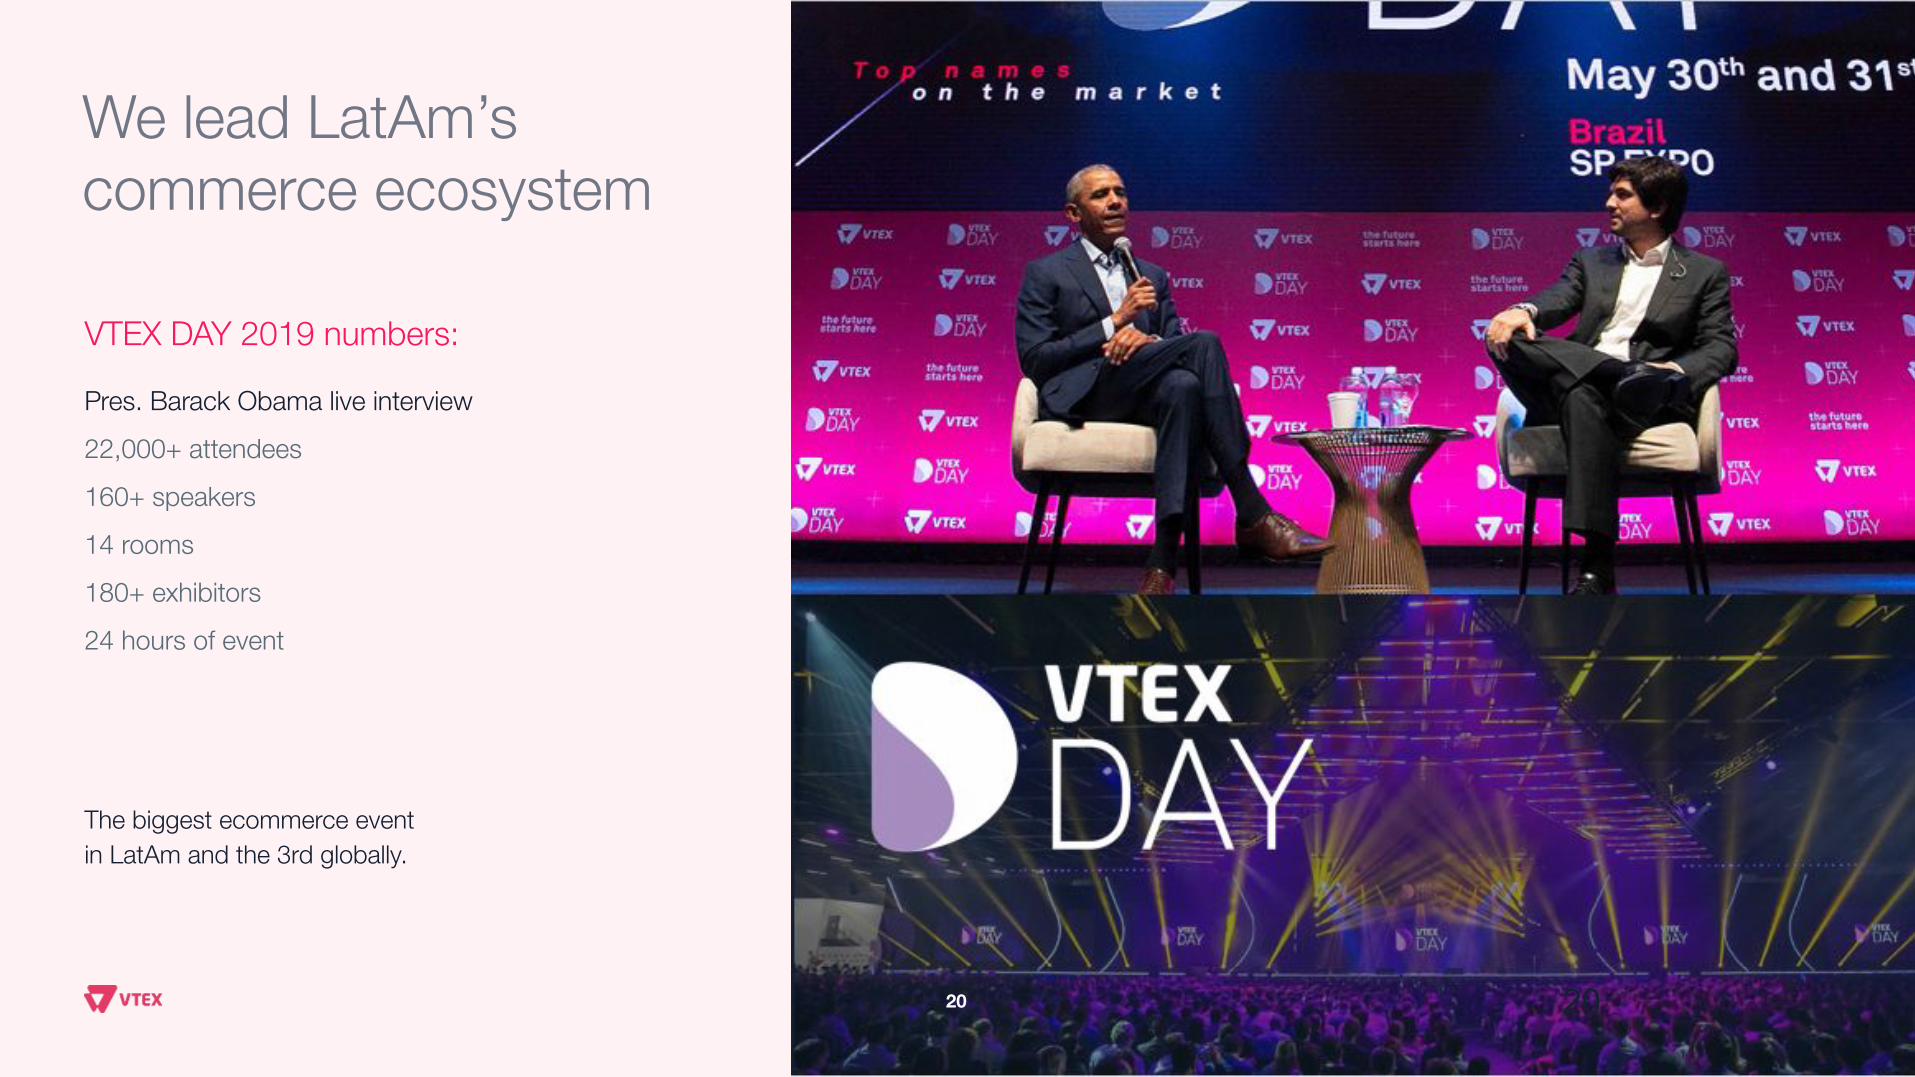
Pres. Barack Obama live interview
22,000+ attendees
160+ speakers
14 rooms
180+ exhibitors
24 hours of event
VTEX DAY 2019 numbers:
We lead LatAm’s commerce ecosystem
The biggest ecommerce event in LatAm and the 3rd globally.
2020
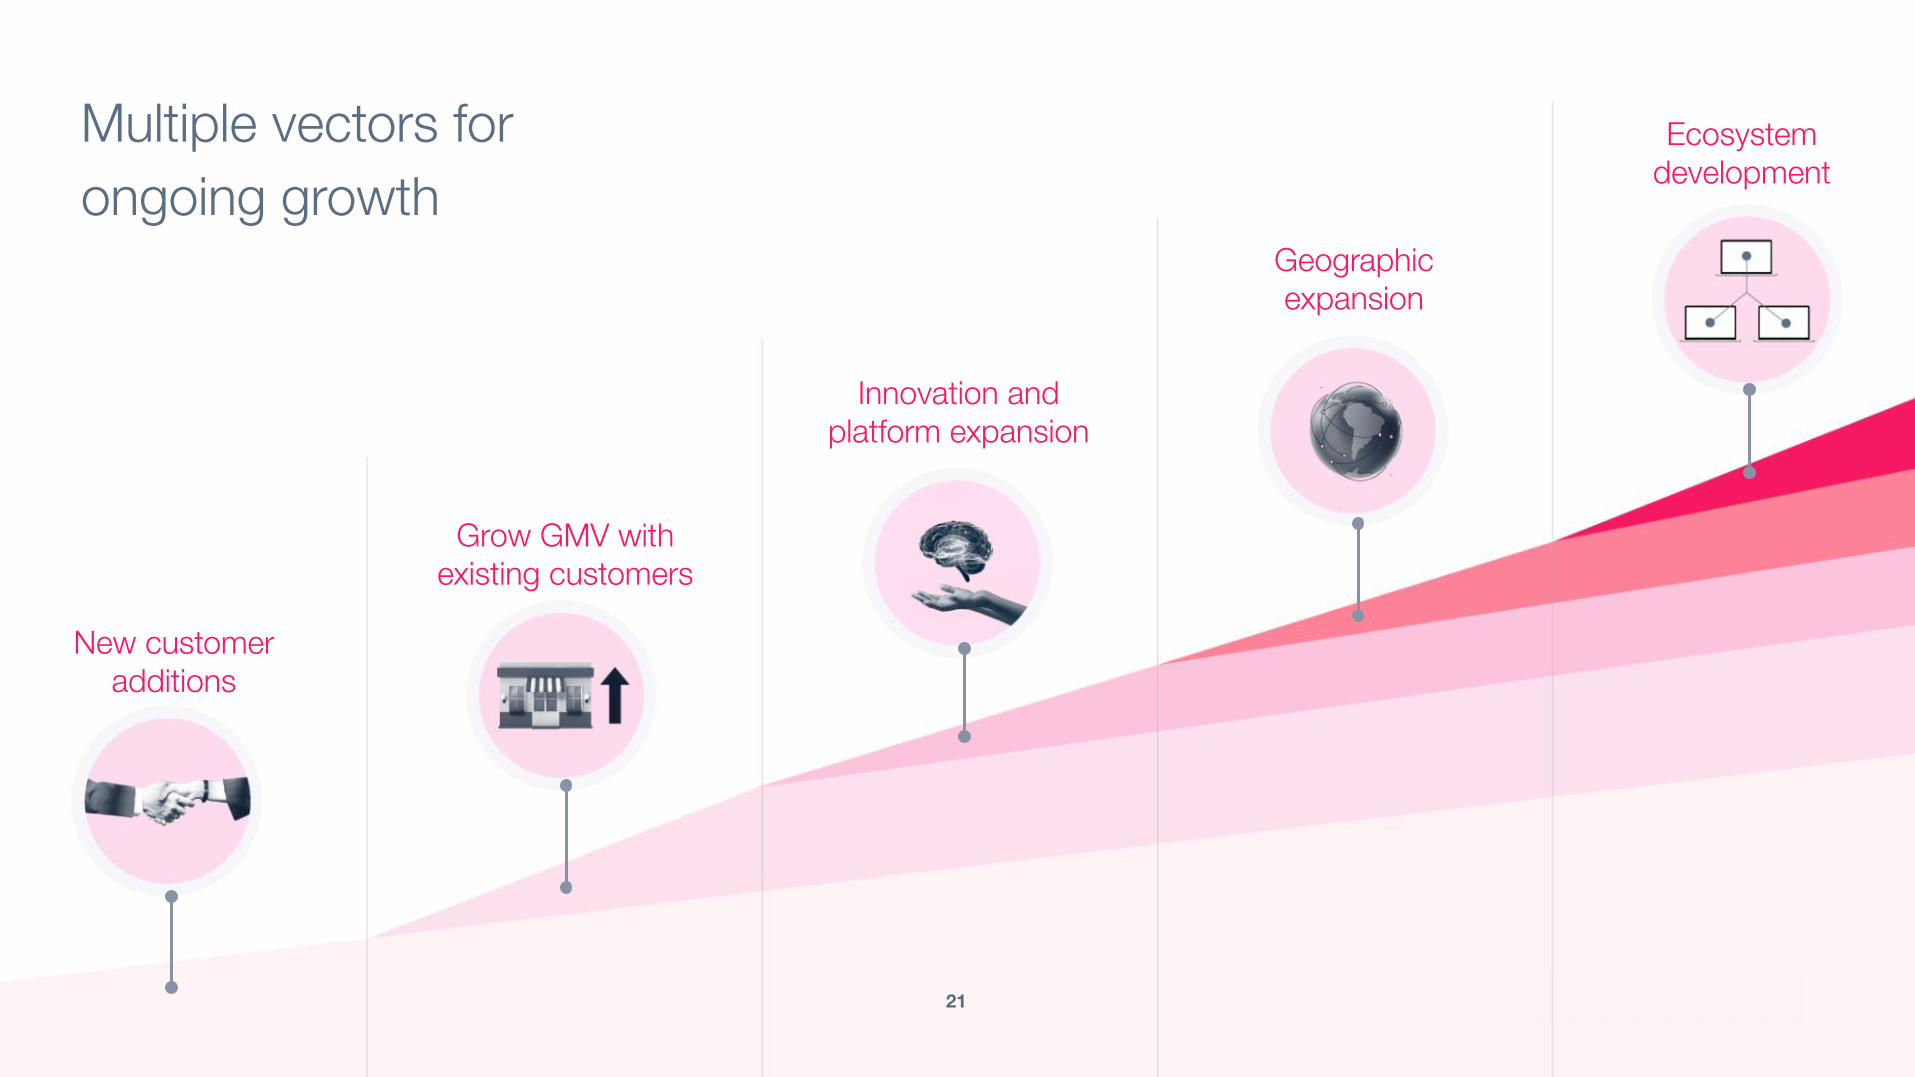
New customeradditions
Grow GMV with existing customers
Innovation and platform expansion
Geographic expansion
Ecosystem development
Multiple vectors for ongoing growth
21

Financial Overview
22

GMV Growth, FX Neutral YoY
We are driven by a scalable and global future
Global Expansion% Revenue
Land-and-ExpandNRR(3) FX Neutral
Logo ExpansionNumber of Stores(2)
44%
95%
167%
71%
2019 vs. 2020
135%
23
With an attractive unit economics: LTV/CAC(1) above 6x
FX NeutralYoY Growth
Only 8% of our customers have two or more stores
+32%
(4)
(1) LTV/CAC means lifetime value to customer acquisition costs. LTV is calculated as gross profit from new sales divided by the subscription churn rate of the last twelve months, and CAC as total sales and marketing expenses incurred during the four quarters preceding the quarter in which the calculation is made.
(2) Active online stores: number of unique domains generating gross merchandise value in Vtex Platform.
(3) NRR means net revenue retention, calculated by dividing the subscription revenue from our platform during the current period by the subscription revenue in the same period of the previous year for the same base of online stores that were active in the same period of the previous year.

Top 100 Customers are growing and opening new storesin the same country and expanding to different countries
# C
ount
ries
# Stores
13 countries 2.2 stores / customer
Circle sizes in proportion to the years’ Avg. ARR / Top 100 Customers
2017
2020
26 countries
3.7 stores / customer
24

We are diversified across verticals. Our software works well for many different industriesWe are also diversified across customer tenure. We create long-term relationships between VTEX and our customersWe have a fragmented and diversified customer base
% of 2020 VTEX revenue
Customer concentration% of 2020 VTEX platform revenue
Customer verticals% of 2020 VTEX platform revenue
Customer tenure
Diversified revenue mix
Others
Toys & Hobbies
Department stores
Home, Furn. & Decor.
Electronics
Home appliances
Grocery
Beauty & Health
Apparel & Accessories
25
<1 year
1-3 years
3+ years
Largest customer
Top 2-10 customers
Other customers
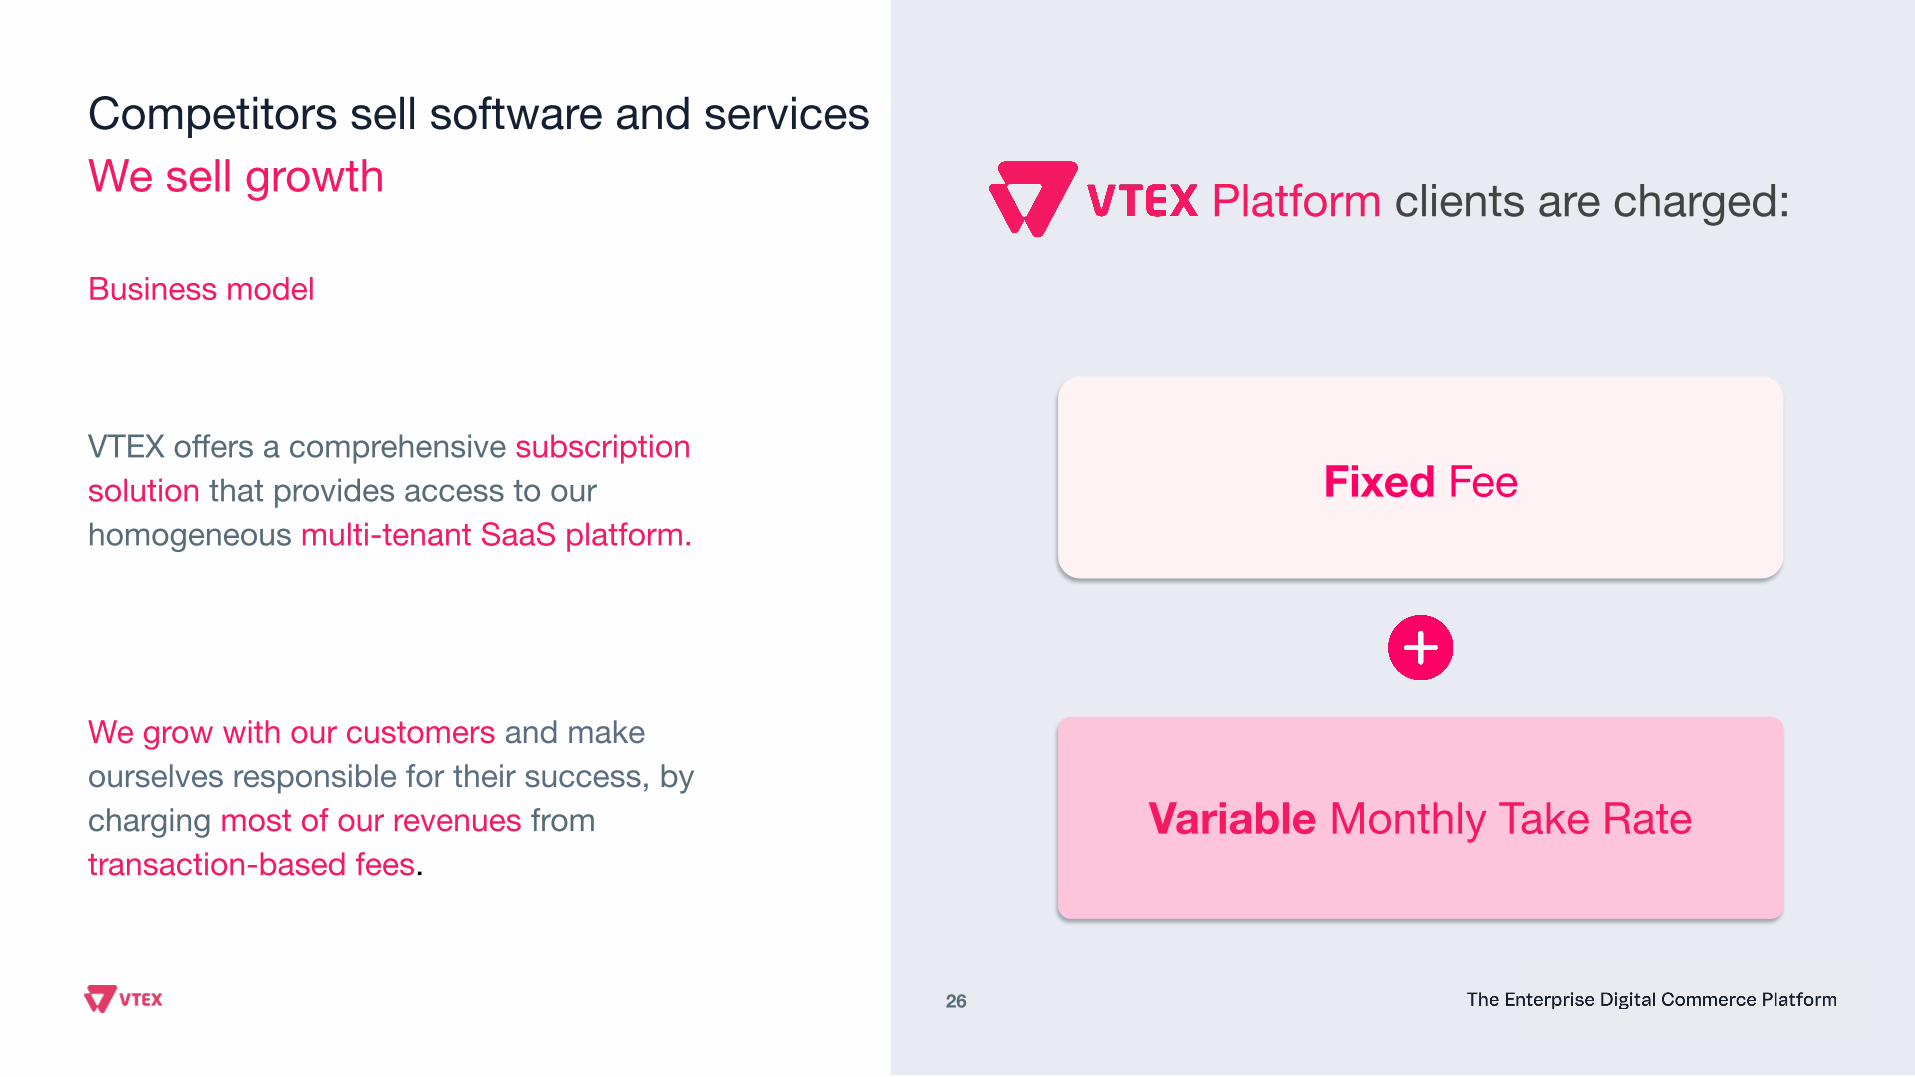
Platform clients are charged:
Fixed Fee
Variable Monthly Take Rate
VTEX offers a comprehensive subscription solution that provides access to our homogeneous multi-tenant SaaS platform.
We grow with our customers and make ourselves responsible for their success, by charging most of our revenues from transaction-based fees.
Competitors sell software and servicesWe sell growth
Business model
26

Cohort analysis on a FX neutral basis. We define a yearly cohort of customers as the group of customers that received the first invoice of our VTEX platform in the prior year to remove customers ramp-up effect from our cohort analysis.
Strong land and expand model driving resultsRevenue cohort, FX neutral (US$ millions)
27

2020 New stores(~15% of VTEX rev., excl. SMB)
~40%
~(120)%
~(20)%
~(14)%
~(115)%
Directional P&L breakdown by existing vs. new stores
% of revenue, non-GAAP 2020A(VTEX platform + SMB + others + services)
Gross margin(1) 65%
Sales & Marketing (23)%
Research & Development (18)%
General & Administrative (13)%
Operating margin 11%
2020 Existing stores(~85% of VTEX rev., excl. SMB)
~70%
~(2)%
~(20)%
~(14)%
~35%
High margin existing stores’ P&L, growing at VTEX’s net revenue retentionInvestment in new stores’ P&L, while impacting margin in short-term, yields returns aligned with our LTV/CAC
(1) Services revenue and services cost are included only in the “New Stores” P&L, as our services are mostly related to white glove PMO service to guide new stores implementations by 3rd party SIs. 28
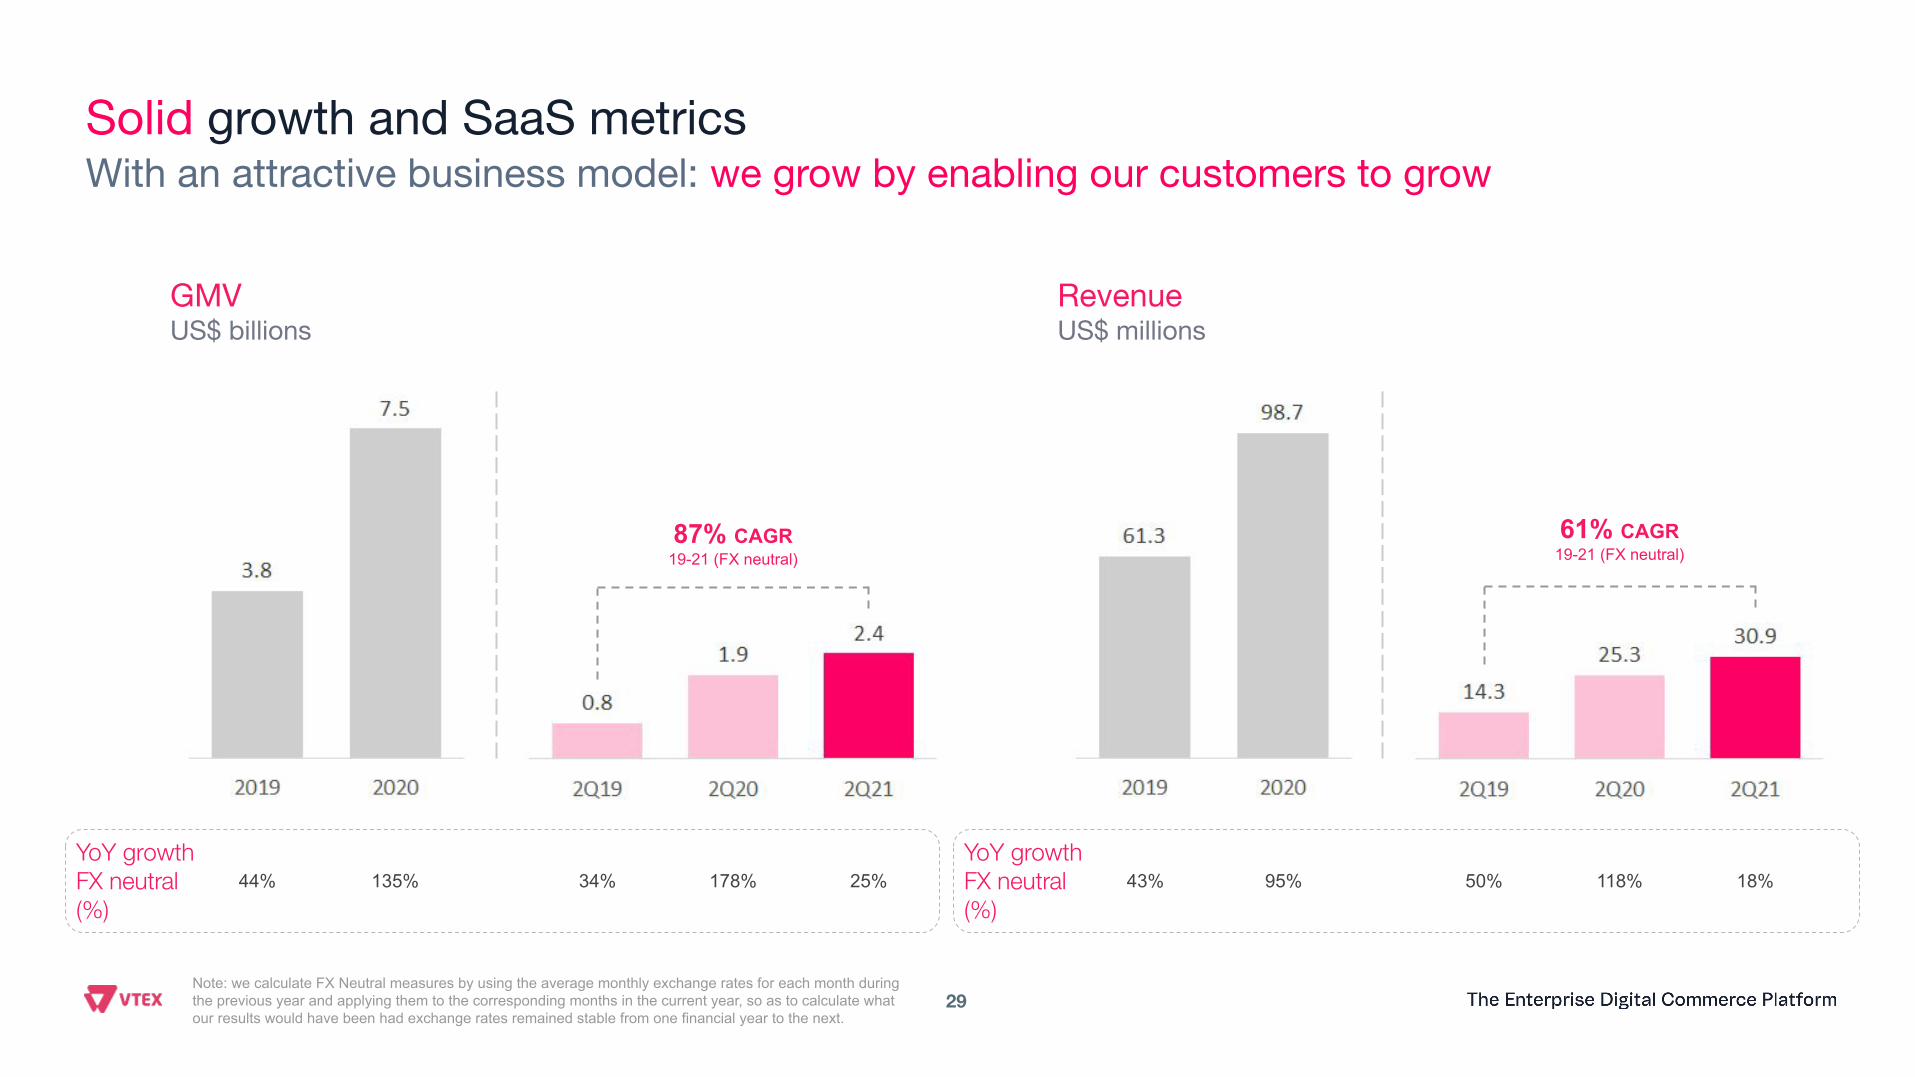
87% CAGR 19-21 (FX neutral)
RevenueUS$ millions
GMVUS$ billions
YoY growth FX neutral (%)
44%
Note: we calculate FX Neutral measures by using the average monthly exchange rates for each month during the previous year and applying them to the corresponding months in the current year, so as to calculate what our results would have been had exchange rates remained stable from one financial year to the next.
135% 178% 25%YoY growth FX neutral (%)
43% 95% 118% 18%34% 50%
61% CAGR 19-21 (FX neutral)
Solid growth and SaaS metricsWith an attractive business model: we grow by enabling our customers to grow
29

2Q21 CAGR (19-21)
FX neutral
2Q21YoY growth
FX neutral
2Q21 CAGR (19-21)
FX neutral
GMV from customers with ARR >$25KCustomers with no relevant brick-and-mortar retail stores operationsincreased their GMV year-over-year by 50% on an FX neutral basis
Existing stores New + existing stores
2Q21YoY growth
FX neutral
2Q21 CAGR (19-21)
FX neutral
2Q21YoY growth
FX neutral
All customers with ARR >$25K
Customers with no relevant brick-and-mortar retail stores
Customers with relevant brick-and-mortar retail stores
30

Non-GAAP subscription gross margin(1)
As % of subscription revenue
S&MR&DG&A
$41 $53 $29$42 $66Subscription gross profit
($mm)
(1) Non-GAAP metrics. See appendix for reconciliation.(2) The total percentage of total expenses over net revenue presented in the chart includes other revenues (expenses).
$16 $20 $24
Non-GAAP loss from operations(1)
As % of revenue(2)
Operating expenses
($mm)
31

Non-GAAP income (loss) from operations bridgeCompression as a result of incremental investments as we move aggressively to capitalize on the acceleration of ecommerce growth
32
Massive TAM
Latam leadership growing globally
Strong VTEX ecosystem
Powerful business model
Blue-chip customer base
Robust technology with speedto market and customization
33

Appendix
34

Subscription gross profit reconciliation(US$ millions)
Subscription gross profit 2019 2020 Q1 2021 Q2 2021 LTM Q2 2021
Subscription revenue 58.3 93.4 24.7 29.7 108.3
Subscription gross profit 42.4 65.6 15.9 20.2 73.2
Shared base compensation 0.0 0.1 0.1 0.2 0.4
Non-GAAP subscription gross profit 42.5 65.7 16.1 20.4 73.6
Non-GAAP subscription gross margin 72.9% 70.3% 65.1% 68.8% 67.9%
35

Non-GAAP operating income reconciliation(US$ millions)
Operating Income 2019 2020 Q1 2021 Q2 2021
Income (loss) from operation (1.8) 6.5 (12.0) (16.4)
Share-based compensation expense 0.7 3.3 3.2 5.5
Amortization of intangible related to acquisitions 0.7 0.8 0.4 0.5
Non-GAAP income (loss) from operations (0.4) 10.6 (8.5) (10.4)
36

Operating expenses reconciliation(US$ millions)
Research & Development 2019 2020 Q1 2021 Q2 2021
Research & Development expense (12.7) (19.0) (8.4) (10.7)
Share-based compensation expense 0.3 1.1 1.1 1.7
Amortization of intangible related to acquisitions 0.6 0.4 0.1 0.2
Non-GAAP Research & Development expense (11.8) (17.5) (7.2) (8.8)
Sales & Marketing 2019 2020 Q1 2021 Q2 2021
Sales & Marketing expense (20.2) (23.8) (11.0) (15.7)
Share-based compensation expense 0.2 1.0 0.7 1.6
Amortization of intangible related to acquisitions 0.2 0.4 0.2 0.3
Non-GAAP Sales & Marketing expense (19.8) (22.4) (10.1) (13.9)
General & Administrative 2019 2020 Q1 2021 Q2 2021
General & Administrative expense (10.7) (14.0) (7.2) (7.8)
Share-based compensation expense 0.2 1.0 1.2 1.9
Non-GAAP General & Administrative expense (10.5) (13.0) (6.1) (5.9)
37

FX neutral measuresreconciliation As Reported FX Neutral
MeasuresAs
Reported
in USD millions 2Q21 2Q20 Percentage Change 2Q21 2Q20 Percentage
Change
Subscription revenue 29.7 23.9 23.9% 28.7 23.9 20.0%
Services revenue 1.2 1.3 (9.0)% 1.2 1.3 (12.5)%
Total revenue 30.9 25.3 22.1% 29.9 25.3 18.2%
Subscription cost (9.5) (5.8) 62.5% (9.3) (5.8) 60.2%
Services cost (2.8) (1.7) 66.3% (2.6) (1.7) 55.8%
Total cost (12.2) (7.5) 63.4% (11.9) (7.5) 59.2%
Gross profit 18.7 17.8 4.8% 18.0 17.8 1.0%
Operating expenses (35.0) (11.7) 200.4% (33.6) (11.7) 188.5%
Income (loss) from operations (16.4) 6.1 n/a (15.7) 6.1 n/a
38


