31
QUARTERLY COMMENTARY 3 30 SEPTEMBER 2015
The Allan Gray Quarterly Commentary is printed on LumiSilk, a paper made from trees grown specifically for paper manufacturing.
The paper is certified by the Forest Stewardship Council (FSC), an organisation which promotes responsible management of the world’s forests.
LONG-TERM THINKING IN ACTION
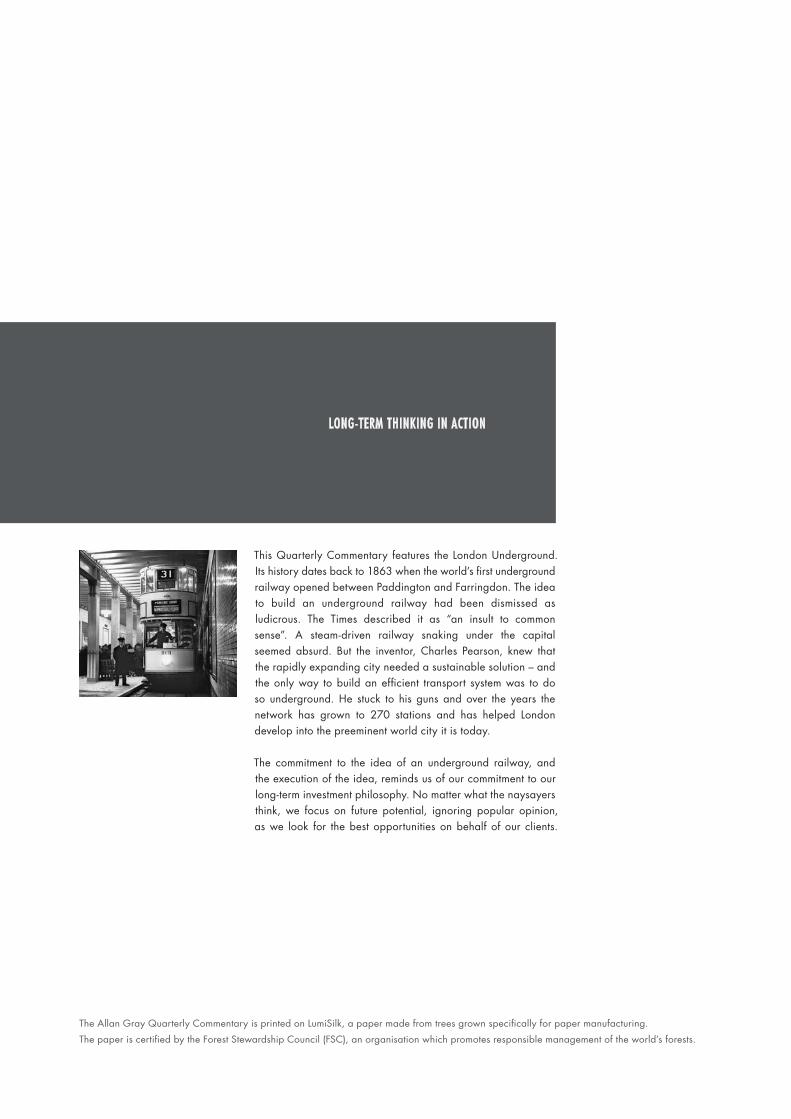
This Quarterly Commentary features the London Underground. Its history dates back to 1863 when the world’s first underground railway opened between Paddington and Farringdon. The idea to build an underground railway had been dismissed as ludicrous. The Times described it as “an insult to common sense”. A steam-driven railway snaking under the capital seemed absurd. But the inventor, Charles Pearson, knew that the rapidly expanding city needed a sustainable solution – and the only way to build an efficient transport system was to do so underground. He stuck to his guns and over the years the network has grown to 270 stations and has helped London develop into the preeminent world city it is today.
The commitment to the idea of an underground railway, and the execution of the idea, reminds us of our commitment to our long-term investment philosophy. No matter what the naysayers think, we focus on future potential, ignoring popular opinion, as we look for the best opportunities on behalf of our clients.
CON T EN T S
01 COMMENTS FROM THE CHIEF OPERATING OFFICER
Rob Dower
03 SA MINING AND THE SUNK COST FALLACY Ian Liddle
06 INVESTING IN AFRICA DEFIES A SIMPLE NARRATIVE Nick Ndiritu
09 CONTRARIAN INVESTING AND DIFFERENT PERFORMANCE Mahesh Cooper
12 VALUATION DISPERSION AND OPPORTUNITIES TO BEAT THE MARKET IN AUSTRALIA Julian Morrison & Werner du Preez
15 COMMITMENT COUNTS Zwelethu Nkosi
17 WHAT IS OUTPERFORMANCE? Thandi Ngwane
19 ALLAN GRAY BALANCED, STABLE AND EQUITY FUND PORTFOLIOS
20 INVESTMENT TRACK RECORD
21 PERFORMANCE AND TOTAL EXPENSE RATIOS
25 IMPORTANT INFORMATION FOR INVESTORS
26 THE ALLAN GRAY GROUP
1 QC 3 2015
COM MEN T S F ROM T HE CHIE F OP ER AT ING OF F IC ER
ROB DOWER
When you buy a share you invest what the current owner is willing to sell it for. As the share’s new owner, your returns come from a stream of dividends (which you may expect to grow or shrink) and the price you sell the share for at some point in the future. Betting on short-term movements in a share price is speculating: long-term investing emphasises purchase price relative to expected future earnings. If you are prepared to hold an investment for a long time, returns depend less on a lucky selling price (and thus changes in sentiment) and more on earnings over time. Rigorous rational analysis of a company’s prospects can uncover opportunities to buy shares for less than they are worth, and thus to earn a return ahead of the market. We stand for long-term, rational investing.
Long term
The thing about communicating ‘long-term rational investing’ to clients and potential clients is that the first two words – long term – are often more interesting to the average reader than the second two – rational investing. Our new television advertisement is no exception and Zwelethu Nkosi
sets out the thinking behind the ad in this edition. You may have seen the ad, which shows a couple separated by the Berlin Wall who wait for each other during divided Germany and are reunited when the wall falls. It is an emotional story with a simple point: perseverance and commitment are generally rewarding.
Rat iona l inves t ing
Each quarter we include some investment pieces that focus on rational investing. I suspect they are mostly read by the more sophisticated few who are looking for ideas on individual stocks. This is a pity. Ian Liddle’s article on sunk cost, with a perspective on South Africa’s mining industry, will be accessible to most readers and is worth the effort. Ian points out the importance of rationally avoiding sunk cost bias when making investment decisions. If a company is issuing new shares to pay down debt or to fund loss-making operations, or to develop part of a mine, the relevant considerations for investors are the value of their current investment, the amount of new capital being asked for, and expected future returns.
It is tempting but wrong to consider, on top of the value of your current investment, the money that you may have invested in previous calls for capital, or the higher price you may have paid for your shares originally. Those are sunk costs.
If shareholders stop injecting capital to support a struggling business that is doomed to fail, there are consequences. Some businesses need to stumble or fail so that better run or more efficient ones replace them: that is an important part of how we make progress. If an industry has excess capacity, the worst-performing businesses have to fail or get smaller to ensure that the rest survive. The human costs of a business shutting down, or of a mine not being developed, are hard to bear and fall disproportionately on those who are less able to afford them. But there are also human costs to a subsidy from investors – who are mostly just ordinary pensioners and savers – to keep an unviable company going for a bit longer, and their capital could be employed more productively for society. Where a whole industry is in trouble the best things we can do
2QC 3 2015
for its survival are to channel scarce capital to only the most effective management teams or the best assets and to set predictable policies that encourage long-term investment. R igorous ra t iona l ana lys i s
Rationality is the investor’s defence against positive and negative hype. In Nigeria the oil industry that has underpinned that country’s economy and trade balance for 15 years faces a supply shock from new production technology in the US, and things are looking bleak. Negativity in Nigeria has had a dramatic impact on share prices but in some cases this is overdone, making bargains of firms with stronger fundamentals – in particular, some of the Nigerian banks. In his piece this quarter, Nick Ndiritu explains that highs and lows come with the territory when investing in Africa. These extremes present opportunities to us as contrarian investors.
Repeating this argument, but from an Orbis perspective, Mahesh Cooper explains that being rationally different is hard, but it is part of our DNA. Being different at times can make
clients uncomfortable, yet it is exactly by being different that we are able to outperform over the long term, with a lower risk of a permanent capital loss.
This quarter’s piece from Allan Gray Australia touches on how we go about finding investment opportunities for our clients. Julian Morrison and Werner du Preez note that the overall level of the Australian stock market suggests that now is not a particularly appealing time to invest in that market in aggregate. Fortunately we don’t have to invest in the aggregate. Analysts prepared to make bottom-up assessments of value in individual shares can identify individual companies that are well priced. In Australia right now, some sectors, and within them some individual stocks, are deeply out of favour. This is good news for all but the forced seller: it improves our likelihood of paying a low price and earning a better return in your funds.
How to eva luate per formance
This is not an easy time for investment decision-making for portfolio managers or for individual savers. Local shares are expensive, or volatile,
or sometimes both, global markets are unpredictably under the spell of monetary policy, our currency is weak. A goal or an objective won’t help you avoid the uncertainty but it will give your decisions some structure. What is a sensible benchmark return to measure your portfolio against? How much risk are you able to take? Do you want your portfolio to perform better than a bank deposit, better than your neighbour’s, better than another similar investment? Thandi Ngwane offers some useful pointers on how to evaluate performance as she answers the question of ‘what is outperformance’?
Thank you for your trust in us and for your rational, long-term commitment.
Kind regards
Rob Dower
3 QC 3 2015
S A M INING A ND T HE SUNK CO S T FA L L AC Y
IAN L IDDLE
Ian Liddle discusses why the challenges in South African mining provide an interesting case study of the ‘sunk cost fallacy’, a behavioural bias that sees us honouring sunk costs that are irrelevant to decisions which should be based on future costs and benefits.
I vividly remember my first economics lecture at the University of Cape Town. Our lecturer explained the concept of a ‘sunk cost’: a cost which has already been incurred and cannot be recovered. He went on to explain that a sunk cost is irrelevant to rational economic decision-making, as future outcomes are independent of the sunk cost. But even students of economics fall prey to the ‘sunk cost fallacy’ by allowing a consideration of sunk costs, instead of the future costs and benefits, to affect their decision on whether to continue with a certain activity. You may have heard this trap referred to as ‘throwing good money after bad’.
This behavioural bias is fascinating for anyone interested in psychology, business and investing. A simple Google search will reveal many theoretical and practical examples.
See text boxes 1 and 2 for examples. It is not yet clear whether a growing awareness of cognitive biases and their pitfalls, aided by bestselling books such as Daniel Kahneman’s ‘Thinking, Fast and Slow’, has improved the quality of business
and investment decision-making. The unfolding challenges in South African mining are providing an interesting real world case study of the sunk cost dilemma and how people respond.
Assume you have spent R5 000 for a weekend hiking trip to the Drakensberg. Several weeks later you spend R2 500 for a weekend hiking trip to the Waterberg. You think you will enjoy the Waterberg trip more than the Drakensberg trip. But then you realise that you have booked both trips for the same weekend, and you cannot get a refund for either. You must go on one trip and not the other. Which trip do you go on?
One would expect everyone to choose the trip which is expected to be more enjoyable – the Waterberg trip. But a surprisingly large number of people choose the Drakensberg trip in experiments like this. The larger sunk cost of the Drakensberg trip is clearly influencing their choice.
Another classic example is provided by Britain and France subsidising losses for the development and operation of the Concorde (the first supersonic commercial airliner) for decades with very little prospect of a commercial return. This led to the coining of the term the ‘Concorde fallacy’ to describe the misguided spending of more money on a project in order not to ‘waste’ the money previously spent on it.
TEXT BOX 1: THE SUNK COST FALLACY (ADAPTED FROM ARKES AND BLUMER (1985))
4QC 3 2015
“THE UNFOLDING CHALLENGES IN SOUTH AFRICAN MINING ARE PROVIDING AN INTERESTING REAL WORLD CASE
STUDY OF THE SUNK COST DILEMMA”
A host of chal lenges
Past investment in South African mines is ‘sunk’ in more than one sense. A mine shaft cannot be moved to a more favourable location or sold for any significant scrap value. In previous commentaries we have written at length about the many challenges facing South African mining companies (see Tim Acker’s piece in Quarterly Commentary 1, 2015 and my piece in Quarterly Commentary 4, 2013). Falling commodity prices present a major problem. But this problem is magnified by the inhospitable environment in which South African mining companies have to operate.
Many of our mines are nearing the latter part of their expected lives, which means that working areas are far from the shafts and grades are not as high as they once were. Government officials frequently exercise their power to stop the operations of an entire mine or shaft in terms of a ‘Section 54 safety stoppage’. These stoppages reduce productivity and increase costs. While mining companies all support measures to improve safety, and they have dramatically improved their safety performance over the last decade, they argue that a mine- or shaft-wide closure is often too draconian for relatively minor offences.
Policy uncertainty and surprising changes of key officials (such as the Minister of Mineral Resources) make it hard for mining companies to
know the ‘rules of the game’ and to make long-term decisions. Important stakeholders in South African mines, such as the government and unions, seem reluctant to adjust their demands to the challenging times. South African
labour rules give substantial power to union bosses and mine productivity is hampered by very inflexible labour regulations. Labour and electricity costs continue to escalate faster than the inflation rate. The managers of mining companies have tended to woefully under-estimate the extent of these challenges and over-estimate their ability to improve the operating performance of the mines. To make matters worse, complaints about South Africa’s ‘own goals’ and self-inflicted policy challenges seem to fall on deaf ears. It is hard to see the incumbent administration introducing any substantive positive changes to the policy environment unless they are forced to do so by the crisis in South African mining coming to a head.
South African mining examples
Conditions have deteriorated to the point where a number of South African mines are running out of money and credit and are being
forced to raise new capital to repay debt and sustain their operations. This is where the sunk cost dilemma comes in. The dilemma is faced both by company boards and by fund managers like us.
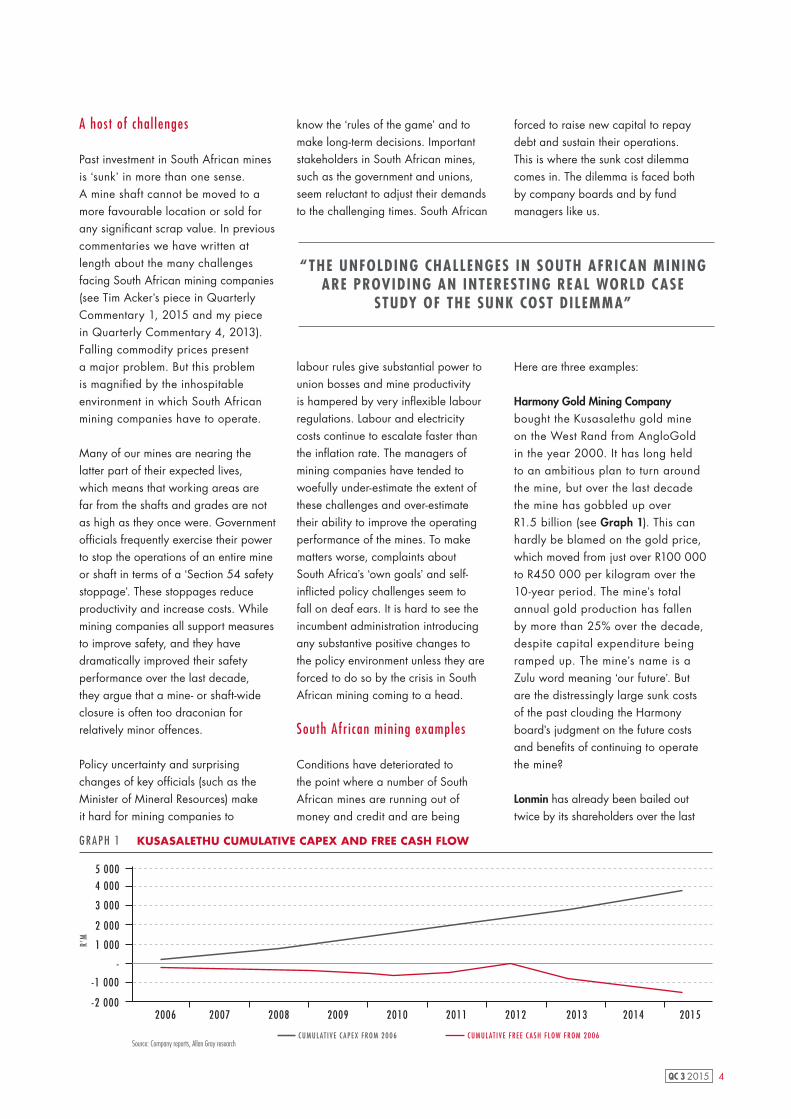
Here are three examples: Harmony Gold Mining Company bought the Kusasalethu gold mine on the West Rand from AngloGold in the year 2000. It has long held to an ambitious plan to turn around the mine, but over the last decade the mine has gobbled up over R1.5 billion (see Graph 1). This can hardly be blamed on the gold price, which moved from just over R100 000 to R450 000 per kilogram over the 10-year period. The mine’s total annual gold production has fallen by more than 25% over the decade, despite capital expenditure being ramped up. The mine’s name is a Zulu word meaning ‘our future’. But are the distressingly large sunk costs of the past clouding the Harmony board’s judgment on the future costs and benefits of continuing to operate the mine?
Lonmin has already been bailed out twice by its shareholders over the last
2006-2 000
-1 000
-
1 000
2 000
3 000
4 0005 000
2007 2008 2009 2010 2011 2012 2013 2014 2015
CUMULAT IVE CAPEX FROM 2006 CUMULAT IVE FREE CASH F LOW FROM 2006Source: Company reports, Allan Gray research
GRAPH 1 KUSASALETHU CUMULATIVE CAPEX AND FREE CASH FLOW
R’M
5 QC 3 2015
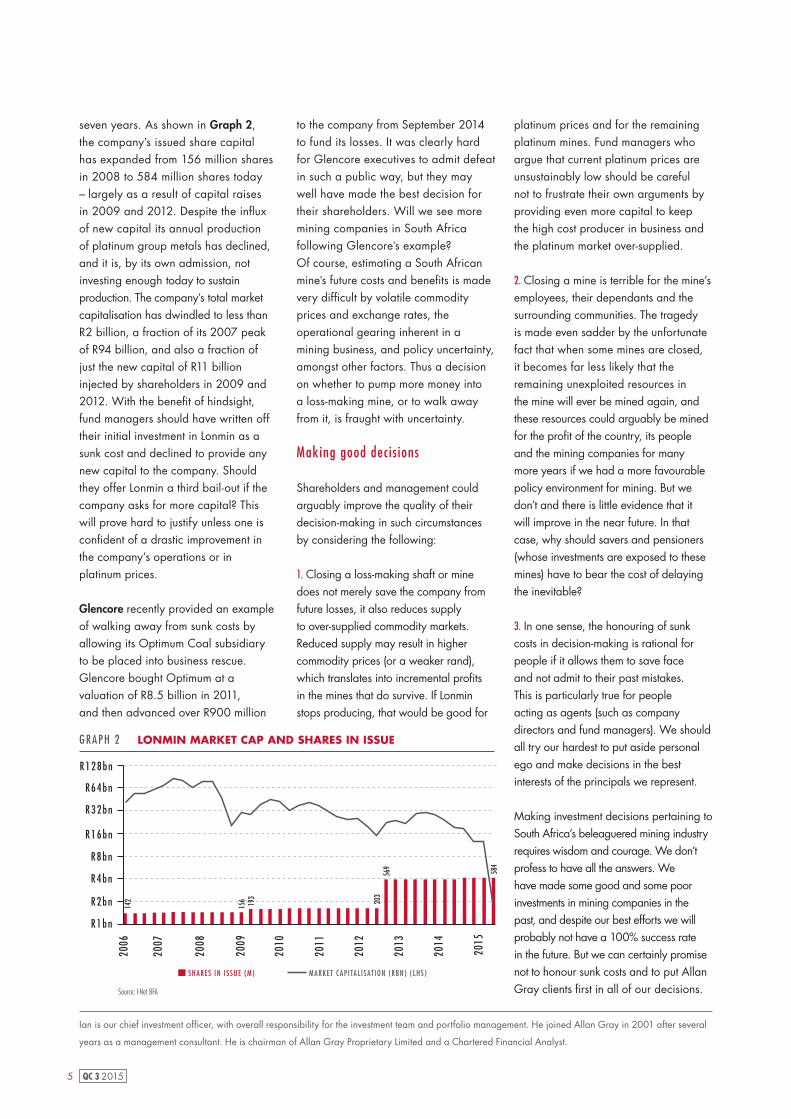
seven years. As shown in Graph 2, the company’s issued share capital has expanded from 156 million shares in 2008 to 584 million shares today – largely as a result of capital raises in 2009 and 2012. Despite the influx of new capital its annual production of platinum group metals has declined, and it is, by its own admission, not investing enough today to sustain production. The company’s total market capitalisation has dwindled to less than R2 billion, a fraction of its 2007 peak of R94 billion, and also a fraction of just the new capital of R11 billion injected by shareholders in 2009 and 2012. With the benefit of hindsight, fund managers should have written off their initial investment in Lonmin as a sunk cost and declined to provide any new capital to the company. Should they offer Lonmin a third bail-out if the company asks for more capital? This will prove hard to justify unless one is confident of a drastic improvement in the company’s operations or in platinum prices.
Glencore recently provided an example of walking away from sunk costs by allowing its Optimum Coal subsidiary to be placed into business rescue. Glencore bought Optimum at a valuation of R8.5 billion in 2011, and then advanced over R900 million
to the company from September 2014 to fund its losses. It was clearly hard for Glencore executives to admit defeat in such a public way, but they may well have made the best decision for their shareholders. Will we see more mining companies in South Africa following Glencore’s example?Of course, estimating a South African mine’s future costs and benefits is made very difficult by volatile commodity prices and exchange rates, the operational gearing inherent in a mining business, and policy uncertainty, amongst other factors. Thus a decision on whether to pump more money into a loss-making mine, or to walk away from it, is fraught with uncertainty.
Making good decis ions
Shareholders and management could arguably improve the quality of their decision-making in such circumstances by considering the following:
1. Closing a loss-making shaft or mine does not merely save the company from future losses, it also reduces supply to over-supplied commodity markets. Reduced supply may result in higher commodity prices (or a weaker rand), which translates into incremental profits in the mines that do survive. If Lonmin stops producing, that would be good for
platinum prices and for the remaining platinum mines. Fund managers who argue that current platinum prices are unsustainably low should be careful not to frustrate their own arguments by providing even more capital to keep the high cost producer in business and the platinum market over-supplied.
2. Closing a mine is terrible for the mine’s employees, their dependants and the surrounding communities. The tragedyis made even sadder by the unfortunate fact that when some mines are closed, it becomes far less likely that the remaining unexploited resources inthe mine will ever be mined again, and these resources could arguably be mined for the profit of the country, its people and the mining companies for manymore years if we had a more favourable policy environment for mining. But we don’t and there is little evidence that it will improve in the near future. In that case, why should savers and pensioners (whose investments are exposed to these mines) have to bear the cost of delaying the inevitable?
3. In one sense, the honouring of sunk costs in decision-making is rational for people if it allows them to save face and not admit to their past mistakes. This is particularly true for people acting as agents (such as company directors and fund managers). We should all try our hardest to put aside personal ego and make decisions in the best interests of the principals we represent.
Making investment decisions pertaining to South Africa’s beleaguered mining industry requires wisdom and courage. We don’t profess to have all the answers. We have made some good and some poor investments in mining companies in the past, and despite our best efforts we will probably not have a 100% success rate in the future. But we can certainly promise not to honour sunk costs and to put Allan Gray clients first in all of our decisions.
Ian is our chief investment officer, with overall responsibility for the investment team and portfolio management. He joined Allan Gray in 2001 after several
years as a management consultant. He is chairman of Allan Gray Proprietary Limited and a Chartered Financial Analyst.
2006
2007
2008
2009
2010
2011
2012
2013
2014
2015
R 1bn
R2bn
R4bn
R8bn
R16bn
R32bn
R64bn
R128bn
GRAPH 2 LONMIN MARKET CAP AND SHARES IN ISSUE
Source: I-Net BFA
SHARES IN I S SUE (M) MARKET CAP I TAL I SAT ION (RBN) ( LHS )
142
156 193
203
569
584
6QC 3 2015
IN V E S T ING IN A F R IC A DEF IE S A S IMP L E N A R R AT I V E
NICK NDIRITU
Our Equity, Balanced and Stable Funds are allowed to invest up to 5% in Africa outside of South Africa. Some investors may choose to invest directly into Africa outside of South Africa through our Africa ex-SA Equity Fund and our Africa ex-SA Bond Fund. Highs and lows come with the territory when investing in Africa - these extremes present opportunities to us as contrarian investors. Nick Ndiritu explains where to look, even when things seem to be falling apart.
In 1958, a little-known Nigerian writer named Chinua Achebe wrote a ground-breaking novel about his country that often seems prophetic. Things Fall Apart introduces us to the unfamiliar world of a traditional African village in the 1890s, but the storyline has universal resonance. A flawed protagonist, who is successful in his enterprise, struggles to reconcile the old and new ways of life. Context matters. The critically acclaimed book was one of the earliest narratives told from the perspective of African experiences, using the language of folklore and oral traditions passed down through the generations. This contrasted with
the dominant image of Africa at the time, largely shaped by the writings of sojourners dating back to the mid-sixteenth century - Africa was at best a fantasy world of romance and nostalgia, and at worst, the antithesis of civilisation.
N ig e r i a : c h an g i n g s en t im en t
In today’s monetary tale, Nigeria hasn’t escaped Achebe’s metaphor of Things Fall Apart. Nigeria has come full circle from a favourite investor destination to prevailing negative sentiment over its economic direction. Low oil prices have exposed the cracks in a house built on petrodollars. The Central Bank has introduced capital controls to avoid further currency devaluation. Many investors are uncomfortable with the uncertainty. Some emerging and frontier market funds, experiencing significant capital outflows, are forced sellers of Nigerian equities. Nigeria’s All Share Index is down 43% in US dollars since the collapse in oil prices, while sovereign spreads on US$-denominated bonds due in 2021 have widened by over 400 basis points.
An environment of widespread fear appears ripe for bargain hunters. Nigerian consumer companies had become buy-and-hold growth stocks trading on lofty valuations before oil prices collapsed. While these companies have recently re-rated, we struggle to justify the implied growth assumptions. On the other hand, valuations for Nigerian banksare extrapolating catastrophe into the foreseeable future. Therein lies opportunity.
Emerg ing midd le c las s consumer a t a cros sroads
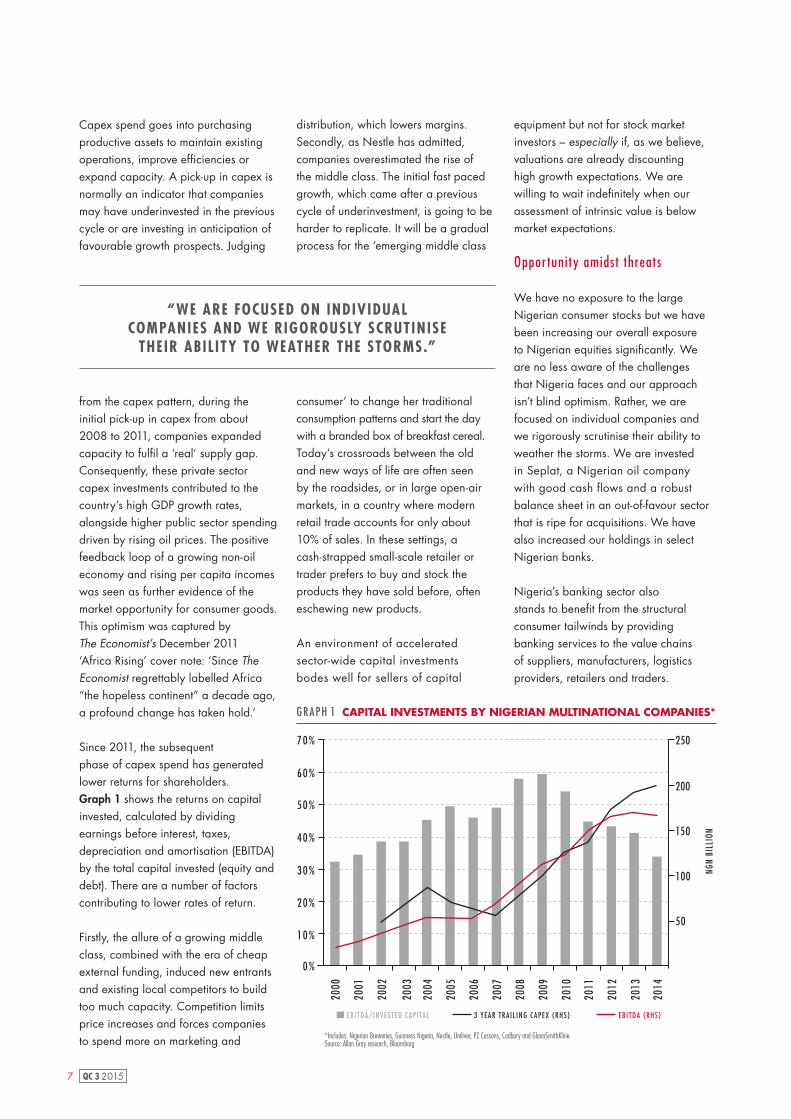
Multinational consumer companies such as Heineken, Diageo, Nestle and Unilever have been lured into expanding their presence in Nigeria by the prospect of a vibrant emerging middle class. Over the last 15 years, seven publicly listed subsidiaries of multinationals operating in Nigeria have invested about US$4bn into the Nigerian economy. Their aggregate capital expenditure (capex) star ted to pick-up in 2008 and about two-thirds of the capex has been invested in the last seven years.
7 QC 3 2015
Capex spend goes into purchasing productive assets to maintain existing operations, improve efficiencies or expand capacity. A pick-up in capex is normally an indicator that companies may have underinvested in the previous cycle or are investing in anticipation of favourable growth prospects. Judging
from the capex pattern, during the initial pick-up in capex from about 2008 to 2011, companies expanded capacity to fulfil a ‘real’ supply gap. Consequently, these private sector capex investments contributed to the country’s high GDP growth rates, alongside higher public sector spending driven by rising oil prices. The positive feedback loop of a growing non-oil economy and rising per capita incomes was seen as further evidence of the market opportunity for consumer goods. This optimism was captured by The Economist’s December 2011 ‘Africa Rising’ cover note: ’Since The Economist regrettably labelled Africa “the hopeless continent” a decade ago, a profound change has taken hold.’
Since 2011, the subsequentphase of capex spend has generated lower returns for shareholders. Graph 1 shows the returns on capital invested, calculated by dividing earnings before interest, taxes, depreciation and amortisation (EBITDA) by the total capital invested (equity and debt). There are a number of factors contributing to lower rates of return.
Firstly, the allure of a growing middle class, combined with the era of cheap external funding, induced new entrants and existing local competitors to build too much capacity. Competition limits price increases and forces companies to spend more on marketing and
distribution, which lowers margins. Secondly, as Nestle has admitted, companies overestimated the rise of the middle class. The initial fast paced growth, which came after a previous cycle of underinvestment, is going to be harder to replicate. It will be a gradual process for the ‘emerging middle class
consumer’ to change her traditional consumption patterns and start the day with a branded box of breakfast cereal. Today’s crossroads between the old and new ways of life are often seen by the roadsides, or in large open-air markets, in a country where modern retail trade accounts for only about 10% of sales. In these settings, a cash-strapped small-scale retailer or trader prefers to buy and stock the products they have sold before, often eschewing new products.
An environment of accelerated sector-wide capital investments bodes well for sellers of capital
equipment but not for stock market investors – especially if, as we believe, valuations are already discounting high growth expectations. We are willing to wait indefinitely when our assessment of intrinsic value is below market expectations.
Oppor tuni ty amidst threat s We have no exposure to the large Nigerian consumer stocks but we have been increasing our overall exposure to Nigerian equities significantly. We are no less aware of the challenges that Nigeria faces and our approach isn’t blind optimism. Rather, we are focused on individual companies and we rigorously scrutinise their ability to weather the storms. We are invested in Seplat, a Nigerian oil company with good cash flows and a robust balance sheet in an out-of-favour sector that is ripe for acquisitions. We have also increased our holdings in select Nigerian banks.
Nigeria’s banking sector also stands to benefit from the structural consumer tailwinds by providing banking services to the value chains of suppliers, manufacturers, logistics providers, retailers and traders.
GRAPH 1 CAPITAL INVESTMENTS BY NIGERIAN MULTINATIONAL COMPANIES*
*Includes: Nigerian Breweries, Guinness Nigeria, Nestle, Uniliver, PZ Cussons, Cadbury and GlaxoSmithKline Source: Allan Gray research, Bloomberg
EB I TDA/ INVESTED CAP I TAL 3 YEAR TRA I L ING CAPEX (RHS ) EB I TDA (RHS )
60%
70% 250
200
150
100
50
50%
40%
30%
20%
10%
0%
2000
2003
2001
2004
2006
2009
2013
2002
2005
2008
2012
2007
2011
2010
2014
“WE ARE FOCUSED ON INDIVIDUAL COMPANIES AND WE RIGOROUSLY SCRUTINISE
THEIR ABIL ITY TO WEATHER THE STORMS.”
NGN
BILL
ION
8QC 3 2015
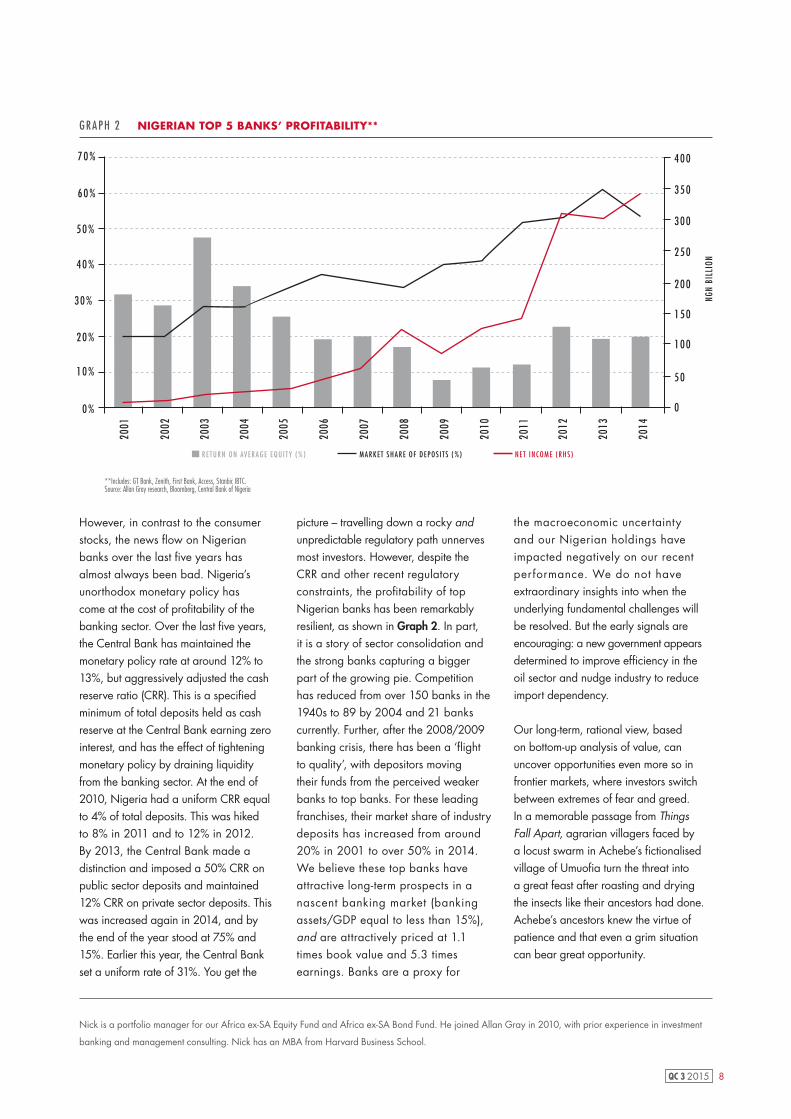
However, in contrast to the consumer stocks, the news flow on Nigerian banks over the last five years has almost always been bad. Nigeria’s unorthodox monetary policy has come at the cost of profitability of the banking sector. Over the last five years, the Central Bank has maintained the monetary policy rate at around 12% to 13%, but aggressively adjusted the cash reserve ratio (CRR). This is a specified minimum of total deposits held as cash reserve at the Central Bank earning zero interest, and has the effect of tightening monetary policy by draining liquidity from the banking sector. At the end of 2010, Nigeria had a uniform CRR equal to 4% of total deposits. This was hiked to 8% in 2011 and to 12% in 2012. By 2013, the Central Bank made a distinction and imposed a 50% CRR on public sector deposits and maintained 12% CRR on private sector deposits. This was increased again in 2014, and by the end of the year stood at 75% and 15%. Earlier this year, the Central Bank set a uniform rate of 31%. You get the
picture – travelling down a rocky and unpredictable regulatory path unnerves most investors. However, despite the CRR and other recent regulatory constraints, the profitability of top Nigerian banks has been remarkably resilient, as shown in Graph 2. In part, it is a story of sector consolidation and the strong banks capturing a bigger part of the growing pie. Competition has reduced from over 150 banks in the 1940s to 89 by 2004 and 21 banks currently. Further, after the 2008/2009 banking crisis, there has been a ‘flight to quality’, with depositors moving their funds from the perceived weaker banks to top banks. For these leading franchises, their market share of industry deposits has increased from around 20% in 2001 to over 50% in 2014. We believe these top banks have attractive long-term prospects in a nascent banking market (banking assets/GDP equal to less than 15%), and are attractively priced at 1.1 times book value and 5.3 times earnings. Banks are a proxy for
the macroeconomic uncertainty and our Nigerian holdings have impacted negatively on our recent performance. We do not have extraordinary insights into when the underlying fundamental challenges will be resolved. But the early signals are encouraging: a new government appears determined to improve efficiency in the oil sector and nudge industry to reduce import dependency.
Our long-term, rational view, based on bottom-up analysis of value, can uncover opportunities even more so in frontier markets, where investors switch between extremes of fear and greed. In a memorable passage from Things Fall Apart, agrarian villagers faced by a locust swarm in Achebe’s fictionalised village of Umuofia turn the threat into a great feast after roasting and drying the insects like their ancestors had done. Achebe’s ancestors knew the virtue of patience and that even a grim situation can bear great opportunity.
GRAPH 2 NIGERIAN TOP 5 BANKS’ PROFITABILITY**
** Includes: GT Bank, Zenith, First Bank, Access, Stanbic IBTC. Source: Allan Gray research, Bloomberg, Central Bank of Nigeria
60%
70%
50%
40%
30%
20%
10%
0%
400
350
300
250
200
150
100
50
0
2001
2003
2004
2005
2006
2007
2008
2009
2010
2011
2012
2013
2014
2002
R E TURN ON AVERAGE EQU I TY (%) MARKET SHARE OF DEPOS I TS (%) NET INCOME (RHS )
NGN
BILL
ION
Nick is a portfolio manager for our Africa ex-SA Equity Fund and Africa ex-SA Bond Fund. He joined Allan Gray in 2010, with prior experience in investment
banking and management consulting. Nick has an MBA from Harvard Business School.
9 QC 3 2015
CON T R A R I A N IN V E S T ING A ND D IF F ER EN T P ER F OR M A NCE
MAHESH COOPER
“BEING A CONTRARIAN STOCK PICKER, ORBIS, L IKE ALLAN GRAY, CAN CHOOSE WHAT TO BUY AND
WHAT TO AVOID IN THEIR FUNDS.”
The valuation-based approach to investing used by Allan Gray and our offshore partner Orbis is often contrarian since the shares that are most attractively priced relative to intrinsic value are also often those that are least popular. Mahesh Cooper explains why being different at times to the crowd can make us appear risky to clients, yet it is exactly by being different that we are able to outperform over the long term, and able to do so with a lower risk of a permanent capital loss.
By definition, an index owns more of what has gone up and less of what has not. When markets move to extremes, this is reflected in the index with that particular sector or country representing a substantially larger portion of the index relative to history. Being a contrarian stock picker, Orbis, like Allan Gray, can choose what to buy and what to avoid in their funds. This bottom-up stock picking approach to building a portfolio allows Orbis to invest in the most attractive opportunities from a return-risk perspective, rather than focusing on, or anchoring to, that stock’s weighting in the index.
How ac t ive is your manager?
Active share is a measure which allows investors to compare how different a manager’s portfolio is from the benchmark (Seema Dala wrote about this concept in Quarterly Commentary 3, 2014).
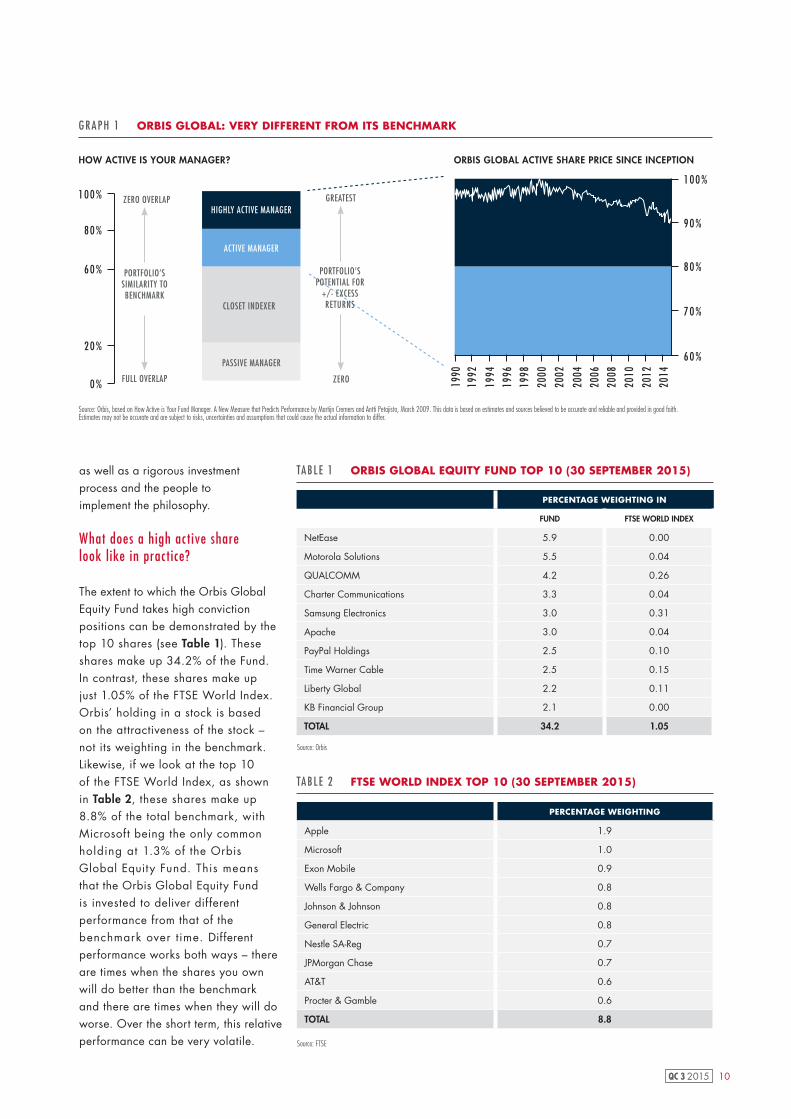
A low active share implies that there is a substantial overlap between the portfolio and the benchmark. This means that the returns generated by such a portfolio will track the performance of the benchmark, before fees. Passive funds and index trackers have low active shares. Likewise a high active share means that the portfolio is very different from the benchmark, with very little overlap between the shares in the portfolio and those in the benchmark. This means that there is a high probability that the returns generated by high active share portfolios will be very different from the benchmark. As can be seen in Graph 1, it should be
no surprise that a contrarian manager like Orbis has a very high active share. The active share is currently 91%, which means that only 9% of the Orbis Global Equity Fund mirrors what is invested in the benchmark. Importantly, Orbis does not target
a particular active share. It is the result of their bottom-up stock picking process, coupled with a philosophy underpinned by investing with conviction, that results in their equity funds having a high active share. Of course, while it may be easy to create a portfolio with a high active share (one could just buy shares that are different from the benchmark), it is more difficult to create a portfolio that is both different and will outperform the benchmark over time. As Howard Marks recently said, one must be ’different and better’. This requires the discipline of a tried and tested investment philosophy,
10QC 3 2015
as well as a rigorous investment process and the people to implement the philosophy.
What does a high active sharelook like in practice?
The extent to which the Orbis Global Equity Fund takes high conviction positions can be demonstrated by the top 10 shares (see Table 1). These shares make up 34.2% of the Fund. In contrast, these shares make up just 1.05% of the FTSE World Index. Orbis’ holding in a stock is based on the attractiveness of the stock – not its weighting in the benchmark. Likewise, if we look at the top 10 of the FTSE World Index, as shown in Table 2, these shares make up 8.8% of the total benchmark, with Microsoft being the only common holding at 1.3% of the Orbis Global Equity Fund. This means that the Orbis Global Equity Fund is invested to deliver different performance from that of the benchmark over time. Different performance works both ways – there are times when the shares you own will do better than the benchmark and there are times when they will do worse. Over the short term, this relative performance can be very volatile.
100%
90%
80%
70%
60%
1990
1996
2006
2012
1992
2002
1998
2008
2014
1994
2004
2000
2010
PORTFOLIO’S POTENTIAL FOR
+/- EXCESSRETURNS
PORTFOLIO’S SIMILARITY TOBENCHMARK
ZERO
PASSIVE MANAGER
CLOSET INDEXER
ACTIVE MANAGER
HIGHLY ACTIVE MANAGERGREATESTZERO OVERLAP
FULL OVERLAP
60%
80%
100%
20%
0%
GRAPH 1 ORBIS GLOBAL: VERY DIFFERENT FROM ITS BENCHMARK
HOW ACTIVE IS YOUR MANAGER? ORBIS GLOBAL ACTIVE SHARE PRICE SINCE INCEPTION
Source: Orbis, based on How Active is Your Fund Manager. A New Measure that Predicts Performance by Martijn Cremers and Antti Petajisto, March 2009. This data is based on estimates and sources believed to be accurate and reliable and provided in good faith. Estimates may not be accurate and are subject to risks, uncertainties and assumptions that could cause the actual information to differ.
TABLE 1 ORBIS GLOBAL EQUITY FUND TOP 10 (30 SEPTEMBER 2015)
PERCENTAGE WEIGHTING IN
FUND FTSE WORLD INDEX
NetEase 5.9 0.00
Motorola Solutions 5.5 0.04
QUALCOMM 4.2 0.26
Charter Communications 3.3 0.04
Samsung Electronics 3.0 0.31
Apache 3.0 0.04
PayPal Holdings 2.5 0.10
Time Warner Cable 2.5 0.15
Liberty Global 2.2 0.11
KB Financial Group 2.1 0.00
TOTAL 34.2 1.05
Source: FTSE
Source: Orbis
PERCENTAGE WEIGHTING
Apple 1.9
Microsoft 1.0
Exon Mobile 0.9
Wells Fargo & Company 0.8
Johnson & Johnson 0.8
General Electric 0.8
Nestle SA-Reg 0.7
JPMorgan Chase 0.7
AT&T 0.6
Procter & Gamble 0.6
TOTAL 8.8
TABLE 2 FTSE WORLD INDEX TOP 10 (30 SEPTEMBER 2015)
11 QC 3 2015
Mahesh is a director of Allan Gray Proprietary Limited. He joined Allan Gray in 2003, having had previous experience in investment and healthcare consulting.
He completed his BBusSc degree at UCT and his MBA at IMD. He is a qualified actuary.
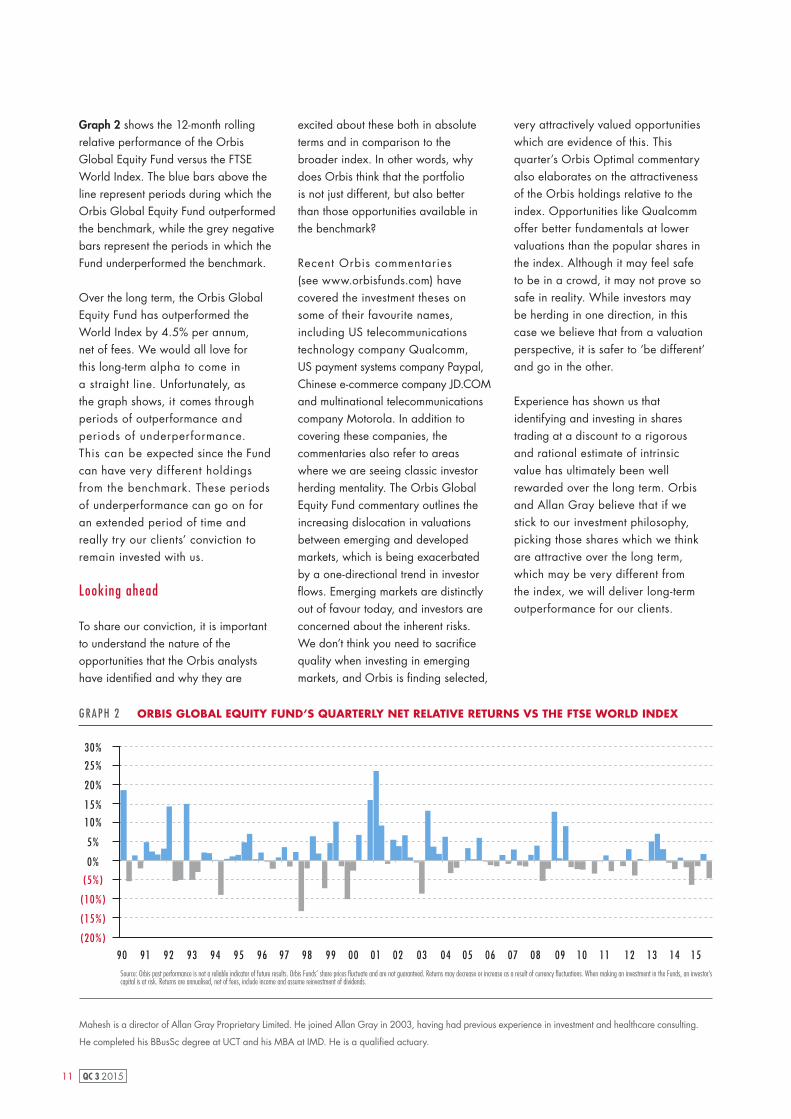
GRAPH 2 ORBIS GLOBAL EQUITY FUND’S QUARTERLY NET RELATIVE RETURNS VS THE FTSE WORLD INDEX
Source: Orbis past performance is not a reliable indicator of future results. Orbis Funds’ share prices fluctuate and are not guaranteed. Returns may decrease or increase as a result of currency fluctuations. When making an investment in the Funds, an investor’s capital is at risk. Returns are annualised, net of fees, include income and assume reinvestment of dividends.
90 91 92 96 00 01 02 03 04 05 06 07 08 09 10 11 12 13 14 1593 9794 9895 99
(20%)
(15%)
(10%)
(5%)
0%
5%
10%
15%
20%
25%
30%
Graph 2 shows the 12-month rolling relative performance of the Orbis Global Equity Fund versus the FTSE World Index. The blue bars above the line represent periods during which the Orbis Global Equity Fund outperformed the benchmark, while the grey negative bars represent the periods in which the Fund underperformed the benchmark.
Over the long term, the Orbis Global Equity Fund has outperformed the World Index by 4.5% per annum, net of fees. We would all love for this long-term alpha to come in a straight line. Unfortunately, as the graph shows, it comes through periods of outperformance and periods of underperformance. This can be expected since the Fund can have very different holdings from the benchmark. These periods of underperformance can go on for an extended period of time and really try our clients’ conviction to remain invested with us.
Looking ahead
To share our conviction, it is important to understand the nature of the opportunities that the Orbis analysts have identified and why they are
excited about these both in absolute terms and in comparison to the broader index. In other words, why does Orbis think that the portfolio is not just different, but also better than those opportunities available in the benchmark?
Recent Orbis commentaries (see www.orbisfunds.com) have covered the investment theses on some of their favourite names, including US telecommunications technology company Qualcomm, US payment systems company Paypal, Chinese e-commerce company JD.COM and multinational telecommunications company Motorola. In addition to covering these companies, the commentaries also refer to areas where we are seeing classic investor herding mentality. The Orbis Global Equity Fund commentary outlines the increasing dislocation in valuations between emerging and developed markets, which is being exacerbated by a one-directional trend in investor flows. Emerging markets are distinctly out of favour today, and investors are concerned about the inherent risks. We don’t think you need to sacrifice quality when investing in emerging markets, and Orbis is finding selected,
very attractively valued opportunities which are evidence of this. This quarter’s Orbis Optimal commentary also elaborates on the attractiveness of the Orbis holdings relative to the index. Opportunities like Qualcomm offer better fundamentals at lower valuations than the popular shares in the index. Although it may feel safe to be in a crowd, it may not prove so safe in reality. While investors may be herding in one direction, in this case we believe that from a valuation perspective, it is safer to ‘be different’ and go in the other.
Experience has shown us that identifying and investing in shares trading at a discount to a rigorous and rational estimate of intrinsic value has ultimately been well rewarded over the long term. Orbis and Allan Gray believe that if we stick to our investment philosophy, picking those shares which we think are attractive over the long term, which may be very different from the index, we will deliver long-term outperformance for our clients.
12QC 3 2015
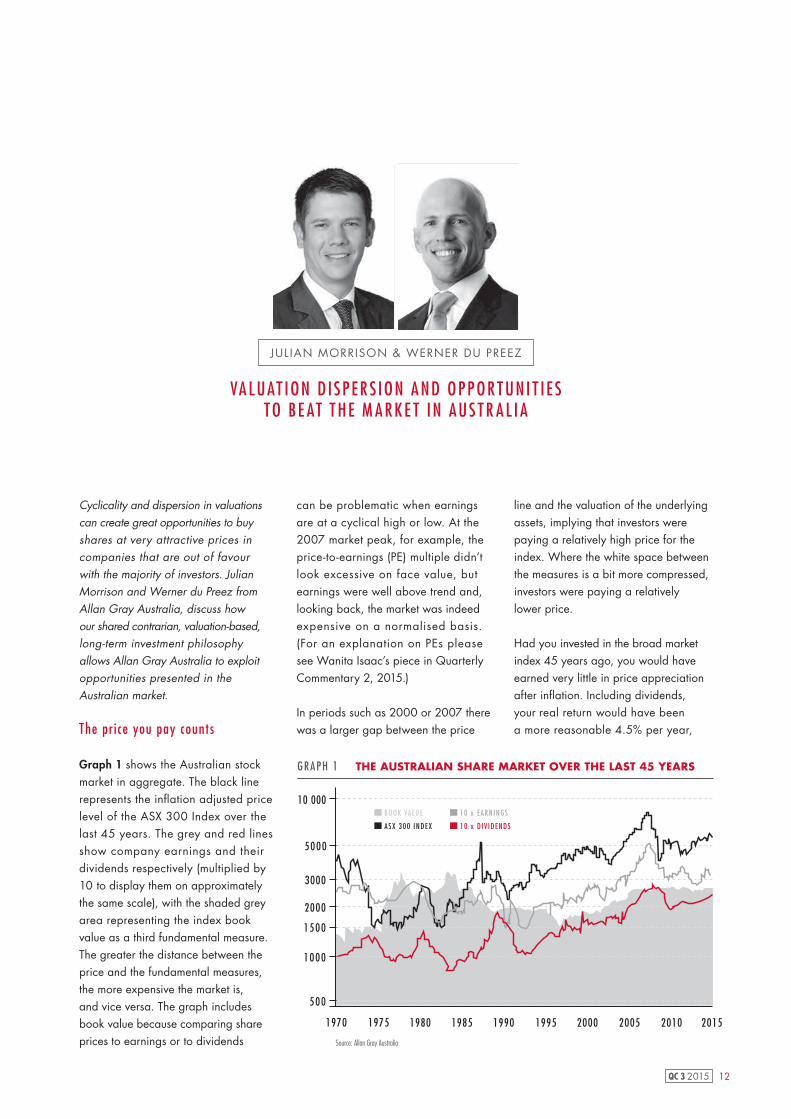
VA L UAT ION D I SP ER S ION A ND OP P OR T UNI T IE S T O BE AT T HE M A R K E T IN AUS T R A L I A
Cyclicality and dispersion in valuations can create great opportunities to buy shares at very attractive prices in companies that are out of favour with the majority of investors. Julian Morrison and Werner du Preez from Allan Gray Australia, discuss how our shared contrarian, valuation-based, long-term investment philosophy allows Allan Gray Australia to exploit opportunities presented in the Australian market.
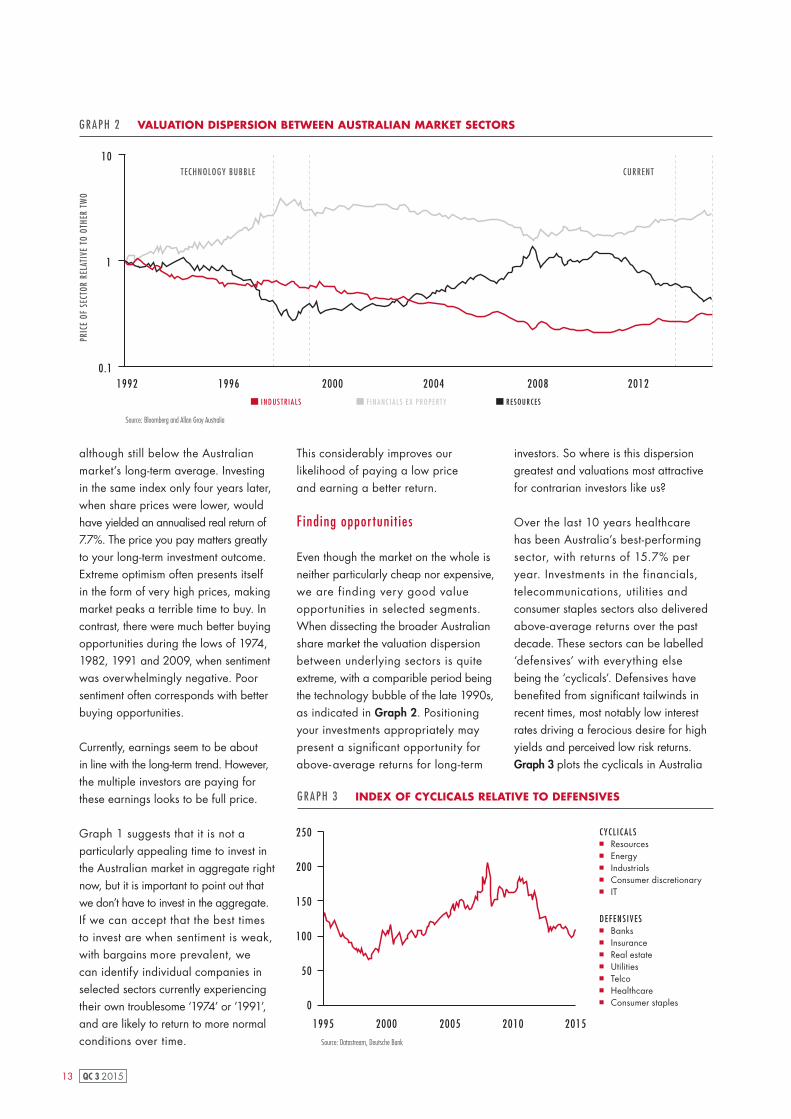
The price you pay counts
Graph 1 shows the Australian stock market in aggregate. The black line represents the inflation adjusted price level of the ASX 300 Index over the last 45 years. The grey and red lines show company earnings and their dividends respectively (multiplied by 10 to display them on approximately the same scale), with the shaded grey area representing the index book value as a third fundamental measure. The greater the distance between the price and the fundamental measures, the more expensive the market is, and vice versa. The graph includes book value because comparing share prices to earnings or to dividends
can be problematic when earnings are at a cyclical high or low. At the 2007 market peak, for example, the price-to-earnings (PE) multiple didn’t look excessive on face value, but earnings were well above trend and, looking back, the market was indeed expensive on a normalised basis.(For an explanation on PEs please see Wanita Isaac’s piece in Quarterly Commentary 2, 2015.)
In periods such as 2000 or 2007 there was a larger gap between the price
line and the valuation of the underlying assets, implying that investors were paying a relatively high price for the index. Where the white space between the measures is a bit more compressed, investors were paying a relatively lower price.
Had you invested in the broad market index 45 years ago, you would have earned very little in price appreciation after inflation. Including dividends, your real return would have been a more reasonable 4.5% per year,
JUL IAN MORRISON & WERNER DU PREEZ
Source: Allan Gray Australia
GRAPH 1 THE AUSTRALIAN SHARE MARKET OVER THE LAST 45 YEARS
10 000
5000
3000
2000
1500
1000
500
1970 1975 1980 1985 1990 1995 2000 2005 2010 2015
BOOK VALUE
ASX 300 INDEX
10 x EARN INGS
10 x D IV IDENDS
13 QC 3 2015
although still below the Australian market’s long-term average. Investing in the same index only four years later, when share prices were lower, would have yielded an annualised real return of 7.7%. The price you pay matters greatly to your long-term investment outcome. Extreme optimism often presents itself in the form of very high prices, making market peaks a terrible time to buy. In contrast, there were much better buying opportunities during the lows of 1974, 1982, 1991 and 2009, when sentiment was overwhelmingly negative. Poor sentiment often corresponds with better buying opportunities.
Currently, earnings seem to be about in line with the long-term trend. However, the multiple investors are paying for these earnings looks to be full price.
Graph 1 suggests that it is not a particularly appealing time to invest in the Australian market in aggregate right now, but it is important to point out that we don’t have to invest in the aggregate. If we can accept that the best times to invest are when sentiment is weak, with bargains more prevalent, we can identify individual companies in selected sectors currently experiencing their own troublesome ‘1974’ or ’1991’, and are likely to return to more normal conditions over time.
PRIC
E OF
SEC
TOR
RELA
TIVE
TO
OTHE
R TW
O
1992
1
10
1996 2000 2004 2008 2012
TECHNOLOGY BUBBLE CURRENT
0.1
Source: Bloomberg and Allan Gray Australia
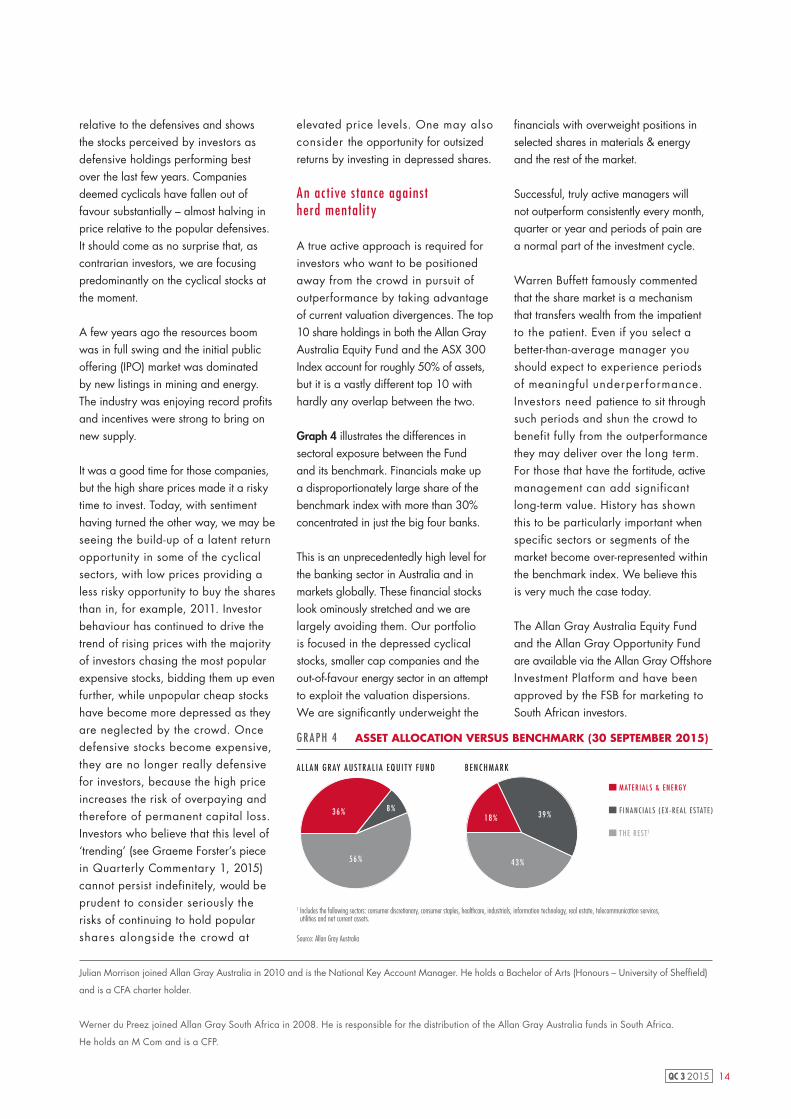
INDUSTR IALS F INANC IALS EX PROPERTY RESOURCES
GRAPH 2 VALUATION DISPERSION BETWEEN AUSTRALIAN MARKET SECTORS
This considerably improves our likelihood of paying a low price and earning a better return.
F inding oppor tuni t ies
Even though the market on the whole is neither particularly cheap nor expensive, we are finding very good value opportunities in selected segments. When dissecting the broader Australian share market the valuation dispersion between underlying sectors is quite extreme, with a comparible period being the technology bubble of the late 1990s, as indicated in Graph 2. Positioning your investments appropriately may present a significant opportunity for above- average returns for long-term
investors. So where is this dispersion greatest and valuations most attractive for contrarian investors like us?
Over the last 10 years healthcare has been Australia’s best-performing sector, with returns of 15.7% per year. Investments in the financials, telecommunications, utilities and consumer staples sectors also delivered above-average returns over the past decade. These sectors can be labelled ‘defensives’ with everything else being the ‘cyclicals’. Defensives have benefited from significant tailwinds in recent times, most notably low interest rates driving a ferocious desire for high yields and perceived low risk returns. Graph 3 plots the cyclicals in Australia
1995 2000 20102005 2015
0
50
100
150
200
250
GRAPH 3 INDEX OF CYCLICALS RELATIVE TO DEFENSIVES
DEFENS IVES
CYCL I CALS
Source: Datastream, Deutsche Bank
Resources Energy Industrials Consumer discretionary IT
Banks Insurance Real estate Utilities Telco Healthcare Consumer staples
14QC 3 2015
Julian Morrison joined Allan Gray Australia in 2010 and is the National Key Account Manager. He holds a Bachelor of Arts (Honours – University of Sheffield)
and is a CFA charter holder.
Werner du Preez joined Allan Gray South Africa in 2008. He is responsible for the distribution of the Allan Gray Australia funds in South Africa.
He holds an M Com and is a CFP.
relative to the defensives and shows the stocks perceived by investors as defensive holdings performing best over the last few years. Companies deemed cyclicals have fallen out of favour substantially – almost halving in price relative to the popular defensives. It should come as no surprise that, as contrarian investors, we are focusing predominantly on the cyclical stocks at the moment.
A few years ago the resources boom was in full swing and the initial public offering (IPO) market was dominated by new listings in mining and energy. The industry was enjoying record profits and incentives were strong to bring on new supply.
It was a good time for those companies, but the high share prices made it a risky time to invest. Today, with sentiment having turned the other way, we may be seeing the build-up of a latent return opportunity in some of the cyclical sectors, with low prices providing a less risky opportunity to buy the shares than in, for example, 2011. Investor behaviour has continued to drive the trend of rising prices with the majority of investors chasing the most popular expensive stocks, bidding them up even further, while unpopular cheap stocks have become more depressed as they are neglected by the crowd. Once defensive stocks become expensive, they are no longer really defensive for investors, because the high price increases the risk of overpaying and therefore of permanent capital loss. Investors who believe that this level of ‘trending’ (see Graeme Forster’s piece in Quarterly Commentary 1, 2015) cannot persist indefinitely, would be prudent to consider seriously the risks of continuing to hold popular shares alongside the crowd at
elevated price levels. One may also consider the opportunity for outsized returns by investing in depressed shares.
An ac t ive s tance against herd mental i t y
A true active approach is required for investors who want to be positioned away from the crowd in pursuit of outperformance by taking advantage of current valuation divergences. The top 10 share holdings in both the Allan Gray Australia Equity Fund and the ASX 300 Index account for roughly 50% of assets, but it is a vastly different top 10 with hardly any overlap between the two.
Graph 4 illustrates the differences in sectoral exposure between the Fund and its benchmark. Financials make up a disproportionately large share of the benchmark index with more than 30% concentrated in just the big four banks.
This is an unprecedentedly high level for the banking sector in Australia and in markets globally. These financial stocks look ominously stretched and we are largely avoiding them. Our portfolio is focused in the depressed cyclical stocks, smaller cap companies and the out-of-favour energy sector in an attempt to exploit the valuation dispersions. We are significantly underweight the
GRAPH 4 ASSET ALLOCATION VERSUS BENCHMARK (30 SEPTEMBER 2015)
MATER IALS & ENERGY
F INANC IALS ( EX -REAL ES TATE )
THE REST 1
56%
36% 8%39%
43%
18%
ALLAN GRAY AUSTRAL IA EQU I TY FUND BENCHMARK
1 Includes the following sectors: consumer discretionary, consumer staples, healthcare, industrials, information technology, real estate, telecommunication services, utilities and net current assets.
financials with overweight positions in selected shares in materials & energy and the rest of the market.
Successful, truly active managers will not outperform consistently every month, quarter or year and periods of pain are a normal part of the investment cycle.
Warren Buffett famously commented that the share market is a mechanism that transfers wealth from the impatient to the patient. Even if you select a better-than-average manager you should expect to experience periods of meaningful underper formance. Investors need patience to sit through such periods and shun the crowd to benefit fully from the outperformance they may deliver over the long term. For those that have the fortitude, active management can add significant long-term value. History has shown this to be particularly important when specific sectors or segments of the market become over-represented within the benchmark index. We believe this is very much the case today.
The Allan Gray Australia Equity Fund and the Allan Gray Opportunity Fund are available via the Allan Gray Offshore Investment Platform and have been approved by the FSB for marketing to South African investors.
Source: Allan Gray Australia
15 QC 3 2015
COM MI T MEN T COUN T S
ZWELETHU NKOSI
There will always be ups and downs in the markets as much as in life. To deliver great long-term investment performance we believe a fund manager needs to commit to an investment philosophy, run a disciplined investment process and attract and retain a consistently skilled team. Zwelethu Nkosi explains why commitment counts in investing and the thinking behind our new television advert.
Our focus at Allan Gray is on creating long-term wealth for our clients. We buy shares on behalf of our clients when our research indicates that they are priced below their true worth and sell them when they reach our estimate of fair value. We apply this same investment philosophy regardless of market conditions and have been doing so since our founder, Dr Allan WB Gray, began managing money on behalf of clients in 1974.
Our unwavering commitment to our investment philosophy sets us apart from our competitors, and it is this theme of commitment that we wanted to highlight in our new TV ad.
While the business of investing remains rational, we believe it is important to connect with our clients and potential investors on an emotional level, by using our advertising to tell human stories that resonate.
‘The Letter’ continues our tradition of emotional storytelling, which over the years has become synonymous with Allan Gray’s advertising. We also continue with the black and white visual style, making the advert recognisably Allan Gray.
The te lev i s ion commerc ia l The ad portrays a simple story of two people in love, who have their commitment tested by a very long, forced separation. Through their story, conveyed through a letter we consider the persistence and resolve they exercised during their time apart. The narrative is set within the context of a real historic event. In bringing these events to life, authenticity was very important. We had to remain
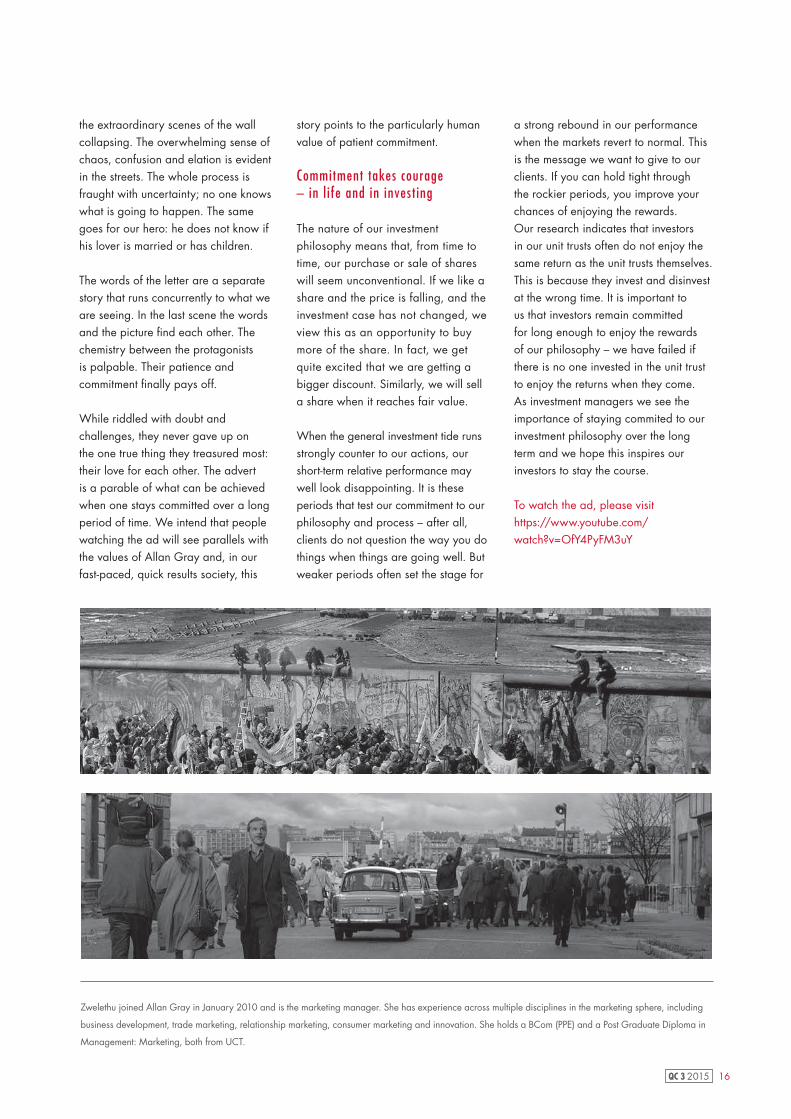
true to the time. Set in Germany in 1989, the Berlin Wall works as a visual representation of what had come between the two lovers.
The story opens up in our hero’s living room. He is not a typical hero. We get a glimpse of the character - a man in his late forties. The book-laden shelves suggest that he is well read and smart. We get a sense that he is introverted; a thinker. His face conveys
a vulnerability. His depth of character and believability draw us to his journey. His performance, although subtly conveyed, allows us to feel deeply. We want to know more.
The hero has lived with the letter for many years. The news of the wall falling triggers a reaction and he travels to the wall where he arrives as a crowd is tearing down a section. He seizes the opportunity and crosses into East Berlin. Through our hero we experience
“WE INTEND THAT PEOPLE WATCHING THE AD WILL SEE PARALLELS WITH THE VALUES OF ALLAN GRAY”
16QC 3 2015
the extraordinary scenes of the wall collapsing. The overwhelming sense of chaos, confusion and elation is evident in the streets. The whole process is fraught with uncertainty; no one knows what is going to happen. The same goes for our hero: he does not know if his lover is married or has children.
The words of the letter are a separate story that runs concurrently to what we are seeing. In the last scene the words and the picture find each other. The chemistry between the protagonists is palpable. Their patience and commitment finally pays off.
While riddled with doubt and challenges, they never gave up on the one true thing they treasured most: their love for each other. The advert is a parable of what can be achieved when one stays committed over a long period of time. We intend that people watching the ad will see parallels with the values of Allan Gray and, in our fast-paced, quick results society, this
story points to the particularly human value of patient commitment.
Commitment takes courage – in l i fe and in invest ing
The nature of our investment philosophy means that, from time to time, our purchase or sale of shares will seem unconventional. If we like a share and the price is falling, and the investment case has not changed, we view this as an opportunity to buy more of the share. In fact, we get quite excited that we are getting a bigger discount. Similarly, we will sell a share when it reaches fair value.
When the general investment tide runs strongly counter to our actions, our short-term relative performance may well look disappointing. It is these periods that test our commitment to our philosophy and process – after all, clients do not question the way you do things when things are going well. But weaker periods often set the stage for
a strong rebound in our performance when the markets revert to normal. This is the message we want to give to our clients. If you can hold tight through the rockier periods, you improve your chances of enjoying the rewards. Our research indicates that investors in our unit trusts often do not enjoy the same return as the unit trusts themselves. This is because they invest and disinvest at the wrong time. It is important to us that investors remain committed for long enough to enjoy the rewards of our philosophy – we have failed if there is no one invested in the unit trust to enjoy the returns when they come. As investment managers we see the importance of staying commited to our investment philosophy over the long term and we hope this inspires our investors to stay the course.
To watch the ad, please visit https://www.youtube.com/watch?v=OfY4PyFM3uY
Zwelethu joined Allan Gray in January 2010 and is the marketing manager. She has experience across multiple disciplines in the marketing sphere, including
business development, trade marketing, relationship marketing, consumer marketing and innovation. She holds a BCom (PPE) and a Post Graduate Diploma in
Management: Marketing, both from UCT.
17 QC 3 2015
WHAT IS OUTPERFORMANCE?
THANDI NGWANE
While the dictionary definition of outperformance is simple, the complexity starts when we want to understand it in the context of our investments, as we are faced with so many things we can measure against – the market, inflation, the performance of peers, our goals, to name a few. Thandi Ngwane assists.
Say the average share on the Johannesburg Stock Exchange (the JSE) returns 10% over a year, inflation is 5% and your unit trust returns 7% (call this scenario 1). Has the unit trust outperformed?
Or consider scenario 2: The JSE returns -8% over a year, inflation is 5% again and your unit trust returns -3% in the same time period, i.e., you have made a loss. Has the unit trust outperformed this time, despite the loss?
And ponder scenario 3: The JSE returns 15% over the year, SA bonds return 2%, inflation is 10% and international shares return 20% in rands. You are invested in two unit trusts: one returns 17% and the other returns 13%. Has either outperformed?
Choosing a benchmark
Outperformance depends completely on your point of comparison (your benchmark). If inflation is the benchmark, the unit trusts in scenarios 1 and 3 all outperformed and the unit trust in scenario 2 underperformed
by a hefty 8%. If the JSE market return is your benchmark, the unit trust in scenario 2 outperformed by 5%. If you were trying to beat international shares, even the 17% return of the unit trust in scenario 3 would have been under the mark by 3%.
Investment managers and the trustees of unit trusts are required to select an appropriate benchmark for each unit trust: it must match the unit trust’s investment objective and portfolio restrictions. This is intuitive: comparing a unit trust that is mostly invested in equities to the performance of bank savings isn’t appropriate, as the risks you take on with equities are much higher than with bank savings.
It is also useful to consider and set your own objective or benchmark return. A good, independent adviser will be able to help you with this. Generally, the higher the return that you aim for the greater risk of loss you need to take on. As you consider your objective, you can match it with the long-term returns of different categories of unit trusts and, most importantly, consider the riskiness of each, i.e., the ‘bumpiness of the ride’ that different kinds of unit trusts tend to experience.
Performance is not l inear
Imagine that one of your investments returns 12% after a year of smooth growth, with a positive performance in every quarter.
Another also returns 12%, but only after losing 3% in the first quarter, then climbing 8%, losing 4% and then finally recovering to make up 12% over the year. Which has outperformed?
If you are simply assessing the performance of these two investments between their end points, they have delivered the
same return. But if you had to sell the second investment at the wrong time, or if you lost confidence and sold it out of fear, your actual returns would have been a lot worse in the investment that was more up and down. Even if annual returns look the same, the ‘bumpiness of the ride’ can make a real difference to the actual returns achieved.
Outperformance in down markets
Because they reduce bumpiness (or volatity), all other things being equal, unit trusts that deliver all of their outperformance by keeping losses shallow in down markets will create more wealth over the long term for investors than managers with their outperformance in up cycles.
Forgive us some marketing: as at the end of September, dividing the full history of the Allan Gray Balanced Fund into months in which the market was up and those when it was down, all of its 4.8% outperformance since inception has been delivered in the average down month, and none in the average up month.
Unit trust factsheets include statistics on volatility, along with investment performance and maximum losses over a unit trust’s history. Factsheets are available via our website www.allangray.co.za or from our Client Service Centre.
H o w s h o u l d y o u ev a l u a t e p e r f o r m a n c e?
When you evaluate how your investments are performing, consider a few things before making any rash decisions:
What does outperformance mean to you? Your needs are the most important measure of whether an investment is performing as it should.
INV
ESTIN
G TU
TOR
IALS
18QC 3 2015
Remember to consider the risk that your investment has to take to achieve returns. Investment returns that fluctuate may not suit your temperament even if they go up over the long term.
Is your investment outperforming a poor market, even though returns are currently negative? Markets go up and down and you should expect to occasionally get negative returns. The decisive factor should be whether your investments are working hard to preserve your capital.
Evaluate performance through the market cycle. This means not just looking at the recent past, but look at your investment over a long enough timeframe to get a real sense of its performance through up and down markets.
Thandi joined Allan Gray in 2008. She is a senior member of the distribution team having previously worked in legal and compliance and marketing in
the financial services sector. Thandi completed her Masters of Business Law at the University of KwaZulu-Natal, has an advanced CFP from the University
of the Free State and is an admitted attorney.
19 QC 3 2015
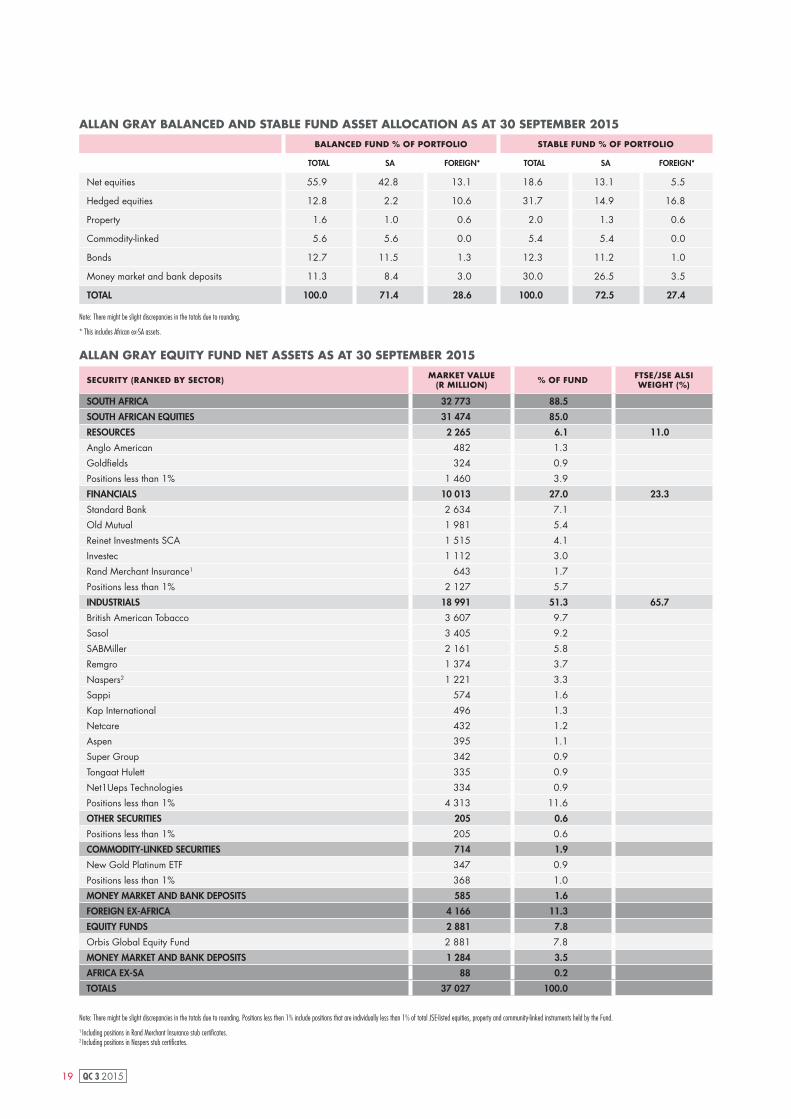
ALLAN GRAY EQUITY FUND NET ASSETS AS AT 30 SEPTEMBER 2015
SECURITY (RANKED BY SECTOR) MARKET VALUE(R MILLION) % OF FUND FTSE/JSE ALSI
WEIGHT (%)
SOUTH AFRICA 32 773 88.5
SOUTH AFRICAN EQUITIES 31 474 85.0
RESOURCES 2 265 6.1 11.0
Anglo American 482 1.3
Goldfields 324 0.9
Positions less than 1% 1 460 3.9
FINANCIALS 10 013 27.0 23.3
Standard Bank 2 634 7.1
Old Mutual 1 981 5.4
Reinet Investments SCA 1 515 4.1
Investec 1 112 3.0
Rand Merchant Insurance1 643 1.7
Positions less than 1% 2 127 5.7
INDUSTRIALS 18 991 51.3 65.7
British American Tobacco 3 607 9.7
Sasol 3 405 9.2
SABMiller 2 161 5.8
Remgro 1 374 3.7
Naspers2 1 221 3.3
Sappi 574 1.6
Kap International 496 1.3
Netcare 432 1.2
Aspen 395 1.1
Super Group 342 0.9
Tongaat Hulett 335 0.9
Net1Ueps Technologies 334 0.9
Positions less than 1% 4 313 11.6
OTHER SECURITIES 205 0.6
Positions less than 1% 205 0.6
COMMODITY-LINKED SECURITIES 714 1.9
New Gold Platinum ETF 347 0.9
Positions less than 1% 368 1.0
MONEY MARKET AND BANK DEPOSITS 585 1.6
FOREIGN EX-AFRICA 4 166 11.3
EQUITY FUNDS 2 881 7.8
Orbis Global Equity Fund 2 881 7.8
MONEY MARKET AND BANK DEPOSITS 1 284 3.5
AFRICA EX-SA 88 0.2
TOTALS 37 027 100.0
BALANCED FUND % OF PORTFOLIO STABLE FUND % OF PORTFOLIO
TOTAL SA FOREIGN* TOTAL SA FOREIGN*
Net equities 55.9 42.8 13.1 18.6 13.1 5.5
Hedged equities 12.8 2.2 10.6 31.7 14.9 16.8
Property 1.6 1.0 0.6 2.0 1.3 0.6
Commodity-linked 5.6 5.6 0.0 5.4 5.4 0.0
Bonds 12.7 11.5 1.3 12.3 11.2 1.0
Money market and bank deposits 11.3 8.4 3.0 30.0 26.5 3.5
TOTAL 100.0 71.4 28.6 100.0 72.5 27.4
ALLAN GRAY BALANCED AND STABLE FUND ASSET ALLOCATION AS AT 30 SEPTEMBER 2015
Note: There might be slight discrepancies in the totals due to rounding.
* This includes African ex-SA assets.
Note: There might be slight discrepancies in the totals due to rounding. Positions less then 1% include positions that are individually less than 1% of total JSE-listed equities, property and community-linked instruments held by the Fund.
1 Including positions in Rand Merchant Insurance stub certificates.2 Including positions in Naspers stub certificates.
20QC 3 2015
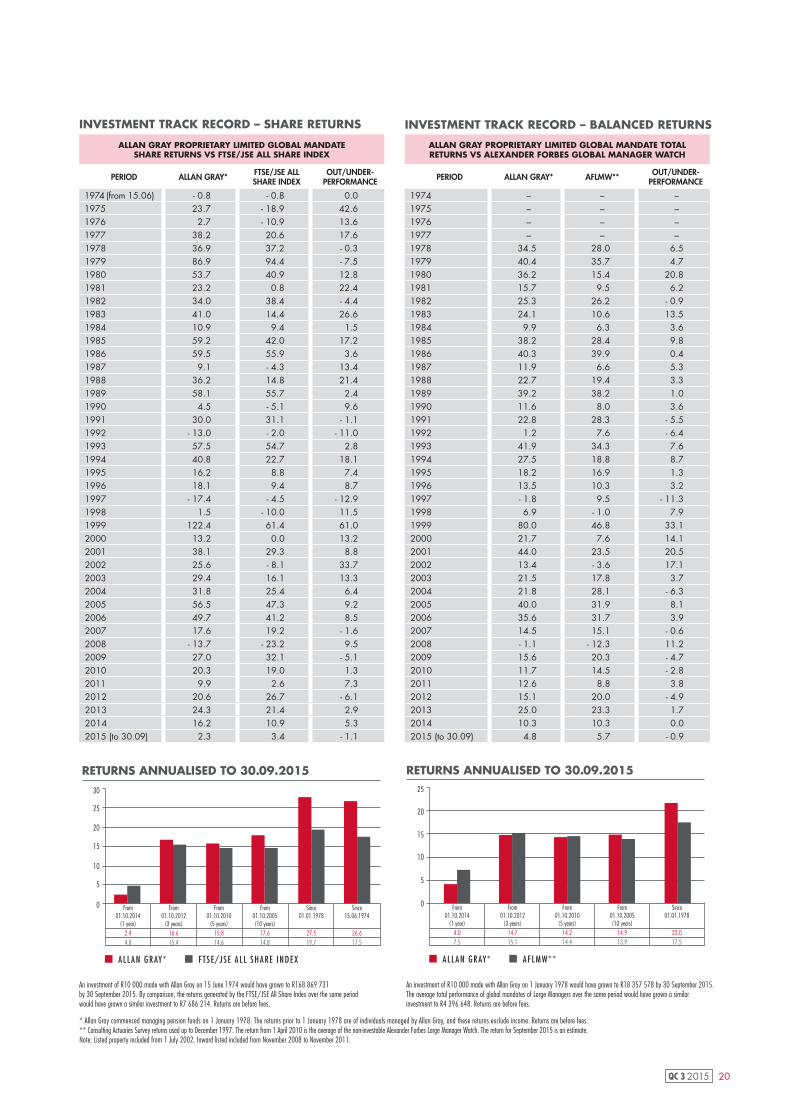
An investment of R10 000 made with Allan Gray on 15 June 1974 would have grown to R168 869 731 by 30 September 2015. By comparison, the returns generated by the FTSE/JSE All Share Index over the same period would have grown a similar investment to R7 686 214. Returns are before fees.
An investment of R10 000 made with Allan Gray on 1 January 1978 would have grown to R18 357 578 by 30 September 2015. The average total performance of global mandates of Large Managers over the same period would have grown a similar investment to R4 396 648. Returns are before fees.
INVESTMENT TRACK RECORD – SHARE RETURNS INVESTMENT TRACK RECORD – BALANCED RETURNS
25
20
15
10
5
0
RETURNS ANNUALISED TO 30.09.2015
ALLAN GRAY* AFLMW**
From 01.10.2014
(1 year)4.07.5
From 01.10.2012
(3 years)14.715.1
From 01.10.2010
(5 years)14.214.4
From 01.10.2005 (10 years)
14.913.9
Since 01.01.1978
22.017.5
25
30
20
15
10
5
0
RETURNS ANNUALISED TO 30.09.2015
ALLAN GRAY* FTSE/JSE ALL SHARE INDEX
From 01.10.2014
(1 year)2.44.8
From 01.10.2012
(3 years)16.615.4
From 01.10.2010
(5 years)15.814.6
From 01.10.2005 (10 years)
17.614.8
Since 01.01.1978
27.519.7
Since 15.06.1974
26.617.5
* Allan Gray commenced managing pension funds on 1 January 1978. The returns prior to 1 January 1978 are of individuals managed by Allan Gray, and these returns exclude income. Returns are before fees.** Consulting Actuaries Survey returns used up to December 1997. The return from 1 April 2010 is the average of the non-investable Alexander Forbes Large Manager Watch. The return for September 2015 is an estimate.Note: Listed property included from 1 July 2002. Inward listed included from November 2008 to November 2011.
ALLAN GRAY PROPRIETARY LIMITED GLOBAL MANDATE TOTAL RETURNS VS ALEXANDER FORBES GLOBAL MANAGER WATCH
PERIOD ALLAN GRAY* AFLMW** OUT/UNDER-PERFORMANCE
1974 – – –1975 – – –1976 – – –1977 – – –1978 34.5 28.0 6.51979 40.4 35.7 4.71980 36.2 15.4 20.81981 15.7 9.5 6.21982 25.3 26.2 - 0.91983 24.1 10.6 13.51984 9.9 6.3 3.61985 38.2 28.4 9.81986 40.3 39.9 0.41987 11.9 6.6 5.31988 22.7 19.4 3.31989 39.2 38.2 1.01990 11.6 8.0 3.61991 22.8 28.3 - 5.51992 1.2 7.6 - 6.41993 41.9 34.3 7.61994 27.5 18.8 8.71995 18.2 16.9 1.31996 13.5 10.3 3.21997 - 1.8 9.5 - 11.31998 6.9 - 1.0 7.91999 80.0 46.8 33.12000 21.7 7.6 14.12001 44.0 23.5 20.52002 13.4 - 3.6 17.12003 21.5 17.8 3.72004 21.8 28.1 - 6.32005 40.0 31.9 8.12006 35.6 31.7 3.92007 14.5 15.1 - 0.62008 - 1.1 - 12.3 11.22009 15.6 20.3 - 4.72010 11.7 14.5 - 2.82011 12.6 8.8 3.82012 15.1 20.0 - 4.92013 25.0 23.3 1.72014 10.3 10.3 0.02015 (to 30.09) 4.8 5.7 - 0.9
ALLAN GRAY PROPRIETARY LIMITED GLOBAL MANDATE SHARE RETURNS VS FTSE/JSE ALL SHARE INDEX
PERIOD ALLAN GRAY* FTSE/JSE ALL SHARE INDEX
OUT/UNDER-PERFORMANCE
1974 (from 15.06) - 0.8 - 0.8 0.01975 23.7 - 18.9 42.61976 2.7 - 10.9 13.61977 38.2 20.6 17.61978 36.9 37.2 - 0.31979 86.9 94.4 - 7.51980 53.7 40.9 12.81981 23.2 0.8 22.41982 34.0 38.4 - 4.41983 41.0 14.4 26.61984 10.9 9.4 1.51985 59.2 42.0 17.21986 59.5 55.9 3.61987 9.1 - 4.3 13.41988 36.2 14.8 21.41989 58.1 55.7 2.41990 4.5 - 5.1 9.61991 30.0 31.1 - 1.11992 - 13.0 - 2.0 - 11.01993 57.5 54.7 2.81994 40.8 22.7 18.11995 16.2 8.8 7.41996 18.1 9.4 8.71997 - 17.4 - 4.5 - 12.91998 1.5 - 10.0 11.51999 122.4 61.4 61.02000 13.2 0.0 13.22001 38.1 29.3 8.82002 25.6 - 8.1 33.72003 29.4 16.1 13.32004 31.8 25.4 6.42005 56.5 47.3 9.22006 49.7 41.2 8.52007 17.6 19.2 - 1.62008 - 13.7 - 23.2 9.52009 27.0 32.1 - 5.12010 20.3 19.0 1.32011 9.9 2.6 7.32012 20.6 26.7 - 6.12013 24.3 21.4 2.92014 16.2 10.9 5.32015 (to 30.09) 2.3 3.4 - 1.1

21 QC 3 2015
ASS
ETS
UN
DER
M
AN
AG
EMEN
T (R
BIL
LIO
N)
INCEP
TIO
N
DA
TESI
NCE
IN
CEP
TIO
N10 Y
EARS
5 Y
EARS
3 Y
EARS
1 Y
EAR
HIG
HES
T A
NN
UA
L RE
TURN
4
LOW
EST
AN
NU
AL
RETU
RN4
HIGH
NET
EQU
ITY
EXPO
SURE
(10
0%)
Alla
n G
ray
Equi
ty F
und
(AG
EF)
Aver
age
of S
outh
Afri
can
- Equ
ity -
Gen
eral
cat
egor
y
(exc
l. A
llan
Gra
y Fu
nds)
1
37.0
01.1
0.19
9824
.817
.615
.014
.513
.714
.114
.214
.50.
92.
312
5.8
38.3
– 20
.7–
27.7
Alla
n G
ray-
Orb
is G
loba
l Equ
ity F
eede
r Fu
nd (
AG
OE)
FTSE
Wor
ld In
dex
13.5
01.0
4.20
0515
.014
.313
.713
.822
.323
.727
.628
.33.
015
.578
.254
.2–
29.7
– 32
.7
MED
IUM
NET
EQU
ITY
EXPO
SURE
(40
% -
75%
)
Alla
n G
ray
Bala
nced
Fun
d (A
GBF
) A
vera
ge o
f So
uth
Afr
ican
- M
ulti
Ass
et -
H
igh
Equi
ty c
ateg
ory
(exc
l. A
GBF
)2
105.
801
.10.
1999
18.4
13.6
13.3
11.8
13.2
12.2
13.7
12.8
3.8
6.1
46.1
41.9
– 8.
3–
16.7
Alla
n G
ray-
Orb
is G
loba
l Fun
d of
Fun
ds (
AG
GF)
6
0%
of
the
FTSE
Wor
ld In
dex
and
40
% o
f
the
JP M
orga
n G
loba
l Gov
ernm
ent B
ond
Inde
x
11.4
03.0
2.20
0411
.411
.912
.813
.519
.120
.423
.423
.39.
017
.355
.638
.8–
13.7
0.6
LOW
NET
EQU
ITY
EXPO
SURE
(0%
- 4
0%)
Alla
n G
ray
Stab
le F
und
(AG
SF)
Dai
ly i
nter
est r
ate
of F
irst
Rand
Ban
k Li
mite
d pl
us 2
%35
.201
.07.
2000
12.9
9.2
10.5
8.3
9.7
6.6
9.9
6.6
6.3
7.0
23.3
7.5
3.3
7.9
VERY
LOW
NET
EQU
ITY
EXPO
SURE
(0%
- 2
0%)
Alla
n G
ray
Opt
imal
Fun
d (A
GO
F)D
aily
int
eres
t rat
e of
Fir
stRa
nd B
ank
Lim
ited
1.2
01.1
0.20
028.
16.
67.
36.
16.
14.
57.
74.
58.
34.
918
.111
.91.
64.
4
Alla
n G
ray-
Orb
is G
loba
l Opt
imal
Fun
d of
Fun
ds (
AG
OO
)A
vera
ge o
f U
S$ b
ank
depo
sits
and
eur
o ba
nk d
epos
its1.
302
.03.
2010
11.1
9.8
– –14
.712
.917
.816
.29.
515
.739
.626
.6–
8.4
– 5.
5
NO E
QUIT
Y EX
POSU
RE
Alla
n G
ray
Bond
Fun
d (A
GBD
)JS
E A
ll Bo
nd In
dex
(tota
l ret
urn)
0.6
01.1
0.20
049.
08.
78.
68.
38.
07.
76.
15.
37.
37.
018
.021
.2–
0.5
– 3.
0
Alla
n G
ray
Mon
ey M
arke
t Fu
nd (
AG
MF)
Ale
xand
er F
orbe
s Sh
ort-t
erm
Fix
ed In
tere
st
(STe
FI)
Com
posi
te In
dex3
11.5
03.0
7.20
018.
1 8.
07.
47.
35.
85.
75.
85.
76.
56.
412
.813
.35.
25.
2
ALL
AN
GRAY
SO
UTH
AFR
ICA
N U
NIT
TRU
STS
AN
NU
ALI
SED
PER
FORM
AN
CE
(RA
ND
)
IN P
ERCEN
TAG
E PER
AN
NU
M T
O 3
0 S
EPTE
MBER
20
15
(N
ET O
F FE
ES)
1 Sin
ce in
cepti
on to
28
Febru
ary 2
015
the be
nchm
ark w
as th
e FTS
E/JS
E All S
hare
Index
inclu
ding i
ncom
e.2
Since
ince
ption
to 3
1 Ja
nuary
201
3 the
benc
hmark
was
the m
arket
value
-weig
hted a
verag
e retu
rn of
the fu
nds i
n both
the D
omes
tic As
set A
lloca
tion M
edium
Equit
y and
Dom
estic
Asse
t Allo
catio
n Vari
able
Equit
y sec
tors o
f the
prev
ious A
SISA F
und C
lassif
icatio
n Stan
dard,
exclu
ding t
he Al
lan G
ray B
alanc
ed Fu
nd.
3 Sin
ce in
cepti
on to
31
March
200
3, th
e ben
chma
rk wa
s the
Alex
ande
r Forb
es 3
-Mon
th De
posit
Inde
x. Fro
m 1
April
2003
to 3
1 Oc
tober
2011
the b
ench
mark
was t
he D
omes
tic Fi
xed I
nteres
t Mon
ey M
arket
Colle
ctive
Inve
stmen
t Sch
eme s
ector
exclu
ding t
he Al
lan G
ray M
oney
Mark
et Fu
nd.
4 Th
is is
the hi
ghes
t or lo
west
cons
ecuti
ve 1
2-mon
th ret
urn th
e Fun
d has
expe
rienc
ed si
nce i
ncep
tion,
along
with
the b
ench
mark
perfo
rman
ce fo
r the
corre
spon
ding p
eriod
. All r
olling
12-m
onth
figure
s for
the Fu
nd an
d the
benc
hmark
are a
vaila
ble fr
om ou
r Clie
nt Se
rvice
Centr
e on r
eque
st.
22QC 3 2015
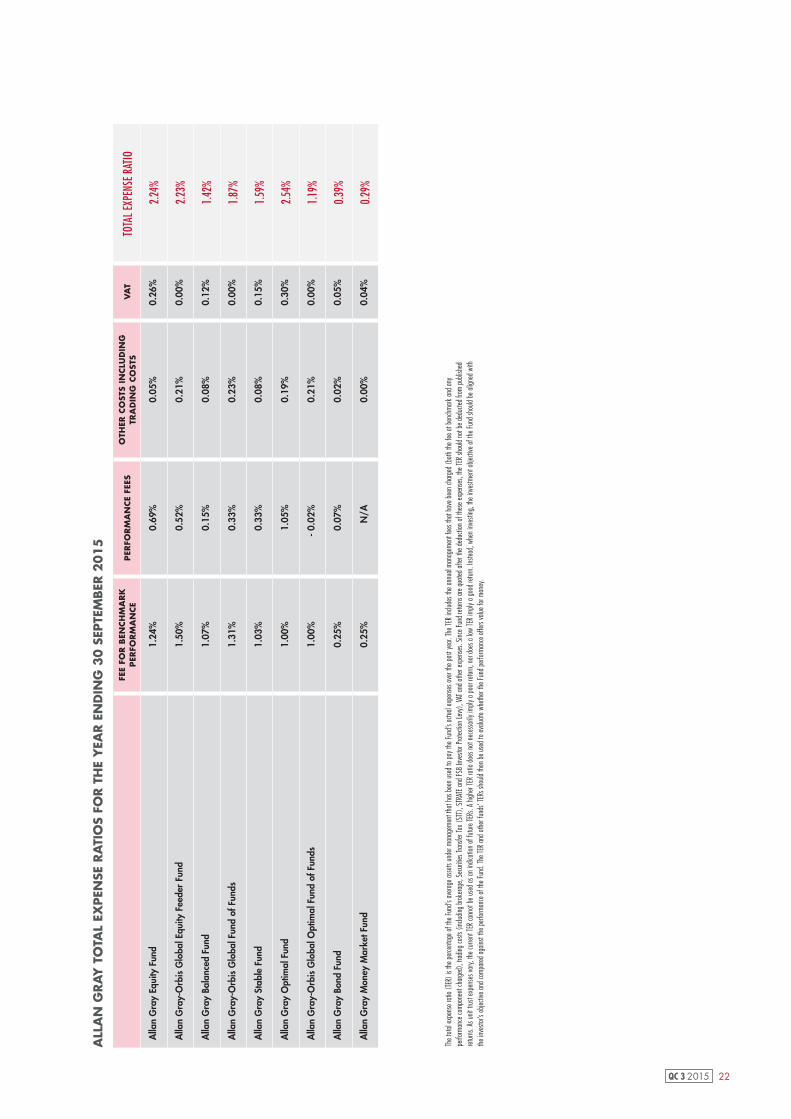
FEE
FOR
BEN
CH
MA
RK
PER
FOR
MA
NCE
PER
FOR
MA
NCE
FEES
O
THER
CO
STS
INCLU
DIN
G
TRA
DIN
G C
OST
SV
AT
TOTA
L EXP
ENSE
RAT
IO
Alla
n G
ray
Equi
ty F
und
1.24
%0.
69%
0.05
%0.
26%
2.24
%
Alla
n G
ray-
Orb
is G
loba
l Equ
ity F
eede
r Fu
nd1.
50%
0.52
%0.
21%
0.00
%2.
23%
Alla
n G
ray
Bala
nced
Fun
d1.
07%
0.15
%0.
08%
0.12
%1.
42%
Alla
n G
ray-
Orb
is G
loba
l Fun
d of
Fun
ds1.
31%
0.33
%0.
23%
0.00
%1.
87%
Alla
n G
ray
Stab
le F
und
1.03
%0.
33%
0.08
%0.
15%
1.59
%
Alla
n G
ray
Opt
imal
Fun
d1.
00%
1.05
%0.
19%
0.30
%2.
54%
Alla
n G
ray-
Orb
is G
loba
l Opt
imal
Fun
d of
Fun
ds1.
00%
- 0.0
2%0.
21%
0.00
%1.
19%
Alla
n G
ray
Bond
Fun
d0.
25%
0.07
%0.
02%
0.05
%0.
39%
Alla
n G
ray
Mon
ey M
arke
t Fun
d0.
25%
N/A
0.00
%0.
04%
0.29
%
ALL
AN
GRAY
TO
TAL
EXPEN
SE R
ATI
OS
FOR T
HE
YEA
R E
ND
ING
30
SEP
TEM
BER
20
15
The t
otal
expe
nse r
atio
(TER
) is t
he pe
rcent
age o
f the
Fund
’s av
erage
asse
ts un
der m
anag
emen
t tha
t has
been
used
to pa
y the
Fund
’s ac
tual e
xpen
ses o
ver t
he pa
st ye
ar. Th
e TER
inclu
des t
he an
nual
mana
geme
nt fe
es th
at ha
ve be
en ch
arged
(bot
h th
e fee
at be
nchm
ark an
d any
pe
rform
ance
comp
onen
t cha
rged)
, trad
ing co
sts (i
nclud
ing br
okera
ge, S
ecuri
ties T
ransfe
r Tax
(STT
), ST
RATE
and F
SB In
vesto
r Prot
ectio
n Le
vy),
VAT a
nd o
ther
expe
nses
. Sinc
e Fun
d retu
rns a
re qu
oted
after
the d
educ
tion
of th
ese e
xpen
ses,
the T
ER sh
ould
not b
e ded
ucted
from
publi
shed
ret
urns
. As u
nit tr
ust e
xpen
ses v
ary,
the c
urren
t TER
cann
ot be
used
as an
indic
ation
of f
uture
TERs
. A h
igher
TER
ratio
does
not
nec
essa
rily im
ply a
poor
retur
n, n
or do
es a
low TE
R im
ply a
good
retur
n. In
stead
, whe
n inv
estin
g, th
e inv
estm
ent o
bjecti
ve o
f the
Fund
shou
ld be
align
ed w
ith
the i
nves
tor’s
obje
ctive
and c
ompa
red ag
ainst
the p
erfor
manc
e of t
he Fu
nd. T
he TE
R an
d oth
er fun
ds’ T
ERs s
hould
then
be us
ed to
evalu
ate w
heth
er th
e Fun
d perf
orma
nce o
ffers
value
for m
oney
.
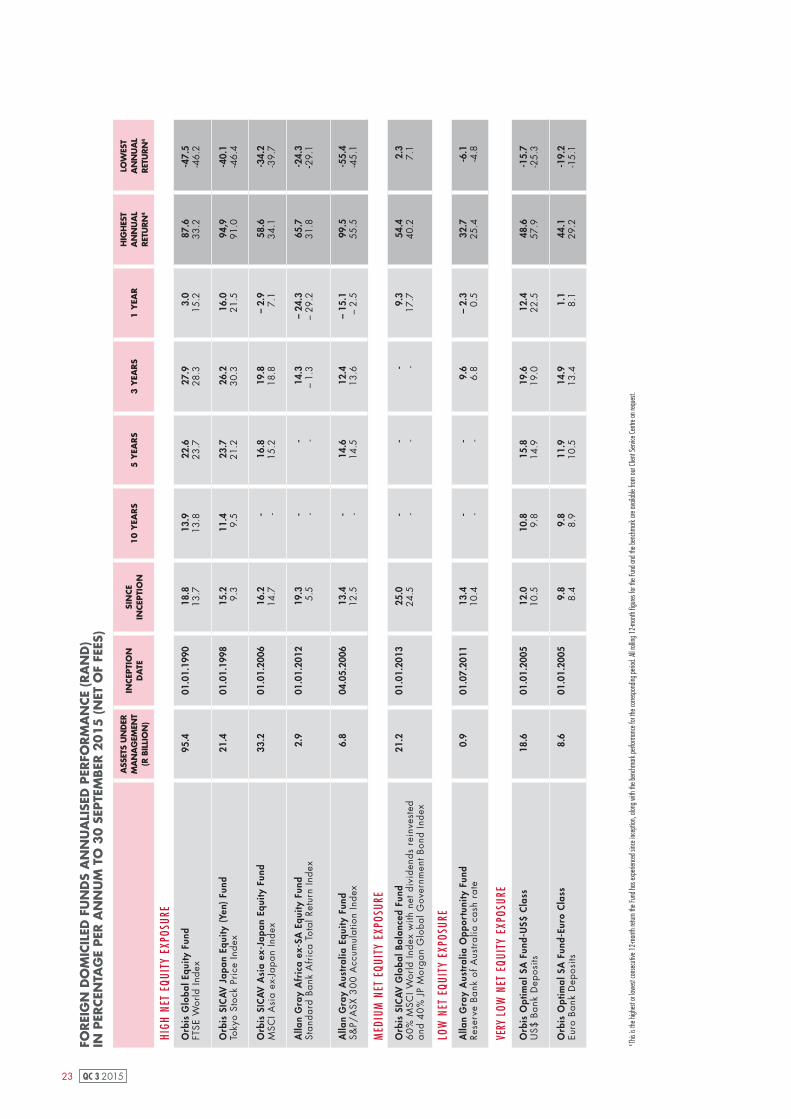
23 QC 3 2015
FOREI
GN
DO
MIC
ILED
FU
ND
S A
NN
UA
LISE
D P
ERFO
RM
AN
CE
(RA
ND
)
IN P
ERCEN
TAG
E PER
AN
NU
M T
O 3
0 S
EPTE
MBER
2015 (N
ET O
F FE
ES)
ASS
ETS
UN
DER
M
AN
AG
EMEN
T (R
BIL
LIO
N)
INCEP
TIO
N
DA
TESI
NCE
IN
CEP
TIO
N10 Y
EARS
5 Y
EARS
3 Y
EARS
1 Y
EAR
HIG
HES
T A
NN
UA
L RE
TURN
4
LOW
EST
AN
NU
AL
RETU
RN4
HIGH
NET
EQU
ITY
EXPO
SURE
Orb
is G
loba
l Equ
ity F
und
FTSE
Wor
ld In
dex
95.4
01.0
1.19
9018
.813
.713
.913
.822
.623
.727
.928
.33.
015
.2
87.6
33.2
-47.
5-4
6.2
Orb
is S
ICAV
Jap
an E
quity
(Ye
n) F
und
Toky
o St
ock
Pric
e In
dex
21.4
01.0
1.19
9815
.29.
311
.49.
523
.721
.226
.230
.316
.021
.594
,991
.0-4
0.1
-46.
4
Orb
is S
ICAV
Asi
a ex
-Jap
an E
quity
Fun
dM
SCI A
sia
ex-Ja
pan
Inde
x33
.201
.01.
2006
16.2
14.7
- -16
.815
.219
.818
.8–
2.9
7.1
58.6
34.1
-34.
2-3
9.7
Alla
n G
ray
Afr
ica
ex-S
A E
quity
Fun
dSt
anda
rd B
ank
Afr
ica
Tota
l Ret
urn
Inde
x2.
901
.01.
2012
19.3
5.5
- -- -
14.3
– 1.
3–
24.3
– 29
.265
.731
.8-2
4.3
-29.
1
Alla
n G
ray
Aus
tral
ia E
quity
Fun
dS&
P/A
SX 3
00
Acc
umul
atio
n In
dex
6.8
04.0
5.20
0613
.412
.5- -
14.6
14.5
12.4
13.6
– 15
.1–
2.5
99.5
55.5
-55.
4-4
5.1
MED
IUM
NET
EQU
ITY
EXPO
SURE
Orb
is S
ICAV
Glo
bal B
alan
ced
Fund
60
% M
SCI W
orld
Inde
x w
ith n
et d
ivid
ends
rei
nves
ted
an
d 4
0%
JP
Mor
gan
Glo
bal G
over
nmen
t Bon
d In
dex
21.2
01.0
1.20
1325
.024
.5- -
- -- -
9.3
17.7
54.4
40.2
2.3
7.1
LOW
NET
EQU
ITY
EXPO
SURE
Alla
n G
ray
Aus
tral
ia O
ppor
tuni
ty F
und
Rese
rve
Bank
of
Aus
tral
ia c
ash
rate
0.9
01.0
7.20
1113
.410
.4- -
- -9.
66.
8–
2.3
0.5
32.7
25.4
-6.1
-4.8
VERY
LOW
NET
EQU
ITY
EXPO
SURE
Orb
is O
ptim
al S
A F
und-
US$
Cla
ssU
S$ B
ank
Dep
osits
18.6
01.0
1.20
0512
.010
.510
.89.
815
.814
.919
.619
.012
.422
.548
.657
.9-1
5.7
-25.
3
Orb
is O
ptim
al S
A F
und-
Euro
Cla
ssEu
ro B
ank
Dep
osits
8.6
01.0
1.20
059.
88.
49.
88.
911
.910
.514
.913
.41.
18.
144
.129
.2-1
9.2
-15.
1
4 Th
is is
the hi
ghes
t or lo
west
cons
ecuti
ve 1
2-mon
th ret
urn th
e Fun
d has
expe
rienc
ed si
nce i
ncep
tion,
along
with
the b
ench
mark
perfo
rman
ce fo
r the
corre
spon
ding p
eriod
. All r
olling
12-m
onth
figure
s for
the Fu
nd an
d the
benc
hmark
are a
vaila
ble fr
om ou
r Clie
nt Se
rvice
Centr
e on r
eque
st.
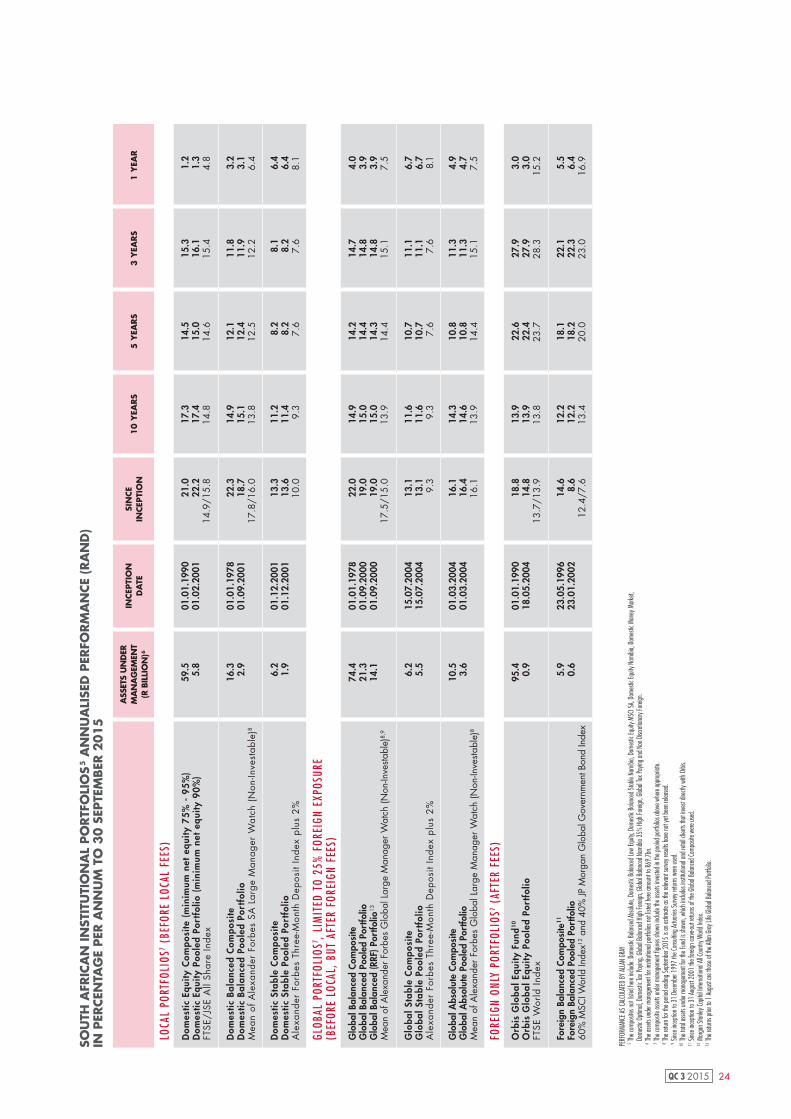
24QC 3 2015
ASS
ETS
UN
DER
M
AN
AG
EMEN
T
(R B
ILLI
ON
)6
INCEP
TIO
N
DA
TESI
NCE
IN
CEP
TIO
N1
0 Y
EARS
5 Y
EARS
3 Y
EARS
1 Y
EAR
LOCA
L PO
RTFO
LIOS
7 (BE
FORE
LOC
AL F
EES)
Dom
estic
Equ
ity C
ompo
site
(m
inim
um n
et e
quity
75%
- 9
5%)
Dom
estic
Equ
ity P
oole
d Po
rtfo
lio (
min
imum
net
equ
ity 9
0%)
FTSE
/JSE
All
Shar
e In
dex
59.5 5.8
01.0
1.19
9001
.02.
2001
21.0
22.2
14.9
/15.
8
17.3
17.4
14.8
14.5
15.0
14.6
15.3
16.1
15.4
1.2
1.3
4.8
Dom
estic
Bal
ance
d C
ompo
site
Dom
estic
Bal
ance
d Po
oled
Por
tfol
ioM
ean
of A
lexa
nder
For
bes
SA L
arge
Man
ager
Wat
ch (
Non
-Inve
stab
le)8
16.3 2.9
01.0
1.19
7801
.09.
2001
22.3
18.7
17.8
/16.
0
14.9
15.1
13.8
12.1
12.4
12.5
11.8
11.9
12.2
3.2
3.1
6.4
Dom
estic
Sta
ble
Com
posi
teD
omes
tic S
tabl
e Po
oled
Por
tfol
ioA
lexa
nder
For
bes
Thre
e-M
onth
Dep
osit
Inde
x pl
us 2
%
6.2
1.9
01.1
2.20
0101
.12.
2001
13.3
13.6
10.0
11.2
11.4
9.3
8.2
8.2
7.6
8.1
8.2
7.6
6.4
6.4
8.1
GLOB
AL P
ORTF
OLIO
S7 , LI
MIT
ED T
O 25
% F
OREI
GN E
XPOS
URE
(B
EFOR
E LO
CAL,
BUT
AFT
ER F
OREI
GN F
EES)
Glo
bal B
alan
ced
Com
posi
teG
loba
l Bal
ance
d Po
oled
Por
tfolio
Glo
bal B
alan
ced
(RRF
) Por
tfolio
13
Mea
n of
Ale
xand
er F
orbe
s G
loba
l Lar
ge M
anag
er W
atch
(Non
-Inve
stabl
e)8,
9
74.4
21.3
14.1
01.0
1.19
7801
.09.
2000
01.0
9.20
00
22.0
19.0
19.0
17.5
/15.
0
14.9
15.0
15.0
13.9
14.2
14.4
14.3
14.4
14.7
14.8
14.8
15.1
4.0
3.9
3.9
7.5
Glo
bal S
tabl
e C
ompo
site
Glo
bal S
tabl
e Po
oled
Por
tfol
ioA
lexa
nder
For
bes
Thre
e-M
onth
Dep
osit
Inde
x pl
us 2
%
6.2
5.5
15.0
7.20
0415
.07.
2004
13.1
13.1
9.3
11.6
11.6
9.3
10.7
10.7
7.6
11.1
11.1
7.6
6.7
6.7
8.1
Glo
bal A
bsol
ute
Com
posi
teG
loba
l Abs
olut
e Po
oled
Por
tfolio
Mea
n of
Ale
xand
er F
orbe
s G
loba
l Lar
ge M
anag
er W
atch
(Non
-Inve
stab
le)8
10.5 3.6
01.0
3.20
0401
.03.
2004
16.1
16.4
16.1
14.3
14.6
13.9
10.8
10.8
14.4
11.3
11.3
15.1
4.9
4.7
7.5
FORE
IGN
ONLY
POR
TFOL
IOS7 (
AFTE
R FE
ES)
Orb
is G
loba
l Equ
ity F
und10
Orb
is G
loba
l Equ
ity P
oole
d Po
rtfo
lioFT
SE W
orld
Inde
x
95.4 0.9
01.0
1.19
9018
.05.
2004
18.8
14.8
13.7
/13.
9
13.9
13.9
13.8
22.6
22.4
23.7
27.9
27.9
28.3
3.0
3.0
15.2
Fore
ign
Bala
nced
Com
posi
te11
Fore
ign
Bala
nced
Poo
led
Port
folio
60%
MSC
I Wor
ld In
dex12
and
40%
JP M
orga
n G
loba
l Gov
ernm
ent B
ond
Inde
x
5.9
0.6
23.0
5.19
9623
.01.
2002
14.6 8.6
12.4
/7.6
12.2
12.2
13.4
18.1
18.2
20.0
22.1
22.3
23.0
5.5
6.4
16.9
SOU
TH A
FRIC
AN
IN
STIT
UTI
ON
AL
PO
RTF
OLI
OS
5 A
NN
UA
LISE
D P
ERFO
RM
AN
CE
(RA
ND
)
IN P
ERCEN
TAG
E PER
AN
NU
M T
O 3
0 S
EPTE
MBER
2015
PERF
ORMA
NCE A
S CA
LCUL
ATED
BY
ALLA
N GR
AY15
The c
ompo
sites
not li
sted h
ere in
clude
: Dom
estic
Bala
nced
Abso
lute,
Dome
stic B
alanc
ed Lo
w Eq
uity,
Dome
stic B
alanc
ed S
table
Nami
bia, D
omes
tic Eq
uity M
SCI S
A, Do
mesti
c Equ
ity N
amibi
a, Do
mesti
c Mon
ey M
arket,
Do
mesti
c Opti
mal, D
omes
tic Ta
x Pay
ing, G
lobal
Balan
ced H
igh Fo
reign
, Glob
al Ba
lance
d Nam
ibia 3
5% H
igh Fo
reign
, Glob
al Ta
x Pay
ing an
d Non
Disc
retion
ary Fo
reign
.16
The a
ssets
unde
r man
agem
ent f
or ins
titutio
nal p
ortfol
ios no
t liste
d here
amou
nt to
R69.
7bn.
17 Th
e com
posit
e asse
ts un
der m
anag
emen
t figu
res sh
own i
nclud
e the
asse
ts inv
ested
in th
e poo
led po
rtfoli
os ab
ove w
here
appro
priate
.18
The r
eturn
for th
e peri
od en
ding S
eptem
ber 2
015
is an
estim
ate as
the r
eleva
nt su
rvey r
esult
s hav
e not
yet b
een r
eleas
ed.
19 Si
nce i
ncep
tion t
o 31
Dece
mber
1997
the C
onsu
lting A
ctuari
es S
urvey
retur
ns w
ere us
ed.
10 Th
e tota
l asse
ts un
der m
anag
emen
t for
the Fu
nd is
show
n, wh
ich in
clude
s ins
titutio
nal a
nd re
tail c
lients
that
inves
t dire
ctly w
ith O
rbis.
11 Si
nce i
ncep
tion t
o 31
Augu
st 20
01 th
e fore
ign ca
rve-ou
t retu
rns of
the G
lobal
Balan
ced C
ompo
site w
ere us
ed.
12 M
organ
Stan
ley Ca
pital
Intern
ation
al All
Coun
try W
orld I
ndex
.13
The r
eturns
prior
to 1
Augu
st are
thos
e of t
he Al
lan G
ray Li
fe Glo
bal B
alanc
ed Po
rtfoli
o.
25 QC 3 2015
Allan Gray Unit Trust Management (RF) Proprietary Limited (the ‘Management Company’) is registered as a management company under the Collective Investment Schemes Control Act 45 of 2002. Allan Gray Proprietary Limited (the ‘Investment Manager’), an authorised financial services provider, is the appointed investment manager of the Management Company and is a member of the Association for Savings & Investment South Africa (ASISA). Collective Investment Schemes in Securities (unit trusts or funds) are generally medium- to long-term investments. Except for the Allan Gray Money Market Fund, where the Investment Manager aims to maintain a constant unit price, the value of units may go down as well as up. Past performance is not necessarily a guide to future performance. The Management Company does not provide any guarantee regarding the capital or the performance of its unit trusts. Funds may be closed to new investments at any time in order for them to be managed according to their mandates. Unit trusts are traded at ruling prices and can engage in borrowing and scrip lending.
PERFORMANCEPerformance figures are for lump sum investments with income distributions reinvested. Actual investor performance may differ as a result of the investment date, the date of reinvestment and dividend withholding tax. Movements in exchange rates may also be the cause of the value of underlying international investments going up or down. Different classes of units apply to the Equity, Balanced, Stable and Optimal funds only and are subject to different fees and charges. Unit trust prices are calculated on a net asset value basis, which is the total market value of all assets in the Fund including any income accruals and less any permissible deductions from the Fund, divided by the number of units in issue. Forward pricing is used and fund valuations take place at approximately 16:00 each business day. Purchase and redemption requests must be received by 14:00 each business day to receive that day’s price. Unit trust prices are available daily on www.allangray.co.za. Permissible deductions may include management fees, brokerage, Securities Transfer Tax (STT), auditor’s fees, bank charges and trustee fees. A schedule of fees, charges and maximum commissions is available on request from the Management Company.
BENCHMARKSThe FTSE/JSE All Share Index is calculated by FTSE International Limited (‘FTSE’) in conjunction with the JSE Limited (‘JSE’) in accordance with standard criteria. The FTSE/JSE All Share Index is the proprietary information of FTSE and the JSE. All copyright subsisting in the FTSE/JSE All Share Index values and constituent lists vests in FTSE and the JSE jointly. All their rights are reserved. FTSE is a trademark of the London Stock Exchange Group of Companies. The FTSE World Index is calculated by FTSE International Limited (‘FTSE’) in accordance with standard criteria and is the proprietary information of FTSE. All copyright subsisting in the FTSE World Index values and constituent lists vests in FTSE. All its rights are reserved.
UNDERSTANDING THE FUNDSInvestors must make sure that they understand the nature of their choice of funds and that their investment objectives are aligned with those of the Fund/s they select.
A feeder fund is a unit trust that invests in another single unit trust which charges its own fees. A fund of funds is a unit trust that invests in other unit trusts, which charge their own fees. Allan Gray does not charge any additional fees in its feeder fund or funds of funds.
The Allan Gray Money Market Fund is not a bank deposit account. The Fund aims to maintain a constant price of 100 cents per unit. The total return an investor receives is made up of interest received and any gain or loss made on instruments held by the Fund. While capital losses are unlikely, they can occur if, for example, one of the issuers of an instrument defaults. In this event investors may lose some of their capital. To maintain a constant price of 100 cents per unit, investors’ unit holdings will be reduced to the extent of such losses. The yield is calculated according to the applicable ASISA Standards. Excessive withdrawals from the Fund may place it under liquidity pressure; if this happens withdrawals may be ring-fenced and managed over a period of time.
ADDI T IONAL INFORMAT ION FOR RET IREMENT FUND MEMBERS AND INVESTORS IN THE L I V ING ANNUI TY AND ENDOWMENTThe Allan Gray Retirement Annuity Fund, the Allan Gray Pension Preservation Fund and the Allan Gray Provident Preservation Fund are all administered by Allan Gray Investment Services Proprietary Limited, an authorised administrative financial services provider and approved under s13B of the Pension Funds Act as a benefits administrator. The Allan Gray Living Annuity and the Allan Gray Endowment are underwritten by Allan Gray Life Limited, also an authorised financial services provider and licensed under the Long-Term Insurance Act 52 of 1998. The underlying investment options of the Allan Gray individual life and retirement products are portfolios of Collective Investment Schemes in Securities (unit trusts or funds).
IMPORTANT INFORMATION FOR INVESTORS

26QC 3 2015
UNIT TRUSTS
A unit trust is a savings vehicle for investors who want to grow their money and may want to access it before they retire. Unit trusts allow investors to pool their money with other investors who have similar investment objectives. Unit trusts are also known as ‘portfolios of collective investment schemes’ or ‘funds’. Allan Gray has nine funds in its South African stable: Equity, Balanced, Stable, Optimal, Money Market, Bond, Global Equity Feeder, Global Fund of Funds and Global Optimal Fund of Funds.
RET IREMENT ANNUI TY*
The Allan Gray Retirement Annuity Fund (RA) is a savings vehicle for investors looking for a flexible, tax-efficient way to save for retirement. Investors can only access their money when they retire. Individually owned RAs can be managed on a group basis, offering employers a flexible solution to the challenge of retirement funding for their staff.
PRESERVAT ION FUNDS*
The Allan Gray Pension Preservation and Provident Preservation funds are savings vehicles for investors looking for a tax-efficient way to preserve existing retirement benefits when they leave a pension or provident fund, either as a result of a change in employment (e.g. retrenchment or resignation), or when they transfer from another preservation fund.
ENDOWMENT*The Allan Gray Endowment Policy is a savings policy for investors who want a tax-efficient way to save and wish to create liquidity in their estate.
L I V ING ANNUI TY*
The Allan Gray Living Annuity gives investors flexibility, within certain regulatory limits, to select an annuity best suited to their income needs after retirement. A living annuity provides investors with a regular income which is not guaranteed, and which is funded by growth on capital and income from interest and dividends.
OFFSHORE FUNDS
Allan Gray International manages Bermuda-listed portfolios in equities and bonds covering the continent of Africa. Through our partnership with Orbis we also offer you a cost-effective way to diversify your portfolio by investing internationally. There are two options for investing offshore through Allan Gray: invest in rand-denominated offshore funds without the need to use your offshore investment allowance, or use your offshore investment allowance to invest in foreign funds.
PLATFORM – LOCAL AND OFFSHORE
Our investment platform provides you with access to all of our products, as well as a focused range of unit trusts from other fund providers. The platform enables you to buy, sell and switch – usually at no charge – between the funds as your needs and objectives change. South African investors who wish to diversify their portfolios can also access funds from certain other offshore fund providers via the same platform.
L I F E POOLED PORTFOL IOS
The minimum investment per client is R20 million. Mandates include risk-profiled pooled portfolios: Stable Portfolio, Balanced Portfolio and Absolute Portfolio; asset class pooled portfolios: Money Market, Equity and Foreign, and finally an Optimal Portfolio.
SEGREGATED PORTFOL IOS
The minimum portfolio size is R500 million. Mandates are of a balanced or asset class specific nature.
BOTSWANAAllan Gray Botswana manages institutional portfolios on a segregated basis and offers our range of nine South African unit trusts to individual investors.
NAMIB IAAllan Gray Namibia offers institutional portfolios on a segregated and pooled basis and the Allan Gray Namibia Balanced Fund is available for institutions, retirement funds and individuals.
SWAZ I LAND Allan Gray Swaziland manages institutional portfolios on a segregated basis.
ALLAN GRAY ORB IS FOUNDAT ION
Allan Gray Orbis Foundation is a non-profit organisation that was established in 2005 as an education and development catalyst. It seeks to foster a next generation of high-impact leaders and entrepreneurs for the ultimate purpose of increased job creation in Southern Africa. The Foundation focuses on educational and experiential methods at the secondary and tertiary levels to realise the potential of bright young minds. Through its highly-researched learning programmes, it intends to equip talented young individuals with the skills, attitudes and motivation to have a significant future impact.
E 2
E2 stands for ‘excellence in entrepreneurship’ and as a long-term capital fund its purpose is to provide substantial financing to entrepreneurs who are graduates of the Allan Gray Orbis Foundation’s Fellowship Programme. In addition, E2 provides financing for social entrepreneurs who demonstrate exceptional leadership and creative initiative in the not-for-profit sectors.
*This product has unit trusts as its underlying investment option.
THE ALLAN GRAY GROUP

27 QC 3 2015
..........................................................................................................................................................
..........................................................................................................................................................
..........................................................................................................................................................
..........................................................................................................................................................
..........................................................................................................................................................
..........................................................................................................................................................
..........................................................................................................................................................
..........................................................................................................................................................
..........................................................................................................................................................
..........................................................................................................................................................
..........................................................................................................................................................
..........................................................................................................................................................
..........................................................................................................................................................
..........................................................................................................................................................
..........................................................................................................................................................
..........................................................................................................................................................
..........................................................................................................................................................
..........................................................................................................................................................
..........................................................................................................................................................
..........................................................................................................................................................
..........................................................................................................................................................
..........................................................................................................................................................
..........................................................................................................................................................
..........................................................................................................................................................
..........................................................................................................................................................
..........................................................................................................................................................
..........................................................................................................................................................
..........................................................................................................................................................
..........................................................................................................................................................
..........................................................................................................................................................
..........................................................................................................................................................
..........................................................................................................................................................
..........................................................................................................................................................
..........................................................................................................................................................
NOTES
© A l l an G ray P rop r i e t a ry L im i t ed , 2015 .
D i r e c t o r s ExecutiveM Cooper BBusSc FIA FASSA R W Dower BSc (Eng) MBA I S Liddle BBusSc (Hons) CFAT Mhlambiso AB MBA JD
Non-ExecutiveW B Gray BCom MBA CFA (Ir ish)T J Mahuma BA (Hons) MPhil K C Morolo BSc (Eng) MEng
Company Se c r e t a ry C E Solomon BBusSc (Hons) CA (SA)
Reg i s t r a t i on Numbe r 2005/002576/07
Bus i ne s s Add re s s 1 Silo Square V&A Waterfront Cape Town 8001 P O Box 51318 V&A Waterfront Cape Town 8002 South Afr ica
C l i en t S e r v i c e Cen t r e Tel: 0860 000 654 / +27 (0)21 415 2301Fax: 0860 000 655 / +27 (0)21 415 2492Email: [email protected]: www.allangray.co.zaOffice hours: Monday to Friday 7:30 - 17:30
Copyright notice© 2015 Allan Gray Proprietary LimitedAll rights reserved. The content and information may not be reproduced or distributed without the prior written consent of Allan Gray Proprietary Limited (Allan Gray). Information and contentThe information and content of this publication/presentation is provided by Allan Gray as general information about the company and its products and services. Allan Gray does not guarantee the suitability or potential value of any information or particular investment source. The information provided is not intended to nor does it constitute financial, tax, legal, investment, or other advice. Before making any decision or taking any action regarding your finances, you should consult a qualified financial adviser. Nothing contained in this publication/presentation constitutes a solicitation, recommendation, endorsement or offer by Allan Gray, but is merely an invitation to do business. Allan Gray has taken and will continue to take care that all information provided, in so far as this is under its control, is true and correct. However, Allan Gray shall not be responsible for and therefore disclaims any liability for any loss, liability, damage (whether direct or consequential) or expense of any nature whatsoever, which may be suffered as a result of or which may be attributable, directly or indirectly, to the use of or reliance upon any information provided.


