A new quarterly report by Ohio's welfare agency, the Ohio Dept. of Job and Family Services, details the massive impact shale drilling for oil and gas has had on jobs and the state's economy.
24
January 2013 TO STRENGTHEN OHIO FAMILIES WITH SOLUTIONS TO TEMPORARY CHALLENGES John R. Kasich, Governor . Michael B. Colbert, Director QUARTERLY ECONOMIC TRENDS FOR OHIO OIL AND GAS INDUSTRIES
Transcript
January 2013
TO STRENGTHEN OHIO FAMILIES WITH SOLUTIONS TO TEMPORARY CHALLENGES
John R. Kasich, Governor . Michael B. Colbert, Director
Quarterly economic trends for ohio oil and Gas industries
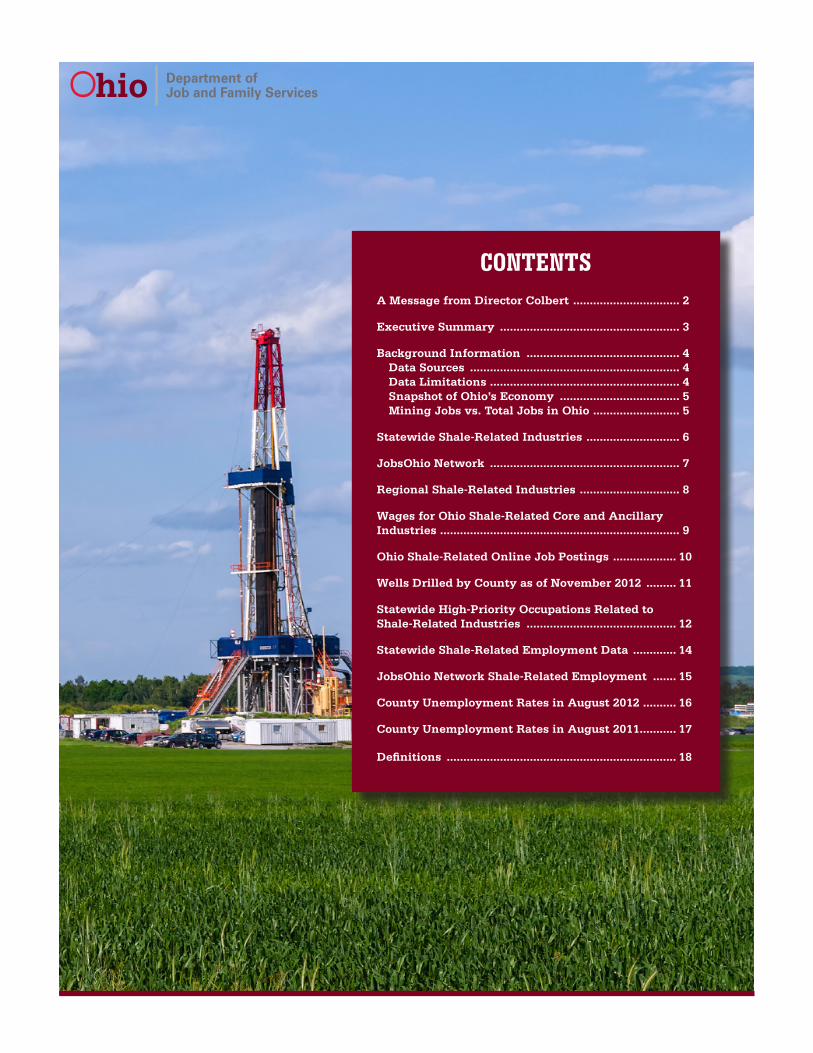
CONTENTSA Message from Director Colbert ................................ 2
Background Information .............................................. 4Data Sources ............................................................... 4Data Limitations ......................................................... 4Snapshot of Ohio’s Economy .................................... 5Mining Jobs vs. Total Jobs in Ohio .......................... 5
Ohio is fortunate to have a natural gift with great potential for reinvigorating our economy: huge deposits of shale rock, beneath which sit potentially vast reserves of oil and natural gas. Safely and responsibly extracting this oil and gas and making them usable as energy sources will take work, but Ohio is perfectly poised to do that work. We have a workforce equipped with the skills employers need and a multitude of local training programs to keep that pipeline of skilled workers flowing.
The pages that follow show the effect that shale already has had on Ohio’s economy, as of November 2012. Total shale-related employment for the first quarter of 2012 was 167,310, and employment in core shale-related industries was up 17 percent from the first quarter of 2011. In any given month, thousands of shale-related jobs openings are posted online, at www.ohiomeansjobs.com. The Ohio Board of Regents also provides an overview of shale-related employment opportunities and information about education and training at www.ohioenergypathways.com.
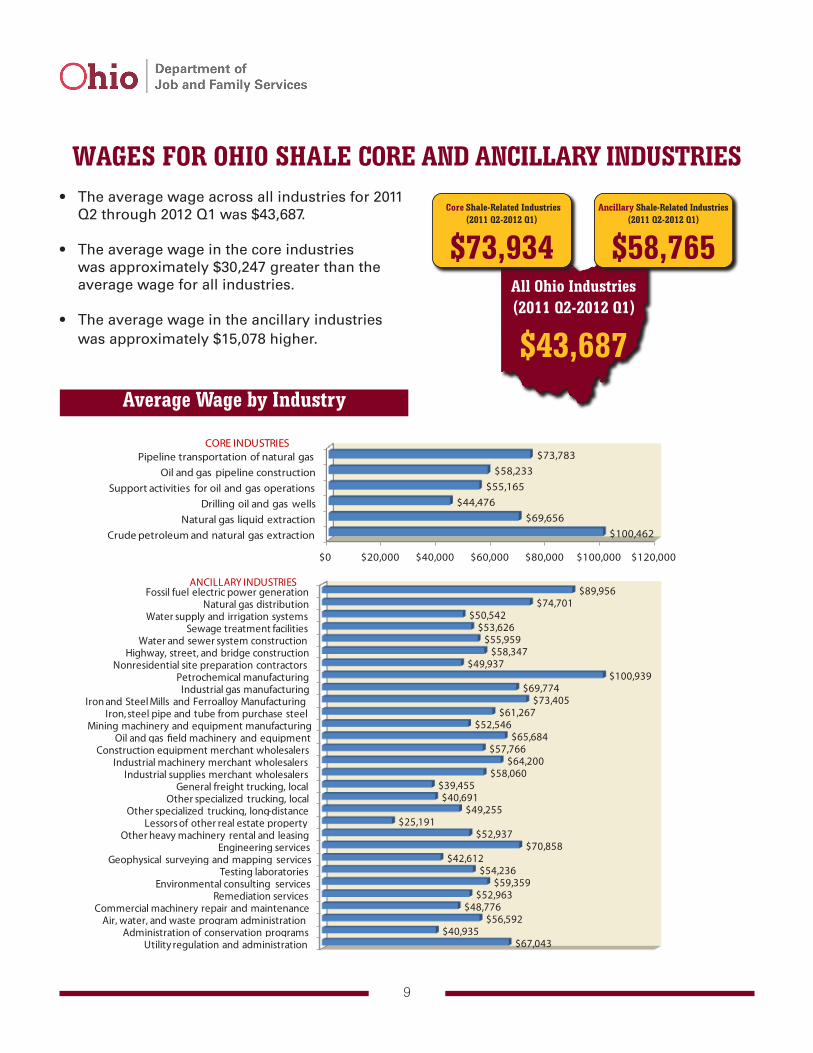
The average wages of shale-related jobs are excellent: $73,934 in core shale-related industries (such as pipeline construction and well drilling), and $58,765 in ancillary shale-related industries (such as freight trucking and environmental consulting). To put that in perspective, the average wage in all industries in Ohio is $43,687.
For Ohio families and communities still struggling to regain their financial footing after the recession, this is welcome news. The Ohio Department of Job and Family Services (ODJFS) has been working hard to help employers, workers and the state as a whole take advantage of these opportunities. We’ve been working closely with the Board of Regents, local workforce investment areas, post-secondary educational institutions and employers to identify the most-needed shale-related occupations and make sure that training programs are in place to help fill them.
Individuals can sign up for on-the-job training opportunities at any of the state’s local One-Stop Centers, which provide free job training and other services to Ohioans looking for work and employers looking for workers. Individuals can post their resumes, and employers can post job openings at www.ohiomeansjobs.com.
We are excited about the potential shale holds for Ohio and will publish regular snapshots of shale employment trends in future issues of this report. Check back quarterly for the latest updates.
Michael B. Colbert, DirectorOhio Department of Job and Family Services
3
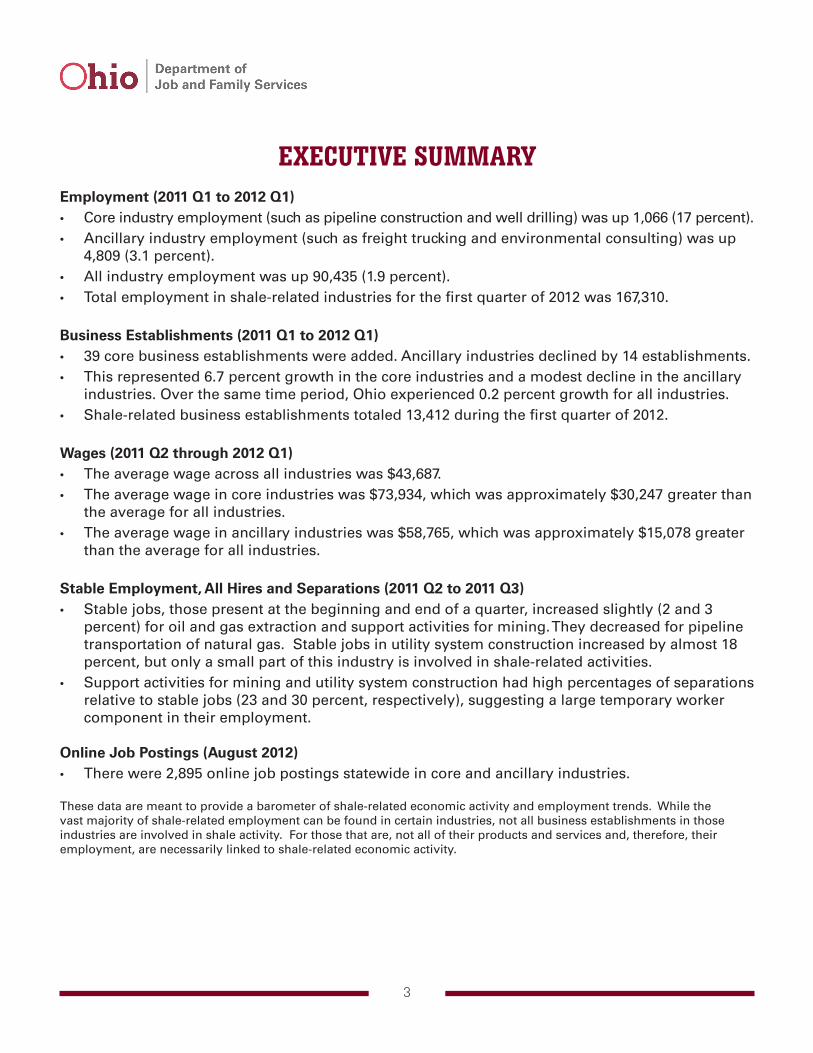
EXECUTIVE SUMMARYEmployment (2011 Q1 to 2012 Q1)• Core industry employment (such as pipeline construction and well drilling) was up 1,066 (17 percent).• Ancillary industry employment (such as freight trucking and environmental consulting) was up
4,809 (3.1 percent).• All industry employment was up 90,435 (1.9 percent).• Total employment in shale-related industries for the first quarter of 2012 was 167,310.
Business Establishments (2011 Q1 to 2012 Q1)• 39 core business establishments were added. Ancillary industries declined by 14 establishments.• This represented 6.7 percent growth in the core industries and a modest decline in the ancillary
industries. Over the same time period, Ohio experienced 0.2 percent growth for all industries.• Shale-related business establishments totaled 13,412 during the first quarter of 2012.
Wages (2011 Q2 through 2012 Q1)• The average wage across all industries was $43,687.• The average wage in core industries was $73,934, which was approximately $30,247 greater than
the average for all industries.• The average wage in ancillary industries was $58,765, which was approximately $15,078 greater
than the average for all industries.
Stable Employment, All Hires and Separations (2011 Q2 to 2011 Q3)• Stable jobs, those present at the beginning and end of a quarter, increased slightly (2 and 3
percent) for oil and gas extraction and support activities for mining. They decreased for pipeline transportation of natural gas. Stable jobs in utility system construction increased by almost 18 percent, but only a small part of this industry is involved in shale-related activities.
• Support activities for mining and utility system construction had high percentages of separations relative to stable jobs (23 and 30 percent, respectively), suggesting a large temporary worker component in their employment.
Online Job Postings (August 2012)• There were 2,895 online job postings statewide in core and ancillary industries.
These data are meant to provide a barometer of shale-related economic activity and employment trends. While the vast majority of shale-related employment can be found in certain industries, not all business establishments in those industries are involved in shale activity. For those that are, not all of their products and services and, therefore, their employment, are necessarily linked to shale-related economic activity.
4
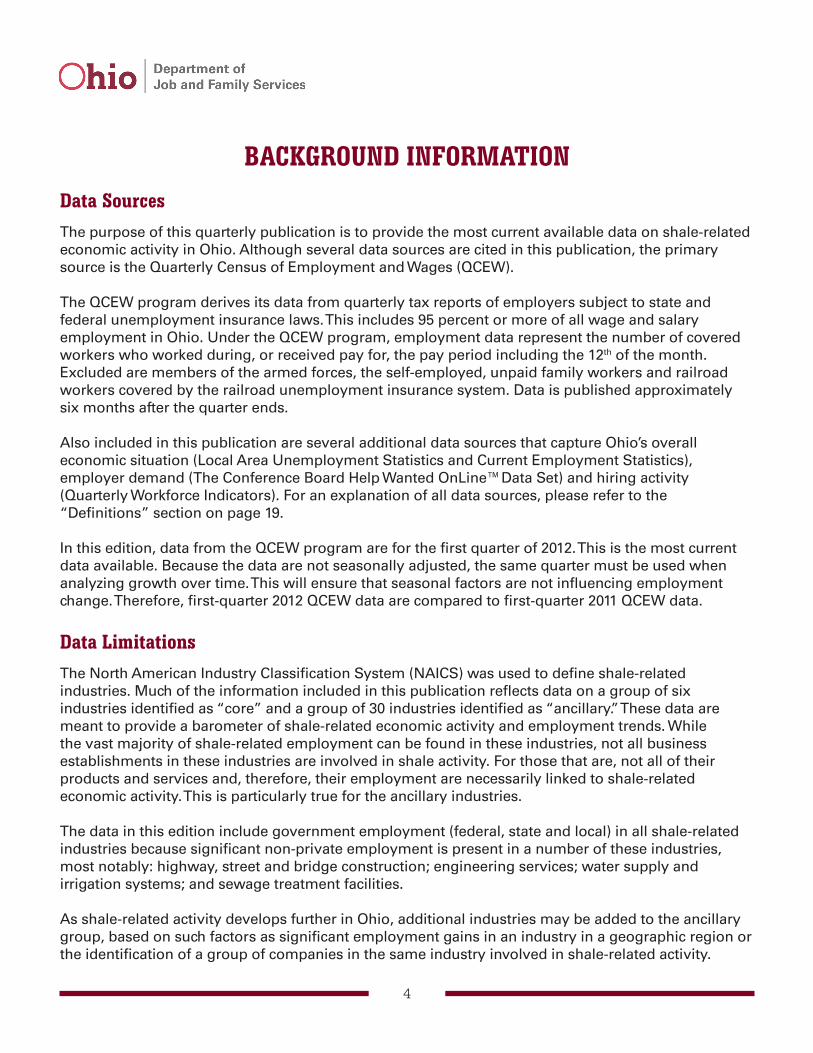
BACKGROUND INFORMATIONData SourcesThe purpose of this quarterly publication is to provide the most current available data on shale-related economic activity in Ohio. Although several data sources are cited in this publication, the primary source is the Quarterly Census of Employment and Wages (QCEW).
The QCEW program derives its data from quarterly tax reports of employers subject to state and federal unemployment insurance laws. This includes 95 percent or more of all wage and salary employment in Ohio. Under the QCEW program, employment data represent the number of covered workers who worked during, or received pay for, the pay period including the 12th of the month. Excluded are members of the armed forces, the self-employed, unpaid family workers and railroad workers covered by the railroad unemployment insurance system. Data is published approximately six months after the quarter ends.
Also included in this publication are several additional data sources that capture Ohio’s overall economic situation (Local Area Unemployment Statistics and Current Employment Statistics), employer demand (The Conference Board Help Wanted OnLine™Data Set) and hiring activity (Quarterly Workforce Indicators). For an explanation of all data sources, please refer to the “Definitions” section on page 19.
In this edition, data from the QCEW program are for the first quarter of 2012. This is the most current data available. Because the data are not seasonally adjusted, the same quarter must be used when analyzing growth over time. This will ensure that seasonal factors are not influencing employment change. Therefore, first-quarter 2012 QCEW data are compared to first-quarter 2011 QCEW data.
Data LimitationsThe North American Industry Classification System (NAICS) was used to define shale-related industries. Much of the information included in this publication reflects data on a group of six industries identified as “core” and a group of 30 industries identified as “ancillary.” These data are meant to provide a barometer of shale-related economic activity and employment trends. While the vast majority of shale-related employment can be found in these industries, not all business establishments in these industries are involved in shale activity. For those that are, not all of their products and services and, therefore, their employment are necessarily linked to shale-related economic activity. This is particularly true for the ancillary industries.
The data in this edition include government employment (federal, state and local) in all shale-related industries because significant non-private employment is present in a number of these industries, most notably: highway, street and bridge construction; engineering services; water supply and irrigation systems; and sewage treatment facilities.
As shale-related activity develops further in Ohio, additional industries may be added to the ancillary group, based on such factors as significant employment gains in an industry in a geographic region or the identification of a group of companies in the same industry involved in shale-related activity.
5
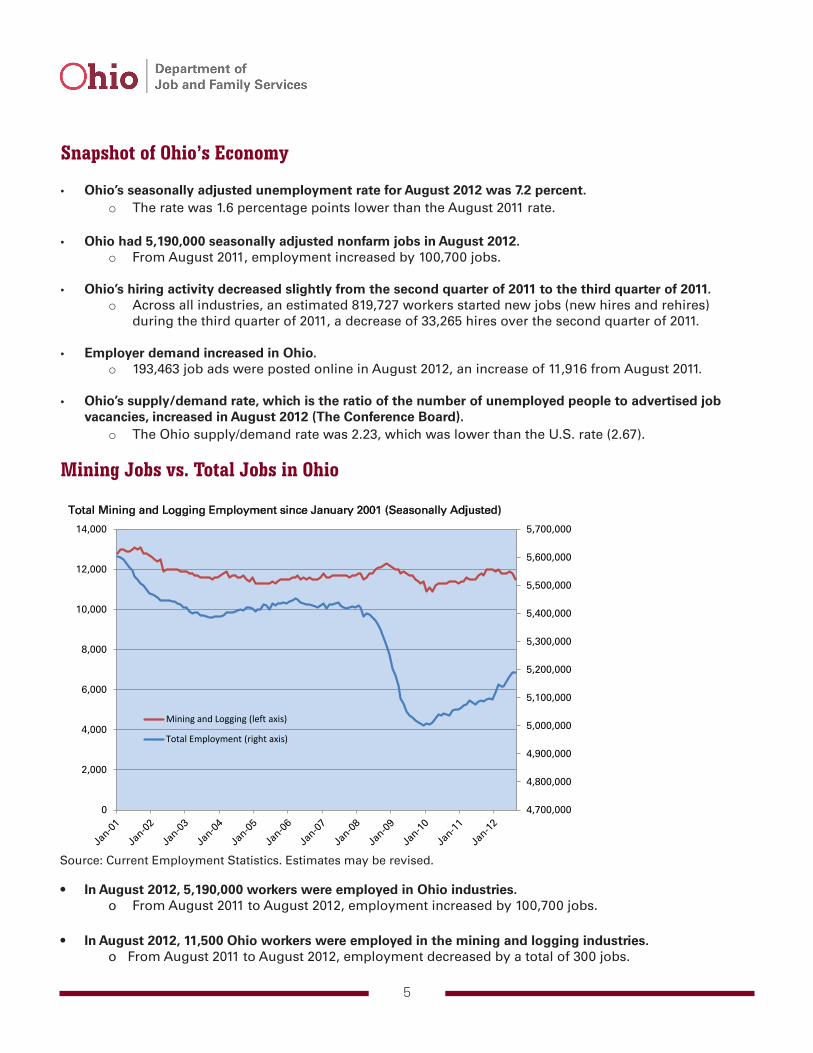
Total Mining and Logging Employment since January 2001 (Seasonally Adjusted)
Source: Current Employment Statistics. Estimates may be revised.
In August 2012, 5,190,000 workers were employed in Ohio industries.
o From July 2012 to August 2012, employment increased by 400 jobs.
o From August 2011 to August 2012, employment increased by 100,700 jobs.
In August 2012, 11,500 Ohio workers were employed in the mining and logging industries.
o From July 2012 to August 2012, employment decreased by 300 jobs.
o From August 2011 to August 2012, employment decreased by a total of 300 jobs.
4,700,000
4,800,000
4,900,000
5,000,000
5,100,000
5,200,000
5,300,000
5,400,000
5,500,000
5,600,000
5,700,000
0
2,000
4,000
6,000
8,000
10,000
12,000
14,000
Mining and Logging (left axis)
Total Employment (right axis)
Snapshot of Ohio’s Economy
• Ohio’s seasonally adjusted unemployment rate for August 2012 was 7.2 percent.o The rate was 1.6 percentage points lower than the August 2011 rate.
• Ohio had 5,190,000 seasonally adjusted nonfarm jobs in August 2012.o From August 2011, employment increased by 100,700 jobs.
• Ohio’s hiring activity decreased slightly from the second quarter of 2011 to the third quarter of 2011.o Across all industries, an estimated 819,727 workers started new jobs (new hires and rehires)
during the third quarter of 2011, a decrease of 33,265 hires over the second quarter of 2011.
• Employer demand increased in Ohio.o 193,463 job ads were posted online in August 2012, an increase of 11,916 from August 2011.
• Ohio’s supply/demand rate, which is the ratio of the number of unemployed people to advertised job vacancies, increased in August 2012 (The Conference Board).
o The Ohio supply/demand rate was 2.23, which was lower than the U.S. rate (2.67).
Mining Jobs vs. Total Jobs in Ohio
• In August 2012, 5,190,000 workers were employed in Ohio industries.o From August 2011 to August 2012, employment increased by 100,700 jobs.
• In August 2012, 11,500 Ohio workers were employed in the mining and logging industries. o From August 2011 to August 2012, employment decreased by a total of 300 jobs.
Source: Current Employment Statistics. Estimates may be revised.
6
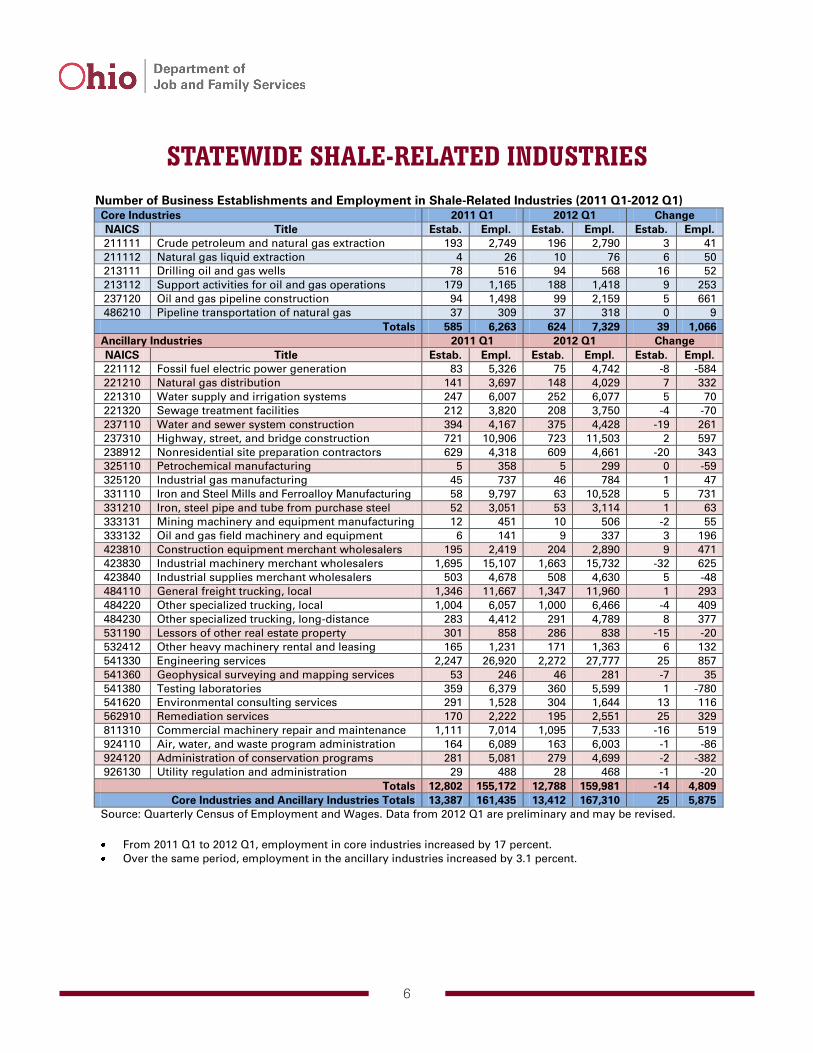
STATEWIDE SHALE-RELATED INDUSTRIES
Number of Business Establishments and Employment in Shale-Related Industries (2011 Q1-2012 Q1) Core Industries 2011 Q1 2012 Q1 Change NAICS Title Estab. Empl. Estab. Empl. Estab. Empl. 211111 Crude petroleum and natural gas extraction 193 2,749 196 2,790 3 41 211112 Natural gas liquid extraction 4 26 10 76 6 50 213111 Drilling oil and gas wells 78 516 94 568 16 52 213112 Support activities for oil and gas operations 179 1,165 188 1,418 9 253 237120 Oil and gas pipeline construction 94 1,498 99 2,159 5 661 486210 Pipeline transportation of natural gas 37 309 37 318 0 9
Totals 585 6,263 624 7,329 39 1,066 Ancillary Industries 2011 Q1 2012 Q1 Change NAICS Title Estab. Empl. Estab. Empl. Estab. Empl. 221112 Fossil fuel electric power generation 83 5,326 75 4,742 -8 -584 221210 Natural gas distribution 141 3,697 148 4,029 7 332 221310 Water supply and irrigation systems 247 6,007 252 6,077 5 70 221320 Sewage treatment facilities 212 3,820 208 3,750 -4 -70 237110 Water and sewer system construction 394 4,167 375 4,428 -19 261 237310 Highway, street, and bridge construction 721 10,906 723 11,503 2 597 238912 Nonresidential site preparation contractors 629 4,318 609 4,661 -20 343 325110 Petrochemical manufacturing 5 358 5 299 0 -59 325120 Industrial gas manufacturing 45 737 46 784 1 47 331110 Iron and Steel Mills and Ferroalloy Manufacturing 58 9,797 63 10,528 5 731 331210 Iron, steel pipe and tube from purchase steel 52 3,051 53 3,114 1 63 333131 Mining machinery and equipment manufacturing 12 451 10 506 -2 55 333132 Oil and gas field machinery and equipment 6 141 9 337 3 196 423810 Construction equipment merchant wholesalers 195 2,419 204 2,890 9 471 423830 Industrial machinery merchant wholesalers 1,695 15,107 1,663 15,732 -32 625 423840 Industrial supplies merchant wholesalers 503 4,678 508 4,630 5 -48 484110 General freight trucking, local 1,346 11,667 1,347 11,960 1 293 484220 Other specialized trucking, local 1,004 6,057 1,000 6,466 -4 409 484230 Other specialized trucking, long-distance 283 4,412 291 4,789 8 377 531190 Lessors of other real estate property 301 858 286 838 -15 -20 532412 Other heavy machinery rental and leasing 165 1,231 171 1,363 6 132 541330 Engineering services 2,247 26,920 2,272 27,777 25 857 541360 Geophysical surveying and mapping services 53 246 46 281 -7 35 541380 Testing laboratories 359 6,379 360 5,599 1 -780 541620 Environmental consulting services 291 1,528 304 1,644 13 116 562910 Remediation services 170 2,222 195 2,551 25 329 811310 Commercial machinery repair and maintenance 1,111 7,014 1,095 7,533 -16 519 924110 Air, water, and waste program administration 164 6,089 163 6,003 -1 -86 924120 Administration of conservation programs 281 5,081 279 4,699 -2 -382 926130 Utility regulation and administration 29 488 28 468 -1 -20
Source: Quarterly Census of Employment and Wages. Data from 2012 Q1 are preliminary and may be revised. From 2011 Q1 to 2012 Q1, employment in core industries increased by 17 percent. Over the same period, employment in the ancillary industries increased by 3.1 percent.
7
!@
!@
!@
!@
!@
!@
Ross
Stark
Pike
Wood
Darke
Knox
Scioto
Licking
AdamsGallia
Wayne
Clark
Perry
Huron
Allen
Butler
Lorain
Seneca
Brown
Logan
Athens
Union
Trumbull
Meigs
Ashtabula
Hardin
Henry
Franklin
NoblePreble
Mercer
Portage
Miami
Fulton
Erie
Belmont
Vinton
Hancock
Fairfield
Putnam
Highland
Lucas
Carroll
Shelby
Monroe
Richland
Clinton
Greene
Muskingum
Marion
Medina
Warren
Fayette
Holmes
Guernsey
Pickaway
Madison
Morgan
Washington
Coshocton
Geauga
Summit
Jackson
Hocking
Ashland
Morrow
Lake
Clermont
Tuscarawas
Delaware
Williams
Harrison
Paulding
Lawrence
Van Wert
Auglaize
Cuyahoga
Wyandot
Hamilton
Columbiana
Jefferson
Crawford
Sandusky
Mahoning
Champaign
Ottawa
Montgomery
Defiance
Columbus
Toledo
Dayton
Nelsonville
Cleveland
Cincinnati
R020411A
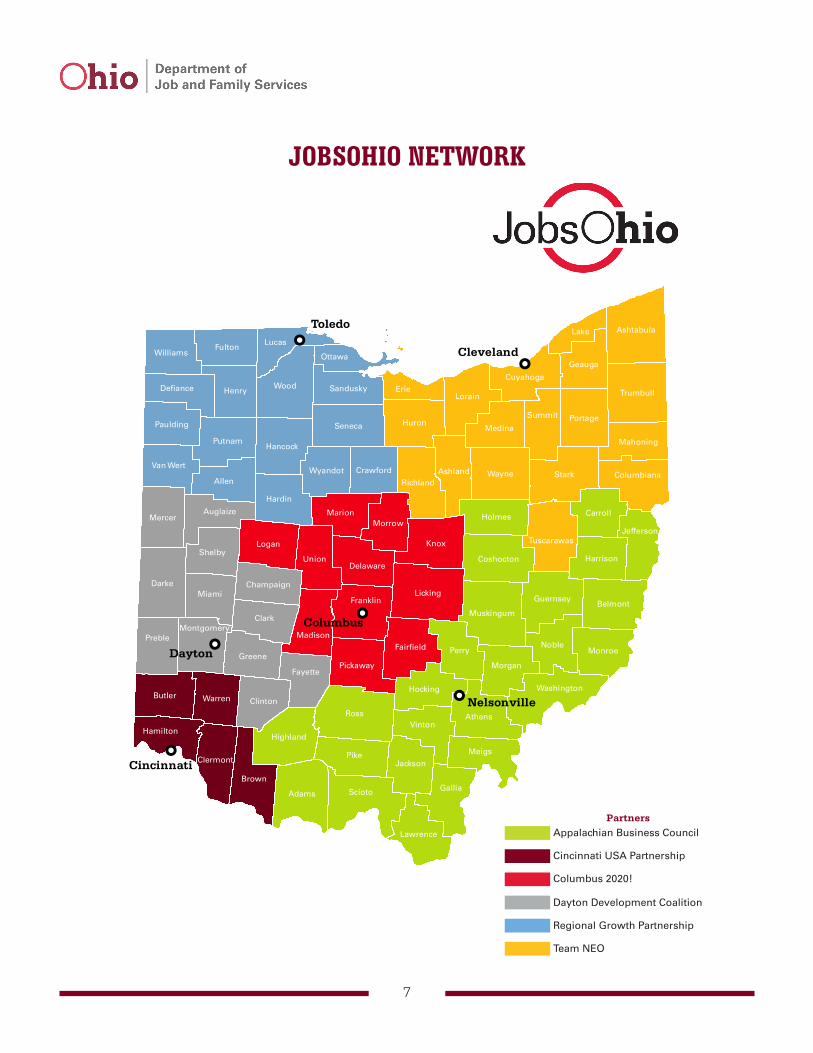
JobsOhioNetwork
PartnersAppalachian Business Council
Cincinnati USA Partnership
Columbus 2020!
Dayton Development Coalition
Regional Growth Partnership
Team NEO
JOBSOHIO NETWORK
8
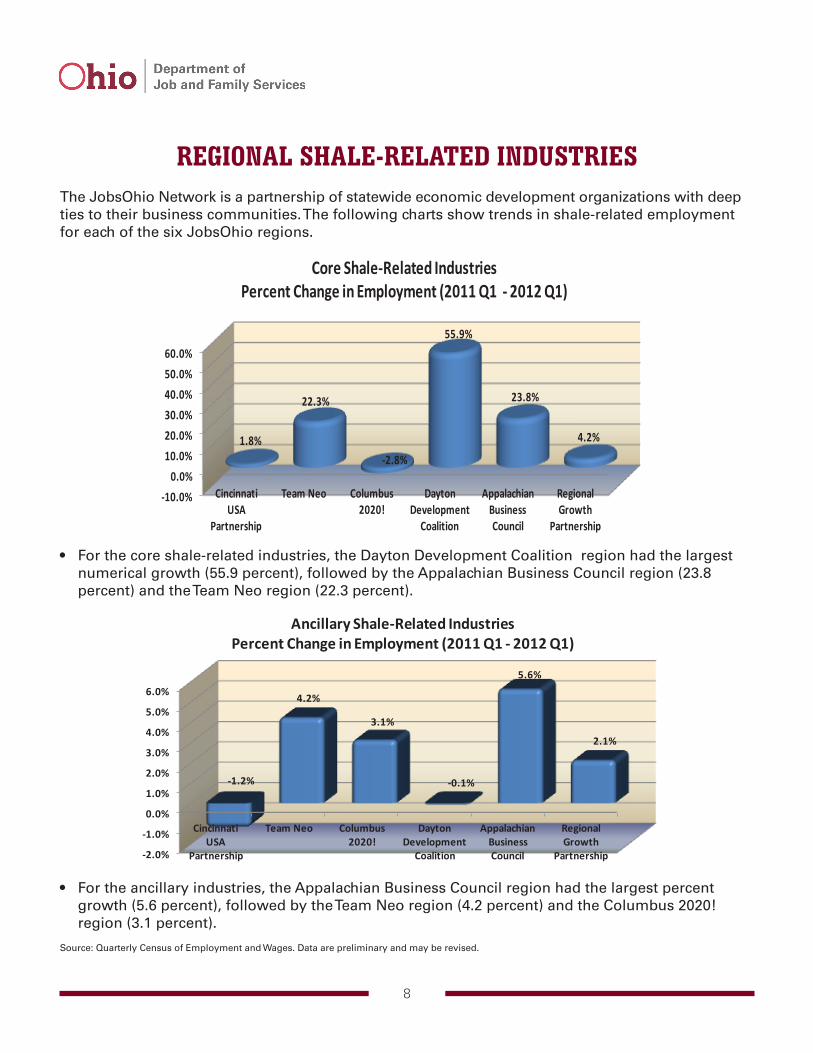
• For the ancillary industries, the Appalachian Business Council region had the largest percent growth (5.6 percent), followed by the Team Neo region (4.2 percent) and the Columbus 2020! region (3.1 percent).
REGIONAL SHALE-RELATED INDUSTRIESThe JobsOhio Network is a partnership of statewide economic development organizations with deep ties to their business communities. The following charts show trends in shale-related employment for each of the six JobsOhio regions.
Page 6. Header, Footer and Title should remain as is. All other information on page (table and bullets) should be replaced and organized as follows:
For the core shale-related industries,
the Dayton Development Coalition region had the largest numerical growth (55.9 percent), followed by the Appalachian Business Council region (23.8 percent) and the Team Neo region (22.3 percent).
The Team Neo region had the largest
numerical growth (387 employment), followed by the Appalachian Business Council (338 employment).
For the ancillary industries, the Appalachian Business Council region had the largest percent growth (5.6 percent), followed by the Team Neo region (4.2 percent) and the Columbus 2020! region (3.1 percent).
Source: Quarterly Census of Employment and Wages. Data are preliminary and may be revised.
Source: Quarterly Census of Employment and Wages. Data are preliminary and may be revised.
Source: Quarterly Census of Employment and Wages. Data are preliminary and may be revised.
• For the core shale-related industries, the Dayton Development Coalition region had the largest numerical growth (55.9 percent), followed by the Appalachian Business Council region (23.8 percent) and the Team Neo region (22.3 percent).
Page 6. Header, Footer and Title should remain as is. All other information on page (table and bullets) should be replaced and organized as follows:
For the core shale-related industries,
the Dayton Development Coalition region had the largest numerical growth (55.9 percent), followed by the Appalachian Business Council region (23.8 percent) and the Team Neo region (22.3 percent).
The Team Neo region had the largest
numerical growth (387 employment), followed by the Appalachian Business Council (338 employment).
For the ancillary industries, the Appalachian Business Council region had the largest percent growth (5.6 percent), followed by the Team Neo region (4.2 percent) and the Columbus 2020! region (3.1 percent).
Source: Quarterly Census of Employment and Wages. Data are preliminary and may be revised.
Source: Quarterly Census of Employment and Wages. Data are preliminary and may be revised.
Source: Quarterly Census of Employment and Wages. Data are preliminary and may be revised.
Source: Quarterly Census of Employment and Wages. Data are preliminary and may be revised.
Commercial machinery repair and maintenanceAir, water, and waste program administration
Administration of conservation programsUtility regulation and administration
$89,956 $74,701
$50,542 $53,626
$55,959 $58,347
$49,937 $100,939
$69,774 $73,405
$61,267 $52,546
$65,684 $57,766
$64,200 $58,060
$39,455 $40,691
$49,255 $25,191
$52,937 $70,858
$42,612 $54,236
$59,359 $52,963
$48,776 $56,592
$40,935 $67,043
ANCILLARY INDUSTRIES
WAGES FOR OHIO SHALE CORE AND ANCILLARY INDUSTRIES• The average wage across all industries for 2011
Q2 through 2012 Q1 was $43,687.
• The average wage in the core industries was approximately $30,247 greater than the average wage for all industries.
• The average wage in the ancillary industries was approximately $15,078 higher.
Average Wage by Industry
(2011 Q2-2012 Q1) (2011 Q2-2012 Q1)
(2011 Q2-2012 Q1)
10
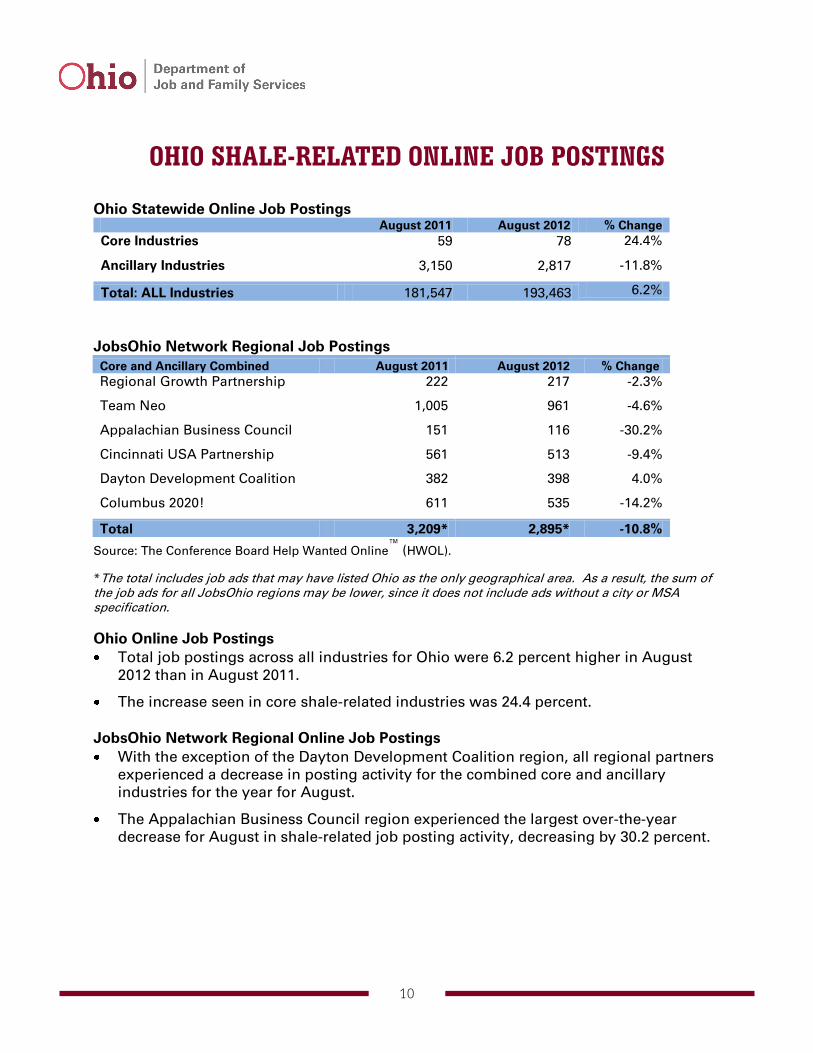
OHIO SHALE-RELATED ONLINE JOB POSTINGS
Ohio Statewide Online Job Postings August 2011 August 2012 % Change Core Industries 59 78 24.4%
Ancillary Industries 3,150 2,817 -11.8%
Total: ALL Industries 181,547 193,463 6.2%
JobsOhio Network Regional Job Postings Core and Ancillary Combined August 2011 August 2012 % Change Regional Growth Partnership 222 217 -2.3%
Team Neo 1,005 961 -4.6%
Appalachian Business Council 151 116 -30.2%
Cincinnati USA Partnership 561 513 -9.4%
Dayton Development Coalition 382 398 4.0%
Columbus 2020! 611 535 -14.2%
Total 3,209* 2,895* -10.8%
Source: The Conference Board Help Wanted Online™ (HWOL).
*The total includes job ads that may have listed Ohio as the only geographical area. As a result, the sum of the job ads for all JobsOhio regions may be lower, since it does not include ads without a city or MSA specification. Ohio Online Job Postings Total job postings across all industries for Ohio were 6.2 percent higher in August
2012 than in August 2011.
The increase seen in core shale-related industries was 24.4 percent. JobsOhio Network Regional Online Job Postings With the exception of the Dayton Development Coalition region, all regional partners
experienced a decrease in posting activity for the combined core and ancillary industries for the year for August.
The Appalachian Business Council region experienced the largest over-the-year decrease for August in shale-related job posting activity, decreasing by 30.2 percent.
11
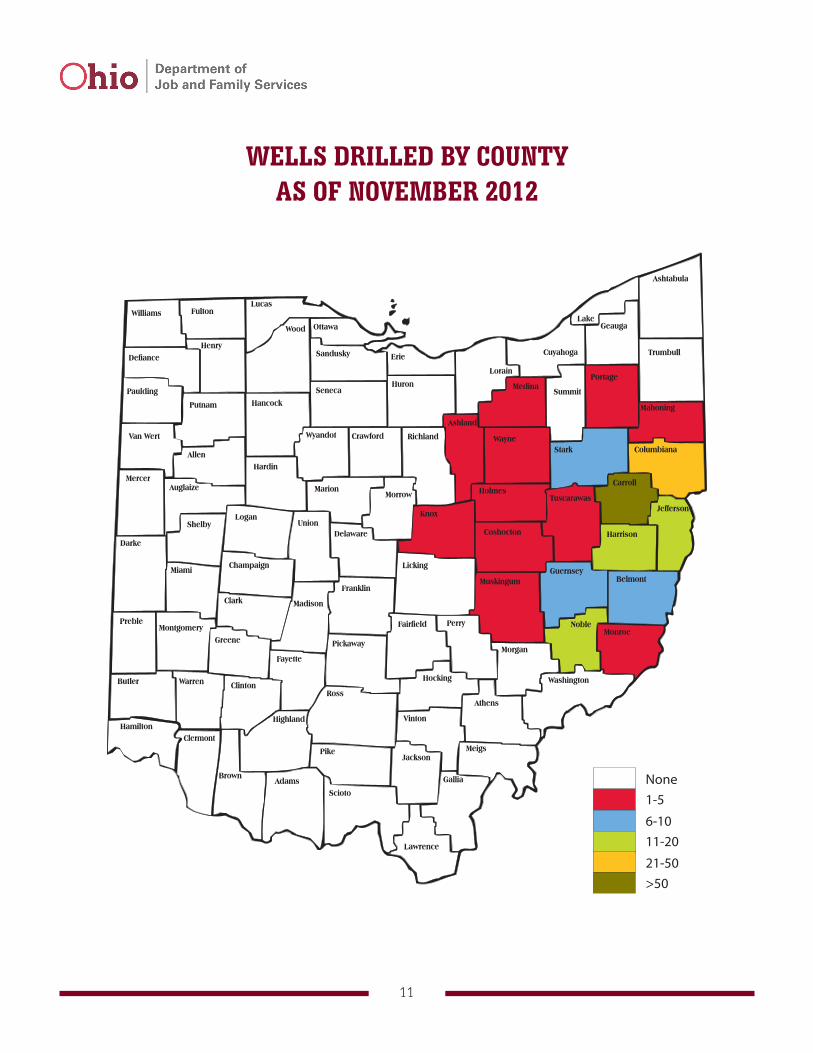
WELLS DRILLED BY COUNTY AS OF NOVEMBER 2012
None1-5
6-1011-20
21-50>50
12
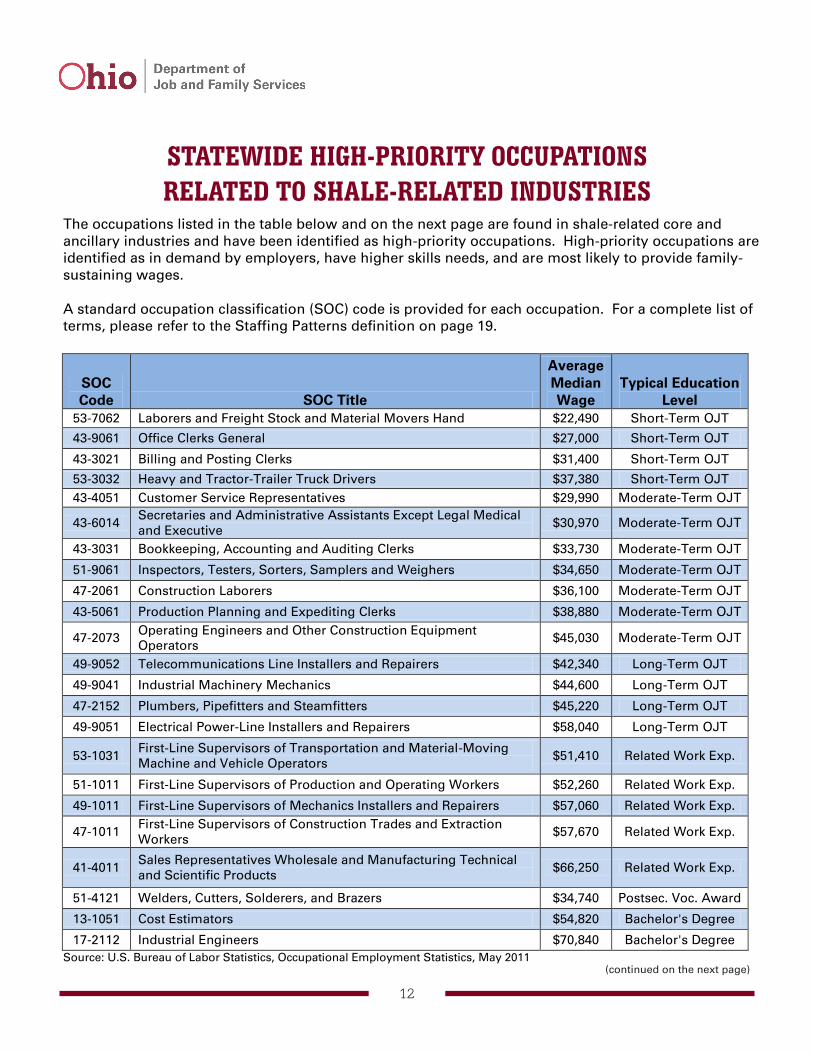
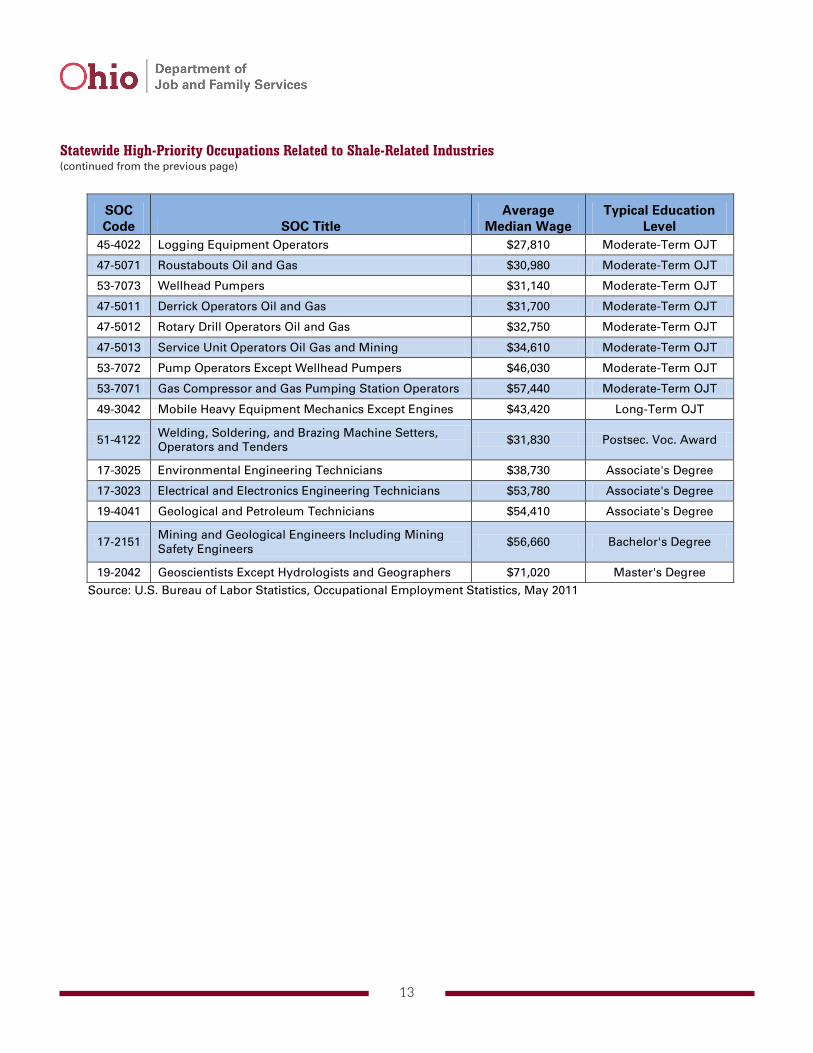
STATEWIDE HIGH-PRIORITY OCCUPATIONS RELATED TO SHALE-RELATED INDUSTRIES
The occupations listed in the table below and on the next page are found in shale-related core and ancillary industries and have been identified as high-priority occupations. High-priority occupations are identified as in demand by employers, have higher skills needs, and are most likely to provide family-sustaining wages. A standard occupation classification (SOC) code is provided for each occupation. For a complete list of terms, please refer to the Staffing Patterns definition on page 19.
SOC Code SOC Title
Average Median Wage
Typical Education Level
53-7062 Laborers and Freight Stock and Material Movers Hand $22,490 Short-Term OJT
43-9061 Office Clerks General $27,000 Short-Term OJT
43-3021 Billing and Posting Clerks $31,400 Short-Term OJT
53-3032 Heavy and Tractor-Trailer Truck Drivers $37,380 Short-Term OJT 43-4051 Customer Service Representatives $29,990 Moderate-Term OJT
43-6014 Secretaries and Administrative Assistants Except Legal Medical and Executive
$30,970 Moderate-Term OJT
43-3031 Bookkeeping, Accounting and Auditing Clerks $33,730 Moderate-Term OJT
51-9061 Inspectors, Testers, Sorters, Samplers and Weighers $34,650 Moderate-Term OJT
47-2061 Construction Laborers $36,100 Moderate-Term OJT
43-5061 Production Planning and Expediting Clerks $38,880 Moderate-Term OJT
47-2073 Operating Engineers and Other Construction Equipment Operators
$45,030 Moderate-Term OJT
49-9052 Telecommunications Line Installers and Repairers $42,340 Long-Term OJT
17-3023 Electrical and Electronics Engineering Technicians $53,780 Associate's Degree
19-4041 Geological and Petroleum Technicians $54,410 Associate's Degree
17-2151 Mining and Geological Engineers Including Mining Safety Engineers
$56,660 Bachelor's Degree
19-2042 Geoscientists Except Hydrologists and Geographers $71,020 Master's Degree Source: U.S. Bureau of Labor Statistics, Occupational Employment Statistics, May 2011
(continued from the previous page)
14
STATEWIDE SHALE-RELATED EMPLOYMENT DATA
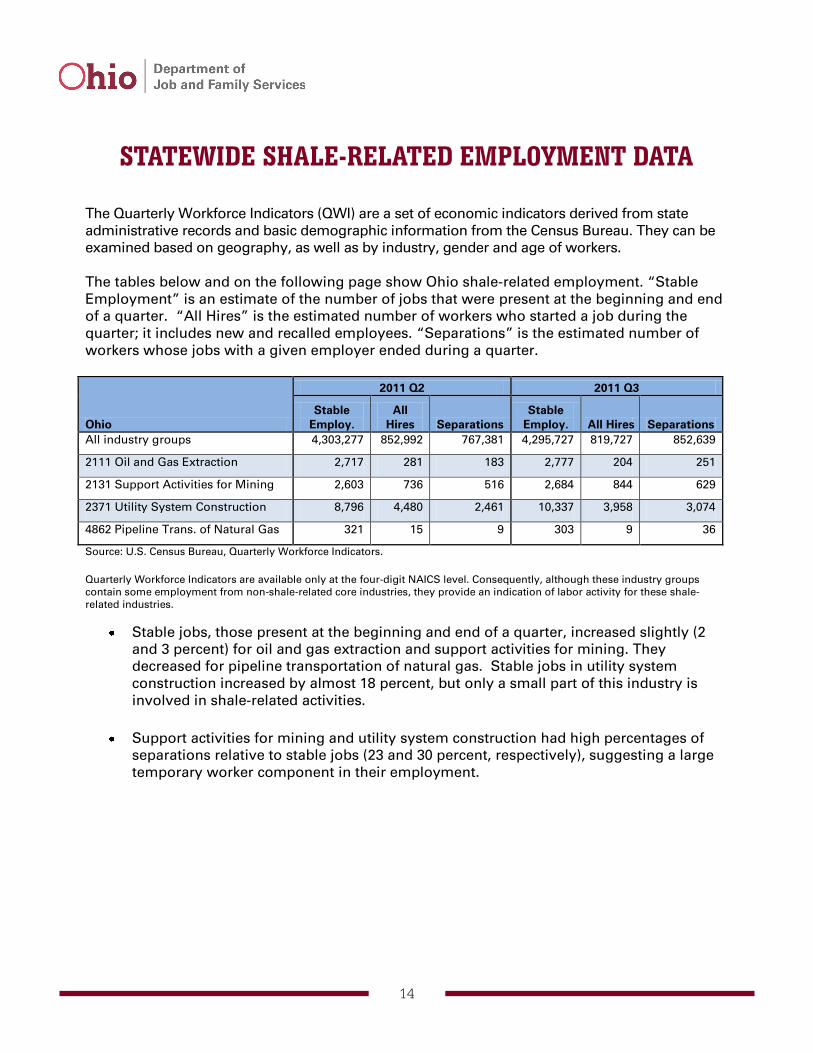
The Quarterly Workforce Indicators (QWI) are a set of economic indicators derived from state administrative records and basic demographic information from the Census Bureau. They can be examined based on geography, as well as by industry, gender and age of workers. The tables below and on the following page show Ohio shale-related employment. “Stable Employment” is an estimate of the number of jobs that were present at the beginning and end of a quarter. “All Hires” is the estimated number of workers who started a job during the quarter; it includes new and recalled employees. “Separations” is the estimated number of workers whose jobs with a given employer ended during a quarter.
Ohio
2011 Q2 2011 Q3
Stable Employ.
All Hires Separations
Stable Employ. All Hires Separations
All industry groups 4,303,277 852,992 767,381 4,295,727 819,727 852,639
2111 Oil and Gas Extraction 2,717 281 183 2,777 204 251
2131 Support Activities for Mining 2,603 736 516 2,684 844 629
2371 Utility System Construction 8,796 4,480 2,461 10,337 3,958 3,074
4862 Pipeline Trans. of Natural Gas 321 15 9 303 9 36
Source: U.S. Census Bureau, Quarterly Workforce Indicators. Quarterly Workforce Indicators are available only at the four-digit NAICS level. Consequently, although these industry groups contain some employment from non-shale-related core industries, they provide an indication of labor activity for these shale-related industries.
Stable jobs, those present at the beginning and end of a quarter, increased slightly (2 and 3 percent) for oil and gas extraction and support activities for mining. They decreased for pipeline transportation of natural gas. Stable jobs in utility system construction increased by almost 18 percent, but only a small part of this industry is involved in shale-related activities.
Support activities for mining and utility system construction had high percentages of
separations relative to stable jobs (23 and 30 percent, respectively), suggesting a large temporary worker component in their employment.
15
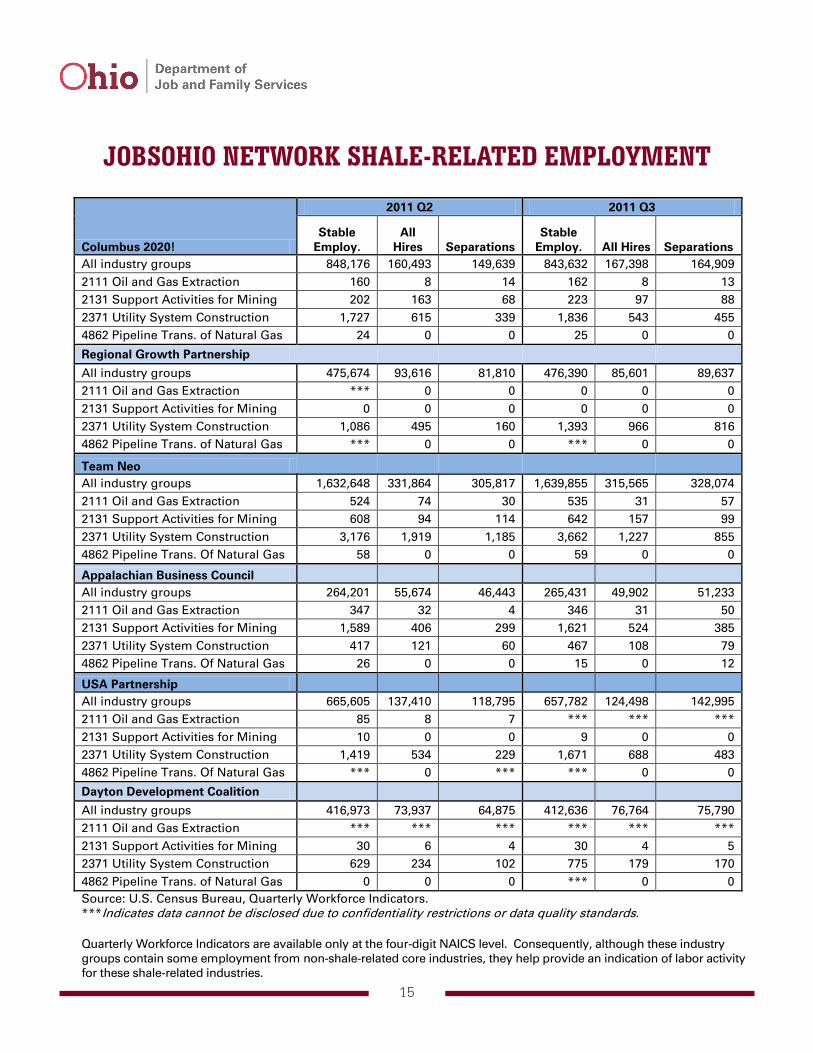
JOBSOHIO NETWORK SHALE-RELATED EMPLOYMENT
Columbus 2020!
2011 Q2 2011 Q3
Stable Employ.
All Hires Separations
Stable Employ. All Hires Separations
All industry groups 848,176 160,493 149,639 843,632 167,398 164,909 2111 Oil and Gas Extraction 160 8 14 162 8 13 2131 Support Activities for Mining 202 163 68 223 97 88 2371 Utility System Construction 1,727 615 339 1,836 543 455 4862 Pipeline Trans. of Natural Gas 24 0 0 25 0 0
Regional Growth Partnership
All industry groups 475,674 93,616 81,810 476,390 85,601 89,637 2111 Oil and Gas Extraction *** 0 0 0 0 0 2131 Support Activities for Mining 0 0 0 0 0 0 2371 Utility System Construction 1,086 495 160 1,393 966 816 4862 Pipeline Trans. of Natural Gas *** 0 0 *** 0 0
Team Neo All industry groups 1,632,648 331,864 305,817 1,639,855 315,565 328,074
2111 Oil and Gas Extraction 524 74 30 535 31 57 2131 Support Activities for Mining 608 94 114 642 157 99 2371 Utility System Construction 3,176 1,919 1,185 3,662 1,227 855 4862 Pipeline Trans. Of Natural Gas 58 0 0 59 0 0
Appalachian Business Council All industry groups 264,201 55,674 46,443 265,431 49,902 51,233
2111 Oil and Gas Extraction 347 32 4 346 31 50 2131 Support Activities for Mining 1,589 406 299 1,621 524 385 2371 Utility System Construction 417 121 60 467 108 79 4862 Pipeline Trans. Of Natural Gas 26 0 0 15 0 12
USA Partnership All industry groups 665,605 137,410 118,795 657,782 124,498 142,995
2111 Oil and Gas Extraction 85 8 7 *** *** *** 2131 Support Activities for Mining 10 0 0 9 0 0 2371 Utility System Construction 1,419 534 229 1,671 688 483 4862 Pipeline Trans. Of Natural Gas *** 0 *** *** 0 0
Dayton Development Coalition All industry groups 416,973 73,937 64,875 412,636 76,764 75,790
2111 Oil and Gas Extraction *** *** *** *** *** *** 2131 Support Activities for Mining 30 6 4 30 4 5 2371 Utility System Construction 629 234 102 775 179 170 4862 Pipeline Trans. of Natural Gas 0 0 0 *** 0 0 Source: U.S. Census Bureau, Quarterly Workforce Indicators. ***Indicates data cannot be disclosed due to confidentiality restrictions or data quality standards. Quarterly Workforce Indicators are available only at the four-digit NAICS level. Consequently, although these industry groups contain some employment from non-shale-related core industries, they help provide an indication of labor activity for these shale-related industries.
16
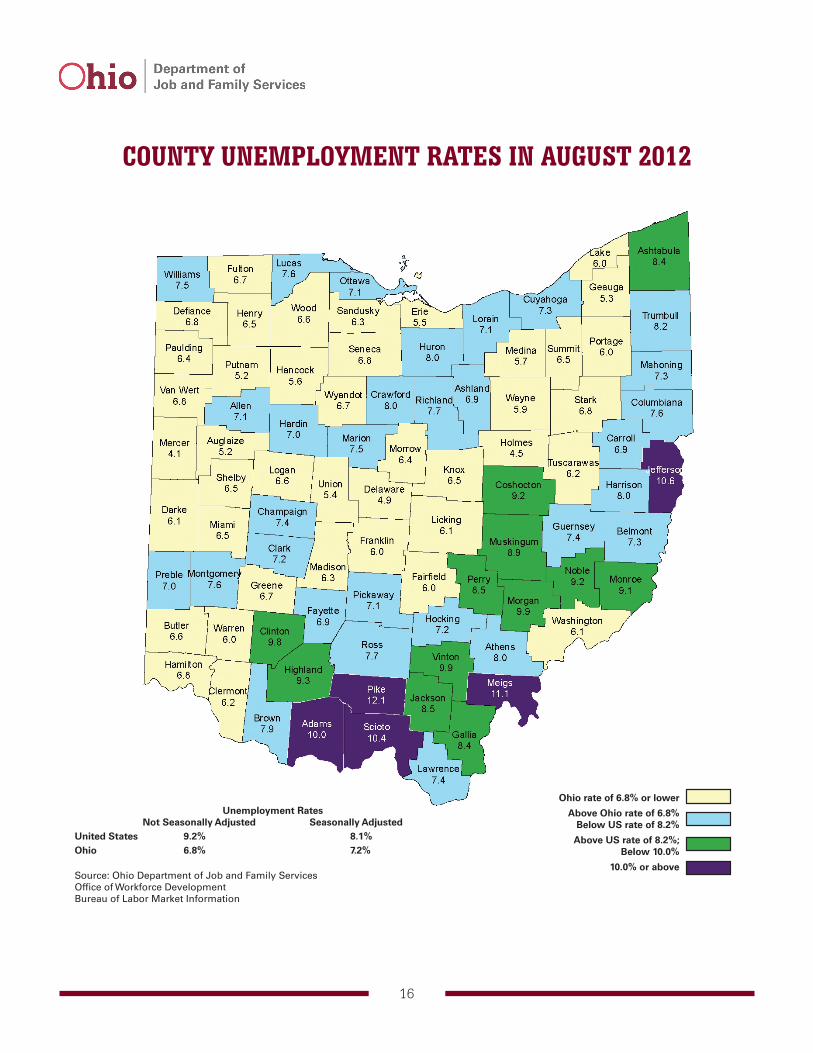
COUNTY UNEMPLOYMENT RATES IN AUGUST 2012
Ohio rate of 6.8% or lower
Above Ohio rate of 6.8%Below US rate of 8.2%
Above US rate of 8.2%;Below 10.0%
10.0% or above
Unemployment Rates Not Seasonally Adjusted Seasonally AdjustedUnited States 9.2% 8.1%Ohio 6.8% 7.2%
Source: Ohio Department of Job and Family ServicesOffice of Workforce DevelopmentBureau of Labor Market Information
17
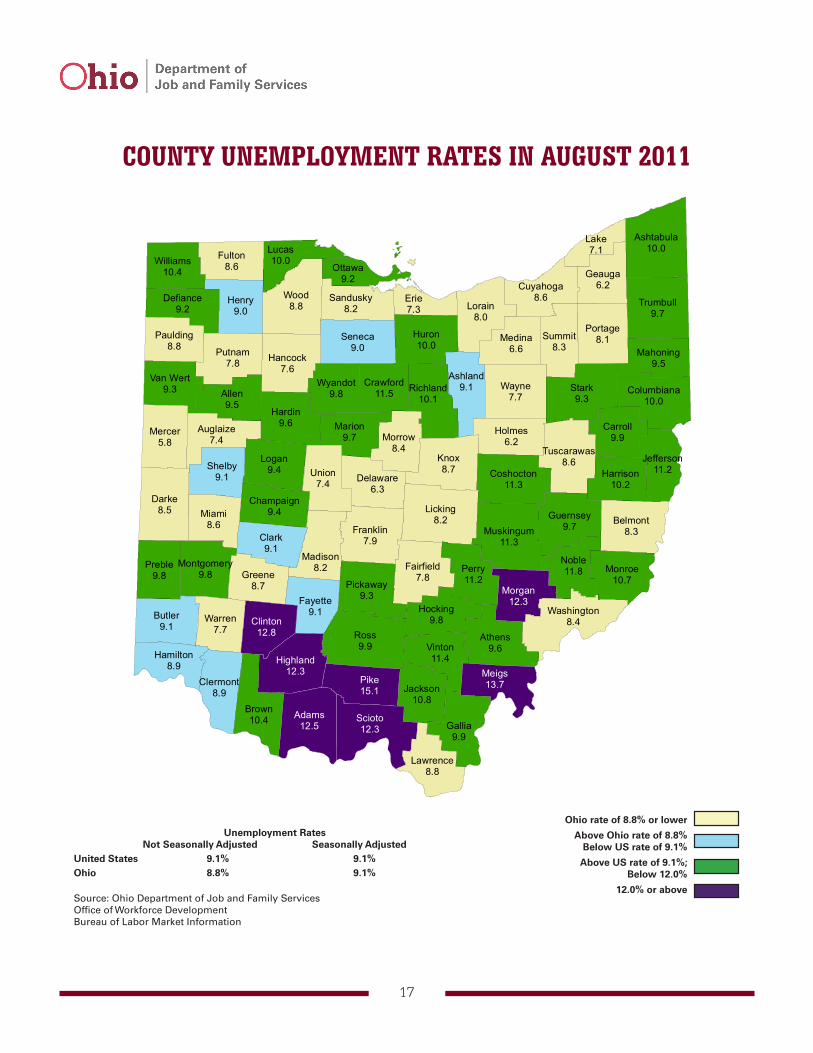
COUNTY UNEMPLOYMENT RATES IN AUGUST 2011
Wood8.8
Knox8.7
Darke8.5 Licking
8.2
Wayne7.7
Lorain8.0
Union7.4
Miami8.6 Franklin
7.9
Mercer5.8
Belmont8.3
Fulton8.6
Portage8.1
Fairfield7.8
Erie7.3
Putnam7.8 Hancock
7.6
Medina6.6
Warren7.7
Holmes6.2
Greene8.7
Summit8.3
Madison8.2
Morrow8.4
Washington8.4
Geauga6.2
Delaware6.3
Paulding8.8
Auglaize7.4
Sandusky8.2
Lake7.1
Tuscarawas8.6
Lawrence8.8
Cuyahoga8.6
Butler9.1
Clark9.1
Seneca9.0
Henry9.0
Shelby9.1
Fayette9.1
Ashland9.1
Hamilton8.9
Clermont8.9
Ross9.9
Stark9.3
Gallia9.9
Allen9.5
Huron10.0
Brown10.4
Perry11.2
Logan9.4
Trumbull9.7
Athens9.6
Hardin9.6
Ashtabula10.0
Noble11.8
Preble9.8
Vinton11.4
Carroll9.9
Monroe10.7
Marion9.7
Muskingum11.3
Lucas10.0
Richland10.1
Guernsey9.7
Pickaway9.3
Coshocton11.3
Hocking9.8
Jackson10.8
Williams10.4
Harrison10.2
Defiance9.2
Wyandot9.8
Van Wert9.3 Columbiana
10.0
Crawford11.5
Mahoning9.5
Champaign9.4
Ottawa9.2
Jefferson11.2
Montgomery9.8
Pike15.1
Scioto12.3
Adams12.5
Meigs13.7
Highland12.3
Clinton12.8
Morgan12.3
Ohio rate of 8.8% or lower
Above Ohio rate of 8.8%Below US rate of 9.1%
Above US rate of 9.1%;Below 12.0%
12.0% or above
Unemployment Rates Not Seasonally Adjusted Seasonally AdjustedUnited States 9.1% 9.1%Ohio 8.8% 9.1%
Source: Ohio Department of Job and Family ServicesOffice of Workforce DevelopmentBureau of Labor Market Information
18
DEFINITIONS OHIO LABOR FORCE STATISTICS*
Source: Ohio Department of Job and Family Services’ Bureau of Labor Market Information, Local Area Unemployment Statistics (LAUS)
The labor force and unemployment data are based on the same concepts and definitions as those used for the official national estimates obtained from the Current Population Survey (CPS). The LAUS program measures employment and unemployment on a place-of-residence basis and produces estimates using equations based on regression techniques. This method uses data from several sources, including the CPS, the Current Employment Statistics (CES) program, and state unemployment insurance programs. The LAUS program does not produce estimates for any demographic groups.
Employment − A count of all persons who, during the week that includes the 12th day of the month, (a) did any work as paid employees, worked in their own businesses or professions or on their own farm, or worked 15 hours or more as unpaid workers in enterprises operated by members of their families, or (b) were not working but who had jobs from which they were temporarily absent. Each employed person is counted only once, even if the person holds more than one job. Included are the self-employed, unpaid family workers, agricultural workers and private household workers, who are excluded by the CES survey.
Labor Force − The population of people either working or looking for work, or classified as employed or unemployed.
Unemployment − A count of all persons aged 16 years and older who had no employment during the reference week (the week containing the 12th day of the month), who were available for work (except for temporary illness), and who had made specific efforts to find employment sometime during the four-week
period ending with the reference week. This includes those waiting to be recalled to jobs from which they had been laid off.
Unemployment Rate − The number of unemployed workers as a percent of the labor force.
JOBS*
Source: Ohio Department of Job and Family Services’ Bureau of Labor Market Information, Current Employment Statistics
Each month the CES program surveys about 140,000 national businesses and government agencies to provide detailed industry data on employment, hours and earnings of workers on non-farm payrolls. This is a collaborative effort between the Bureau of Labor Statistics (BLS) and the states. CES produces a count of jobs, not of people.
Nonfarm Jobs − The total number of persons on established payrolls employed full- or part-time who received pay for any part of the pay period that includes the 12th day of the month. Temporary and intermittent employees are included, as are any employees who are on paid sick leave, on paid holiday, or who worked during only part of the specified pay period. A striking employee who works only a small portion of the survey period, and is paid, is included as employed. Those on payrolls of more than one establishment are counted in each establishment. Data exclude proprietors, self-employed workers, unpaid family or volunteer workers, farm workers, and domestic workers. Those on layoff, strike or leave without pay for the entire pay period, or who have not yet reported for work are not counted as employed. Government employment covers only civilian employees.
*THESE DATA ARE SEASONALLY ADJUSTED. Seasonal adjustment removes changes in employment due to normal seasonal hiring or layoffs (such as holidays, weather, etc.).
19
DEFINITIONS QUARTERLY WORKFORCE INDICATORS
Source: U.S. Census Bureau
The Quarterly Workforce Indicators are data that can be examined by region, industry, gender and age of workers. These indicators are built upon wage records in the unemployment insurance system and information from state Quarterly Census of Employment and Wages (QCEW) data.
QUARTERLY CENSUS OF EMPLOYMENT AND WAGES
Source: Ohio Department of Job and Family Services’ Bureau of Labor Market Information, Quarterly Census of Employment and Wages
Business Establishment − An establishment is the location of a certain economic activity, such as a factory, store, office or mine, which produces goods or services. It is typically at a single physical location and engaged in one, or predominantly one, type of economic activity. An employer may have one or more establishments.
Employment − Employment data include all employment covered under federal and Ohio unemployment insurance laws for each of the three months in a quarter. The employment count represents the number of full- and part-time employees who worked during or received pay for the payroll period including the 12th day of the month. The employment totals for each month are averaged for the quarter employment count. Those on paid vacations or paid sick leave are included. Workers temporarily earning no wages due to labor-management disputes, layoffs or other reasons are not reported as employed. Those on the payroll of more than one employer during the same reference week are reported more than once.
Wages − Wages include total compensation paid during a calendar quarter, including
bonuses. Average wages are calculated by dividing total wages for a quarter by average employment in that quarter.
Source: Ohio Department of Job and Family Services’ Bureau of Labor Market Information
A staffing pattern is a list of the occupations most commonly found within a particular industry. This information comes from the biennial Long-Term Occupational Employment Projections data.
Annual Median Wage − The annual median wage earned by workers in an occupation, assuming 40 hours of work per week, 52 weeks a year. Wage data is derived from the annual Occupational Employment Statistics survey.
Educational Attainment − BLS identifies 11 categories of educational attainment, for use in career planning. These categories describe the most significant postsecondary education or training pathways to employment for workers in a given occupation.
Educational Attainment Levels
• Associate’s degree – Degree completed after two years of full-time schooling beyond high school
• Bachelor’s degree – Degree completed after four years of full-time schooling beyond high school
• Degree plus experience – A four-year bachelor’s degree plus work experience
• Long-term training – Knowledge and skills developed through years of On-the-Job-Training (OJT) or formal classroom instruction
• Master’s, doctoral or professional degree – Degree earned at the college or university level beyond a four-year bachelor’s degree.
20
DEFINITIONS • Postsecondary award – Certificate earned
after training through a vocational training program
• Related work experience – Training gained through hands-on work in a similar occupation
• Short-term or moderate-term OJT – Basic tasks and skills learned through a period of OJT lasting up to one year
HELP WANTED ONLINE ADS
Source: The Conference Board Help Wanted OnLine™ Data Set
The Conference Board HWOL data set provides real-time insight into the employment marketplace through the world’s largest database of online job ads. Jobs ads can be classified by industry, occupation, employer and geographic area. Data are analyzed for employment trends and to forecast economic conditions. The underlying data for The Conference Board HWOL are provided by Wanted Technologies Corporation.
NORTH AMERICAN INDUSTRY CLASSIFICATION SYSTEM (NAICS) CHANGES
NAICS, established in 1997, is reviewed for potential revisions every five years. The latest revision, in 2012, was implemented by BLS in the QCEW program with the release of first quarter 2011 data. As part of this revision, the NAICS code of only one Marcellus and Utica shale-related industry was impacted: NAICS 331111 (Iron & Steel Mills). The NAICS 2012 structure eliminated NAICS 331111, combining it with NAICS 331112 (Electrometallurgical ferroalloy product manufacturing) to form NAICS 331110 (Iron & Steel Mills and Ferroalloy Manufacturing).
Core Marcellus and Utica Shale-Related Industries (NAICS):
Crude Petroleum & Natural Gas Extraction (211111); Natural Gas Liquid Extraction (211112); Drilling Oil & Gas Wells (213111); Support Activities for Oil & Gas Operations (213112); Oil & Gas
Pipeline & Related Structures Construction (237120); and Pipeline Transportation of Natural Gas (486210).
Ancillary Marcellus and Utica Shale-Related Industries (NAICS):
Fossil Fuel Electric Power Generation (221112); Natural Gas Distribution (221210); Water Supply & Irrigation Systems (221310); Sewage Treatment Facilities (221320); Water & Sewer Line & Related Structures Construction (237110); Highway, Street, and Bridge Construction (237310); Nonresidential Site Preparation Contractors (238912); Petrochemical Manufacturing (325110); Industrial Gas Manufacturing (325120); Iron & Steel Mills & Ferroalloy Manufacturing (3311101); Iron & Steel Pipe & Tube Manufacturing from Purchased Steel (331210); Mining Machinery & Equipment Manufacturing (333131); Oil & Gas Field Machinery & Equipment Manufacturing (333132); Construction and Mining (except Oil Well) Machinery and Equipment Merchant Wholesalers (423810); Industrial Machinery and Equipment Merchant Wholesalers (423830); Industrial Supplies Merchant Wholesalers (423 840); General Freight Trucking, Local (4841 10); Specialized Freight Trucking, Local (484220); Specialized Freight Trucking, Long-Distance (484230); Lessors of Other Real Property (531190); Construction, Mining & Forestry Machinery & Equipment Rental & Leasing (532412); Engineering Services (541330); Geophysical Surveying & Mapping Services (541360); Testing Laboratories (541380); Environmental Consulting Services (541620); Remediation Services (562910); Commercial & Industrial Machinery & Equipment Repair & Maintenance (811310); Administration of Air and Water Resource and Solid Waste Management Programs (9241 10); Administration of Conservation Programs (924 120); and Regulation and Administration of Communications, Electric, Gas, and Other Utilities (926130).
John R. Kasich,Governor, State of Ohio
Michael B. Colbert,Director, Ohio Department of Job and Family Services
January 2013
An Equal Opportunity Employer and Service Provider