QUARTERLY PERFORMANCE REPORTS: 2014/15 - 2nd Quarter EASTERN CAPE Sector: Health Programme / Subprogramme / Performance Measures Target for 2014/15 as per Annual Performance Plan (APP) 1st Quarter Planned output as per APP 1st Quarter Actual output - validated 2nd Quarter Planned output as per APP 2nd Quarter Preliminary output QUARTERLY OUTPUTS Programme 1: Administration Proportion of health facilities connected to the internet - - 0% - 0% Programme 2: District Health Services PHC Utilisation rate 2.8 2.8 2.6 2.8 2.8 OHH registration visit coverage 54.0% 12.0% 145.3% 15.0% 8.8% PHC supervisor visit rate (fixed clinic/CHC/CDC) 91.0% 91.0% 76.5% 91.0% 78.1% Complaint resolution within 25 working days rate 80.0% 80.0% 96.2% 80.0% 95.9% Number of fully fledged District Clinical specialist Teams appointed 3 - - - - Number of fully-fledged Ward Based Outreach Teams appointed 12 3 15 3 7 School ISHP coverage 10.7% 10.7% 36.5% 10.7% 37.8% School Grade 1 screening coverage 22.4% 6.4% 18.0% 10.0% 18.9% School Grade 4 screening coverage 18.1% 6.0% 16.7% 7.1% 28.3% School Grade 8 screening coverage 14.8% 4.0% 7.3% 5.8% 14.4% Percentage of fixed facilities that have conducted gap assessments for compliance against the National 49.0% - 0% - 0% Compliance Rate of PHC Facilities (of National Core Standards) 40.0% 40.0% 0% 40.0% 0% District Hospitals Average Length of Stay 4.9 days 4.9 days 5.2 days 4.9 days 5.2 days Inpatient Bed Utilisation Rate 65.0% 65.0% 57.8% 65.0% 60.9% Expenditure per patient day equivalent (PDE) R 1 380 R 1 380 R 1 943 R 1 380 R 2 008 Complaint Resolution within 25 working days rate 90.0% 90.0% 97.3% 90.0% 102.1% Mental health admission rate - - 0% - 0% Percentage of Hospitals that have conducted gap assessments for compliance against the National 68.2% - 0% - 0% Proportion of hospitals assessed as compliant with the Extreme Measures of National Core Standards 80.0% 80.0% 0% 80.0% 38.5% HIV and AIDS, TB and STI control Total clients remaining on ART (TROA) at end of the month 387 387 18 750 18 187 18 750 12 542 Number of Medical Male Circumcisions conducted 42 000 16 000 379 2 000 237 TB (new pulmonary) defaulter rate 7.0% 7.0% 7.6% 7.0% 8.2% TB AFB sputum result turn-around time under 48 hours rate 73.0% 73.0% 57.5% 73.0% 56.6% TB new client treatment success rate 80.0% 80.0% 77.9% 80.0% 79.4% HIV testing coverage (15-49 Years - Annualised) 49.0% 45.0% 31.2% 47.0% 33.5% TB (new pulmonary) cure rate 75.0% - 0% - 0% TB MDR confirmed treatment initiation rate 100.0% 100.0% 100.0% 100.0% 100.0% Maternal, child and women health Immunisation coverage under 1 year 90.0% 90.0% 76.8% 90.0% 78.4% Vitamin A coverage 12-59 months 55.0% 55.0% 46.1% 55.0% 54.3% Deworming 12-59 months coverage 50.0% 50.0% 40.1% 50.0% 43.6% Child under 2 years underweight for age incidence 0.20 0.20 31.61 0.20 20.13 Measles 1st dose under 1 year coverage 95.0% 95.0% 84.4% 95.0% 85.4% Pneumococcal Vaccine (PCV) 3rd Dose Coverage 90.0% 90.0% 81.1% 90.0% 79.7% Rotavirus (RV) 2nd Dose Coverage 90.0% 90.0% 79.1% 90.0% 85.9% Cervical cancer screening coverage 42.0% 42.0% 46.1% 42.0% 61.3% HPV Vaccine Coverage amongst Grade 4 girls 80.0% 80.0% 82.2% 80.0% 92.7% Antenatal 1st visits before 20 weeks rate 42.0% 42.0% 43.7% 42.0% 48.4% Infant given NVP within 72 hours after birth uptake rate 100.0% 100.0% 101.8% 100.0% 99.8% Infant 1st PCR Test positive around 6 weeks rate 2.8% 2.8% 1.8% 2.8% 1.8% Couple year protection rate 60.0% - 0% - 0% Disease Prevention and Control Hypertension incidence 0.04 0.04 24.50 0.04 20.07 Diabetes incidence 0.00 0.00 7.94 0.00 6.46 Cataract surgery rate (Uninsured Population) 1 050.0 262.5 1 094.6 262.5 1 015.9 Programme 3: Emergency Medical Services EMS operational ambulance coverage 0.50 0.29 0.73 0.48 0.32 EMS P1 urban response under 15 minutes rate 65.0% 65.0% 38.2% 65.0% 41.3% EMS P1 rural response under 40 minutes rate 65.0% 65.0% 44.0% 65.0% 51.3% EMS P1 call response under 60 minutes rate 70.0% 70.0% 65.4% 70.0% 64.6% Programme 4: Provincial Hospital Services General (regional) hospitals Average Length of Stay 4.6 days 4.6 days 5.3 days 4.6 days 4.9 days Inpatient Bed Utilisation Rate 75.0% 75.0% 67.6% 75.0% 69.5% Expenditure per patient day equivalent (PDE) R 2 077 R 2 077 R 2 058 R 2 077 R 2 280 Complaint Resolution within 25 working days rate 80.0% 80.0% 100.0% 80.0% 100.0% Mental health admission rate - - 0% - 0% Percentage of Hospitals that have conducted gap assessments for compliance against the National 100.0% - 0% - 0% Proportion of hospitals assessed as compliant with the Extreme Measures of National Core Standards 80.0% 80.0% 0% 80.0% 0%
Programme / Subprogramme / Performance Measures Target for
2014/15 as per
Annual
Performance
Plan (APP)
1st Quarter
Planned output
as per APP
1st Quarter
Actual output -
validated
2nd Quarter
Planned output
as per APP
2nd Quarter
Preliminary
output
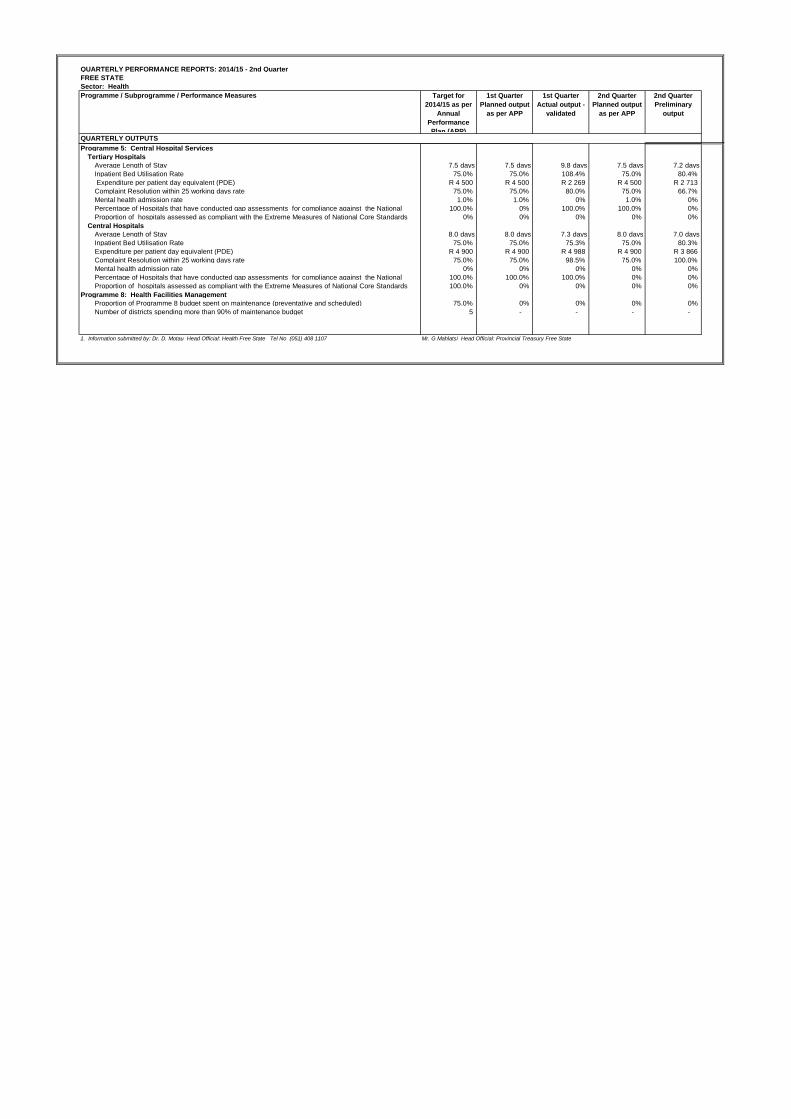
QUARTERLY OUTPUTS
Programme 5: Central Hospital Services
Tertiary Hospitals
Average Length of Stay 5.5 days 5.5 days 6.1 days 5.5 days 5.7 days
Inpatient Bed Utilisation Rate 75.0% 75.0% 74.1% 75.0% 76.9%
Expenditure per patient day equivalent (PDE) R 1 923 R 1 900 R 2 644 R 1 900 R 3 157
Complaint Resolution within 25 working days rate 80.0% 80.0% 100.0% 80.0% 100.0%
Mental health admission rate - - 0% - 0%
Percentage of Hospitals that have conducted gap assessments for compliance against the National 100.0% - 0% - 0%
Proportion of hospitals assessed as compliant with the Extreme Measures of National Core Standards 80.0% 100.0% 0% 100.0% 0%
Central Hospitals
Average Length of Stay 5.5 days 5.5 days 7.2 days 5.5 days 7.0 days
Inpatient Bed Utilisation Rate 75.0% 75.0% 91.9% 75.0% 94.1%
Expenditure per patient day equivalent (PDE) R 1 950 R 1 900 R 0 R 1 900 R 0
Complaint Resolution within 25 working days rate 80.0% 80.0% 100.0% 80.0% 100.0%
Mental health admission rate - - 0% - 0%
Percentage of Hospitals that have conducted gap assessments for compliance against the National 100.0% - 0% - 0%
Proportion of hospitals assessed as compliant with the Extreme Measures of National Core Standards 80.0% 80.0% 0% 80.0% 0%
Programme 8: Health Facilities Management
Proportion of Programme 8 budget spent on maintenance (preventative and scheduled) 29.0% 7.3% 14.9% 7.3% 23.6%
Number of districts spending more than 90% of maintenance budget 8 8 8 8 8
1. Information submitted by: Ms. T. Mbengashe Head Official: Health Eastern Cape Tel No (040) 608 1111 Ms. M.T.N. Mbina-Mthembu Head Official: Provincial Treasury Eastern Cape
Programme / Subprogramme / Performance Measures Target for
2014/15 as per
Annual
Performance
Plan (APP)
1st Quarter
Planned output
as per APP
1st Quarter
Actual output -
validated
2nd Quarter
Planned output
as per APP
2nd Quarter
Preliminary
output
QUARTERLY OUTPUTS
Programme 5: Central Hospital Services
Tertiary Hospitals
Average Length of Stay 7.5 days 7.5 days 9.8 days 7.5 days 7.2 days
Inpatient Bed Utilisation Rate 75.0% 75.0% 108.4% 75.0% 80.4%
Expenditure per patient day equivalent (PDE) R 4 500 R 4 500 R 2 269 R 4 500 R 2 713
Complaint Resolution within 25 working days rate 75.0% 75.0% 80.0% 75.0% 66.7%
Mental health admission rate 1.0% 1.0% 0% 1.0% 0%
Percentage of Hospitals that have conducted gap assessments for compliance against the National 100.0% 0% 100.0% 100.0% 0%
Proportion of hospitals assessed as compliant with the Extreme Measures of National Core Standards 0% 0% 0% 0% 0%
Central Hospitals
Average Length of Stay 8.0 days 8.0 days 7.3 days 8.0 days 7.0 days
Inpatient Bed Utilisation Rate 75.0% 75.0% 75.3% 75.0% 80.3%
Expenditure per patient day equivalent (PDE) R 4 900 R 4 900 R 4 988 R 4 900 R 3 866
Complaint Resolution within 25 working days rate 75.0% 75.0% 98.5% 75.0% 100.0%
Mental health admission rate 0% 0% 0% 0% 0%
Percentage of Hospitals that have conducted gap assessments for compliance against the National 100.0% 100.0% 100.0% 0% 0%
Proportion of hospitals assessed as compliant with the Extreme Measures of National Core Standards 100.0% 0% 0% 0% 0%
Programme 8: Health Facilities Management
Proportion of Programme 8 budget spent on maintenance (preventative and scheduled) 75.0% 0% 0% 0% 0%
Number of districts spending more than 90% of maintenance budget 5 - - - -
1. Information submitted by: Dr. D. Motau Head Official: Health Free State Tel No (051) 408 1107 Mr. G Mahlatsi Head Official: Provincial Treasury Free State
Programme / Subprogramme / Performance Measures Target for
2014/15 as per
Annual
Performance
Plan (APP)
1st Quarter
Planned output
as per APP
1st Quarter
Actual output -
validated
2nd Quarter
Planned output
as per APP
2nd Quarter
Preliminary
output
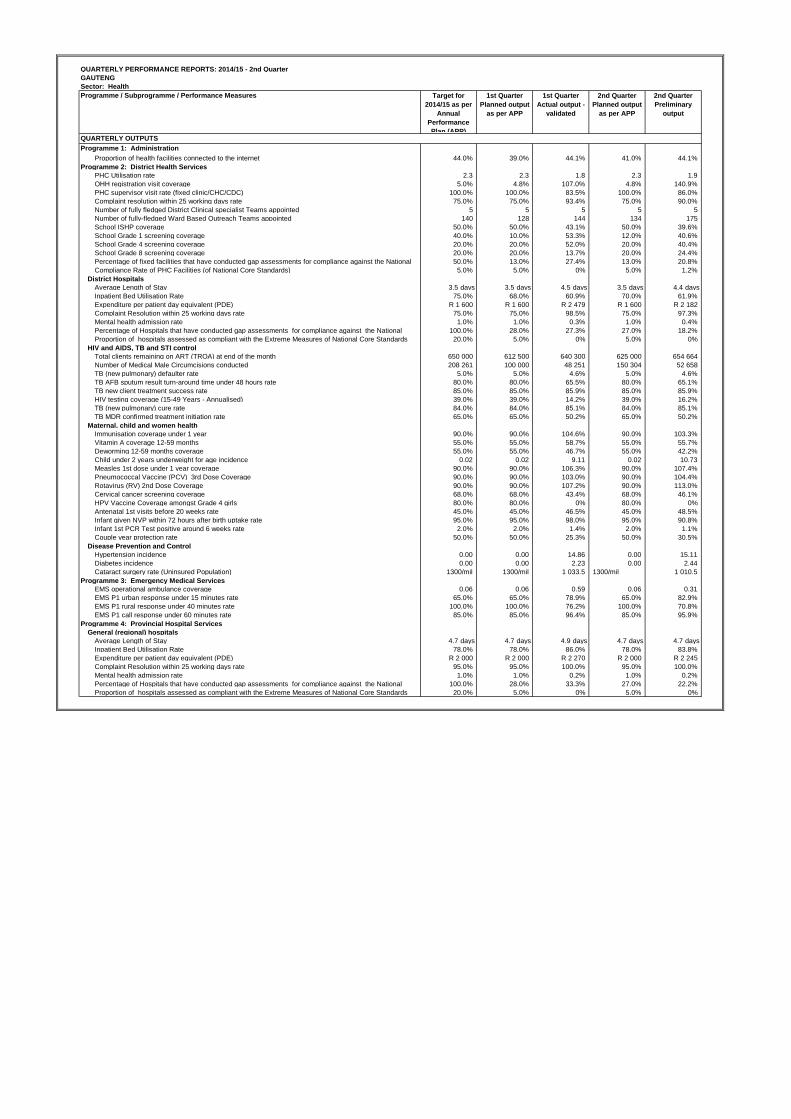
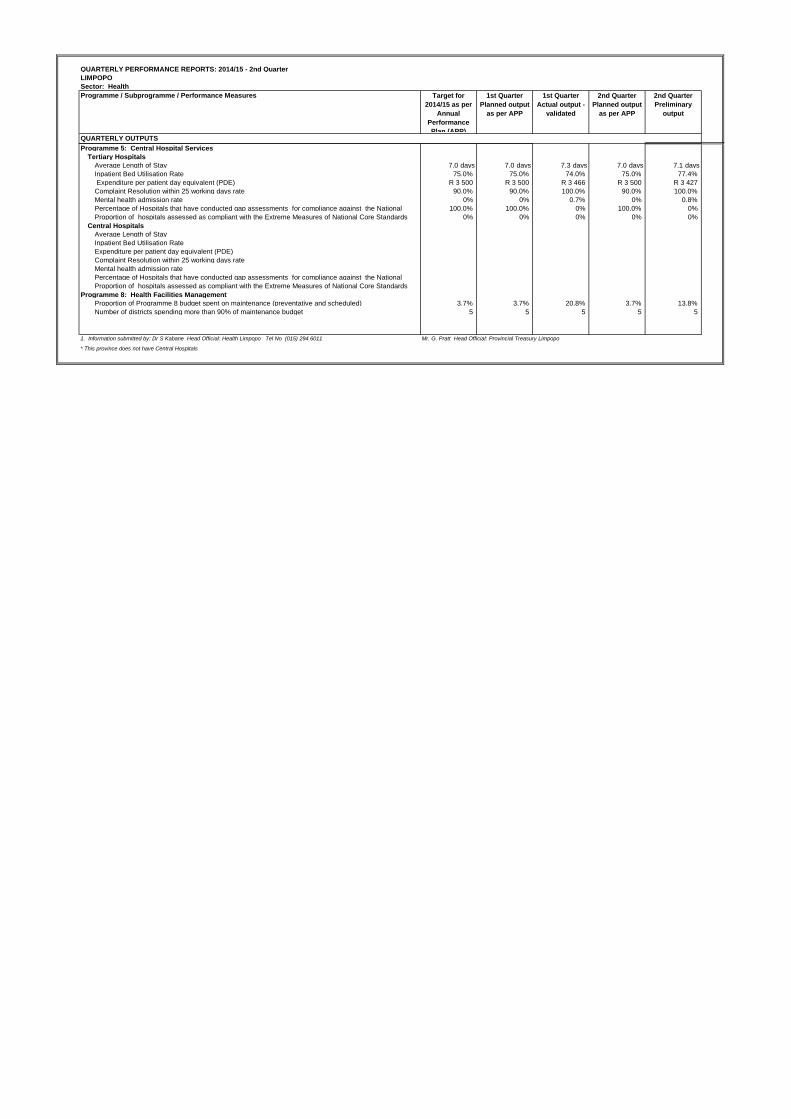
QUARTERLY OUTPUTS
Programme 5: Central Hospital Services
Tertiary Hospitals
Average Length of Stay 5.5 days 5.5 days 6.0 days 5.5 days 6.0 days
Inpatient Bed Utilisation Rate 78.0% 78.0% 83.2% 78.0% 86.0%
Expenditure per patient day equivalent (PDE) R 2 500 R 2 500 R 2 560 R 2 500 R 2 295
Complaint Resolution within 25 working days rate 80.0% 80.0% 76.6% 80.0% 100.0%
Mental health admission rate 1.0% 1.0% 0.6% 1.0% 0.6%
Percentage of Hospitals that have conducted gap assessments for compliance against the National 100.0% 34.0% 33.3% 33.0% 66.7%
Proportion of hospitals assessed as compliant with the Extreme Measures of National Core Standards 15.0% 0% 0% 5.0% 0%
Central Hospitals
Average Length of Stay 6.2 days 6.2 days 7.9 days 6.2 days 8.4 days
Inpatient Bed Utilisation Rate 78.0% 78.0% 80.2% 78.0% 86.6%
Expenditure per patient day equivalent (PDE) R 3 275 R 3 275 R 3 971 R 3 275 R 3 304
Complaint Resolution within 25 working days rate 95.0% 95.0% 93.1% 95.0% 96.2%
Mental health admission rate 1.0% 1.0% 0% 1.0% 0%
Percentage of Hospitals that have conducted gap assessments for compliance against the National 100.0% 25.0% 25.0% 25.0% 50.0%
Proportion of hospitals assessed as compliant with the Extreme Measures of National Core Standards 20.0% 5.0% 0% 5.0% 0%
Programme 8: Health Facilities Management
Proportion of Programme 8 budget spent on maintenance (preventative and scheduled) 100.0% 25.0% 9.7% 50.0% 20.9%
Number of districts spending more than 90% of maintenance budget 5 5 - 5 -
1. Information submitted by:Dr T.E. Selabano Acting Head Official: Health Gauteng Tel No (011) 355 3857 Ms. N. Tshabalala Head Official: Provincial Treasury Gauteng
Programme / Subprogramme / Performance Measures Target for
2014/15 as per
Annual
Performance
Plan (APP)
1st Quarter
Planned output
as per APP
1st Quarter
Actual output -
validated
2nd Quarter
Planned output
as per APP
2nd Quarter
Preliminary
output
QUARTERLY OUTPUTS
Programme 5: Central Hospital Services
Tertiary Hospitals
Average Length of Stay 9.3 days 10.0 days 9.9 days 9.7 days 10.1 days
Inpatient Bed Utilisation Rate 75.0% 60.0% 83.4% 65.0% 87.1%
Expenditure per patient day equivalent (PDE) R 4 841 R 4 790 R 3 862 R 4 795 R 4 123
Complaint Resolution within 25 working days rate 90.0% 90.0% 100.0% 90.0% 100.0%
Mental health admission rate 1.6% 1.5% 1.0% 1.5% 1.0%
Percentage of Hospitals that have conducted gap assessments for compliance against the National 100.0% 100.0% 0% 100.0% 0%
Proportion of hospitals assessed as compliant with the Extreme Measures of National Core Standards 50.0% 0% 0% 0% 0%
Central Hospitals
Average Length of Stay 7.8 days 8.4 days 8.3 days 8.1 days 8.4 days
Inpatient Bed Utilisation Rate 71.9% 71.8% 65.5% 71.8% 71.1%
Expenditure per patient day equivalent (PDE) R 3 083 R 3 003 R 12 640 R 3 033 R 11 441
Complaint Resolution within 25 working days rate 85.0% 85.0% 100.0% 85.0% 100.0%
Mental health admission rate 0% 0% 0% 0% 0%
Percentage of Hospitals that have conducted gap assessments for compliance against the National 100.0% 100.0% 0% 100.0% 0%
Proportion of hospitals assessed as compliant with the Extreme Measures of National Core Standards 100.0% 0% 0% 0% 0%
Programme 8: Health Facilities Management
Proportion of Programme 8 budget spent on maintenance (preventative and scheduled) 11.0% 0% 37.1% 0% 14.4%
Number of districts spending more than 90% of maintenance budget 11 - 10 - 11
1. Information submitted by: Dr. Zungu Head Official: Health KwaZulu-Natal Tel No (033) 395 2799 Mr. S. Magagula Head Official: Provincial Treasury KwaZulu-Natal
Programme / Subprogramme / Performance Measures Target for
2014/15 as per
Annual
Performance
Plan (APP)
1st Quarter
Planned output
as per APP
1st Quarter
Actual output -
validated
2nd Quarter
Planned output
as per APP
2nd Quarter
Preliminary
output
QUARTERLY OUTPUTS
Programme 5: Central Hospital Services
Tertiary Hospitals
Average Length of Stay 5.3 days 5.3 days 6.7 days 5.3 days 6.7 days
Inpatient Bed Utilisation Rate 75.0% 75.0% 81.1% 75.0% 85.5%
Expenditure per patient day equivalent (PDE) R 2 867 R 2 367 R 4 963 R 3 367 R 3 687
Complaint Resolution within 25 working days rate 80.0% 90.0% 0% 90.0% 0%
Mental health admission rate 80.0% 0% 0% 0% 0%
Percentage of Hospitals that have conducted gap assessments for compliance against the National 100.0% 100.0% 0% 100.0% 0%
Proportion of hospitals assessed as compliant with the Extreme Measures of National Core Standards 100.0% 100.0% 0% 100.0% 0%
Central Hospitals
Average Length of Stay
Inpatient Bed Utilisation Rate
Expenditure per patient day equivalent (PDE)
Complaint Resolution within 25 working days rate
Mental health admission rate
Percentage of Hospitals that have conducted gap assessments for compliance against the National
Proportion of hospitals assessed as compliant with the Extreme Measures of National Core Standards
Programme 8: Health Facilities Management
Proportion of Programme 8 budget spent on maintenance (preventative and scheduled) 25.0% 25.0% 0% 25.0% 0%
Number of districts spending more than 90% of maintenance budget 3 3 - 3 -
1. Information submitted by: Dr S Mohangi Head Official: Health Mpumalanga Tel No (013) 766 3298 Ms. N.Z. Nkamba Head Official: Provincial Treasury Mpumalanga
Programme / Subprogramme / Performance Measures Target for
2014/15 as per
Annual
Performance
Plan (APP)
1st Quarter
Planned output
as per APP
1st Quarter
Actual output -
validated
2nd Quarter
Planned output
as per APP
2nd Quarter
Preliminary
output
QUARTERLY OUTPUTS
Programme 5: Central Hospital Services
Tertiary Hospitals
Average Length of Stay 5.5 days 5.5 days 6.5 days 5.5 days 6.5 days
Inpatient Bed Utilisation Rate 74.0% 74.0% 70.9% 74.0% 75.2%
Expenditure per patient day equivalent (PDE) R 3 663 R 3 663 R 4 051 R 3 663 R 3 567
Complaint Resolution within 25 working days rate 60.0% 60.0% 100.0% 60.0% 60.7%
Mental health admission rate 2.3% 2.3% 0.6% 2.3% 0.0%
Percentage of Hospitals that have conducted gap assessments for compliance against the National 100.0% 100.0% 0% 100.0% 0%
Proportion of hospitals assessed as compliant with the Extreme Measures of National Core Standards 100.0% 100.0% 0% 100.0% 0%
Central Hospitals
Average Length of Stay
Inpatient Bed Utilisation Rate
Expenditure per patient day equivalent (PDE)
Complaint Resolution within 25 working days rate
Mental health admission rate
Percentage of Hospitals that have conducted gap assessments for compliance against the National
Proportion of hospitals assessed as compliant with the Extreme Measures of National Core Standards
Programme 8: Health Facilities Management
Proportion of Programme 8 budget spent on maintenance (preventative and scheduled) 18.0% 2.0% 36.3% 5.0% 111.9%
Number of districts spending more than 90% of maintenance budget 5 1 - 2 -
1. Information submitted by: Ms. G Matlaopane Head Official: Health Northern Cape Tel No (040) 608 1111 Mr.H.V. Gumbo Acting Head Official: Provincial Treasury Northern Cape
Programme / Subprogramme / Performance Measures Target for
2014/15 as per
Annual
Performance
Plan (APP)
1st Quarter
Planned output
as per APP
1st Quarter
Actual output -
validated
2nd Quarter
Planned output
as per APP
2nd Quarter
Preliminary
output
QUARTERLY OUTPUTS
Programme 5: Central Hospital Services
Tertiary Hospitals
Average Length of Stay 5.0 days 5.0 days 6.6 days 5.0 days 4.8 days
Inpatient Bed Utilisation Rate 75.0% 75.0% 38.6% 75.0% 54.2%
Expenditure per patient day equivalent (PDE) R 2 400 R 2 400 R 476 R 2 400 R 805
Complaint Resolution within 25 working days rate 90.0% 90.0% 90.5% 90.0% 96.6%
Mental health admission rate 0% 0% 2.2% 0% 1.3%
Percentage of Hospitals that have conducted gap assessments for compliance against the National 0% 0% 0% 0% 0%
Proportion of hospitals assessed as compliant with the Extreme Measures of National Core Standards 0% 0% 0% 0% 0%
Central Hospitals
Average Length of Stay
Inpatient Bed Utilisation Rate
Expenditure per patient day equivalent (PDE)
Complaint Resolution within 25 working days rate
Mental health admission rate
Percentage of Hospitals that have conducted gap assessments for compliance against the National
Proportion of hospitals assessed as compliant with the Extreme Measures of National Core Standards
Programme 8: Health Facilities Management
Proportion of Programme 8 budget spent on maintenance (preventative and scheduled) 13.0% 0% 7.9% 0% 11.9%
Number of districts spending more than 90% of maintenance budget 4 - 5 - 5
1. Information submitted by: Mr. K. Motlhabane Acting Head Official: Health North West Tel No (018) 388 3843 Mr. N.I. Kunene Acting Head Official: Provincial Treasury North West
Programme / Subprogramme / Performance Measures Target for
2014/15 as per
Annual
Performance
Plan (APP)
1st Quarter
Planned output
as per APP
1st Quarter
Actual output -
validated
2nd Quarter
Planned output
as per APP
2nd Quarter
Preliminary
output
QUARTERLY OUTPUTS
Programme 5: Central Hospital Services
Tertiary Hospitals
Average Length of Stay 3.7 days 3.7 days 3.9 days 3.7 days 3.8 days
Inpatient Bed Utilisation Rate 85.0% 85.0% 86.4% 85.0% 85.7%
Expenditure per patient day equivalent (PDE) R 4 534 R 4 534 R 4 208 R 4 534 R 4 816
Complaint Resolution within 25 working days rate 90.0% 90.6% 67.6% 90.6% 78.9%
Mental health admission rate N/A N/A 0% N/A 0%
Percentage of Hospitals that have conducted gap assessments for compliance against the National 100.0% 0% 0% 0% 0%
Proportion of hospitals assessed as compliant with the Extreme Measures of National Core Standards No target set No target set 0% No target set 0%
Central Hospitals
Average Length of Stay 6.1 days 6.1 days 6.3 days 6.1 days 6.2 days
Inpatient Bed Utilisation Rate 85.6% 85.6% 85.6% 85.6% 89.3%
Expenditure per patient day equivalent (PDE) R 4 236 R 4 236 R 4 274 R 4 236 R 4 097
Complaint Resolution within 25 working days rate 82.5% 82.2% 86.4% 82.2% 90.3%
Mental health admission rate 1.4% 1.4% 1.3% 1.4% 1.3%
Percentage of Hospitals that have conducted gap assessments for compliance against the National 100.0% 0% 0% 0% 0%
Proportion of hospitals assessed as compliant with the Extreme Measures of National Core Standards No target set No target set 0% 0% 0%
Programme 8: Health Facilities Management
Proportion of Programme 8 budget spent on maintenance (preventative and scheduled) 100.0% 100.0% 107.8% 100.0% 71.0%
Number of districts spending more than 90% of maintenance budget No target set No target set - No target set -
1. Information submitted by: Prof. K. Househam Head Official: Health Western Cape Tel No (021) 483 3647 Dr. J.C. Stregmaan Head Official: Provincial Treasury Western Cape