Final Project Report Environmental Impacts and Biosecurity of Composting for Emergency Disposal of Livestock Mortalities by Dr. T.D. Glanville — Project Leader, Agricultural & Biosystems Engineering, Iowa State University Dr. T.L. Richard — co-PI, Agricultural & Biological Engineering, Pennsylvania State University Dr. J.D. Harmon — co-PI, Agricultural & Biosystems Engineering, Iowa State University Dr. D.L. Reynolds — co-PI, Veterinary Microbiology & Preventive Medicine, Iowa State University Dr. H.K. Ahn — Associate Scientist and Project Coordinator, Agricultural & Biosystems Engineering S. Akinc — Project Virology Studies Coordinator, Veterinary Microbiology March 1, 2006 Submitted in accordance with IDNR Contract # 03-7141-08
Transcript
Final Project Report
Environmental Impacts and Biosecurity of Composting for
Emergency Disposal of Livestock Mortalities
by
Dr. T.D. Glanville — Project Leader, Agricultural & Biosystems Engineering, Iowa State University Dr. T.L. Richard — co-PI, Agricultural & Biological Engineering, Pennsylvania State University
Dr. J.D. Harmon — co-PI, Agricultural & Biosystems Engineering, Iowa State University Dr. D.L. Reynolds — co-PI, Veterinary Microbiology & Preventive Medicine, Iowa State University Dr. H.K. Ahn — Associate Scientist and Project Coordinator, Agricultural & Biosystems Engineering
S. Akinc — Project Virology Studies Coordinator, Veterinary Microbiology
March 1, 2006
Submitted in accordance with IDNR Contract # 03-7141-08
PREFACE
This report presents key results of a three-year study sponsored primarily by the Iowa Department of
Natural Resources. Biosecurity studies included in this project were partially funded through a USDA-
National Research Initiative grant.
Primary objectives of the study were to evaluate the effectiveness, environmental impacts, and
biosecurity of using composting for emergency disposal of cattle mortalities, and to recommend materials
and composting practices that could be used in the event of a livestock or poultry disease outbreak or agro-
terrorism in Iowa.
To meet the information needs of a variety of potentially interested readers, the report is organized in
four main sections.
• The executive summary summarizes the purpose and key results for general interest readers. • The main body of the report describes study objectives, methods, and findings in detail for scientists,
engineers, regulatory officials, and others who may be interested in incorporating aspects of this study into new environmental policies, or in conducting similar research.
• The recommended practices section is written for producers, veterinarians, and others in the livestock industry who may be involved in implementing an emergency disposal operation.
• For readers interested in composting theory or in additional details regarding methods used in this research, Appendix H lists project-related conference papers presented at various professional meetings. Readers are cautioned that project results reported in these papers were based on preliminary data available at the time they were written, and these results may not reflect the final data interpretations presented in this report.
The project website, which is located at http://www.abe.iastate.edu/cattlecomposting/ also provides detailed
information and many photographs documenting project methods and results.
................................................................................................................................................. 4 TABLE OF CONTENTS
.......................................................................................................................................................... 6 LIST OF FIGURES
............................................................................................................................................................ 7 LIST OF TABLES
STUDY DESIGN & PROCEDURES............................................................................................................................ 19 ................................................................................................................................................ 19 EXPERIMENTAL DESIGN
..................................................................................................................................... 20 COMPOST SYSTEM OPERATION............................................................................................................................. 21 FIELD PERFORMANCE MONITORING
........................................................................................................................21 Process Performance
..........................................................................................................................24 Air Quality Impacts
..........................................................................................................25 Soil & Water Quality Impacts
...................................................................................................................27 Biosecurity Assessment............................................................. 28 LABORATORY TESTING AND RANKING OF ALTERNATIVE COVER MATERIALS
...............................................................................................28 Materials Tested & Tests Performed
.........................................................................................................................29 Ranking Procedures..................................... 29 MODELING TO EVALUATE & RECOMMEND DESIGN HEIGHTS FOR COMPOSTING OPERATIONS
....................................................................................................................... 30 RESULTS AND INTERPRETATIONS
............................................................................................................................................... 30 PROCESS PERFORMANCE......................................................................................................................30 Internal Temperatures
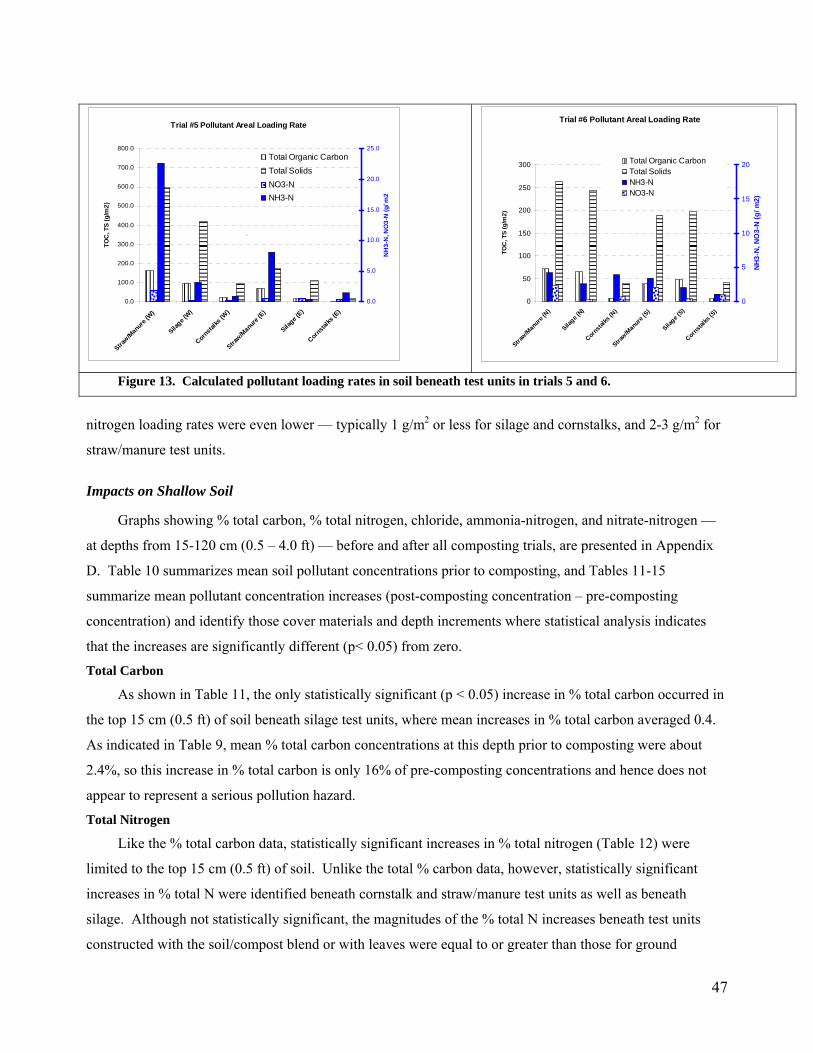
..................................................................................................................47 Impacts on Shallow Soil
4
..................................................................................................................52 Impacts on Crop Growth.......................................................................................................................................... 53 BIOSECURITY ASSESSMENT.............................................................................................................................53 Virus Inactivation
............................................................................................................55 Bio-containment – Serology............................................................. 57 LABORATORY TESTING AND RANKING OF ALTERNATIVE COVER MATERIALS
...........................57 Selection of Key Performance Categories and Recommended Laboratory Tests
.....................................................................57 Cover Material Ranking and Suggested Applications................................................................................... 61 MODELING OF FREE AIR SPACE TO PREDICT MAXIMUM DEPTH
.......................................................................................................... 62 GENERAL COMPOSTING SYSTEM PERFORMANCE........................................................................................................................62 Carcass Degradation
........................................................................................................................62 Internal Temperature
......................................................................................................63 Internal Oxygen Concentrations................................................................................................................................................................ 63 AIR QUALITY.................................................................................................................................................63 Odor
.....................................................................................................63 Hydrogen Sulfide and Ammonia...................................................................................................................... 64 GROUNDWATER POLLUTION POTENTIAL
........................................................................................................64 Leachate Quantity and Quality
..............................................................................................................................66 Bio-Containment..................................................................................... 66 COVER MATERIAL RANKING AND SUGGESTED APPLICATIONS
............................................................................................... 67 COVER MATERIAL DEPTH/FREE AIR SPACE MODELING
................................................................ 68 RECOMMENDED PRACTICES FOR EMERGENCY COMPOSTING
................................................................................................................... 68 COMPOSTING SYSTEM & CONFIGURATION.................................................................................................................. 69 BASE/COVER MATERIALS AND THICKNESS
........................................................................................................... 70 AMOUNT OF BASE/COVER MATERIALS NEEDED............................................................................................................................... 71 SITE CLEANUP AND REMEDIATION
............................................................................................................................................................. 71 WORKS CITED
5
LIST OF FIGURES
Figure 1. Cross section of emergency composting test unit showing material placement and
instrumentation .................................................................................................................................................22 Figure 2. Meter, hand pump, flow-through sample cell, and dedicated gas sampling tubes used to
monitor internal oxygen concentrations. ..........................................................................................................23 ........................24 Figure 3. Temporary excavation of test unit to observe and photograph carcass decay.
Figure 4. Collection of odor samples from surface of composting test units using equilibrium chamber,
vacuum pump, and Tedlar storage bags (left), and determination of threshold odor level in ISU olfactometry
laboratory (right). .............................................................................................................................................25 Figure 5. Gravity flow leachate collection troughs (left) and polyethylene leachate bottles (right) used
to capture leachate samples during trials 5 and 6. ............................................................................................26 Figure 6. Daily average external (air) and internal temperatures for three test units constructed in
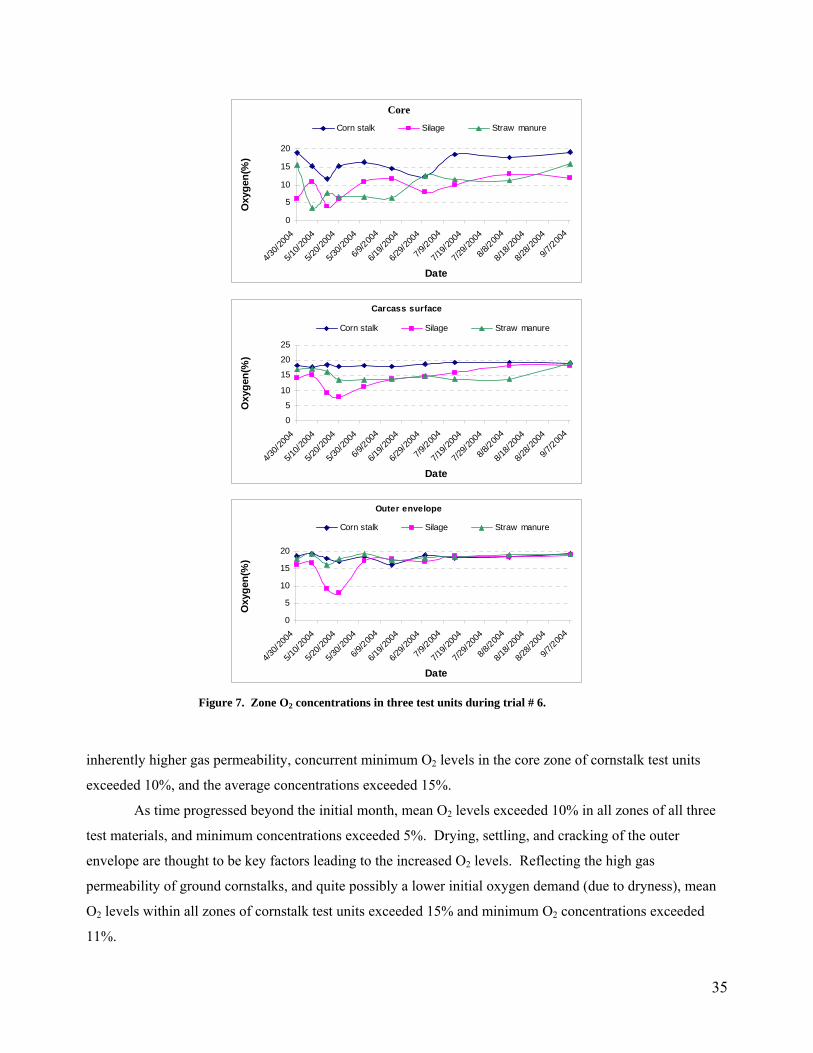
November 2003 (Trial #5)................................................................................................................................31 .....................................................35 Figure 7. Zone O concentrations in three test units during trial # 6.2
Figure 8. Large bones and skulls remaining following cattle carcass composting (top) were free of soft
tissues, use of a Kuhn-Knight manure spreader with hammer-mill type discharge (lower left) significantly
reduced the size of bones in field following compost spreading (lower right).................................................38 Figure 9. Composite weekly means for odor detection threshold along with error bars showing one
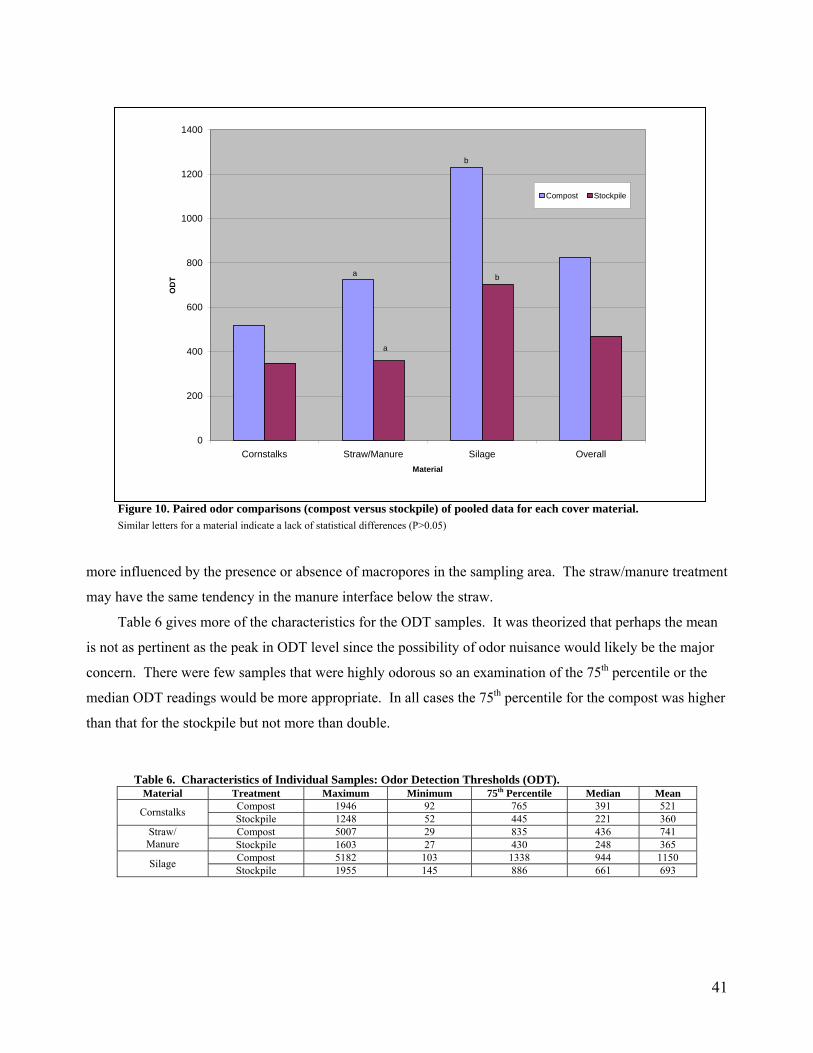
standard deviation.............................................................................................................................................40 Figure 10. Paired odor comparisons (compost versus stockpile) of pooled data for each cover material.
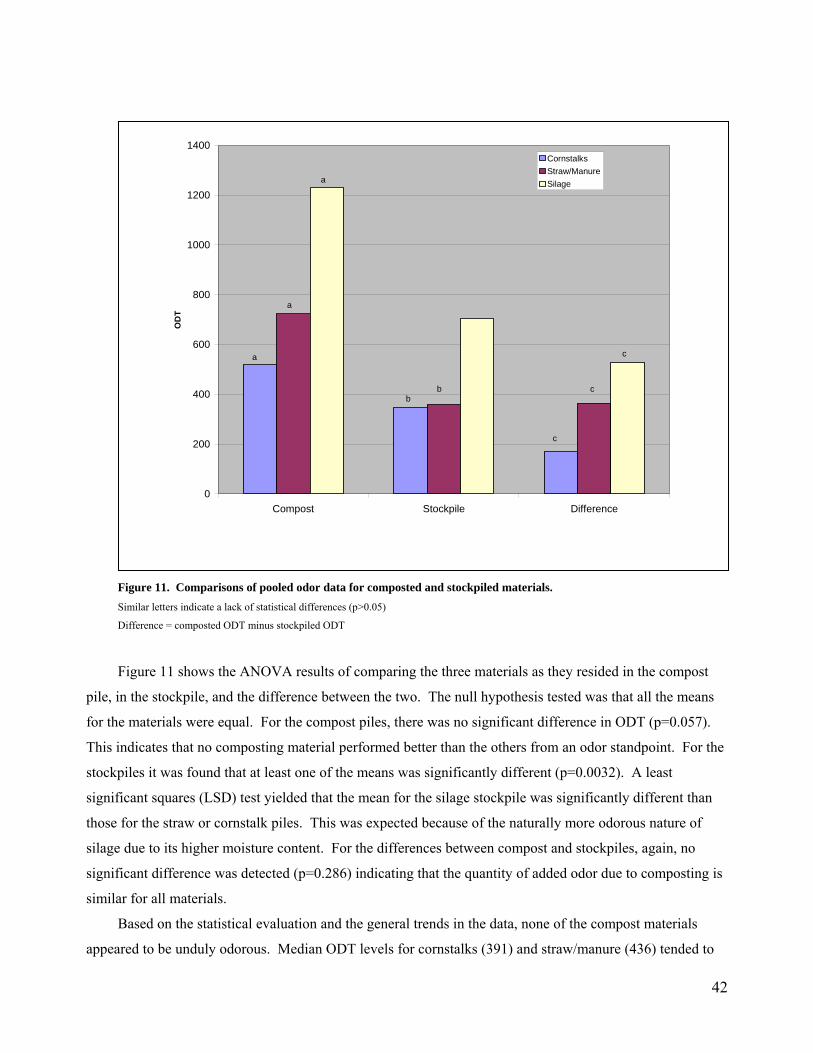
..........................................................................................................................................................................41 .........................42 Figure 11. Comparisons of pooled odor data for composted and stockpiled materials.
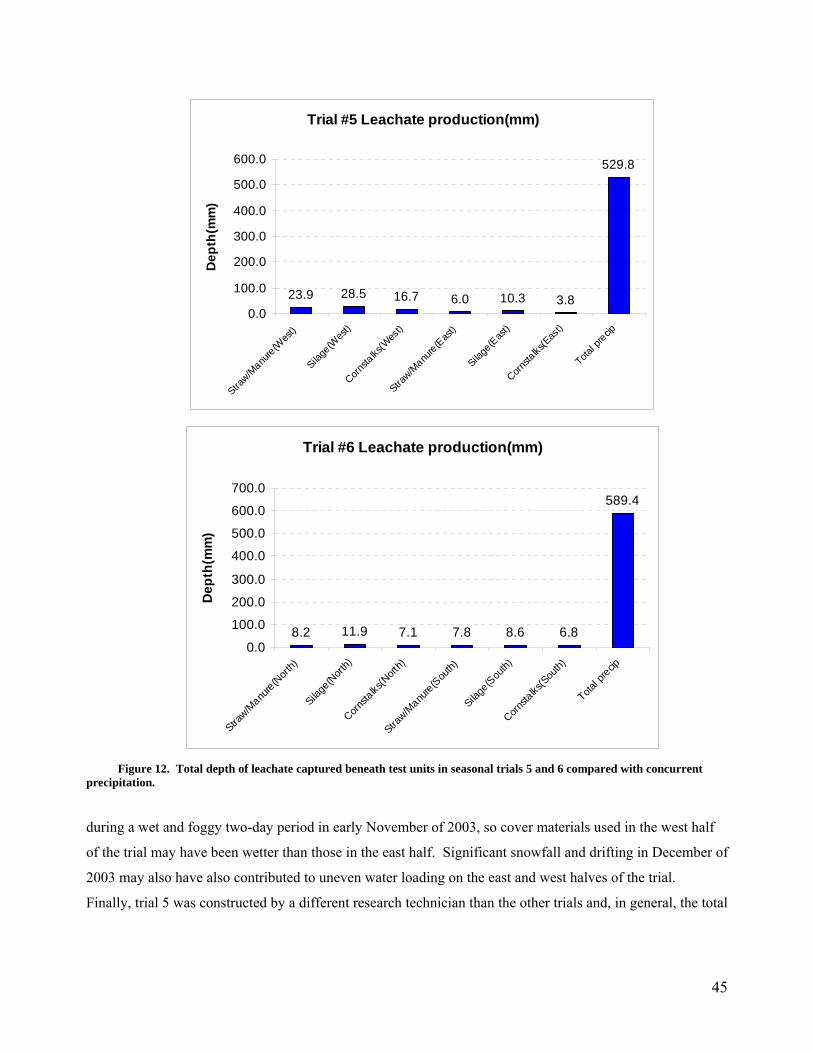
Figure 12. Total depth of leachate captured beneath test units in seasonal trials 5 and 6 compared with
concurrent precipitation....................................................................................................................................45 .......................47 Figure 13. Calculated pollutant loading rates in soil beneath test units in trials 5 and 6.
Figure 14. Suppressed soybean growth exhibited in areas previously covered by mortality composting
............................................................20 Table 1. Trials conducted during emergency composting study.
Table 2. Zone success meeting Class A and Class B time/temperature requirements (Y=success,
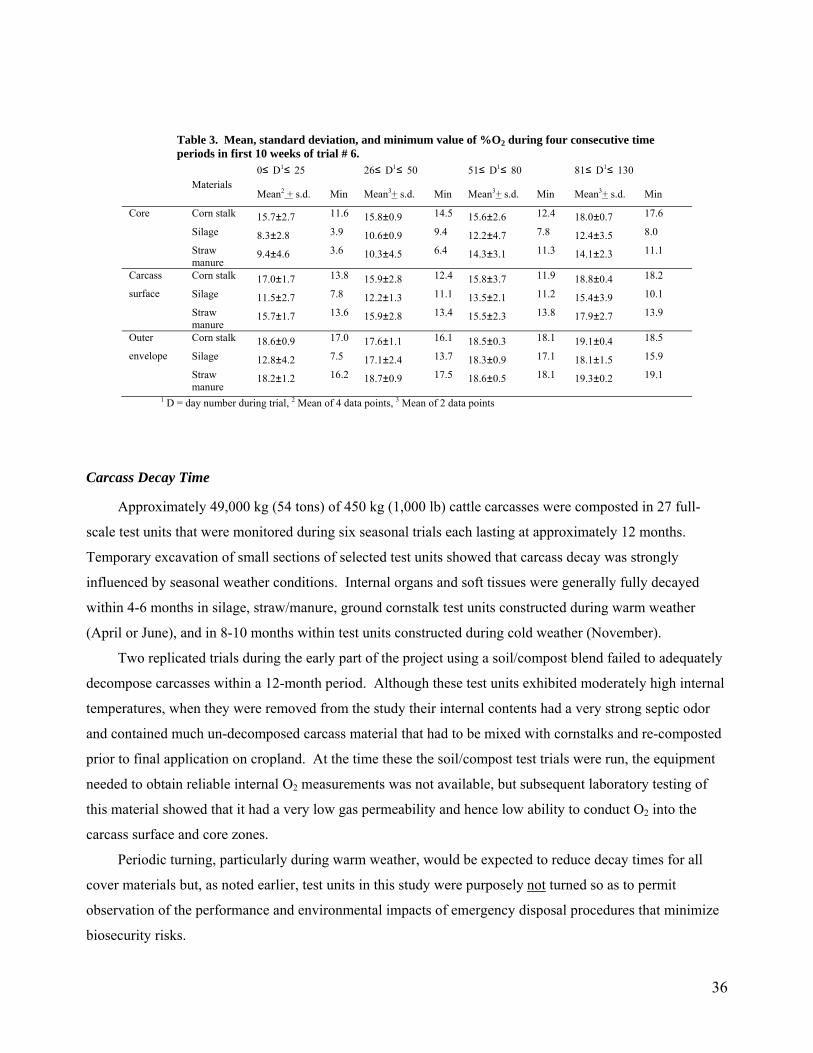
N=failure for the trials listed in the column heading).......................................................................................33 Table 3. Mean, standard deviation, and minimum value of %O2 during four consecutive time periods in
first 10 weeks of trial # 6. .................................................................................................................................36 Table 4. Mean total Kjeldahl nitrogen (TKN) and P2O5 content of cattle mortality compost after
approximately one year of composting.............................................................................................................38 ..................................................................39 Table 5 Mean values of Odor Detection Thresholds (ODT).
..............................................43 Table 7. Characteristics of Individual Samples: Hydrogen Sulfide (ppb)
..........................................................44 Table 8. Characteristics of Individual Samples: Ammonia (ppm)
.................................46 Table 9. Mean chemical concentrations in leachate collected from trials 5 and 6.
......50 Table 10. Composting-related contaminants in top four feet of soil prior to composting (N=108).
...........................................50 Table 11. Increase in % total carbon in soil beneath composting test units.
........................................51 Table 12. Increase in % total nitrogen in soil beneath composting test units.
.......................51 Table 13. Increase in ammonia-N concentrations in soil beneath composting test units.
...........................51 Table 14. Increase in nitrate-N concentrations in soil beneath composting test units.
.............................52 Table 15. Increase in chloride concentrations in soil beneath composting test units.
Table 16. Viability of Newcastle Disease in virus samples from test units in trial 1..............................54 ...................................................................55 Table 17. Summary of virus inactivation times for all trials.
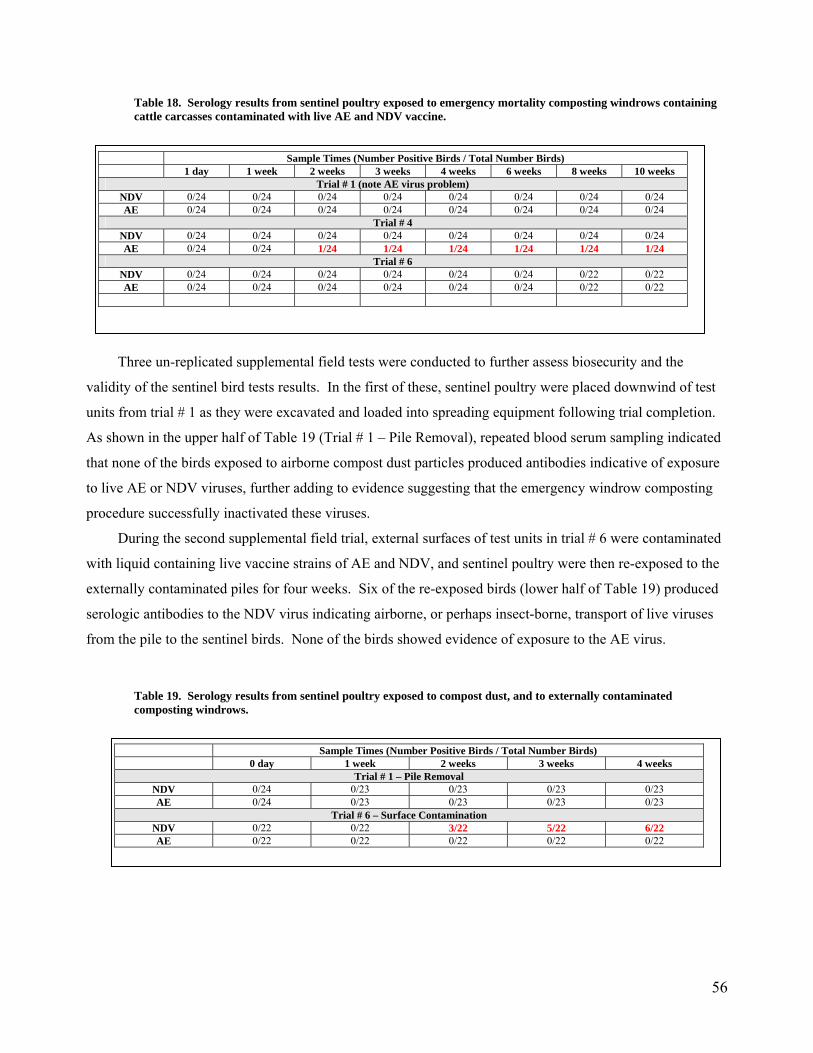
Table 18. Serology results from sentinel poultry exposed to emergency mortality composting windrows
containing cattle carcasses contaminated with live AE and NDV vaccine. .....................................................56 Table 19. Serology results from sentinel poultry exposed to compost dust, and to externally
contaminated composting windrows. ...............................................................................................................56 ................58 Table 20. Performance ranges observed for key parameters in 13 potential cover materials.
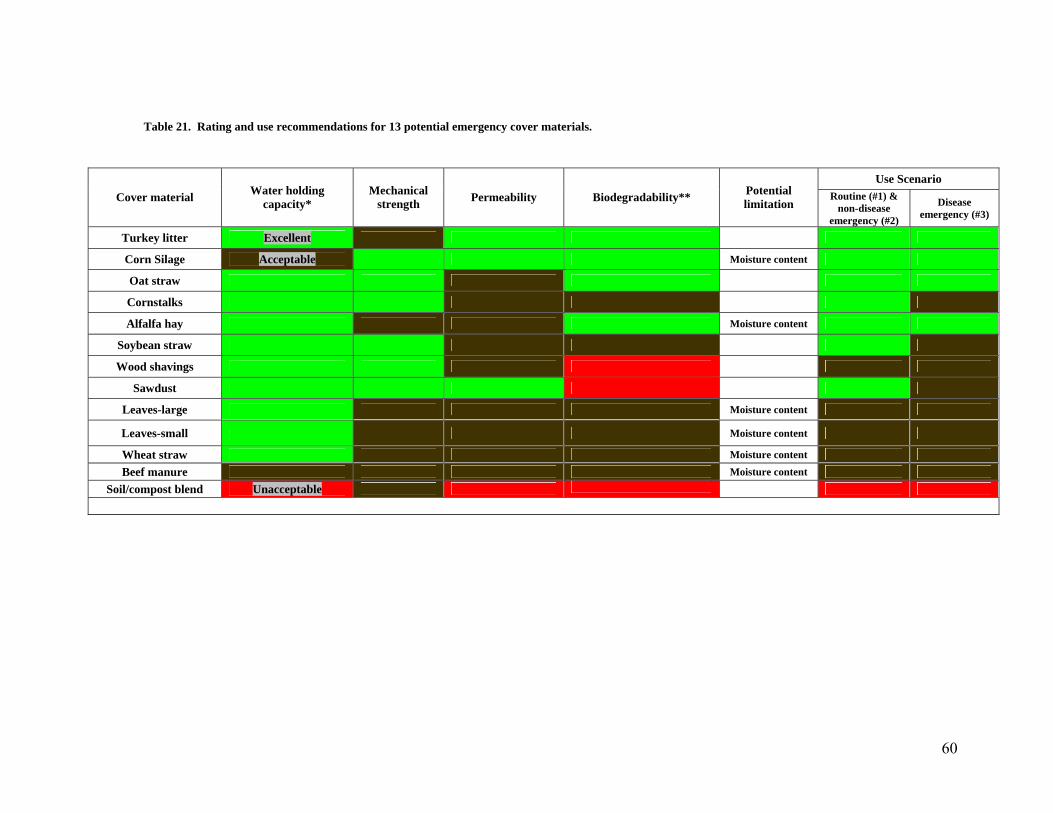
.....................60 Table 21. Rating and use recommendations for 13 potential emergency cover materials.
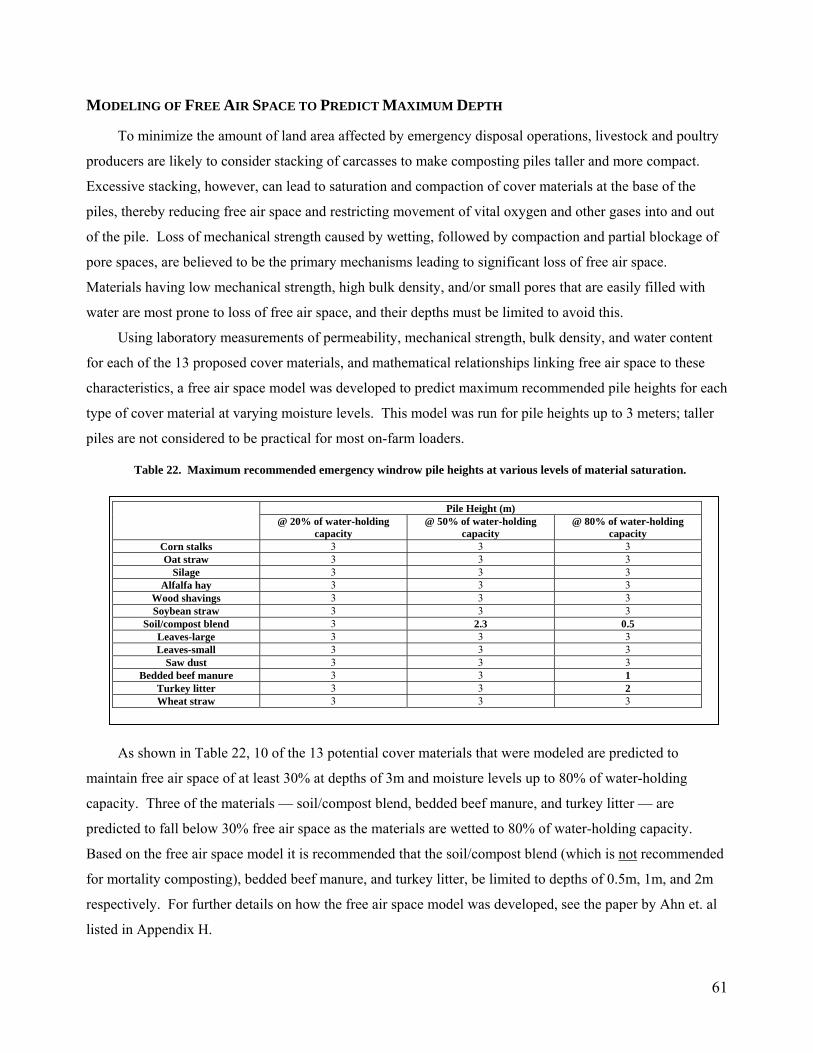
Table 22. Maximum recommended emergency windrow pile heights at various levels of material
Once the windrows were constructed, operating and maintenance procedures during the research were
minimal. Since windrows were not turned, it was occasionally necessary to add cover material to prevent
carcass exposures caused by pile settling or occasional burrowing animals.
20
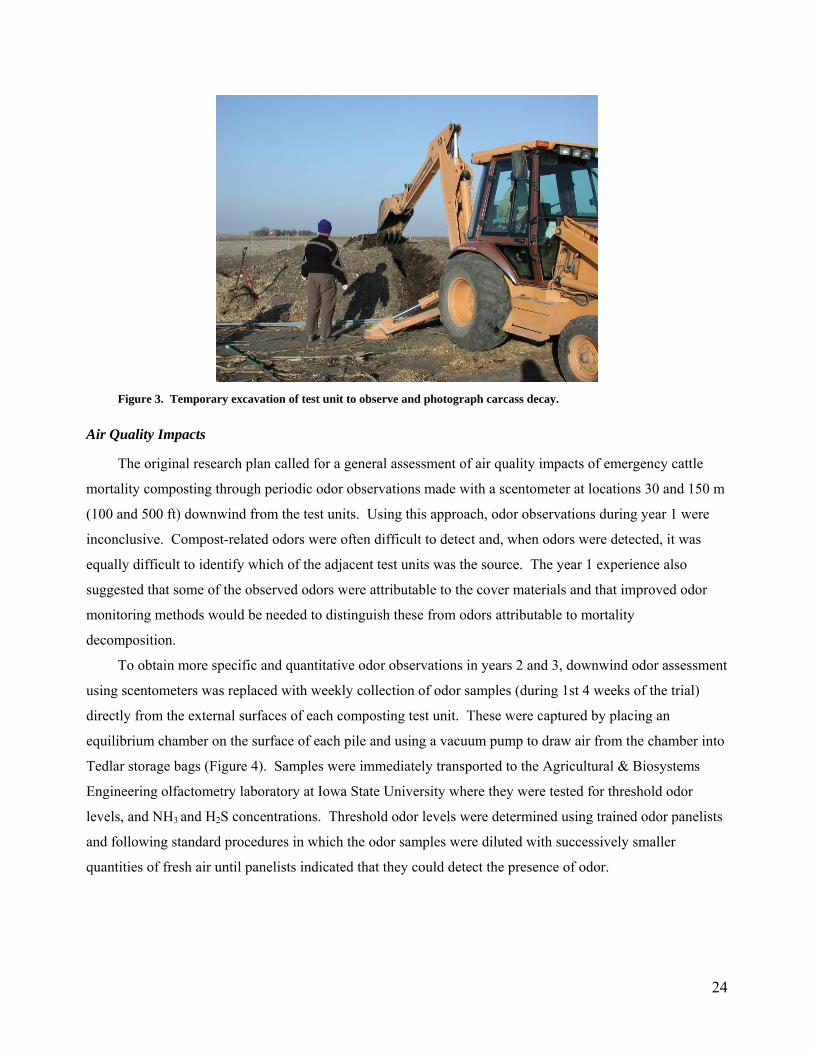
All test units were allowed to compost for approximately one year. During this time, small portions of
selected test units were temporarily excavated with a backhoe 3-6 months following construction to
photograph and assess carcass degradation.
FIELD PERFORMANCE MONITORING
Corresponding to the project objectives, field trials were monitored to assess: overall performance of
the composting process; environmental impacts on soil and air; and process biosecurity. Methods and
indicators used for each type of assessment are described in the following sections.
Process Performance
Process performance was assessed through: continuous logging of internal temperatures; periodic
measurement of internal oxygen concentrations; and by periodic excavation of selected test units to observe
and photograph the extent of carcass degradation.
Internal Temperatures
Internal temperature data provide valuable insights into heat production and retention which are critical
factors affecting organic matter degradation rates. The magnitude and duration of peak temperatures also are
important in assessing the ability of the composting system to inactivate pathogens.
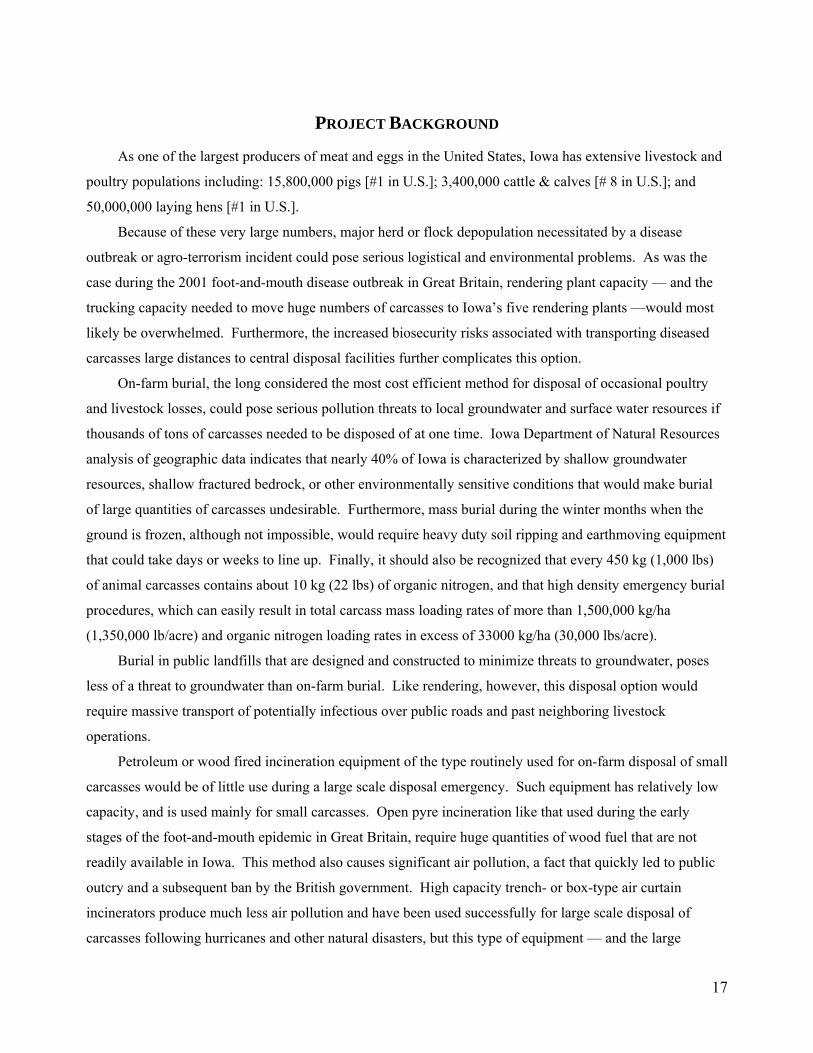
Temperatures within each test unit were measured using 20 type-T thermocouples (10 around each pair
of carcasses). As shown in Figure 1, thermocouples were positioned in three conceptual zones — 4 in the
“core” zone at the center of the test unit (between carcasses), 8 in the “carcass surface” zone immediately
above and below and to the side of the carcasses, and 8 in the “outer envelope” of cover material.
Temperature measurements at each thermocouple were logged electronically every 2 minutes and
subsequently averaged to obtain representative hourly and daily values for each thermocouple. Daily data
from all thermocouples within a conceptual zone averaged to obtain representative zone temperatures, and
these were subsequently charted to observe and compare the impacts of cover material type and season on
performance.
In addition to visual comparisons of temperature trends within different types of test units, the
likelihood of pathogen inactivation was assessed by comparing time/temperature data in the core and
carcass-surface zones with time/temperature criteria outlined in USEPA Subpart D - Part 503 rules for
pathogen reduction in composted biosolids. Part 503 rules recognize two classes of biosolids.
21
thermocouple
base layer (same as cover material
virus eggs
virus sample port
cover material
45-60 cm
O2 sample ports
4.9-5.5 m
carcass
leachate collector
carcass surface zone
core zone
2.1-2.4 m
Figure 1. Cross section of emergency composting test unit showing material placement and instrumentation
Class A biosolids are treated to reduce pathogens below detectible levels, thereby enabling them to be safely
applied to public or private land — such as parks or private lawns — where human contact is likely. Class B
biosolids are treated to significantly reduce pathogens, but are not permitted to be applied to public access
areas since disease-causing agents may still be detectible. Class B biosolids are approved for application to
agricultural land and this use is believed to not pose a threat to public health or the environment.
To meet Class A requirements, Part 503 rules require that biosolids treated via static (unturned) aerated
composting be exposed to temperatures of 55 °C or greater for at least 3 consecutive days. Class B composts
must be exposed to temperatures of at least 40 °C for 5 or more consecutive days, and temperatures must
exceed 55 °C for at least 4 hours during the 5-day period.
Internal Oxygen Concentrations
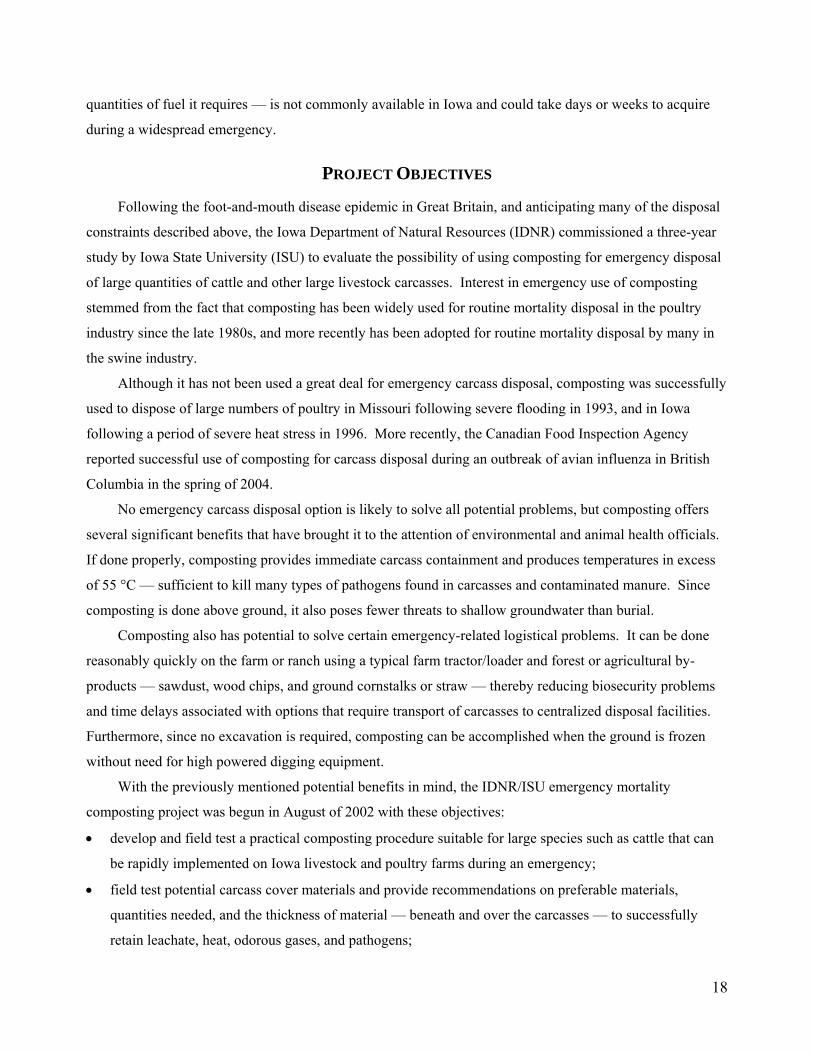
To provide an additional indicator of process performance, internal O2 concentrations were measured
every 10 days at three locations within the core, carcass surface, and outer envelope zones of the 12 test units
included in trial #6. Measurements were made using an Oxy Guard portable O2 meter equipped with an
external O sensor mounted within a flow-through sampling chamber ( rated system accuracy = + 2 1% )
(Figure 2).
Attempts to measure internal O2 concentrations during trials 1- 4 were unsuccessful due to use of a
faulty O2 meter, and to the use of an O2 probe system that had to be inserted and withdrawn from the test unit
at each location and time when measurements were made. The insertion procedure disturbed the composting
matrix, making it difficult to obtain representative measures of internal O2 that were not affected by external
oxygen concentrations as well. The Oxy Guard meter was not purchased until January of 2004 and so its use
22
was begun midway through trial 5. Three sets of readings were taken and these data and practical field
experiences were used to develop reliable O field measurement protocols that were applied during trial 6. 2
Consistent O2 measurements during trial 6 were facilitated by permanently installing dedicated gas
sampling ports consisting of small diameter polyethylene tubing at the time of test unit construction. These
ports were connected to the flow-through chamber via surgical rubber tubing, thereby allowing collection of
internal air with minimal disturbance of the compost matrix and minimizing introduction of air from the
external environment. Sample tubes were purged prior to taking oxygen readings to minimize errors caused
by introduction of external air when the O meter was connected. 2
Figure 2. Meter, hand pump, flow-through sample cell, and dedicated gas sampling tubes used to monitor internal
oxygen concentrations.
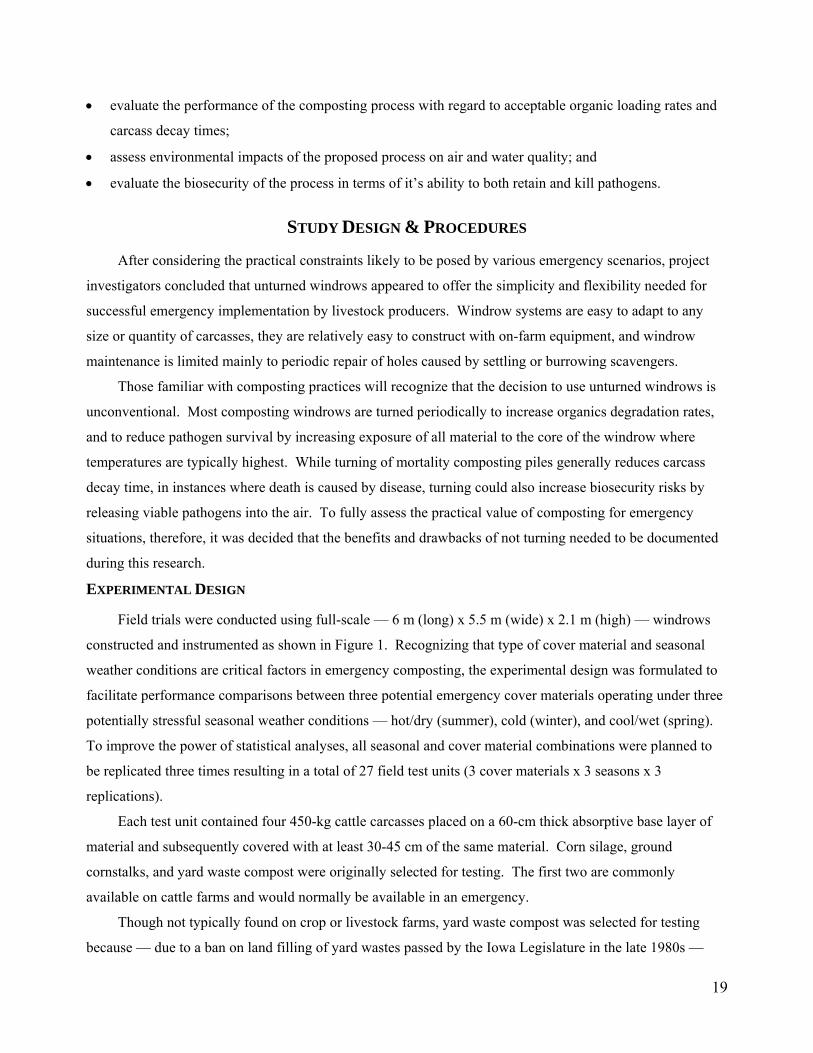
Observation of Carcass Degradation
One hundred to 180 days following test unit construction, small sections of selected units were
excavated with a backhoe (Figure 3) to permit observation and photographic documentation of the extent of
the cattle carcass degradation. Care was taken to disturb only as much material as necessary to obtain a clear
view of the carcass. Following these observations excavated material was replaced so that decomposition
could continue.
23
Figure 3. Temporary excavation of test unit to observe and photograph carcass decay.
Air Quality Impacts
The original research plan called for a general assessment of air quality impacts of emergency cattle
mortality composting through periodic odor observations made with a scentometer at locations 30 and 150 m
(100 and 500 ft) downwind from the test units. Using this approach, odor observations during year 1 were
inconclusive. Compost-related odors were often difficult to detect and, when odors were detected, it was
equally difficult to identify which of the adjacent test units was the source. The year 1 experience also
suggested that some of the observed odors were attributable to the cover materials and that improved odor
monitoring methods would be needed to distinguish these from odors attributable to mortality
decomposition.
To obtain more specific and quantitative odor observations in years 2 and 3, downwind odor assessment
using scentometers was replaced with weekly collection of odor samples (during 1st 4 weeks of the trial)
directly from the external surfaces of each composting test unit. These were captured by placing an
equilibrium chamber on the surface of each pile and using a vacuum pump to draw air from the chamber into
Tedlar storage bags (Figure 4). Samples were immediately transported to the Agricultural & Biosystems
Engineering olfactometry laboratory at Iowa State University where they were tested for threshold odor
levels, and NH3 and H2S concentrations. Threshold odor levels were determined using trained odor panelists
and following standard procedures in which the odor samples were diluted with successively smaller
quantities of fresh air until panelists indicated that they could detect the presence of odor.
24
Figure 4. Collection of odor samples from surface of composting test units using equilibrium chamber, vacuum pump, and Tedlar storage bags (left), and determination of threshold odor level in ISU olfactometry laboratory (right).
To provide a basis for distinguishing between odors caused by the cover materials and those attributable
to carcass decomposition, samples also were collected from the surfaces of cover materials (corn silage,
ground cornstalks, ground straw) that were stockpiled at the research site. Threshold odor levels and
descriptors from the stockpile samples were used as a benchmark for assessing the strength and offensiveness
of mortality composting system odors relative to other odors that are common on cattle farms.
Soil & Water Quality Impacts
Leachate Quantity and Quality
During seasonal trials 1- 4, plywood leachate trays (four feet wide by 8 feet long) lined with plastic
sheeting were placed beneath each pair of cattle carcasses in a test unit to capture a substantial fraction of the
leachate that would be released into the soil. Trays were constructed so as to drain into shallow plastic pans
that were intended to be emptied through suction lines leading to the outer edges of the piles. Despite
repeated efforts to improve the design and reliability of the plywood collectors, they were plagued by
operational problems. Continuous exposure to moist compost and the heavy weight of the carcasses warped
and cracked the plywood resulting in loss of leachate. Furthermore, the high BOD and suspended solids
content of the leachate led to serious plugging of the leachate drain tubing, making sample collection both
messy and difficult. Finally, since the plastic leachate storage pans were hidden beneath carcasses and cover
material, it was difficult to predict when they needed to be emptied, and this too contributed to leachate loss.
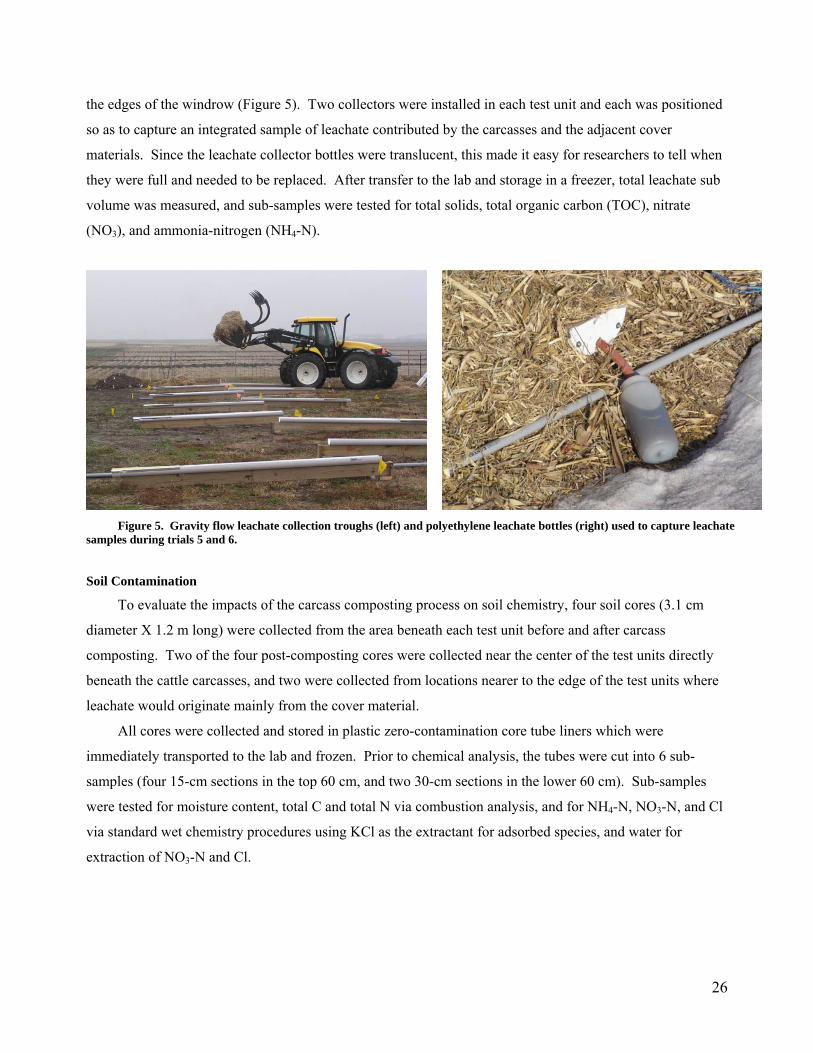
For the 12 test units included in trials 5 and 6, the large plywood collectors were abandoned and
leachate was captured in U-shaped PVC plastic troughs constructed from half-sections of 6-inch diameter
PVC water pipe. The troughs were mounted on 2x10 treated lumber beams that sloped from the center of the
piles toward the outer edges thereby permitting gravity transfer of leachate into 1-liter polyethylene bottles at
25
the edges of the windrow (Figure 5). Two collectors were installed in each test unit and each was positioned
so as to capture an integrated sample of leachate contributed by the carcasses and the adjacent cover
materials. Since the leachate collector bottles were translucent, this made it easy for researchers to tell when
they were full and needed to be replaced. After transfer to the lab and storage in a freezer, total leachate sub
volume was measured, and sub-samples were tested for total solids, total organic carbon (TOC), nitrate
(NO ), and ammonia-nitrogen (NH -N). 3 4
Figure 5. Gravity flow leachate collection troughs (left) and polyethylene leachate bottles (right) used to capture leachate samples during trials 5 and 6.
Soil Contamination
To evaluate the impacts of the carcass composting process on soil chemistry, four soil cores (3.1 cm
diameter X 1.2 m long) were collected from the area beneath each test unit before and after carcass
composting. Two of the four post-composting cores were collected near the center of the test units directly
beneath the cattle carcasses, and two were collected from locations nearer to the edge of the test units where
leachate would originate mainly from the cover material.
All cores were collected and stored in plastic zero-contamination core tube liners which were
immediately transported to the lab and frozen. Prior to chemical analysis, the tubes were cut into 6 sub-
samples (four 15-cm sections in the top 60 cm, and two 30-cm sections in the lower 60 cm). Sub-samples
were tested for moisture content, total C and total N via combustion analysis, and for NH -N, NO4 3-N, and Cl
via standard wet chemistry procedures using KCl as the extractant for adsorbed species, and water for
extraction of NO -N and Cl. 3
26
Biosecurity Assessment
Biosecurity evaluation procedures were designed to evaluate virus survival and the ability of
composting units to retain live viruses. Survival time was assessed by placing vaccine strains of two poultry
viruses (Newcastle Disease Virus - NDV, and avian encephalomyelitis - AE) into the composting piles at the
time of construction and periodically withdrawing samples and testing them for viability. To help determine
whether compost heating is the primary cause of virus inactivation, a portion of the virus samples was
housed in sealed cryogenic vials that exposed the viruses to heat, but protected them from other
environmental stresses associated with the internal composting environment. The remaining virus samples
were housed in gas-permeable dialysis cassettes which exposed the viruses not only to heat produced by
composting, but also to gaseous decomposition products, moisture fluctuations, and changes in pH.
NDV and AE vaccines were used to test the ability of the composting system to inactivate pathogenic
viruses found within diseased animal carcasses. Cryogenic vials and dialysis cassettes were filled with
media preparations containing each virus. Eight cryogenic vials and 4 dialysis cassettes (each containing 1
ml of vaccine) were inserted in each test section of the windrow. The dialysis cassettes and vials were
retrieved at various time intervals throughout the trial.
Ten-day-old embryonated chicken eggs were inoculated with material from the recovered samples (10
eggs used for each sample), and the allantoic fluid was evaluated for NDV virus and brains were examined
using the indirect fluorescent antibody (IFA) test for AE virus.
Viral containment (retention of viruses within a pile) was assessed by contaminating exterior surfaces
of the cattle carcasses with vaccine viruses at the time of test unit construction, and by placing pathogen-free
sentinel poultry in cages (warm weather trials only) at the edges of the test units. Weekly blood samples
drawn from the birds during the first 2-3 months of the trial were tested for antibodies to determine if any of
the sentinel birds had become exposed to the viruses. Newcastle disease virus (NDV) and avian
encephalomyelitis virus (AEV) were used to evaluate the degree of bio-containment provided by
composting. Twenty dozen 10-day-old embryonating chicken eggs were inoculated with NDV vaccine strain
(NDV vaccine, B1 type, B1 strain, American Scientific Laboratories, Inc.) via allantoic sac as described in A
Laboratory Manual for the Isolation and Identification of Avian Pathogens. Similarly, 20 dozen 6-day-old
embryonating chicken eggs were inoculated with AE vaccine strain (Tremblex, 1143 Calnek strain, Vineland
Laboratories) via yolk sac as described in A Laboratory Manual for the Isolation and Identification of Avian
Pathogens. The NDV and AE infected eggs were incubated at 37C and at 60% humidity for 7 and 12 days
respectively. After the incubation period, they were stored in the refrigerator until the starting day. As
previously noted, the carcasses placed into the composting windrows were contaminated with liquid from
these eggs prior to covering so as to simulate composting of diseased animals and contaminated bedding and
feed.
27
Specific Pathogen Free (SPF) chickens were used as sentinels to evaluate the bio-containment provided
by composting. These birds were housed under SPF conditions prior to the beginning of the study. Twenty-
four of the 12-week-old chickens were wing banded, sampled (blood) and transferred to the project site one
day after the construction of the windrows. Four chickens were placed in each of six cages surrounding the
composting windrow. Blood samples were collected from each bird following transport to the field research
site, at weekly or biweekly intervals. Serum samples were tested for specific NDV and AE antibodies. The
hemagglutination-inhibition (HI) test was done for NDV. A typical β procedure (Diluted serum Constant-
Virus) was performed as described in A Laboratory Manual for the Isolation and Identification of Avian
Pathogens.
The Enzyme-Linked Immunosorbent Assay (ELISA) was used for AE. A commercially-available test
kit (IDEXX Laboratories, Inc. One Idexx Drive Westbrook, ME) was purchased and used according to the
manufacturer’s directions.
To insure that the bio-containment test procedures were functioning as planned, two 12-week-old SPF
chickens were spray-vaccinated with the NDV vaccine, and two 12-week-old SPF chickens were spray-
vaccinated with the AE vaccine. These birds were placed in separate laboratory rooms to serve as positive
controls for observation and testing. Blood samples confirmed that these birds seroconverted to NDV and
AE as expected.
LABORATORY TESTING AND RANKING OF ALTERNATIVE COVER MATERIALS
Practical considerations (time, money, research space) limited replicated field testing to four cover
materials (ground cornstalks, corn silage, straw/manure, and soil/compost blend). Other commonly available
organic materials may perform equally well, however, and if large numbers of producers located in a
particular region were forced to depopulate their herds or flocks simultaneously during an emergency — as
was the case in Great Britain during the foot-and-mouth disease epidemic in 2001 — it may be necessary to
rely on a wide range of cover materials. With this in mind, a comprehensive laboratory testing program was
initiated to identify and predict the performance of alternative cover materials that could conceivably be
obtained in large quantities and used in the event of a carcass disposal emergency.
Materials Tested & Tests Performed
In addition to the four materials tested in the field, nine additional potential cover materials — turkey
quotient, gas permeability, thermal conductivity, and specific heat capacity. Since several of these
28
parameters change significantly as moisture content changes, tests for porosity, free air space, mechanical
strength, and gas permeability were carried out at 20, 50, and 80% of water-holding capacity.
Biodegradability, which is sensitive to high water content, was tested at 20, 50, 80, 90, and 100% of water-
holding capacity. Similarly, thermal properties (conductivity and diffusivity) were measured at 0, 20, 50,
and 80% of water-holding capacity and at saturation. A brief description of procedures for the less common
tests is provided in Appendix E of this report.
Ranking Procedures
After the physical, chemical, and biological characteristics listed above were measured and tabulated
for the 13 potential cover materials, laboratory values for the field-tested materials (ground cornstalks,
leaves, silage, ground straw, soil/compost blend) were assessed by the research team — in light of
composting theory and observed field performance —to identify a limited set of key parameters that could be
used to predict and rank the field performance of all materials. Once the key parameters were identified,
each of the 13 materials tested were then rated as “excellent,” “acceptable,”, or “unacceptable” with regard to
each of the key parameters, and these ratings were then used to rank the suitability of each material for use in
three mortality composting scenarios. These scenarios are:
1. composting of routine mortalities — where disease is not a serious concern, the number of
carcasses to be dealt with at one time is small, and there is sufficient time and money to
construct bins or use other methods to shelter the composting operation from excessive
precipitation;
2. composting of non-disease-related emergency mortalities — caused by fire, flood, or
ventilation failures, where the numbers of carcasses to be dealt with at one time may be large,
and unsheltered emergency composting piles or windrows must be used due to time and money
constrains; and
3. composting of mortalities caused by contagious disease where — in addition to the issues
associated with scenario 2 — biosecurity is a major concern.
MODELING TO EVALUATE & RECOMMEND DESIGN HEIGHTS FOR COMPOSTING OPERATIONS
One of the most important factors in successful composting is maintenance of a moderately aerobic
internal environment. Composting experts typically recommend that minimum O2 concentrations of at least
5% be maintained within the pore spaces of a composting pile to promote rapid decomposition of organics
and oxidation of malodorous byproducts (Rynk et. al., 1992), and concentrations of 10% or greater are
preferred for good performance.
Forced aeration or frequent turning is often used to maintain O2 concentrations in municipal or
industrial composting operations, but on-farm mortality composting operations are typically turned
29
infrequently, and may not be turned at all if carcasses are the result of death caused by disease and therefore
pose biosecurity concerns. In such cases favorable O2 levels can be sustained only if the outer envelope of
the composting matrix has sufficient free air space to permit natural pile ventilation driven by external wind
currents and thermal gradients. Based on previous research, minimum free air space (FAS) of at least 30% is
recommended to help maintain internal O2 concentrations. While it is quite difficult to actually measure
FAS within an active composting matrix, it is feasible to model and predict it based on laboratory
measurements of moisture content, dry matter, and sample bulk density, and on the known densities of water
(1000 kg/m3), organic matter(1600kg/m3) and ash(2500kg/m3). Results of such a physical modeling effort,
described in the Results and Interpretations section, will be used to predict maximum pile depth
recommendations for emergency windrows.
RESULTS AND INTERPRETATIONS
PROCESS PERFORMANCE
Internal Temperatures
Time/Temperature Trends and Effects of Cover Material Type
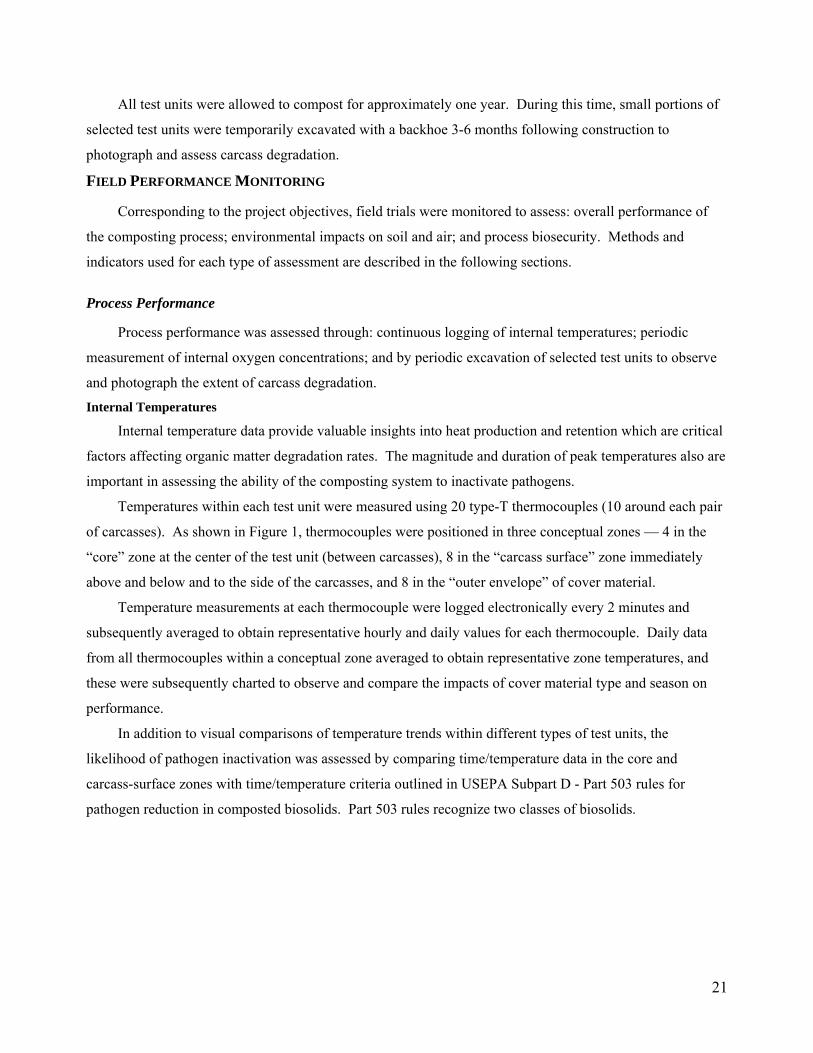
As illustrated by the sample time/temperature data in Figure 6 (see Appendix A for all time/temperature
charts and tables), those constructed with corn silage generally exhibited the highest temperatures in all
zones (core, carcass surface, outer envelope) and during all seasons, while test units constructed with ground
cornstalks generally had the lowest. Temperatures within straw/manure generally were between the other
two, but were more similar to cornstalks than silage. Within the important core and carcass surface zones
where pathogen populations are likely to be the highest, peak temperatures for the duration of the trial were
generally in the 60-70 ° C range for silage and in the 50-60 ° C range for cornstalk and straw/manure test
units.
During cool or cold weather, silage units generally achieved temperatures of 55 °C or greater more
quickly, and sustained these periods of relatively high temperature for longer periods, than the other two
types of materials. This improved the odds of meeting time/temperature criteria for pathogen inactivation
(see later section on pathogen inactivation potential) during the early stages of carcass degradation, thereby
giving pathogen populations less time to adapt to high temperatures. The longer time needed to reach peak
temperatures in cornstalk test units is thought to have been caused primarily by lower initial moisture content
than in units where silage or manure were used to cover the carcasses.
During cool or warm season trials, temperatures within all test units tended to converge and to approach
external air temperatures within 5-6 months. During cold season trials this process took 7-8 months.
30
Core(West pile- Trial #5)
- 30
- 10
10
30
50
70
11-Nov 19-Jan 28-Mar 5-Jun 13-Aug 21-Oct
DayTe
mp.
(℃)
Straw/manure Cornstalks Silage Air
Carcass surface(West pile- Trial #5)
-30
-10
10
30
50
70
11-Nov 19-Jan 28-Mar 5-Jun 13-Aug 21-Oct
Day
Tem
p.(℃
)
Straw/manure Cornstalks Silage Air
Outer envelope(West pile- Trial #5)
- 30
- 10
10
30
50
70
11- Nov 19- Jan 28- Mar 5- Jun 13- Aug 21- Oc tDay
Tem
p.(℃
)
Straw/ manure Cornstalks Silage Air
Figure 6. Daily average external (air) and internal temperatures for three test units constructed in November 2003 (Trial #5).
31
This convergence corresponded roughly with observed carcass degradation times, and is thought to signal
conditions when readily degradable organics from the carcasses were no longer available to fuel microbial
heat production.
Spatial Temperature Distribution
Spatial temperature distributions within the compost pile are affected by the ability of the composting
system (carcasses and cover materials) to produce heat, the gas permeability and thermal properties of the
cover materials — which affect their ability to retain heat — and by external temperatures and rainfall that
contribute to heat loss. If adequately shielded from external factors, temperatures within core and carcass
surface zones are often considerably higher and less variable than in the outer envelope as shown in Figure 6.
This emphasizes the importance of maintaining a relatively thick outer envelope during the early phases of
carcass decomposition, particularly in instances where animal death is caused by disease.
During cold weather, temperatures in all zones (core, carcass surface, and outer envelope) are
suppressed to some extent. Silage test units, however, were generally affected the least by external
temperatures as evidenced by the fact that outer envelope temperatures in nearly every silage test unit
managed to exceed 50 °C for significant periods of time. This is believed to be due mainly to the relatively
high biodegradability and low gas permeability of silage, factors that support production and retention of
heat throughout the pile — not just in zones receiving moisture and nitrogen from the carcasses. As would
be expected, temperatures were generally highest in the core zone during cold weather. During warmer
weather, however, temperatures in the core and carcass surface zones were similar, and peak temperatures in
the carcass surface zone during warm weather were often slightly higher than those in the core. Reduced
oxygen concentrations — caused by the close proximity of carcasses on both sides of the core zone, and to
supplemental moisture added by warm season rainfall — are thought to be the most likely cause of the peak
temperature suppression within the core.
Potential to Inactivate Pathogens
While the zone temperature data discussed in the previous section provide a general indication of the
potential to kill pathogens, documented success rates in meeting time/temperature criteria for Class A or
Class B biosolids provide a more well-defined basis for assessing pathogen inactivation potential.
As shown in Table 2, silage test units were most likely to meet Class A time/temperature requirements
(55 °C for at least 3 consecutive days). In 8 of the 9 silage test units (89%) Class A criteria were met in the
core zone, and 8 of 9 units also met Class A criteria in the carcass surface zone. The two failures to meet
Class A criteria did not occur in the same test unit — core zone failure occurred during a summer silage trial,
and carcass surface zone failure occurred during a winter trial. As a result, simultaneous attainment of Class
A criteria in both zones occurred in only 7 of 9 test units (78%).
32
33
Table 2. Zone success meeting Class A and Class B time/temperature requirements (Y=success, N=failure for the trials listed in the column heading).
Dual layer straw/manure test units had the second highest success rate for meeting Class A criteria
(core 33%, carcass surface 67%, joint 17%), while those constructed with ground cornstalks had a slightly
lower success rate (core 56%, carcass surface 22%, joint 11%). It is speculated that the low success rate in
the core zone of straw/manure test units may have resulted from O2 limitations (see Figure 7) caused by the
layer of moist cattle manure placed over the carcasses. This material had low gas permeability when wet,
and water released from the carcasses undoubtedly helped to sustain high moisture levels in the manure
layer. In the carcass surface zone of straw/manure test units, where O2 concentrations were higher, the
Zone Material Spring (T3,T6N, T6S)1
Summer (T1, T4E,T4W)
Winter (T2, T5E, T5W)
Success rate (%) 4
Class A Requirements Cornstalks Y, Y, Y N, Y, N N, N, Y 56
Silage Y, Y, Y Y, N, Y Y, Y, Y 89 Straw/manure -, N, Y -, N, N, -, Y, N 33
Soil/compost blend -, -, - N, -, - Y, -, - 502
Core
Leaves Y, -, - -, -, - -, -, - -3
Cornstalks N,N, N N, Y, Y N, N, N 22 [a]
Silage Y,Y, Y Y, Y, Y N, Y, Y 89 [b]
Straw/manure -, Y,Y -, Y, Y -, N, N 67 [a] [b]
Soil/compost blend -, -, - N, -, - Y, -, - 502
Carcass Surface
Leaves N, -, - -, -, - -, -, - -3
Cornstalks N,N,N N,Y,N N, N, N 11 [a]
Silage Y,Y, Y Y, N, Y N,Y,Y 78 [b]
Straw/manure -, N,Y -, N, N -, N, N 17 [a] [c]
Soil/compost blend -, -, - N, -, - Y, -, - 502
Core + Carcass Surface
Leaves N, -, - -, -, - -, -, - -3
Class B Requirements Cornstalks Y, Y, Y N, Y, N N, Y, Y 67
Silage Y, Y, Y Y, N, Y Y, Y, Y 89 Straw/manure -, N, Y -, N, N, -, Y, Y 50
Soil/compost blend -, -, - N, -, - Y, -, - 502
Core
Leaves Y, -, - -, -, - -, -, - -3
Cornstalks N,Y, N N, Y, Y N, N, N 22 [a]
Silage Y,Y, Y Y, Y, Y Y, Y, Y 100 [b]
Straw/manure -, Y,Y -, Y, Y -, N, N 67 [a] [b]
Soil/compost blend -, -, - N, -, - Y, -, - 502
Carcass surface
Leaves Y, -, - -, -, - -, -, - -3
Cornstalks N,Y, N N, Y, N N, N, N 22 [a]
Silage Y,Y, Y Y, N, Y Y, Y, Y 89 [b]
Straw/manure -, N,Y -, N, N -, N, N 17 [a] [c]
Soil/compost blend -, -, - N, -, - Y, -, - 502
Core + Carcass Surface
Leaves Y, -, - -, -, - -, -, - -3
1 _ values in parenthesis identify trial # and pile location e.g. T6N = trial # 6, north windrow 2 – success rate for soil/compost blend based on only two trials, this material was dropped from the study
due to very poor carcass degradation performance. 3 – success rate not calculated for leaves since only one trial was conducted. 4 – means (within the same zone) followed by different letters are significantly different (p<0.05).
success rate was twice that in the core. The low success rate in the carcass surface zone of the cornstalk test
units is believed to have been caused by high gas permeability leading to increased movement of cool air
through the outer envelope.
Although the much lower (40°C) temperatures associated with Class B pathogen reduction criteria
might appear to be easier to achieve than the higher (55°C) Class A temperatures, the longer time
requirement (5 consecutive days) and concurrent requirement to have at least 4 hours above 55 °C made
these criteria almost as difficult to achieve as the Class A criteria. Consequently, Class B zone success rates
for each of the cover materials were the same or only slightly higher than those for Class A (Table 2). This
may be due, in part, to the way in which Class B conditions were defined for the purpose of this study. Due
to the large amount of temperature data collected during the project, only daily average data were archived.
Since hourly data were not available, it was necessary to use a proxy for Class B criteria — in this case 40 °C
for at least 5 days and >55 °C for at least one day (rather than 4 hours) — was used. Since these modified
criteria are somewhat harder to meet than the official Class B definition, it is possible that the materials
tested have slightly higher Class B success rates than shown in Table 2.
Due to the design of the internal temperature monitoring system, carcass surface data, which are based
on data from 12 thermocouples, are considered to be a more reliable indicator of carcass exposure to heat
than the core data, which are derived from only 4 thermocouples. Not only are the carcass surface mean
temperatures based on more information, and they also are less likely to be seriously affected by
thermocouple malfunctions.
Internal Oxygen Concentrations
Typical O2 concentrations within the core, carcass surface, and outer envelope zones of three selected
test units are in trial 6 are charted in Figure 7 (all O2 data are in Appendix B of this report), and summary
statistics for all test units in trial 6 are given in Table 3. These data reflect the effects of oxygen consumption
during aerobic decomposition of organic matter, and the ability of the cover materials to transport oxygen to
interior zones to replace the consumed O . 2
Keeping the carcass composting environment moderately aerobic is important as this helps to ensure
decomposition of malodorous compounds. Heat production — an important factor in pathogen control —
also is higher when decay is aerobic rather than anaerobic. To achieve these benefits, composting experts
typically recommend that minimum O2 concentrations within the pore spaces of composting piles not be
allowed to drop below 5% (by volume) for significant periods of time, and concentrations of 10% or greater
are preferred for good composting.
During the first 25 days, minimum oxygen concentrations in the core zone of silage and straw/manure
test units dropped below 5% , and average O concentrations were less than 10% . Reflecting the results of 2
34
0
5
10
15
20
4/30/2
004
5/10/2
004
5/20/2
004
5/30/2
004
6/9/200
4
6/19/2
004
6/29/2
004
7/9/200
4
7/19/2
004
7/29/2
004
8/8/200
4
8/18/2
004
8/28/2
004
9/7/200
4
Date
Oxy
gen(
%)
Corn stalk Silage Straw manure
Core
Carcass surface
0
5
10
15
20
25
4/30/2
004
5/10/2
004
5/20/2
004
5/30/2
004
6/9/200
4
6/19/2
004
6/29/2
004
7/9/200
4
7/19/2
004
7/29/2
004
8/8/200
4
8/18/2
004
8/28/2
004
9/7/200
4
Date
Oxy
gen(
%)
Corn stalk Silage Straw manure
Outer envelope
0
5
10
15
20
4/30/2
004
5/10/2
004
5/20/2
004
5/30/2
004
6/9/200
4
6/19/2
004
6/29/2
004
7/9/200
4
7/19/2
004
7/29/2
004
8/8/200
4
8/18/2
004
8/28/2
004
9/7/200
4
Date
Oxy
gen(
%)
Corn stalk Silage Straw manure
Figure 7. Zone O concentrations in three test units during trial # 6.2
inherently higher gas permeability, concurrent minimum O2 levels in the core zone of cornstalk test units
exceeded 10%, and the average concentrations exceeded 15%.
As time progressed beyond the initial month, mean O2 levels exceeded 10% in all zones of all three
test materials, and minimum concentrations exceeded 5%. Drying, settling, and cracking of the outer
envelope are thought to be key factors leading to the increased O2 levels. Reflecting the high gas
permeability of ground cornstalks, and quite possibly a lower initial oxygen demand (due to dryness), mean
O levels within all zones of cornstalk test units exceeded 15% and minimum O2 2 concentrations exceeded
11%.
35
Table 3. Mean, standard deviation, and minimum value of %O2 during four consecutive time periods in first 10 weeks of trial # 6.
0≤ D ≤ 25 26≤ D ≤ 50 51≤ D ≤ 80 81≤ D ≤ 130 1 1 1 1
Materials 2 3 3 3Mean +
Carcass Decay Time
Approximately 49,000 kg (54 tons) of 450 kg (1,000 lb) cattle carcasses were composted in 27 full-
scale test units that were monitored during six seasonal trials each lasting at approximately 12 months.
Temporary excavation of small sections of selected test units showed that carcass decay was strongly
influenced by seasonal weather conditions. Internal organs and soft tissues were generally fully decayed
within 4-6 months in silage, straw/manure, ground cornstalk test units constructed during warm weather
(April or June), and in 8-10 months within test units constructed during cold weather (November).
Two replicated trials during the early part of the project using a soil/compost blend failed to adequately
decompose carcasses within a 12-month period. Although these test units exhibited moderately high internal
temperatures, when they were removed from the study their internal contents had a very strong septic odor
and contained much un-decomposed carcass material that had to be mixed with cornstalks and re-composted
prior to final application on cropland. At the time these the soil/compost test trials were run, the equipment
needed to obtain reliable internal O2 measurements was not available, but subsequent laboratory testing of
this material showed that it had a very low gas permeability and hence low ability to conduct O2 into the
carcass surface and core zones.
Periodic turning, particularly during warm weather, would be expected to reduce decay times for all
cover materials but, as noted earlier, test units in this study were purposely not turned so as to permit
observation of the performance and environmental impacts of emergency disposal procedures that minimize
biosecurity risks.
s.d. Min Mean + s.d. Min Mean + s.d. Min Mean + s.d. Min
1 D = day number during trial, 2 Mean of 4 data points, 3 Mean of 2 data points
36
Contrary to initial expectations, higher temperatures within the silage test units did not result in
noticeably shorter carcass decay times than those observed in the much cooler cornstalks. It is speculated
that the less favorable temperatures in the cornstalks may have been offset by significantly higher O2
concentrations (than in silage test units) which tend to favor rapid aerobic decomposition of organic
materials.
During the early weeks of the composting process considerable settling of the unturned windrows took
place, particularly during warm and wet weather. Under such conditions it was not unusual for test units that
were 2.1-2.4 m (7-8 ft) tall at the time of construction to settle to a depth of about 1.2 m in 45-60 days. This
phenomenon was caused by rapid initial decomposition and release of liquid from the carcasses — each 450
kg (1,000 lb) of carcasses contains approximately 300 kg (650 lb) of water — and by subsequent moistening
and compaction of cover and base materials. In some instances rapid pile settling necessitated addition of
cover material to fill cracks and voids and maintain cover over the carcasses. Based on these experiences it
is recommended that the carcasses of large animals such as cattle not be stacked during emergency carcass
disposal composting in unturned windrows as this is likely to lead to severe pile settling and release of
leachate caused by excessive carcass weight and release of liquid. Intermediate sized species such as swine,
calves, and sheep weighing 115 kg (250 lbs) or less can be stacked, but it is recommended that this be limited
to only two layers if carcasses are large, and at least 30 cm (1 ft) of absorptive material should be placed
between the layers to help retain liquid and aid oxygen penetration into the pile.
After one year of composting, the resulting material included many large cattle bones and skulls that
were relatively dry and free of soft tissues Figure 8. These large bones were quite strong, and many were not
broken up significantly during land application using a normal manure spreader. Disking of the application
area was not successful in breaking up or covering the large bones; moldboard plowing was generally
successful in covering them, but subsequent tillage and planting operations are likely to bring them to the
surface again so careful consideration should be given to how and where composted cattle mortalities will
ultimately be disposed. Use of a Kuhn-Knight manure spreader equipped with a hammer-mill discharge was
effective at reducing large bones to much smaller fragments.
Composite samples collected from finished test units were tested for total N and total P2O5. As
summarized in Table 4, the nutrient content of most samples was low. With the exception of compost from
the straw/manure test units (and a single leaf test unit), total N content was well below 1% (wet basis), and
P2O5 was less than ½ % (wet basis). The relatively large component of un-decomposed nutrient-poor straw
and cornstalks are believed to account for the generally low values. Beef manure used in the straw/manure
test units undoubtedly contributed to the elevated nutrient levels in this compost. The cause of the relatively
high level of total N in compost from the single test unit constructed with leaf mulch is unknown.
37
Figure 8. Large bones and skulls remaining following cattle carcass composting (top) were free of soft tissues, use of a Kuhn-Knight manure spreader with hammer-mill type discharge (lower left) significantly reduced the size of bones in field following compost spreading (lower right).
Table 4. Mean total Kjeldahl nitrogen (TKN) and P2O5 content of cattle mortality compost after approximately one year of composting.
Number of samples TKN(%, wet basis) P O (%, wet basis) 2 5
Means with different superscripts were statistically different (P<0.05) 1Overall average refers to the averages of individual piles (two for treatment and one stockpile per replicate) averaged together.
Trial # 6 Cool/Wet 4w+ 3d 7w+ 7d+ Cornstalks 4w 3d 6w 7d+ Silage 4w 2d 7w 7d Straw/Manure
1 w = weeks 2 d = days
Virus survival times did not appear to be strongly associated with type of cover material. In light of the
relatively high success rate of silage test units in meeting Class A and Class B time/temperature criteria for
pathogen reduction, it was anticipated that test units constructed with silage would consistently exhibit
significantly shorter virus survival times than other types of test units. However, in only two of six seasonal
trials for NDV in vials, and one out of three trials for AE in vials, were survival times in silage test units
significantly shorter than in cornstalk or straw/manure units. For samples contained in dialysis cassettes —
where, as noted earlier, survival times were generally much shorter than in vials — the differences in
survival times for silage and other cover materials were only a few days at best.
Bio-containment – Serology
Table 18 shows results of bio-containment tests conducted during trials 1, 4, and 6. (Due to harsh
weather and test animal welfare considerations, bio-containment tests were not conducted during trials 2, 3,
and 5.) Sentinel poultry serology data indicate that the 45-60 cm (18-24 in) envelope of straw, cornstalk, or
silage cover material placed over contaminated interior surfaces of the composting piles was successful in
preventing live virus from leaving the composting test units. Only one out of 72 sentinel poultry housed in
cages at the edge of the test units showed a positive immune system response to either of the vaccine strains
of AE and NDV that were liberally applied to the internal surfaces of the composting test units at the time of
construction.
55
Table 18. Serology results from sentinel poultry exposed to emergency mortality composting windrows containing cattle carcasses contaminated with live AE and NDV vaccine.
Three un-replicated supplemental field tests were conducted to further assess biosecurity and the
validity of the sentinel bird tests results. In the first of these, sentinel poultry were placed downwind of test
units from trial # 1 as they were excavated and loaded into spreading equipment following trial completion.
As shown in the upper half of Table 19 (Trial # 1 – Pile Removal), repeated blood serum sampling indicated
that none of the birds exposed to airborne compost dust particles produced antibodies indicative of exposure
to live AE or NDV viruses, further adding to evidence suggesting that the emergency windrow composting
procedure successfully inactivated these viruses.
During the second supplemental field trial, external surfaces of test units in trial # 6 were contaminated
with liquid containing live vaccine strains of AE and NDV, and sentinel poultry were then re-exposed to the
externally contaminated piles for four weeks. Six of the re-exposed birds (lower half of Table 19) produced
serologic antibodies to the NDV virus indicating airborne, or perhaps insect-borne, transport of live viruses
from the pile to the sentinel birds. None of the birds showed evidence of exposure to the AE virus.
Table 19. Serology results from sentinel poultry exposed to compost dust, and to externally contaminated composting windrows.
Sample Times (Number Positive Birds / Total Number Birds) 0 day 1 week 2 weeks 3 weeks 4 weeks
alfalfa hay, ground soybean straw, wood shavings, and sawdust are top-rated base/cover
materials. Dry leaves, wheat straw, and bedded beef manure are less desirable but acceptable
alternatives.
• Avoid using any base/cover materials that are wet. To test wetness, squeeze a handful tightly.
If any water drips out, the material is too wet and may perform poorly due to reduced water
absorbing and oxygen transmitting capacity.
• Note that any of the long and fiberous agricultural residues recommended above must be
ground (2-inch recommended maximum length) to enhance their water absorbing capacity and
to minimize formation of large voids in the outer envelope that could lead to carcass exposure,
excessive heat loss, and leachate release.
• To minimize the risks of excessive leachate release a 24-inch deep base layer beneath the
carcasses is recommended.
• To minimize the risks of both odor and leachate release, a 24-inch thick envelope of cover
material over the carcasses is recommended.
• To avoid excessive compaction and subsequent loss of free air space in the base layers of the
windrow, pile heights should be limited to a maximum of 2m for turkey litter, 1m for dry
bedded beef manure, and 0.5m for dense soil-like materials (not recommended for emergency
composting) such as the soil/compost blend. For the remaining 10 materials tested, compost
modeling indicates that pile heights of up to 3m can be used without serious compaction.
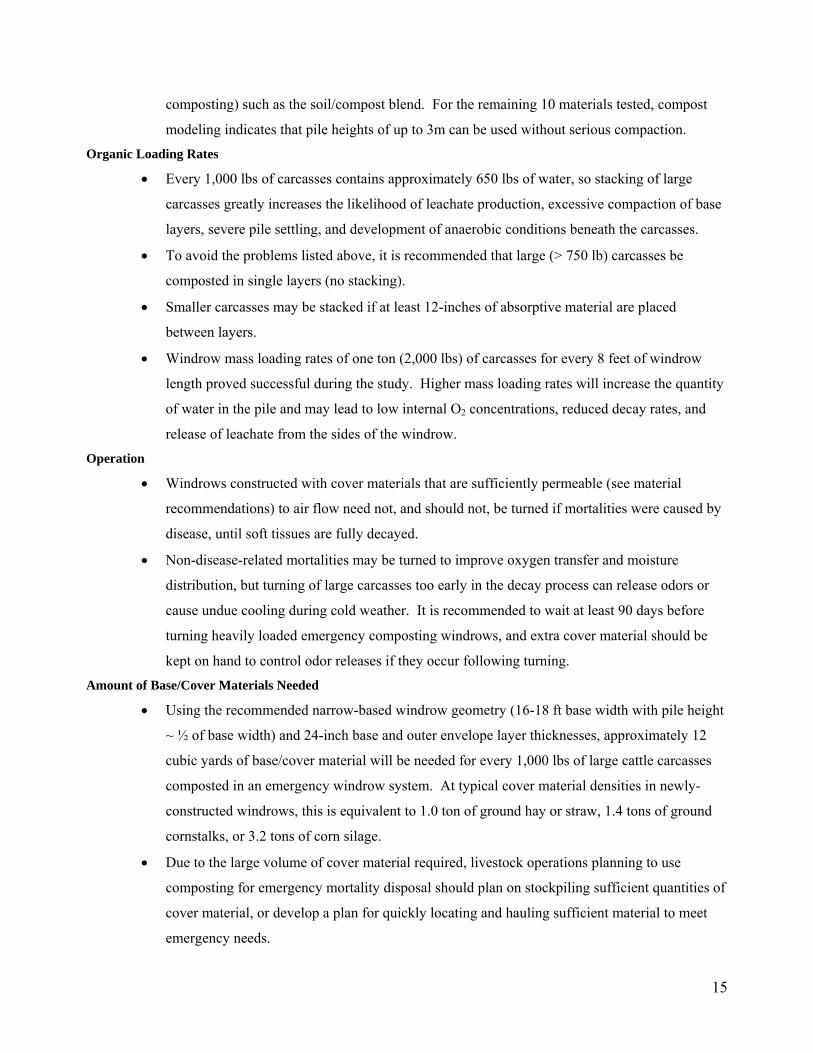
ORGANIC LOADING RATES
• Every 1,000 lbs of carcasses contains approximately 650 lbs of water, so stacking of large ( >
750 lbs) carcasses greatly increases the likelihood of excessive leachate production, severe
69
compaction of base layers and pile settling, and development of anaerobic conditions beneath
the carcasses.
• To avoid the problems listed above, it is recommended that large (> 750 lb) carcasses be
composted in single layers (no stacking of carcasses) and that no more than two 1,000-lb
carcasses be placed in an 8-ft length of composting windrow (with 18 ft base width as
described above).
• Smaller carcasses ( < 750 lbs) may be stacked if at least 12-inches of absorptive material are
placed between layers.
• During the IDNR/ISU emergency composting research, successful composting was achieved
when two 1,000-lb cattle carcasses were placed in each 8 feet of windrow length (with 18-ft
windrow base width). Although higher mass loading rates were not tested, it is anticipated that
increased water and organic loading associated with higher mass loading rates may lead to low
internal oxygen concentrations, reduced decay rates, and possible release of leachate from the
sides of the windrow. With these concerns in mind, it is recommended that total mass loading
rates, regardless of carcass size, be limited to no more than 2,000 lbs in every 8-ft length of
windrow.
OPERATION
• Windrows constructed with cover materials that are sufficiently permeable (see material
recommendations) to air flow need not, and should not, be turned if mortalities were caused by
disease, until all soft tissues are fully decayed.
• Non-disease-related mortalities may be turned to improve oxygen transfer and moisture
distribution, but turning of large carcasses too early in the decay process can release odors or
cause undue cooling during cold weather. It is recommended to wait at least 90 days before
turning heavily loaded emergency composting windrows, and extra cover material should be
kept on hand to control odor releases if they occur following turning.
AMOUNT OF BASE/COVER MATERIALS NEEDED
• Using the windrow geometry and carcass loading rates suggested above, approximately 12
cubic yards of base/cover material will be needed for every 1,000 lbs of carcasses composted in
an emergency windrow system. At typical cover material densities in newly-constructed
windrows, this is equivalent to 1.0 ton of ground hay or straw, 1.4 tons of ground cornstalks, or
3.2 tons of corn silage.
70
• Livestock operations intending to use composting for emergency mortality disposal should
stockpile sufficient quantities of cover materials, or develop a plan for quickly locating and
hauling sufficient material, to meet emergency needs.
SITE CLEANUP AND REMEDIATION
• Finished cattle mortality compost may include large bones that can interfere with tillage and
planting, or offend nearby residential property owners. Additional tillage operations may be
needed to break up or cover the bones. Use of a manure spreader equipped with a hammer-mill
type discharge can help to reduce the size of large bones. Screening and burial of the large
bones is another option.
• The uppermost layers of topsoil located beneath carcass composting windrows may accumulate
salts or other phytotoxic materials that suppress crop emergence and growth. Tillage of these
soils may help to break up the affected layer and mix it with uncontaminated soil, thereby
improving 1st year crop production.
WORKS CITED
Britto, D.T and H.J. Kronzucker. 2002. NH4+ toxicity in higher plants: a critical review. Journal of Plant
Physiology. 159: 567-584.
Bundy, D. 2004. Personal Communication. Professor of Agricultural and Biosystems Engineering, Iowa
State University, Ames, IA. July, 2004.
Dowling, C.W. 1998. Seed and seedling tolerance of cereal, oilseed, fibre and legume crops to injury from
banded ammonium fertilizers. Ph.D. thesis, Griffith University, Queensland, Australia. ndOtt, L. 1984. An Introduction to Statistical Methods and Data Analysis. 2 Edition. Boston, MA. PWS