Quarterly Report January to March 2020 OUR SOLUTION Financial Highlights • Operational net profit of EUR 124 million (-7% yoy), +10% before Abertis • Net cash from op. activities pre-factoring of EUR 1.7 billion LTM • Group net cash of EUR 715 million in Q1 2020, pre BICC cash effect • Order backlog (EUR 47.6 billion) and new orders (EUR 27.9 billion LTM) on high level • Outlook across core markets remains positive, monitoring shorter-term impacts YOUR PLATFORM We are building the world of tomorrow.
Transcript
Quarterly ReportJanuary to March 2020
OUR SOLUTION
Financial Highlights• Operational net profit of EUR 124 million (-7% yoy), +10% before Abertis• Net cash from op. activities pre-factoring of EUR 1.7 billion LTM• Group net cash of EUR 715 million in Q1 2020, pre BICC cash effect• Order backlog (EUR 47.6 billion) and new orders (EUR 27.9 billion LTM) on high level• Outlook across core markets remains positive, monitoring shorter-term impacts
YOUR PLATFORM
We are building the world of tomorrow.
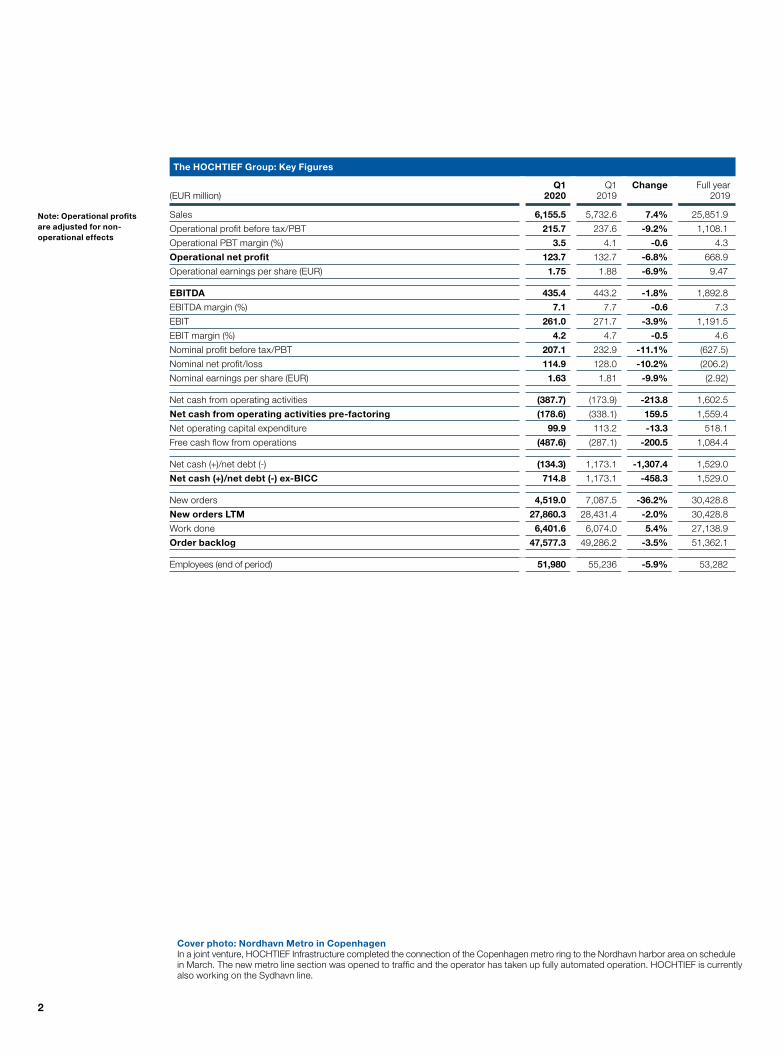
Cover photo: Nordhavn Metro in CopenhagenIn a joint venture, HOCHTIEF Infrastructure completed the connection of the Copenhagen metro ring to the Nordhavn harbor area on schedule in March. The new metro line section was opened to traffic and the operator has taken up fully automated operation. HOCHTIEF is currently also working on the Sydhavn line.
2
Note: Operational profits are adjusted for non- operational effects
The HOCHTIEF Group: Key Figures
(EUR million)Q1
2020Q1
2019Change Full year
2019
Sales 6,155.5 5,732.6 7.4% 25,851.9
Operational profit before tax/PBT 215.7 237.6 -9.2% 1,108.1
Operational PBT margin (%) 3.5 4.1 -0.6 4.3
Operational net profit 123.7 132.7 -6.8% 668.9
Operational earnings per share (EUR) 1.75 1.88 -6.9% 9.47
EBITDA 435.4 443.2 -1.8% 1,892.8
EBITDA margin (%) 7.1 7.7 -0.6 7.3
EBIT 261.0 271.7 -3.9% 1,191.5
EBIT margin (%) 4.2 4.7 -0.5 4.6
Nominal profit before tax/PBT 207.1 232.9 -11.1% (627.5)
Nominal net profit/loss 114.9 128.0 -10.2% (206.2)
Nominal earnings per share (EUR) 1.63 1.81 -9.9% (2.92)
Net cash from operating activities (387.7) (173.9) -213.8 1,602.5
Net cash from operating activities pre-factoring (178.6) (338.1) 159.5 1,559.4
Net operating capital expenditure 99.9 113.2 -13.3 518.1
Free cash flow from operations (487.6) (287.1) -200.5 1,084.4
Net cash (+)/net debt (-) (134.3) 1,173.1 -1,307.4 1,529.0
Net cash (+)/net debt (-) ex-BICC 714.8 1,173.1 -458.3 1,529.0
New orders 4,519.0 7,087.5 -36.2% 30,428.8
New orders LTM 27,860.3 28,431.4 -2.0% 30,428.8
Work done 6,401.6 6,074.0 5.4% 27,138.9
Order backlog 47,577.3 49,286.2 -3.5% 51,362.1
Employees (end of period) 51,980 55,236 -5.9% 53,282
Our focus on our core markets of Australia, North America
and Europe gives the Group a unique and well balanced
business profile. During the first quarter, operations at the
vast majority of our construction, mining and services sites
have continued despite the corona crisis. Overall, the Group’s
activities continue to progress within the framework of the
restrictions which have been put in place.
The corona crisis presents us all with unprecedented diffi-
culties and challenges. We are continuously monitoring
the risks and responding to the changing conditions and
ensuring the safety of our people.
I am glad and proud that in many places the HOCHTIEF
Group is proactively helping to mitigate the pandemic. For
example, in the United States, Turner, as the leading builder
of healthcare projects, has accelerated work to meet the
surge in hospital demand. The company was called upon
to build space to deliver urgent patient care in 20 locations
across the United States. More than 200 Turner staff mem-
bers—in some cases working in shifts around the clock—
have been leading efforts to complete work resulting in
more than 4,000 patient care beds in a matter of weeks.
CIMIC, our Australian business, is also supporting com-
munity efforts to reduce the spread of Covid-19. CPB Con-
tractors is redeveloping, expanding and building hospitals
in New South Wales, Australia, and is also delivering the
Christchurch Hospital in New Zealand by bringing in addi-
tional resources from neighboring projects.
Marcelino Fernández Verdes, Chairman of the Executive Board
HOCHTIEF Group—Q1 2020 overviewOperational net profit of EUR 124 million (-7% yoy), +10% before Abertis• Sales of EUR 6.2 billion, up 7% yoy (f/x-adj. +8%),
with robust contribution from operating divisions
• Abertis profit contribution of EUR 1 million, (Q1
2019 EUR 21 million), driven by corona traffic
impacts
• Op. PBT of EUR 216 million, stable yoy before Abertis
• Nominal net profit of EUR 115 million, +7% yoy
before Abertis
Net cash from op. act. pre-factoring of EUR 1.7 billion LTM• Net cash from op. act. pre-factoring improved by
EUR 160 million in Q1 2020, EUR +1.2 billion LTM
• Net working capital performance pre-factoring
improved yoy by EUR 133 million in Q1 2020
• Net capex of EUR 100 million in Q1 2020
(EUR -13 million yoy)
Group net cash of EUR 715 million in Q1 2020, pre BICC cash effect• Group net debt of EUR 134 million, incl. EUR 849
million net cash effect for BICC in Q1 2020
• EUR 122 million cash-out for CIMIC share purchase
and HOCHTIEF and CIMIC share buybacks
• Strong liquidity position of over EUR 6.0 billion per
end-Q1 2020, S&P BBB rating
Order backlog (EUR 47.6 billion) and new orders (EUR 27.9 billion LTM) on high level• Order backlog of EUR 47.6 billion (yoy +1% f/x-adj.)
• New orders EUR 27.9 billion LTM (yoy -3% f/x-adj.).
1.0x work done; disciplined bidding approach con-
tinues in all divisions
Outlook across core markets remains positive, monitoring shorter-term impacts• Once we have better visibility of the consequences
of the corona crisis on the business, we will pro-
vide an update to 2020 guidance, if required
• Strong position in our core markets and robust
tender pipeline: USA, Canada, Asia-Pacific and
Europe approx. EUR 600 billion for 2020 and
beyond; PPP project pipeline of approx. EUR
220 billion
Q1 2019
LTM Q1 2019
LTM Q1 2020
Q1 2020
(EU
R m
illio
n)
Net cash from op. activites pre-factoring
+ 160
+ 1,
227
(338) (179)
1,719
492
(EU
R b
illio
n)
LTM New orders
Backlog
-3% f/x-adj.
+1% f/x-adj.
28.4 27.9
47.649.3
Q1 2019
Q12019
Q1 2020
Q12020
(EU
R m
illio
n)
Q1 2019 Q1 2020
133
-7%
124
67 61
44 56
21 1
12 13(12) (8)
Operational net profit
ABE
HTAM
HTAP
HTEHQ
(EU
R m
illio
n)
(488)1,529
(134)
(122)
Net
ca
shF
Y 2
019
Free
CF
from
op
s.
HO
T/C
IM s
hare
b
uyb.
& s
take
incr
.D
ebt l
ease
rep
aym
./fx
/oth
ers
Net
cas
h p
re B
ICC
ca
sh e
ffect
Q1
2020
BIC
C c
ash
effe
ct
Q1
2020
Net
ca
sh
Q1
2020
(205)715 (849)
+10%
yoy = year on year LTM = last twelve months
To Our Shareholders 3Interim Management Report 6Interim Financial Statements 16Publication Details and Credits 26
Notwithstanding the impact of the corona crisis, HOCHTIEF
delivered a Q1 2020 consolidated Group operational net
profit of EUR 124 million compared with EUR 133 million in
the corresponding period of 2019. The operational net profit before the Abertis contribution was 10% higher year
on year, with all three operating divisions achieving solid
results. Sales rose over EUR 400 million, or 7%, to EUR 6.2
billion with an 8% rise on an f/x-adjusted basis.
Net cash from operating activities improved by EUR 160
million year on year on an underlying basis. The Group
remains focused on cash-backed profits. Due to sustained
activity in mining and job-costed tunneling work, HOCHTIEF
invested EUR 100 million in net operating capital expendi-
ture compared with EUR 113 million in Q1 2019. Post this
capex, the Group achieved a strong year-on-year improve-
ment in free cash flow from operations of over EUR 170
million pre-factoring.
HOCHTIEF ended the first quarter of 2020 with a slight net
debt position of EUR 134 million after investing EUR 122
million to acquire 2.8% of CIMIC as well as share buybacks
at both HOCHTIEF and CIMIC. Excluding the EUR 849 mil-
lion cash effect during the quarter of exiting the Middle East,
the net cash position would stand at EUR 715 million at
the end of March 2020.
Following the announcement of our withdrawal from the
Middle East, CIMIC’s solid investment grade rating was
reaffirmed by the rating agencies. Moody’s highlighted the
exit from the Middle East as “credit positive” while S&P
described it as “consistent with group strategy”. Further-
more, S&P’s “BBB” investment grade rating for HOCHTIEF
is unchanged with a stable outlook.
HOCHTIEF ended the quarter with a strong liquidity position
of EUR 6.0 billion further supported by committed, un-
drawn credit facilities.
The Group’s order book reached EUR 48 billion at the end of
March 2020, an increase year on year of 1%, on an f/x-ad-
justed basis. The quality of our order book is enhanced by
the high level of visibility which our construction manage-
ment, mining, alliance-style contracts and serv ices activ-
ities provide and which account for about two-thirds of
HOCHTIEF’s order book. Despite the Q1 impact of the co-
rona crisis a solid level of new orders of EUR 27.9 billion
has been secured during the last twelve months. A disci-
plined bidding approach remains a priority across the
Group.
Looking forward, our local teams have identified a proj-ect tender pipeline worth around EUR 600 billion of
relevant projects coming to our markets in North America,
Asia- Pacific and Europe for 2020 and beyond, with EUR
220 billion of PPP projects in developed markets.
Shareholder remuneration continues to be a key element
of the Group’s capital allocation strategy along with focus-
ing on attractive, organic and strategic growth opportuni-
ties. At the Group’s Annual General Meeting on April 28, a
dividend for full year 2019 of EUR 5.80 per share was ap-
proved. This represents a 16% increase compared with
2018.
4
The impact of the corona crisis has had severe conse-
quences for share prices around the world and the market
capitalizations of HOCHTIEF and CIMIC have been sharply
impacted. HOCHTIEF has taken the opportunity to invest
around EUR 100 million in increasing its holding in CIMIC
by about 2.8%, at an average price of AUD 19.2 per share.
Following further share buybacks at CIMIC, the stake now
stands at 76.7%. Overall, HOCHTIEF and CIMIC have spent
EUR 22 million in buying back their own shares in Q1 2020.
We expect these investments will create significant value
for shareholders.
Group OutlookOnce we have better visibility of the consequences of the
corona crisis on the business, we will provide an update to
the 2020 guidance, if required.
Yours,
Marcelino Fernández Verdes
Chairman of the Executive Board
5
To Our Shareholders 3Interim Management Report 6Interim Financial Statements 16Publication Details and Credits 26
OverviewNotwithstanding the impact of the corona crisis, HOCHTIEF
achieved a robust performance in Q1 2020. Operations at
the vast majority of our construction, mining and services
sites have continued and our order book remains at a high
level.
Sales and earningsIn the first quarter of 2020, HOCHTIEF Group sales rose
to EUR 6.2 billion, exceeding the prior-year figure by 7%.
On a foreign exchange rate-adjusted basis, the increase
would amount to 8%.
The HOCHTIEF Americas division generated strong sales
of EUR 3.9 billion in the first three months of the current
fiscal year, based on a record high year-end 2019 order
book.
At CIMIC, sales in the first quarter of 2020 in the amount of
AUD 3.3 billion compared with AUD 3.4 billion in the previous
year. At HOCHTIEF Asia Pacific division level, sales stood at
EUR 1.9 billion additionally impacted by the movement in
the Australian dollar/Euro exchange rate.
The HOCHTIEF Europe division’s sales performance at
the start of 2020 was again driven by a continued disci-
plined bidding approach. In the first quarter of 2020, sales
amounted to EUR 263 million (Q1 2019: EUR 280 million)
with long-term projects progressing according to schedule.
The sales volume generated on markets outside Germany
amounted to EUR 6.0 billion in the first three months of 2020,
which represent 97% of total Group sales.
Net income from equity-method associates, joint ven-tures, and other participating interests amounted to
EUR 34 million in the first quarter of 2020, almost matching
the prior-year level (EUR 36 million). The decline at Abertis
Investment was almost completely offset by improved
earnings contributions from joint ventures.
At EUR 45 million, the net investment and interest ex-penses for the first three months of 2020 were at a similar
level to the previous year (EUR 43 million).
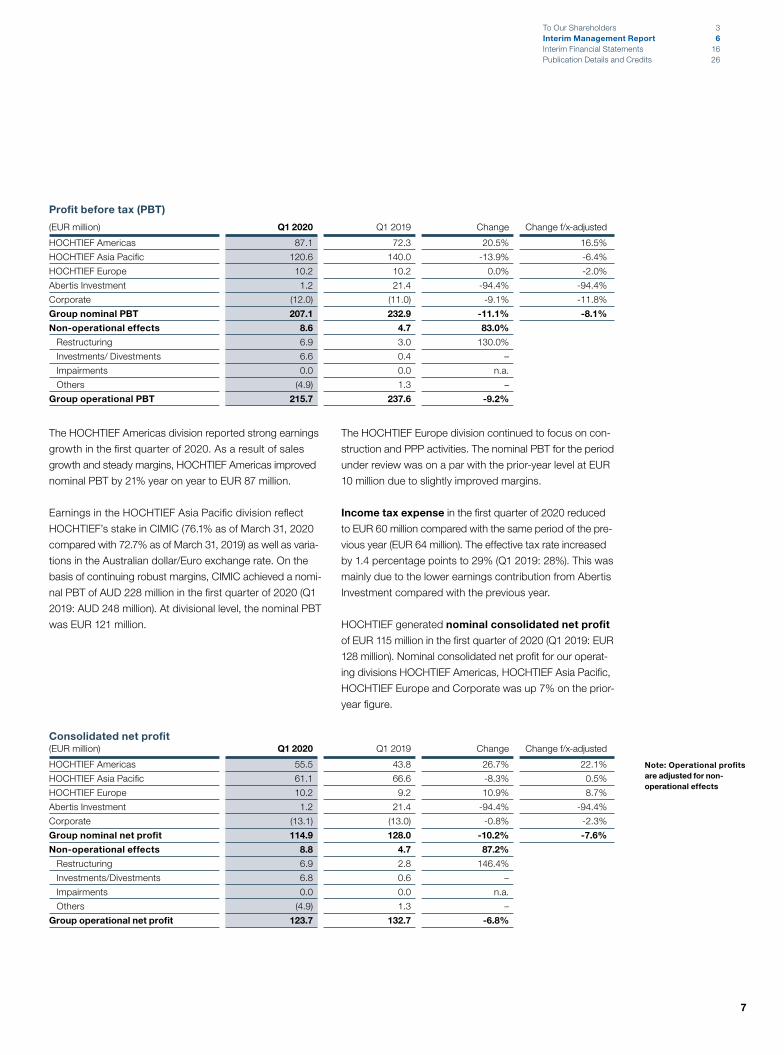
HOCHTIEF generated nominal profit before tax (PBT) of EUR 207 million in the first quarter of 2020. Operation-al PBT (nominal PBT adjusted for non-operational effects)
was EUR 216 million. Temporary lockdown measures in key
markets starting in March 2020 led to a decline in traffic
and toll road revenues at Abertis. The Abertis Investment
PBT contribution therefore reduced to EUR 1 million com-
pared with EUR 21 million in Q1 2019. The operational PBT
for our operating divisions HOCHTIEF Americas, HOCHTIEF
Asia Pacific, HOCHTIEF Europe, and Corporate are stable
Nursing and Health school, Pennsylvania, USACross River Rail, Pacific Partnerships, EUR 3.9 billion, Brisbane, AustraliaMonash Freeway Upgrade, EUR 472 million, Victoria, AustraliaSydney Metro City & Southwest, EUR 2.3 billion, New South Wales, AustraliaCurragh Mine, EUR 806 million, Queensland, AustraliaWestern Sydney Airport, EUR 198 million, AustraliaCampbelltown and Nepean Hospitals, EUR 492 million, New South Wales, AustraliaRail sector contracts, EUR 104 million, New South Wales, AustraliaPort Wakefield to Port Augusta Regional Projects Alliance, EUR 139 million, South AustraliaMaintenance contracts, EUR 277 million, Western Australia and Victoria, AustraliaPerth Metronet, EUR 260 million, Western Australia
Hessian Police, Kassel, GermanyLondon Power Tunnels, GBP 400 million, London, UKDutch A12/A15 motorway project (ViA15), EUR 1.2 billion, vicinity of Arnhem, NetherlandsWaverly (Unity Church Site), Seattle, USAApartment Tower, Oregon, USA Terminal C Orlando International Airport, Florida, USARoute 210, EUR 123 million, California, USALove Field Airport, EUR 113 million, Texas, USAHospital, Ohio, USAResearch Building 4, Ohio, USA
Alter Stand
Cash flow
The cash flow performance in the first quarter of 2020 re-
flects first-quarter seasonality. Net cash from operating
activities amounted to minus EUR 388 million. The Group
generated net cash from operating activities pre-fac-toring of minus EUR 179 million, a strong improvement of
EUR 160 million over the previous year. Over the last twelve
months, net cash from operating activities pre-factoring
amounted to a strong EUR 1.7 billion. Including the effect
from a reduced factoring volume, net cash from operating
activities reached EUR 1.4 billion.
The HOCHTIEF Group’s gross operating capital expen-diture amounted to EUR 106 million in the first quarter of
2020 (92% of which was accounted for by the HOCHTIEF
Asia Pacific division) compared to the prior- year figure of
EUR 117 million. The comparison base is partly impacted
by variations in exchange rates during the quarter. CIMIC’s
capital expenditure remained largely stable compared with
the prior-year period, with most of it accounted for by min-
ing equipment and technical job-costed equipment for tun-
neling projects in the infrastructure business. Proceeds
from operating asset disposals amounted to EUR 6 million,
slightly above the prior-year figure (EUR 4 million). Cash
outflow for net operating capital expenditure was EUR 100
million (Q1 2019: EUR 113 million).
Free cash flow from operations amounted to EUR 884
million over the last twelve months, or over EUR 1.2 billion
on a pre-factoring basis.
Balance sheetThe HOCHTIEF Group’s total assets amounted to EUR
18.9 billion as of March 31, 2020. Compared with the end
of 2019 (EUR 17.9 billion), this represents an increase of
just under EUR 1 billion.
The balance sheet changes in the first quarter of 2020 were
largely influenced by the decline in the Australian dollar/Euro
exchange rate since year-end 2019.
Non-current assets decreased by EUR 354 million to
EUR 5.7 billion in the first quarter of 2020. The main reduc-
tions in intangible assets, property, plant and equipment,
financial assets and deferred taxes were primarily related
to exchange rate movements.
Current assets amounted to EUR 13.2 billion at the end
of the first quarter of 2020, EUR 1.3 billion higher than the
amount as of December 31, 2019. Trade and other receiv-
ables rose by EUR 265 million to EUR 6.6 billion, mainly as
a result of operational growth in the first quarter of 2020.
The volume of marketable securities grew by EUR 185 mil-
lion to EUR 639 million as a result of liquidity investments
by Corporate. HOCHTIEF has a strong liquidity position of
over EUR 6.0 billion as of March 31, 2020.
HOCHTIEF Group shareholders’ equity amounted to
EUR 1.5 billion as of March 31, 2020 (December 31, 2019:
EUR 1.6 billion). The main changes in the first quarter of
2020 related to profit after taxes (EUR 147 million), the effects
of the increased stake in CIMIC and the share buyback
programs at HOCHTIEF and CIMIC (minus EUR 147 million),
and exchange rate effects and other changes not affect-
ing results (minus EUR 102 million).
9
To Our Shareholders 3Interim Management Report 6Interim Financial Statements 16Publication Details and Credits 26
Cash flow
(EUR million)Q1
2020Q1
2019Change LTM1)
04/2019–03/2020
Net cash from operating activities pre-factoring (178.6) (338.1) 159.5 1,718.9
Net cash from operating activities (387.7) (173.9) -213.8 1,388.7
Gross operating capital expenditure (106.1) (116.8) 10.7 (531.8)
Operating asset disposals 6.2 3.6 2.6 27.0
Net operating capital expenditure (99.9) (113.2) 13.3 (504.8)
Free cash flow from operations (487.6) (287.1) -200.5 883.9
Free cash flow from operations pre-factoring (278.5) (451.3) 172.8 1,214.1
1) last twelve months
Non-current liabilities increased by EUR 2.4 billion to
EUR 6.6 billion in the first three months of 2020. This was
primarily due to the use of syndicated credit facilities by
CIMIC and increased the HOCHTIEF Group’s non-current
financial liabilities by a total of EUR 2.4 billion to EUR 5.2
billion. Non-current lease liabilities reported in connection
with the application of IFRS 16 amounted to EUR 475 mil-
lion as of March 31, 2020 (December 31, 2019: EUR 529
million).
Current liabilities amounted to EUR 10.8 billion at the
end of the first quarter of 2020, a decrease of EUR 1.3 bil-
lion compared with the end of 2019. Financial liabilities (exit
from Middle East) decreased by EUR 772 million to EUR
156 million as a result of payments made by CIMIC for finan-
cial obligations of BICC for which CIMIC had provided a
guarantee. Trade payables and other liabilities also de-
creased by EUR 709 million to EUR 8.2 billion due to
seasonal and exchange rate effects.
HOCHTIEF Group’s net debt amounted to EUR 134 mil-
lion as of March 31, 2020. The main factor here was a net
cash effect in connection with the exit from the Middle
East region and the subsequent payment of obligations for
BICC in the amount of EUR 849 million.
Adjusted for this effect, HOCHTIEF Group showed a net cash position of EUR 715 million at the end of the first
quarter of 2020. In addition, net cash during the first quar-
ter was influenced by cash outflow for the purchase of
CIMIC shares as well as share buyback programs which
resulted in investments of EUR 122 million. Adjusted for
these additional effects, HOCHTIEF Group showed a net
cash position of EUR 837 million.
Risk and opportunities reportThere has been no material change in the situation of the
Group with regard to the opportunities and risks1) presented
in our 2019 Group Report.
Report on forecast and other statements relating to the Company’s likely future developmentHOCHTIEF Group’s outlook across core markets remains
positive, we are monitoring shorter-term impacts of the
current situation. Once we have better visibility of the con-
sequences of the corona crisis on the business, we will
provide an update to the 2020 guidance, if required.
1) Our opportunities and risks report is provided starting on page 111 of our 2019 Group Report and on our website, www.hochtief.com.
10
HOCHTIEF Group net cash (+)/net debt (-) development2)
(EUR million)Mar. 31,
2020Mar. 31,
2019Change Dec. 31,
2019
HOCHTIEF Americas 1,155.5 1,010.2 145.3 1,467.4
HOCHTIEF Asia Pacific (531.5) 972.2 -1,503.7 558.6
HOCHTIEF Europe 353.8 249.0 104.8 511.4
Corporate (1,112.1) (1,058.3) -53.8 (1,008.4)
Group (134.3) 1,173.1 -1,307.4 1,529.0
2) For definition, please see Group Report 2019, page 234.
The HOCHTIEF Americas division delivered a strong per-
formance during the first quarter of 2020.
Operational PBT increased by 20% year on year to EUR
88 million. Operational net profit rose 27% to EUR 56 mil-
lion. Sales of EUR 3.9 billion were 20% higher compared
with the previous year, or up 16% in local currency terms
and margins remained steady.
The Americas division continued to deliver solid cash gen-
eration. Net cash from operating activities in the first
quarter reflects the division’s high sales growth as well as
first-quarter seasonality. Over the last twelve months, the
division generated strong net cash from operating activities
of over EUR 600 million.
The divisional net cash position at the end of March 2020
stood at almost EUR 1.2 billion, up EUR 145 million year on
year.
The quarter-end order backlog remained on a very high
level of EUR 23.4 billion, up EUR 1.1 billion or 5% compared
to the previous year, with EUR 15.9 billion of new orders
secured during the last twelve-month period.
In many places, HOCHTIEF companies support govern-
ment action to mitigate the coronavirus pandemic: As the
leading builder of healthcare projects in the United States,
Turner has been called upon to build space to deliver 4,000
urgent patient care beds in 20 locations across the U.S.
New orders in the first quarter at Turner include a 24-story
high-rise building in Portland, Oregon. It will provide space
for 214 apartments as well as offices and retail.
In Philadelphia, Pennsylvania, Turner is responsible for a
new building on the Drexel University campus. Intended as
a College of Nursing and Medicine, the building will include
classrooms, laboratories, treatment rooms, and a simulation
center.
Turner has been awarded a further healthcare-sector con-
tract in Columbus, Ohio—Research Building 4 for the
Nationwide Children’s Hospital.
Columbus is also home to another new building that will
provide additional patient rooms and medical services at
Wexner Medical Center Hospital. Turner previously com-
pleted a building on the site in 2013.
Valued at more than EUR 120 million, Flatiron will renew
Route 210 in Los Angeles.
Flatiron is also refurbishing Taxiway C at Love Field Airport
in Dallas, Texas. The contract value is approximately EUR
113 million.
HOCHTIEF Americas OutlookOnce we have better visibility of the consequences of the
corona crisis on the business, we will provide an update to
the divisional 2020 guidance, if required.
Divisions
HOCHTIEF Americas
Note: Operational profits are adjusted for non- operational effects
11
To Our Shareholders 3Interim Management Report 6Interim Financial Statements 16Publication Details and Credits 26
HOCHTIEF Americas Division: Key Figures
(EUR million)Q1
2020Q1
2019Change Full year
2019
Divisional sales 3,927.6 3,280.3 19.7% 15,327.8
Operational profit before tax/PBT 87.7 72.9 20.3% 320.7
Operational PBT margin (%) 2.2 2.2 0.0 2.1
Operational net profit 56.0 44.2 26.7% 220.4
Nominal profit before tax/PBT 87.1 72.3 20.5% 309.8
Nominal net profit 55.5 43.8 26.7% 212.4
Net cash from operating activities (232.7) (105.0) -127.7 729.8
Gross operating capital expenditure 4.3 9.4 -5.1 33.7
Net cash (+)/net debt (-) 1,155.5 1,010.2 145.3 1,467.4
New orders 2,942.3 3,975.0 -26.0% 16,915.1
New orders LTM 15,882.4 14,702.3 8.0% 16,915.1
Work done 3,749.4 3,155.8 18.8% 14,753.7
Order backlog 23,378.9 22,283.1 4.9% 23,592.9
Employees (end of period) 12,254 11,838 3.5% 12,378
The performance of the HOCHTIEF Asia Pacific division
reflects HOCHTIEF’s stake in CIMIC (76.1% at the end of
March 2020, an increase of 3.4 percentage points year
on year) as well as associated financing and holding costs,
and the impact of variations in the Australian dollar/Euro
exchange rate.
HOCHTIEF Asia Pacific’s profit before tax (PBT) in Q1
2020 was EUR 121 million on sales of EUR 1.9 billion,
both figures impacted by a 7% depreciation of the period-
average Australian dollar/Euro exchange rate. The nominal
PBT margin remained robust at 6.2% and at a similar level
to a year ago (6.5%).
At the end of the period, the divisional net debt position
stood at EUR 532 million, corresponding to a net cash position of EUR 318 million when excluding the cash im-
pacts from exiting the Middle East.
The division’s solid order backlog of EUR 20.1 billion
reflects a steady backlog level at CIMIC’s operating com-
panies as well as foreign exchange rate effects.
CIMIC’s key figuresCIMIC reported revenue of AUD 3.3 billion, compared to
AUD 3.4 billion in the prior-year period. Margins remained
robust during the quarter and PBT stood at AUD 228 mil-
lion. The operating profit remained stable, with higher net
finance costs impacting the quarterly net result. Net profit after tax (NPAT) was AUD 166 million in the first quarter.
CIMIC delivered an underlying cash conversion of 76%
during the last twelve months (LTM), an increase com-
pared to the 38% reported for Q1 2019. Underlying oper-ating cash flow reached a total of over AUD 1.6 billion LTM,
an improvement of AUD 892 million year on year.
The Group invested AUD 157 million in net capital expen-
diture during Q1 2020, on a par with the prior-year level of
AUD 160 million, sustaining mining operations and deliver-
ing job-costed tunneling opportunities. CIMIC’s net debt position of AUD 991 million includes an impact from the
Middle East exit of AUD 1.45 billion gross of tax.
The operating companies’ work in hand remained on a par
with the prior year at AUD 33.9 billion with total work in hand
of AUD 36.1 billion. Whilst maintaining bidding discipline,
total new work of AUD 2.5 billion was secured during the
Currency translation differ-ences and changes in fair value of financial instru-ments – – – – (32,977) (73,026) (106,003) (4,696) (110,699)
Changes from remeasure-ment of defined benefit plans – – – 15,411 – – 15,411 – 15,411
Total comprehensive income – – 114,852 15,411 (32,977) (73,026) 24,260 27,465 51,725
Other changes not recog-nized in the Statement of Earnings – – (125,698) – – – (125,698) (17,913) (143,611)
Balance as of Mar. 31, 2020 180,856 1,711,057 (304,053) (340,877) 61,372 (134,109) 1,174,246 308,867 1,483,113
Accounting policiesThe Interim Consolidated Financial Statements as of and for the three months ended March 31, 2020, which were released
for publication on May 12, 2020, have been prepared in accordance with International Financial Reporting Standards
(IFRS) as endorsed by the EU. In accordance with IAS 34, the reported information is presented in condensed form relative
to the full Consolidated Financial Statements.
This interim report is based on the Consolidated Financial Statements as of and for the year ended December 31, 2019.
Due to a change in capital market interest rates, HOCHTIEF has modified the discount rates for the measurement of
pension obligations as follows as of March 31, 2020:
(In %)Mar. 31,
2020Dec. 31,
2019
Germany 1.76 1.30
USA 2.45 2.98
UK 2.35 2.05
This report has been prepared in all other respects using the same accounting policies as in the 2019 Consolidated
Financial Statements. Information on those accounting policies is given in the Group Report 2019.
Currency translationFor currency translation purposes, the following exchange rates have been used for the main Group companies outside
the Euro zone:
Average Daily average at
reporting date
(All rates in EUR)Q1 2020 Q1 2019 Mar. 31,
2020Dec. 31,
2019
1 U.S. dollar (USD) 0.91 0.88 0.91 0.89
1 Australian dollar (AUD) 0.58 0.63 0.56 0.63
1 British pound (GBP) 1.16 1.16 1.13 1.18
100 Polish złoty (PLN) 22.77 23.29 21.98 23.49
100 Czech koruna (CZK) 3.85 3.89 3.66 3.94
100 Chilean pesos (CLP) 0.11 0.13 0.11 0.12
Changes in the scope of consolidationThe Consolidated Financial Statements for the first quarter of 2020 include three foreign companies for the first time.
Seven foreign companies have been removed from the scope of consolidation.
The number of companies accounted for using the equity method showed a net decrease of three foreign companies in
the first quarter of 2020. In addition, the number of joint operations abroad included in the Consolidated Financial State-
ments increased by one.
The Consolidated Financial Statements as of March 31, 2020 include HOCHTIEF Aktiengesellschaft as well as a total of
45 German and 369 foreign consolidated companies, 16 German and 108 foreign companies accounted for using the
equity method as well as 76 foreign joint operations.
As an independent listed group, HOCHTIEF Aktiengesellschaft, Essen, Germany, Court of Registration: Essen District
Court, HRB 279, publishes its own consolidated financial statements, which are also included in the consolidated finan-
cial statements of ACS, Actividades de Construcción y Servicios, S.A., Madrid, Spain.
Explanatory Notes to the Consolidated Financial Statements
20
Group company CIMICHOCHTIEF increased its stake in CIMIC by 2.77% in the first quarter of 2020 purchasing 8,962,059 shares. CIMIC also
launched its pre-announced stock buyback program in the same quarter, as a result of which HOCHTIEF’s stake in CIMIC
increased in total to 76.06% as of March 31, 2020 (due to subsequently purchased shares in April, HOCHTIEF’s stake in
CIMIC is currently 76.7%). The shares have been canceled by CIMIC on April 24, 2020.
Additional information on cash and cash equivalents, and short-therm financial assets and investments
(EUR thousand)Mar. 31,
2020Dec. 31,
2019
Cash and cash equivalents 5,391,598 4,458,020
Short-term financial assets and investments1) – 2,813
Cash and equivalent liquid assets 5,391,598 4,460,833
1) This balance represents liquid assets converted or readily convertible to cash subsequent to period-end.
(EUR thousand) Q1 2020 Q1 2019
Cash flow from operating activities (387,749) (175,539)
Change in short-term financial assets and investments – 1,639
Net cash from operating activities (387,749) (173,900)
As of March 31, 2020, EUR 263,778 thousand (December 31, 2019: EUR 292,644 thousand) of cash at bank in relation to
the sale of receivables and contract milestone receipts during the reporting period is classified as restricted cash.
Trade receivables and other receivables
(EUR thousand)Mar. 31,
2020Dec, 31,
2019
Trade receivables 3,615,374 3,428,583
Contract assets 2,211,846 2,141,914
Other receivables and other assets 900,610 886,101
6,727,830 6,456,598
Part-performance already invoiced and other contract receivables are accounted for in trade receivables. Performance
not yet billed is accounted for in contract assets if progress payments do not exceed cumulative performance (contract
costs and contract earnings). Where the net amount after deduction of progress payments is negative, the difference is
presented under contract liabilities.
Trade payables and other liabilities
(EUR thousand)Mar. 31,
2020Dec, 31,
2019
Trade payables 6,313,533 7,027,226
Contract liabilities 1,655,145 1,711,755
Other liabilities 273,668 276,595
8,242,346 9,015,576
21
To Our Shareholders 3Interim Management Report 6Interim Financial Statements 16Publication Details and Credits 26
Reporting on financial instrumentsThe fair value of the individual assets and liabilities is stated for each class of financial instrument. The following three-level
fair value hierarchy is applied that reflects the observability of inputs to the valuation techniques used to measure fair value.
Level 1: Quoted prices (unadjusted) in active markets for identical assets or liabilities as input parameter; e.g. quoted
securities.
Level 2: Inputs other than quoted prices included within Level 1 that are observable for the asset or liability, either directly
(i.e., as prices) or indirectly (i.e., derived from prices); e.g. interest rate swaps and forward exchange contracts.
Level 3: No relevant observable inputs available, hence unobservable inputs are determined as an exit price from the
perspective of a market participant that holds the asset or owes the liability; e.g. investments measured at fair
value determined by business valuation.
Within each class of financial instrument, where fair value can be measured reliably, fair value generally corresponds to
carrying amount. The only class of financial instrument for which the two differ is financial liabilities, which have a total
carrying amount of EUR 6,416,976 thousand (December 31, 2019: EUR 3,670,382 thousand) and a fair value of EUR
Current financial calendar:www.hochtief.com/en/investor-relations/financial-calendar
This quarterly report is a translation of the original German version, which remains definitive. It is also available from the HOCHTIEF website.
This quarterly report is printed on eco-friendly Maxi Silk
coated paper certified in accordance with the rules of the
Forest Stewardship Council (FSC).
Publication Details and Credits
This document contains forward-looking statements. These statements reflect the current views, expectations and assumptions of the Executive Board of HOCHTIEF Aktiengesellschaft concerning future events and developments relating to HOCHTIEF Aktiengesellschaft and/or the HOCHTIEF Group and are based on information currently available to the Executive Board of HOCHTIEF Aktien gesellschaft. Such statements involve risks and uncertainties and do not guarantee future results (such as profit before tax or consolidated net profit) or developments (such as with regard to possible future divestments, planned invest-ments or acquisitions, general business activities or business strategy). Actual results (such as profit before tax or consolidated net profit), dividends and other developments (such as with regard to possible future divestments, planned investments or acquisitions, general business activities or business strat egy) relating to HOCHTIEF Aktiengesellschaft and the HOCHTIEF Group may therefore differ materially from the expectations and assumptions described or implied in such statements due to, among other things, changes in the general economic, sectoral and competitive environment, capital market developments, currency exchange rate fluctua tions, changes in international and national laws and regulations, in particular with respect to tax laws and regulations, the conduct of other shareholders, and other factors. Any information provided on dividends is additionally subject to the recognition of a corresponding unappropriated net profit in the published separate financial statements of HOCHTIEF Aktiengesellschaft for the fiscal year concerned and the adoption by the competent decision-making bodies of HOCHTIEF Aktiengesellschaft of appropriate resolutions taking into account the prevailing situation of the Company. Aside from statu tory publication ob-ligations, HOCHTIEF Aktiengesellschaft does not assume any obligations to update any forward-looking statements.