40
Quarterly Report Energy on European Gas Markets Market Observatory for Energy DG Energy Volume 11 (issue 4, fourth quarter of 2018)

Quarterly Report
Energy
on European Gas MarketsMarket Observatory for EnergyDG EnergyVolume 11 (issue 4, fourth quarter of 2018)

DISCLAIMER: This report prepared by the Market Observatory for Energy of the European
Commission aims at enhancing public access to information about prices of electricity in
the Members States of the European Union. Our goal is to keep this information timely and
accurate. If errors are brought to our attention, we will try to correct them. However the
Commission accepts no responsibility or liability whatsoever with regard to the information
contained in this publication.
Copyright notice: Reproduction is authorised provided the source is acknowledged.
© European Commission,
Directorate-General for Energy, Market Observatory for Energy, 2019
Commission européenne, B-1049 Bruxelles / Europese Commissie, B-1049 Brussel –
Belgium
E-mail: [email protected]

1
CONTENT
1. Gas market fundamentals ............................................................................................................. 5
1.1 Consumption ................................................................................................................................ 5
1.2 Production .................................................................................................................................... 9
1.3 Imports ....................................................................................................................................... 10
1.4 Storage ...................................................................................................................................... 16
2. Wholesale gas markets ................................................................................................................... 20
2.1 EU energy commodity markets ................................................................................................. 20
2.2 International gas markets ......................................................................................................... 21
2.2.1 LNG markets ........................................................................................................................... 22
2.3 European gas markets .............................................................................................................. 23
2.3.1. Wholesale markets in the EU ................................................................................................ 23
2.3.2. Wholesale price developments in the EU .............................................................................. 26
2.3.3. Comparing the prices of different contracts for gas in the EU ............................................ 28
3. Retail gas markets in the EU and international price comparison ................................................. 30


2
HIGHLIGHTS OF THE REPORT
In the fourth quarter of 2018 EU gas consumption decreased by 3% compared to the same quarter of 2017,
primarily owing to mild weather in the first months of the heating season and limited industrial energy demand. This was the third quarter in a row, when gas consumption decreased year-on-year. Gas consumption in Q4 2018 in the EU was 142 bcm, while in 2018 as whole it amounted to 474 bcm, down by 1.8% compared to 2017.
Indigenous gas production in the EU fell by 8% in the fourth quarter of 2018 compared to Q4 2017. In 2018 the
total EU production was 120 bcm, also down by 8% compared to 2017. The UK took over Netherlands as biggest gas producer in the EU and the latter country became net gas importer for the first time since Dutch gas production started.
Net gas imports increased by 8% year-on-year in the fourth quarter of 2018, amid decreasing consumption and
production in the EU. Russian pipeline supplies covered 40% of extra-EU imports, down by 2 percentage points year-on-year.
In 2018 the EU imported 363 bcm gas and the total import bill is estimated at 90 billion euros The EU's
estimated gas import bill was around 28 billion euros in Q4 2018, 30% more than a year earlier, mainly due to an increase of 31% in gas import prices between the fourth quarter of 2017 and 2018.
Withdrawals from the storages started at the beginning of the heating season, however, by the end of 2018 stock
levels in the EU were 5.5% higher than a year before, owing to lower withdrawal activity, amid abundant supply on the
spot markets.
EU LNG imports showed a huge increase, up by 59% year-on-year in the fourth quarter of 2018. Price premium of
the Asian LNG markets shrunk and it enabled more cargoes to arrive in Europe. The US and Russia managed to increase significantly their respective import shares in the EU LNG imports in Q4 2018.
European firms, such as the Polish oil and gas company PGNiG recently concluded long term LNG import contracts
with US firms, aiming at diversifying the country's gas import sources. PGNiG concluded three contracts, with a combined
volume of 7.4 bcm of total annual imports as of 2022.
After reaching a five year highs in September, wholesale gas prices in Europe decreased measurably in the fourth
quarter of 2018. Falling oil and decreasing coal prices, abundant LNG supply in Europe and mild weather conditions putting a lid on heating needs all contributed to the decrease in wholesale gas prices. Spot gas prices during Q4 2018 were however higher than forward contracts (price curve in backwardation).
On 5 December 2018 the European Commission adopted a communication, aiming at strengthening the international
role of the euro, including the energy field. Increasing liquidity on the euro-traded gas hubs in the EU contributes to
strengthening the role of the euro in the energy sector.
Retail prices for industrial customers increased by 13% in Q4 2018 on EU average, compared to the same
quarter of 2017, reflecting the impact of higher wholesale prices in the previous quarters filtering in retail contracts.

3
EXECUTIVE SUMMARY
In the fourth quarter of 2018 EU gas consumption was 3% less than in same period of 2017. This was the third quarter in
row when year-on-year gas consumption decreased. Although gas-fired electricity generation was up (by 6.5%) in the EU, milder than usual weather in the first months of the heating season and lower gas demand in energy intensive industries have contributed to the overall decrease in consumption. In absolute level, gas consumption in Q4 2018 amounted to 142 bcm, down from 146 bcm a year earlier. In 2018 as whole, gas consumption in the EU was 474 bcm, down by 1.8% compared to 2017, when it amounted to 483 bcm.
EU gas production fell by 8% year-on-year in the fourth quarter of 2018; amounting to 30 bcm. Gas production in the
Netherlands fell by 16% and in the UK it also decreased, by 6%. In 2018 total EU gas production amounted to 120 bcm, 8% less than in 2017 (131 bcm). In 2018 the UK took over the Netherlands as biggest gas producer in the EU. For the first time since the gas extraction started in the Netherlands, the country became in 2018 a net gas importer (around 7 bcm), which is a significant change compared to 2013, when its net export position amounted to 40 bcm.
In parallel with decreasing consumption, EU gas net imports rose by 8% in the fourth quarter of 2018 compared to
Q4 2017. Imports from Russia decreased by 6% year-on-year, while Norwegian imports also went down by 4%. Imports from Algeria decreased by 17% while those from Libya rose by 10%. At the same time LNG imports reached the highest over the last five years and ensured 18% of the total extra-EU gas imports. In Q4 2018 the total net EU gas import was 100 bcm, while in 2018 it amounted to 363 bcm, up by 3% (by 10bcm) compared to 2017.
Russian pipeline supplies remained the main source of EU imports, covering 40% of extra-EU imports in Q4 2018, down by
2 percentage points compared to the same period of 2017, and the lowest since Q1 2016. It was followed by Norwegian pipeline imports (32%), LNG imports (18%) and pipeline supplies from North Africa (10%). The EU's estimated gas import bill rose to around 28 billion euros in the Q4 2018, 30% more than a year earlier. In 2018 the EU import gas bill is estimated to 90 billion euros, up from 75 billion euros in 2017, primarily owing to increasing import gas prices compared to 2017.
In the fourth quarter of 2018, Ukraine remained the main supply route of Russian pipeline gas to the EU, covering 39% of
the total Russian supplies (16 bcm). The share of Nord Stream was 36% (14 bcm) while gas supplies transiting Belarus covered 25% (10 bcm) in the total EU imports from Russia. In 2018 the Ukrainian supply route covered 41% of the Russian imports (64 bcm), while Nord Stream had a share of 34% (54 bcm) and gas supplies transiting Belarus covered 25% (39 bcm).
The European Commission approved Bulgarian and Greek plans to support the construction and operation of a natural gas
interconnector (IGB) to be in line with EU State aid rules in November 2018. The gas interconnector will be capable to transport 3 bcm of natural gas per year from Greece to Bulgaria by 2021, improving regional security of gas supply.
EU LNG imports showed a huge increase in the fourth quarter of 2018, up by 59% in year-on-year comparison. After a
summer period with very low LNG send-outs, shrinking price premiums of the Asian LNG markets enabled more cargos to arrive in Europe in Q4 2018. Increasing LNG imports resulted in a shift of supply sources, as the share of Qatar and Nigeria in total extra-EU imports dropped from the previous quarter (to 22% and to 14%), while Russia became the second most important LNG source (17%) and the share of the United States quadrupled, reaching 12% in Q4 2018.
New long term LNG contracts were signed between European and US companies in the fourth quarter of 2018. The
Polish oil and gas company PGNiG concluded three contracts in with LNG suppliers in October, November and December 2018, with a total volume of 7.4 bcm per year as of 2022. The total volume of new contracts equals around 70% of Poland's total gas imports on the Yamal pipeline. Over the next couple of years total liquefaction capacities in the US are expected to grow well above 100 bcm (from the current 39 bcm), giving potentially more room for European LNG imports from the US.
Gas storage withdrawals started in Q4 2018 at the beginning of the heating season. However, due to limited withdrawal
activity, owing to the mild weather with less heating needs and abundant LNG supply in the European gas grid, by the end of December 2018 the average storage level stood at 70%, 5.5% above the level at the end of 2017.
After reaching a five-year peak in September 2018, spot prices at European gas hubs showed a measurable decrease in
the fourth quarter of 2018. Oil prices underwent a steep fall in Q4 2018, and coal prices also decreased slightly. Gas prices in
Europe were mainly impacted by the mild weather and abundant LNG supply. Oil-indexed gas prices continued to increase, following the time-lag of high crude oil prices in the previous two quarters. At international level, most of the European and Asian gas prices decreased, with shrinking premium to US Henry hub price, which reached four-year high in November 2018.
Liquidity on European gas hubs increased by 12% in the fourth quarter of 2018 in year-on-year comparison. The share of the
Dutch TTF hub in the total EU trade rose to 62% (7 712 TWh), while that in UK NBP fell to 26% (3 193 TWh), ensuring growing lead to TTF. Over-the-counter (OTC) trade (bilateral and cleared) ensured 70% of the total trade in the EU. As from 1 November 2018 the two French markets (PEG Nord and TRS) were merged, creating a new single market called TRF (Trading Region France) the volume picked up and showed the highest increase compared to Q4 2017 among all regional gas hubs in Europe.
On 5 December 2018 the European Commission adopted its communication on 'Towards a stronger international role
of the euro'. On the top of this communication a recommendation on the role of the euro in the field of energy was published,

4
aiming at promoting the wider use of euro, amongst others, in energy-related transactions of European market participants. Trading on European gas markets is already increasingly carried out in euro, enough to think on the rapidly increasing liquidity on the TTF gas hub.
Retail gas prices for household customers remained stable in Q4 2018. However, the retail industrial gas prices rose by
13% year-on-year in the EU, as the impact of high wholesale prices in the previous quarters filtered in the retail contracts.

5
1. Gas market fundamentals
1.1 Consumption
EU gas consumption in the fourth quarter of 2018 decreased by 3% in year-on-year comparison, after showing a decrease of 8% in Q2 2018 and that of 5% in the Q3 2018, compared to the same quarter of the previous year. In absolute level, the quarterly consumption in Q4 2018 amounted to 141.5 bcm, down from 145.6 bcm in Q4 2017. Although gas-fired electricity generation increased in Q4 2018 in year-on-year comparison, the weather across Europe was generally milder than usual in the last quarter of 2018, explaining less gas consumption related heating needs. In 2018 as whole, total gas consumption in the EU was 474 bcm, down by 1.8% compared to 2017, when it amounted to 483 bcm. In 2018 gas consumption was only higher in February and March, characterised by cold weather, compared to the same month of 2017.
Figure 1. EU gas consumption
Source: Eurostat, data as of 20 February 2019 from data series nrg_103m. Data missing for the Netherlands in December 2018 are calculated by using short term monthly gas data (nrg_ind_343m,) as proxy.
Figure 2. Year-on-year change in EU gas consumption in each quarter (%)
Source: Eurostat, data as of 20 February 2019 from data series nrg_103m. Data missing for the Netherlands in December 2018 are calculated by using short term monthly gas data (nrg_ind_343m,) as proxy. Calculations of DG Energy; based on consumption measured in bcm.

6
In the fourth quarter of 2018, the biggest year-on-year increase in gas consumption could be observed in Malta (88%, though amid very low volumes – 0.15 bcm), followed by Finland (14%). The biggest year-on-year decrease occurred in Denmark (19%). Gas consumption decreased in all of the six largest consumers in the EU: in Italy (by 9%), France (8%), Spain (4%), the Netherlands (3%), UK (2%) and Germany (1%). In Croatia and Slovenia gas consumption also decreased (by 4% in both countries). In contrast, gas consumption went up in Slovakia, Greece and Romania (8% each) and in Belgium (4%).,while in the remaining 13 countries the year-on-year rate of change in gas consumption was less than 3% in Q4 2018.
In 2018 the biggest annual rate of increase in gas consumption could be observed in Malta (+42%) and Finland (+11%), and the biggest decreases were in Denmark (-9%) and in Croatia (-8%), compared to 2017. Measured in billion cubic meters, the biggest decreases could be observed in Germany (-4.5 bcm) and Italy (-2.5 bcm), while in the UK the gas consumption went up by 1.5 bcm.
In absolute numbers, gas consumption in Q4 2018 decreased by 2 bcm in Italy, by 1.2 bcm In France, by 0.5 bcm in the UK, and by 0.4 bcm in Spain, while in Romania and Belgium it respectively increased by 0.3 bcm, and 0.2 bcm, compared to the same period of 2017. In the other Member States the change in gas consumption remained below 0.2 bcm over this period.
Figure 3 Year-on-year change in gas consumption in the fourth quarter of 2018
Source: Eurostat, data as of 20 February 2019 from data series nrg_103m. Data missing for the Netherlands in December 2018 are calculated by using short term monthly gas data (nrg_ind_343m,) as proxy. Calculations of DG Energy; based on consumption measured in bcm.
Economic growth continued to decelerate in the EU, and in the fourth quarter of 2018 GDP grew by only 1.4% in year-on-year comparison1, practically halving since the second half of 2017, and being the slowest in the last five years. The growth in industrial activity also continued to slow down (and the gross value-added in the manufacturing industry even decreased, by 0.5%) in Q4 2018, implying less need for energy in the industrial sector. This might also have impacted the consumption of natural gas at the end of 2018 in the EU.
1 Source: Eurostat, data as of 7 March 2019 from data series namq_10_a10; seasonally and calendar adjusted data

7
Figure 4 EU GDP Q/Q-4 change (%)
Source: Eurostat, data as of 7 March 2019 from data series namq_10_gdp - Seasonally and calendar adjusted data
Figure 5 shows the deviation of actual heating degree days (HDDs) from the long-term average in individual EU Member States in the fourth quarter of 2018. October 2018 was generally milder than usual in most of the EU countries, though in the Iberian-peninsula temperatures were lower than usual. Nevertheless, November and December 2018 were largely mild across the European continent, implying a lower-than-usual residential demand for natural gas in the first months of the heating season.
Figure 5 Deviation of actual heating degree days from the long-term average in the fourth quarter of 2018
Source: Joint Research Centre (JRC), European Commission
Based on ENTSO-E data, gas-fuelled power generation was up by 6.5% in the fourth quarter of 2018 compared to the same period of 2017. As coal prices remained high (though slightly decreased) during the fourth quarter of 2018, and natural gas prices became lower, the competitiveness of gas-fired generation improved vis-à-vis coal in Q4 2018. Carbon emission allowance prices rose further over Q4 2018, reaching as high as 25€/tCO2e by the end of the year, which resulted in a further squeeze-out of coal (due to less carbon intensive electricity generation for gas than coal for the production of 1 MWh electricity). Increasing demand for electricity could not be fully satisfied from increasing renewable generation, so the incremental power need was met by the growing use of natural gas.

8
In Italy, the Netherlands and Belgium the amount of electricity generated from gas respectively increased by 7%, 5% and 21% in Q4 2018 in year-on-year comparison, owing to changes in the local power generation mix (in Italy and the Netherlands dwindling renewable generation was replaced by natural gas, whereas in Belgium missing generation from nuclear capacities was partially compensated by gas). However, in the UK, Spain and France gas fired generation decreased in Q4 2018 (respectively by 3%, 15% and 16%) compared to the same quarter of 2017, owing to increasing renewable generation in the three countries and improving hydro availability in Spain and increasing nuclear generation in France.
Figure 6 Gas-fuelled power generation in the EU
Source: Based on data from the ENTSO-E Transparency Platform, data as of 13 February 2019.
UK clean spark spreads – measuring the profitability of gas-fired generation by taking into variable costs – averaged 6.4 €/MWh in the fourth quarter of 2018, which was similar to the previous quarter, and slightly lower than a year before (7.3 €/MWh), implying that gas-fired generation in the UK remained profitable in 2018 (see Figure 7). The share of gas in power generation was 39.4% in the UK in the fourth quarter of 2018, measurably less than in Q4 2017 (44.9%). However, in 2017 and 2018 the annual share of gas in the UK electricity generation mix was similar (43-44%).
Clean spark spreads in Germany averaged practically 0 €/MWh in the fourth quarter of 2018; in October it was in the negative range, but in November and December, owing to decreasing gas prices, it became positive again.2. Gas-fired generation in Germany was barely profitable in Q4 2018, and in 2018 as whole the average clean spark spread was -3 €/MWh.
2 Charts of clean spark spreads in Germany and the UK can be found in the Quarterly Report of European Electricity Markets. Data on the share of gas in electricity generation come from the database of ENTSO-E

9
Figure 7 Clean spark spreads in the United Kingdom and Germany
Source: S&P Platts Global
1.2 Production
In the fourth quarter of 2018, EU gas production was 30.3 bcm, 8% (3.5 bcm) less than in the same period of 2017. During the whole Q4 2018 gas output was outside the 2014-2017 range, reinforcing the decreasing trend of domestic production in the EU. In the UK gas production dropped only by 6%, in the Netherlands it fell by 16% in Q4 2018 in year-on-year comparison. Looking at the following six largest producers, gas output decreased in Denmark (-13%), Ireland (-11%), Germany (-8%), Italy (-6%), Romania (-6%). Poland (-1%).
In 2018 as whole, total EU gas production amounted to 120 bcm, 8% less than in 2017 (131 bcm). The biggest decrease in 2018 could be observed in the Netherlands, were production decreased by more than 6 bcm (13%) compared to 2017. In 2018 the United Kingdom took over the Netherlands3 as the largest EU producer with a quarterly production of 40.7 bcm (whereas the Netherlands produced slightly less, 40.3 bcm).
3 In some countries (e.g.: NL) data were not available for December 2018, implying that when final data replace the estimations, the quarterly consumption data can change retrospectively

10
Figure 8 EU gas production
Source: Eurostat, data as of 20 February 2019 from data series nrg_103m. Data missing for the Netherlands in December 2018 are calculated by using short term monthly gas data (nrg_ind_343m,) as proxy.
1.3 Imports
In parallel with EU consumption decreasing by 3% in the fourth quarter of 2018, Eurostat data show that net imports4 in this period increased by 8% compared to the same period of 2017. In most of the EU countries net imports increased measurably in Q4 2018, however, among the bigger gas consumers it decreased in Italy (11%), France (6%) and in Spain (4%) over the same period of the previous year. In the Netherlands net gas imports amounted to 1.3 bcm in Q4 2018, however, in the same period of 2017 the country was a net gas exporter (3.3 bcm).
In the fourth quarter of 2018 the total net EU gas imports reached 100 bcm, while in the same period of 2017 it was only 92 bcm. In 2018 as whole, net gas imports in the EU was 363 bcm, up from 353 bcm in 2017. Taking into the annual gas consumption (474 bcm) net imports covered 77% of the total gas consumption5.
In 2018 the Netherlands, for the first time since the beginning of natural gas production in the country, became net importer of gas, and net imports amounted to 7.3 bcm, whereas a year before the volume of Dutch net gas exports was 1.8 bcm. Figure 9 shows how significant was the change in the net gas exporter position of the Netherlands over the last few years. In the first decade of this century the annual Dutch net gas exports varied between 22 bcm and 35 bcm. In 2013 the net gas exports exceeded 40 bcm and the Dutch income from gas exports was around € 10bn that time.
Since then the country's net gas trade position has changed by almost 50 bcm gas per year, which is significant even at the EU level, considering the total net EU gas imports in 2018, which has implications on the European gas import dependency and security of supply.
4 Net imports equal imports minus exports and do not account for stock changes. 5 Without taking into account the impact of stock changes

11
Figure 9 Net natural gas exports from the Netherlands, measured in bcm and euros
Source: Eurostat and Dutch statistical office6
According to ENTSO-G data, imports amounted to 1 114 TWh in the fourth quarter of 2018, 1% less than in Q4 2017. Imports from Russia, Norway and Algeria decreased measurably, while those from Libya imports went up by 10%. At the same time, LNG imports showed a huge increase, and reached 200 TWh in Q4 2018.
Russia remained the top pipeline gas supplier of the EU, covering around 40% of total extra-EU imports in the fourth quarter of 2018, 2 percentage points less than in the same period of 2017 and the lowest quarterly share since the first quarter of 2016. In Q4 2018 gas imports from Russia decreased by 6% in year-on-year comparison.
Imports from Norway, the EU's second gas supplier, decreased by 7% year-on-year in the fourth quarter of 2018, and the country's share in extra-EU gas imports also decreased slightly to 32% (from 34 in Q4 20177). In the fourth quarter of 2018, Norwegian gas production amounted to 31.3 bcm, 4.3% less than in the same period of the previous year.8
Imports from Algeria decreased measurably, by 17% in the fourth quarter of 2018 compared to the same period of 2017, after registering a 20% increase year-on-year in Q3 2018. The combined share of Algeria and Libya from total extra-EU imports was 9.6% in the fourth quarter of 2018, slightly down compared to the same period of 2017 (11.1%).
According to ENTSO-G data, imports of LNG increased significantly in the fourth quarter of 2018 in year-on-year comparison and covered 18% of total extra-EU gas imports, being the highest quarterly share in the last five years.
In 2018 as whole, Russia remained the biggest pipeline gas supplier of the EU, with a share of 43%, followed by Norway (33%), Algeria (9%) and Libya (1%). LNG ensured 14% of the EU's natural gas imports. These import shares showed only minor changes compared to 2017. In 2018 gas imports from Russia and Algeria were slightly up by 1%, while imports from Norway decreased by 2% and from Libya by more than 4%. LNG imports remained practically the same in 2018 as a year before.
Import volumes of natural gas slightly decreased from 1 123 TWh to 1 114 TWh in the fourth quarter of 2018 compared with the same period of 2017, while at the same time the estimated average import price went up by 31%, from 19.1 €/MWh to 25.1 €/MWh. As a result, the EU's estimated gas import bill increased by 30% year-on-year, reaching around 28 billion euros in the fourth quarter of 2018. In 2018 the EU import bill is estimated to have reached 90 billion euros, up from 75 billion euros in 2017, primarily owing to higher gas prices, as the imported amount of gas remained practically the same as in 2017.
6 See at https://www.cbs.nl/nl-nl/nieuws/2019/11/2018-eerste-handelstekort-in-aardgas (in Dutch) 7 Note that Norway to UK flows reported by ENTSO-G includes some gas from UK offshore fields, resulting in an overestimation of Norwegian imports. 8 https://www.npd.no/globalassets/1-npd/fakta/nyheter/produsjonstall/2019/februar2019/data-feb-20191.xlsx

12
Figure 10 EU imports of natural gas by source, 2015-2018
Source: Based on data from the ENTSO-G Transparency Platform, data as of 13 February 2019. Russian deliveries to Estonia and Latvia are reported for a limited period (Narva from 15 June 2015 to 10 December 2015, Värska and Misso Izborsk from 26 May 2015). Therefore currently exports to the Baltic states and Finland are not included in the chart Russia, Norway, Algeria and Libya include pipeline imports only; LNG imports coming from these countries are reported in the LNG category. Norway to UK flows reported by ENTSO-G include some gas from UK offshore fields, resulting in an overestimation of Norwegian imports.
Figure 10 depicts EU gas imports from Russia on the three main supply routes: Ukraine (which includes the Brotherhood Pipeline and the Balkan route), Belarus (mainly the Yamal pipeline) and Nord Stream.
In the fourth quarter of 2018, the volume of Russian imports decreased by almost 6%, if compared with the same period of 2017. Gas flows transiting Ukraine were 8% lower than in Q4 2017, while flows through Belarus decreased by 6% and the Nord Stream flows by 2%. However, Ukraine continued to be the main supply route of Russian gas to the EU, and ensured 39% of Russian gas imports to Europe, followed by Nord Stream (36%) and the Belarus transit route (25%) in Q4 2018. In November 2018 the share of the Ukrainian transit and Nord Stream was almost identical (37%).
In 2018 as whole, the Ukraine transit route represented 41% of the Russian pipeline gas imports, followed by Nord Stream (34%) and the Belarus transit (25%). In year-on year comparison, the volume of gas transit through Nord Stream was up by 14% in 2018, whereas transit through Ukraine was down by 7%, owing to lower than usual flow volumes in January-February 20189. Gas transit flows through Belarus remained practically unchanged compared to 2017.
In the fourth quarter of 2018, Ukraine continued to rely on imports from the EU. Gas flows coming from Hungary, Poland and Slovakia reached about 2.5 bcm in this period, 25% (or by 0.8 bcm) less than in the same period of 2017. During the three months of Q4 2018, following the seasonal pattern that could be observed over the last few years, deliveries from Hungary increased compared to the same quarter of 2017, while volumes from Slovakia decreased. However, imports from the latter remained the most important supply route of Ukrainian imports from the EU10, representing around 57% of the total Ukrainian imports from EU countries, whereas Hungary had a share of 36%. Increase in Hungarian exports to Ukraine was helped by beneficial export tariffs, compared to the costs of exports from Slovakia and Poland.
9 See in Quarterly report on European gas markets, vol 11, issue 1: https://ec.europa.eu/energy/sites/ener/files/documents/quarterly_report_on_european_gas_markets_q1_2018.pdf 10 Based on data from the ENTSO-G Transparency Platform, data as of 13 February 2019.

13
Figure 11 EU imports of natural gas from Russia by supply route, 2015-2018
Source: Based on data from the ENTSO-G Transparency Platform, data as of 13 February 2019. Deliveries to Estonia, Finland and Latvia are not included; transit volumes to the Former Yugoslav Republic of Macedonia, Serbia and Turkey are excluded
On 8 November 2018 the European Commission has found Bulgarian and Greek plans to support the construction and operation of a natural gas interconnector to be in line with EU State aid rules11. The project will contribute to the security and diversification of EU energy supplies without unduly distorting competition. The Commission will support the construction and operation of a 182 kilometres cross-border gas interconnector (called "IGB") between Greece (Komotini) and Bulgaria (Stara Zagora). The gas interconnector is designed to transport 3 bcm of natural gas from Greece to Bulgaria by 2021. The total investment cost for the realisation of the IGB interconnector amounts to €240 million, of which €155 million will be provided by European institutions in a form of direct contributions and guaranteed loans.
On 17 December 2018 The European Commission has fined Bulgarian Energy Holding (BEH), its gas supply subsidiary Bulgargaz and its gas infrastructure subsidiary Bulgartransgaz (the BEH group) for €77 million for blocking competitors' access to key gas infrastructure in Bulgaria, in breach of EU antitrust rules12. Between 2010 and 2015 the BEH Group blocked the access to the domestic Bulgarian gas transmission network, to the only gas storage facility in Bulgaria and to the only import pipeline bringing gas into Bulgaria, which was fully booked by BEH. This move from the European Commission clearly shows how equal access to infrastructure and level playing field in the energy markets are important to ensure maximum consumer welfare.
After a year-on-year decrease of 8% in the third quarter of 2018, EU LNG imports showed a significant increase in Q4 2018, up by 59% compared to the fourth quarter of 2017. With the exception of Spain and Greece, where slight decreases could be observed (respectively 8% and 1%), all European LNG importing countries showed double or triple digit increases compared to Q4 2017. In the UK and Belgium the year-on-year increase rates were respectively 174% and 293%, while in Italy (84%), Poland (74%), Portugal (46%), and France (39%) rise in imports was also significant. In the Netherlands, though comparing with a very low base in Q4 2017, LNG imports were up by almost 1700% in the fourth quarter of 2018.
In the fourth quarter of 2018 price premium of East-Asian LNG markets to Europe was less significant compared with the similar periods over the last two-three years (see Figures 18 and 19), implying that Europe offered a competitive destination for LNG cargos, picking up after an unusual summer period with very low imports.
11 http://europa.eu/rapid/press-release_IP-18-6342_en.htm 12 http://europa.eu/rapid/press-release_IP-18-6846_en.htm

14
Figure 12 LNG imports to the EU by Member State
Source: Commission calculations based on tanker movements reported by Thomson Reuters "Other" includes Finland, Malta and Sweden
In the fourth quarter of 2018, Qatar remained the largest LNG supplier of the EU, though its market share decreased from 43% to 22% from the previous quarter. This steep decrease in Qatar's import share signalled a remarkable shift in supply sources, in parallel with increasing imports. Russia became the second most important LNG supply source, increasing its share to 17% (from 7% in Q3 2018). The share of Nigeria decreased to 14% (from 17% in the previous quarter), while the share of the United States practically quadrupled (to 12% from 3%). Among other LNG sources Algeria (10%), Norway (7%) and Trinidad and Tobago (4%) are worth to be mentioned.
In the fourth quarter of 2018, Qatar was the biggest import source (more than 50% of the imports) in the Belgium, Poland and Italy. Nigeria was the biggest LNG supplier in Portugal (50%) and Spain (29%). Algeria was the largest LNG supplier of Greece (73%) and France (25%). Norway was the sole LNG supplier of Lithuania. Spain had the most diversified portfolio: it received LNG from nine extra-EU suppliers, with Nigeria having the biggest market share (29%). Russia became an important supplier to the Netherlands (51%) and to the United Kingdom (31%). United States became also a key supplier in the UK (ensuring 28% of the total UK LNG imports).

15
Figure 13 LNG imports to the EU by supplier
Source: Commission calculations based on tanker movements reported by Thomson Reuters Imports coming from other EU Member States (re-exports) are excluded "Other" includes Angola, Brazil, the Dominican Republic, Egypt, Equatorial Guinea, Oman, Russia, Singapore and the United Arab Emirates
In the fourth quarter of 2018 twenty-nine LNG cargoes arrived from the US, unloading more than 2.5 bcm (in re-gasified form) of LNG. Both the number of cargos and LNG import volumes were significantly up compared to Q4 2017 (in that quarter only 5 cargos arrived, carrying less than 0.5 bcm LNG). LNG exports to the EU represented 32% of total US LNG exports in Q4 2018. In the last quarter of 2018 the major EU destinations of the US LNG exports were the United Kingdom, Italy, France and Spain.
US liquefaction capacities increased measurably in 2018 and reached an estimated 39 bcm (up from 28 bcm at the end of 2017). New capacities include new trains at Sabine Pass and Corpus Christi (both with 4.5 mtpa – roughly 6 bcm capacities). With projects under development, the total liquefaction capacity is expected to exceed 100 bcm per year by 202113, implying that US LNG exports will not face any obstacles to expand from liquefaction infrastructure side. Besides increasing infrastructure capacities in the US, there have been several contracts in EU countries over the recent period, aiming at diversifying their gas supply sources. In the summer of 2018, European Commission President Juncker and US President Trump agreed to strengthen the strategic cooperation with respect to energy, which would be of particular interest in Europe, given security of gas supply and import source diversification aspect.
In the fourth quarter of 2018 the Polish state-owned oil and gas company PGNiG concluded contracts with different US based companies on long term LNG shipments (e.g: with Venture Global in October, with Cheniere in November and Sempra Energy in December), which provide for competitive priced contracts compared to Russian pipeline imports and would contribute to import source diversification14. The three contracts altogether could result in a combined import of 7.4 bcm natural as of 2022, equalling more than 70% of the volume of the current Yamal import contract on Russian gas.
These recent developments give a perfect example on the role of LNG in gas supply diversification, if the price offer is competitive enough to bring a new alternative to current market conditions.
Meanwhile, Russia, beyond the traditional pipeline exports, aims at increasing its share on the European LNG market, and this was helped by the new Yamal liquefaction terminal (with a capacity of 5.5 mpta – roughly 7.5 bcm), which contributed to the visible increase of Russian LNG imports in the EU. However, during the summer period a part of the LNG from the Yamal terminal is likely to be re-routed towards Asia, given the better accessibility of the Arctic waterways.
13 Source: US Energy Information Administration: https://www.eia.gov/naturalgas/data.php#imports 14 See more in ICIS Gas Focus, 15 November 2018 and https://www.reuters.com/article/sempra-usa-poland/sempra-energy-to-supply-lng-to-poland-idUSL3N1YO3JM

16
Figure 14 EU LNG imports from the US
Source: Commission calculations based on tanker movements reported by Thomson Reuters
1.4 Storage
Figure 13 shows EU stock levels as the percentage of storage capacity in gas years 2018 and 2019, compared to the 5-year range of gas years 2014-2018. According to figures published by Gas Infrastructure Europe, EU storage capacity amounted to 1,131 TWh (roughly 100 bcm) by the end of 201815.
On average, net withdrawals made during the fourth quarter of 2018 were equivalent to 12.4% of storage capacity, which was less than 19.7% in the same period of 2017): the average filling rate decreased from 82.7% on 30 September 2018 to 70.4% on 31 December 2018. As result, at the end of December 2018 the average filling rate in the EU was 5.5% higher than a year before, though at the beginning of Q4 2018 it was still 1.8 percent less than at the beginning of Q4 2017.
As it was mentioned before, the weather was mild usual during the whole Q4 2018 in most of the European countries, which resulted in lower than usual heating related gas demand that contributed to less withdrawal from gas storages. The withdrawal season (the time when storages switch to withdrawal from injection) started at the end of October 2018. Moreover, given the abundant LNG send-out to many countries of Europe, the gas grid had to rely much less on storage withdrawals, as competitively priced LNG was disposable to satisfy the need for natural gas. Decreasing spot market prices in Q4 2018 and abundant supply also made a reasonable choice for market operators to prefer relying on the spot market to storage volumes injected at higher costs in the previous two quarters.
15
https://www.gie.eu/maps_data/downloads/2018/Storage_DB_Dec2018.xlsx

17
Figure 15 Gas storage levels as percentage of maximum gas storage capacity in the EU in the middle of the month
Source: Gas Storage Europe AGSI+ Aggregated Gas Storage Inventory, extracted on 8 March 2019. See explanations on data coverage at https://agsi.gie.eu/#/faq. The 5-year range reflects stock levels in gas years 2014-2018. The graph shows stock levels on the 15th day of the given month.
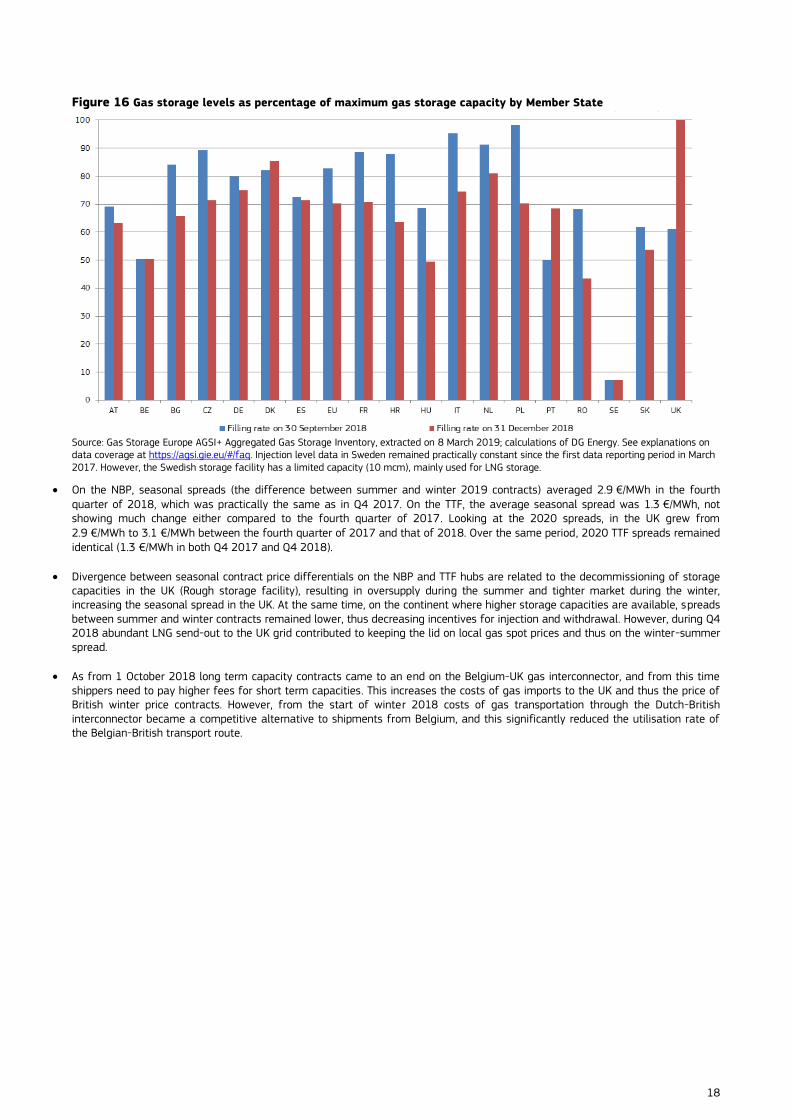
However, as Figure 14 shows, there was a significant variation among Member States in terms of both the starting position (the filling rate at the end of September 2018) and the pace of withdrawals. Although the average change in the filling rate over Q4 2018 was 12.4%, in Poland, Croatia, Romania and Italy the decrease in the storage filling rates exceeded 20% and in France and Czechia it was close to 18%. In the Netherlands, Germany and Spain the decrease in the filling rate was smaller (respectively 10%, 5% and 1%).
Interestingly, in the UK the storage filling rate was close to 100% at the end of December16, showing an unusual increase over Q4 2018 (by almost 40 per cent). During the heating season UK storages switched back several times from withdrawals to injection (e.g.: between 9 and 19 November and 21 and 31 December), primarily owing to abundant LNG send-out in the UK gas grid.
Besides the UK, Denmark and the Netherlands had the highest filling rates on the last day of 2018 (both above 80% of their capacity). On the other hand, storage levels were barely higher than 50% in Belgium (and remaining unchanged from the last quarter's level), and in Hungary and Romania they were in the range of 40-50% of their total capacity.
16 Without counting the decommissioned Rough storage facility
18
Figure 16 Gas storage levels as percentage of maximum gas storage capacity by Member State
Source: Gas Storage Europe AGSI+ Aggregated Gas Storage Inventory, extracted on 8 March 2019; calculations of DG Energy. See explanations on data coverage at https://agsi.gie.eu/#/faq. Injection level data in Sweden remained practically constant since the first data reporting period in March 2017. However, the Swedish storage facility has a limited capacity (10 mcm), mainly used for LNG storage.
On the NBP, seasonal spreads (the difference between summer and winter 2019 contracts) averaged 2.9 €/MWh in the fourth quarter of 2018, which was practically the same as in Q4 2017. On the TTF, the average seasonal spread was 1.3 €/MWh, not showing much change either compared to the fourth quarter of 2017. Looking at the 2020 spreads, in the UK grew from 2.9 €/MWh to 3.1 €/MWh between the fourth quarter of 2017 and that of 2018. Over the same period, 2020 TTF spreads remained identical (1.3 €/MWh in both Q4 2017 and Q4 2018).
Divergence between seasonal contract price differentials on the NBP and TTF hubs are related to the decommissioning of storage capacities in the UK (Rough storage facility), resulting in oversupply during the summer and tighter market during the winter, increasing the seasonal spread in the UK. At the same time, on the continent where higher storage capacities are available, spreads between summer and winter contracts remained lower, thus decreasing incentives for injection and withdrawal. However, during Q4 2018 abundant LNG send-out to the UK grid contributed to keeping the lid on local gas spot prices and thus on the winter-summer spread.
As from 1 October 2018 long term capacity contracts came to an end on the Belgium-UK gas interconnector, and from this time shippers need to pay higher fees for short term capacities. This increases the costs of gas imports to the UK and thus the price of British winter price contracts. However, from the start of winter 2018 costs of gas transportation through the Dutch-British interconnector became a competitive alternative to shipments from Belgium, and this significantly reduced the utilisation rate of the Belgian-British transport route.

19
Figure 17 Winter-summer spreads in the Dutch and British gas hubs
Source: S&P Global Platts W-S 2018 refers to the difference between the winter 2018-19 price and the summer 2018 price; W-S 2019 refers to the difference between the winter 2019-20 price and the summer 2019 price, W-S 2020 refers to the difference between the winter 2020-21 price and the summer 2020 price.

20
2. Wholesale gas markets
2.1 EU energy commodity markets
The price of Brent crude, reaching a four-year high at the beginning of October 2018, showed a steep decrease by the end of 2018 (falling from 86 USD/bbl – 74 €/bbl to barely 53 USD/bbl – 47 €/bbl). Oil prices were generally driven by supply and demand side factors, such as expectations of lower global economic growth, rapidly increasing crude oil production in the US, Russia and Saudi Arabia, and less intensive impacts on decreasing oil exports from Iran, compared to earlier expectations, combined with the impact of temporary oil import waivers from the country. In early December however, OPEC and other key oil producers decided to cut back production, which contributed to the stabilization or crude oil prices in the forthcoming months.
In December 2018 the TTF spot gas price averaged 23.8 €/MWh, down from 27.8 €/MWh in September 2018. On average in the fourth quarter of 2018 it reached 24.7 €/MWh, still up by 28% compared to same period of 2017. EU gas consumption decreased year-on-year as mild weather conditions put a lid on heating related gas demand in Q4 2018, in parallel with retreating oil and coal prices from their highs at the beginning of the autumn period, and supported by abundant LNG imports in the EU, European gas hub prices showed measurable decreases in the fourth quarter of 2018.
Although crude oi prices in Q4 2018 underwent a steep fall, oil-indexed gas contracts, in line with the typical 6-9 month time lag used in the pricing formula, continued their upward trend in the fourth quarter of 2018. In Q4 2018 Platt's North West Europe Gas Contract Indicator (GCI), a theoretical index showing what a gas price, linked 100% to oil would be, averaged 26.2 €/MWh, which was higher (by 1.5 €/MWh) than the spot TTF, and showing increasing divergence between the two, as the TTF contract price decreased.
Coal prices fell to 77 €/Mt by December 2018, down from 86 €/Mt in September. However, in Q4 2018 they were similar to the average of the fourth quarter of 2017. Although both coal and gas prices decreased in Europe over Q4 2018, carbon prices remained high and even showed further increase, continuing to penalize coal-fired electricity generation, having higher proportional carbon emissions vis-à-vis natural gas.
Figure 18 Spot prices of oil, coal and gas in the EU
Source: S&P Global Platts

21
2.2 International gas markets
Figure 18 displays an international comparison of wholesale gas prices. Over the last two winters (2016-2017 and 2017-2018) Asian markets reached their premium to Europe at the beginning of the calendar year, however, in 2018 the highest Asian premiums could be observed in the second and the third quarters of the year, and by December 2018 this has significantly shrunk. This resulted in a huge increase in LNG shipments to the EU. Gas hub prices in Europe decreased and the in the US they increased in the fourth quarter of 2018, implying a decreasing price gap between the two sides of the Atlantic.
In the fourth quarter, TTF averaged at 8.3 USD/mmbtu (24.7 €/MWh). The average German border price was somewhat lower (6.8 USD/mmbtu or 20.4 €/MWh).
Asian prices showed a measurable decrease in Q4 2018 compared to the several years' high in September 2018. The average Japanese LNG price was 10.1 USD/mmbtu in Q4 2018, still being 9% higher than in the same quarter of 2017, and in December 2018 it fell to 9.1 USD/mmbtu. In Asia the role of oil price escalation in gas contracts is still significant compared to Europe, and the time-lag impact of high oil prices in earlier periods helped in keeping the (even though shrinking) LNG price premium to Europe. The Japanese premium above the Dutch TTF hub was on average 1.9 USD/mmbtu in the third quarter of 2018, down from 2.3 USD/mmbtu in Q3 2018. On quarterly average, LNG import prices in China in Q4 2018 were comparable with their Japanese peers (10.1 USD/mmbtu).
The average import price of Chinese pipeline imports in Q4 2018 was 7 USD/mmbtu, well below the Asian LNG reference prices.
The Henry Hub price showed a visible upturn in the fourth quarter of 2018, and in November the monthly average price was 4.1 USD/mmbtu, the highest since November 2014. On quarterly average the contract reached 3.8 USD/mmbtu, which was 30% higher than in Q4 2017. The euro-dollar exchange rate changed only a little in Q4 2018 year-on-year, (1.18 in Q4 2017 vs. 1.14 in Q4 2018), implying that changes in price differentials between the regions were the result of pure energy market developments.
Over the course of the fourth quarter of 2018 differentials in international price contracts decreased, as traditionally lower US prices increased while higher priced Asian contracts became cheaper. The ratio of the Japanese LNG price and US Henry Hub was 2.7 in the fourth quarter of 2018, down from 3.7 in the third quarter and from 3.2 in Q4 2017.
The average TTF/Henry Hub ratio decreased to 2.2 in the fourth quarter of 2018 from 2.3 in the same period of 2017. In absolute terms, the price spread between Henry Hub and TTF was 4.5 USD/mmbtu in the fourth quarter of 2018, which compares to an average of 3.7 USD/mmbtu in the same period of 2017.
Figure 19 International comparison of wholesale gas prices
Sources: S&P Global Platts, Thomson-Reuters, BAFA, CEIC

22
2.2.1 LNG markets
In contrast to the behaviour in 2016-2017, LNG prices in Asia reached their peak in the early autumn period (instead of January), and by the end of the year they fell back, reducing their price premium over the European contracts.
In the fourth quarter of 2018, spot prices averaged 8.3 USD/mmbtu in the Netherlands, 8.9 USD/mmbtu in Spain, 10.1 USD/mmbtu in Japan. In Q4 2018 the difference between the Japanese and the Dutch price reached 1.9 USD/mmbtu, which fell to 1.1 USD/mmbtu in December 2018.
JCC (Japanese Crude Cocktail), the Japanese benchmark of oil-indexed LNG prices averaged around 11.7 USD/mmbtu in the fourth quarter of 2018, slightly more than the average spot price (10.1 USD/mmbtu).
LNG imports in the fourth of 2018 increased measurable in China (+33% year-on-year), and in Korea (23%), however, they rose only slightly in Japan (+1.1%), and remained practically the same in India17.
Global LNG supply continued to expand in the fourth quarter of 2018: and LNG trade amounted to 119 bcm, 16% more than in the same quarter of 2017 (102 bcm).
Figure 20 Spot LNG landed prices in the EU and Asia
Note: Landed prices for LNG Source: Thomson-Reuters
Figure 20 displays the evolution of spot LNG prices paid in the UK and Spain and estimated border prices for pipeline imports from Norway and Algeria, which account for the major part of pipeline imports in the UK and Spain, respectively. The evolution of the day-ahead prices on the NL TTF hub is also presented.
In the fourth quarter of 2018, the estimated Algerian pipeline import price in Spain, following the time lag impact of the oil-indexed contracts, kept on increasing, reflecting the high crude oil prices in earlier periods. In contrast, the estimated Norwegian import price contract in the UK, similarly to the other hub based contracts and LNG prices, reversed its increasing trend in Q4 2018 and by December showed a measurable decrease. As result, in the fourth quarter of 2018 the different contracts on Figure 20 showed signs of re-convergence, and the December average monthly prices fell in the range of 23-25 €/MWh. In spite of the decrease in Q4 2018, the quarterly average prices of the Algerian and Norwegian pipeline imports, and Spanish and UK LNG prices were still 20-30% higher than in the fourth quarter of 2017.
17 Source: Commission calculations based on tanker movements reported by Thomson Reuters

23
Spot LNG prices in Spain and the UK were mainly influenced by the strong LNG inflow in Europe, as in the consequence of the shrinking Asian price premium more LNG cargos were sent to Europe, increasing the natural gas supply in the market. Although following closely the TTF hub prices, both UK and Spanish LNG import prices had a slight premium (1-2 €/MWh) over the TTF hub prices in Q4 2018.
Figure 21. Price developments of LNG and pipeline gas in the UK and Spain
Note: Landed prices for LNG. Source: S&P Global Platts, Thomson Reuters, European Commission estimates based on Eurostat COMEXT data
2.3 European gas markets
2.3.1. Wholesale markets in the EU
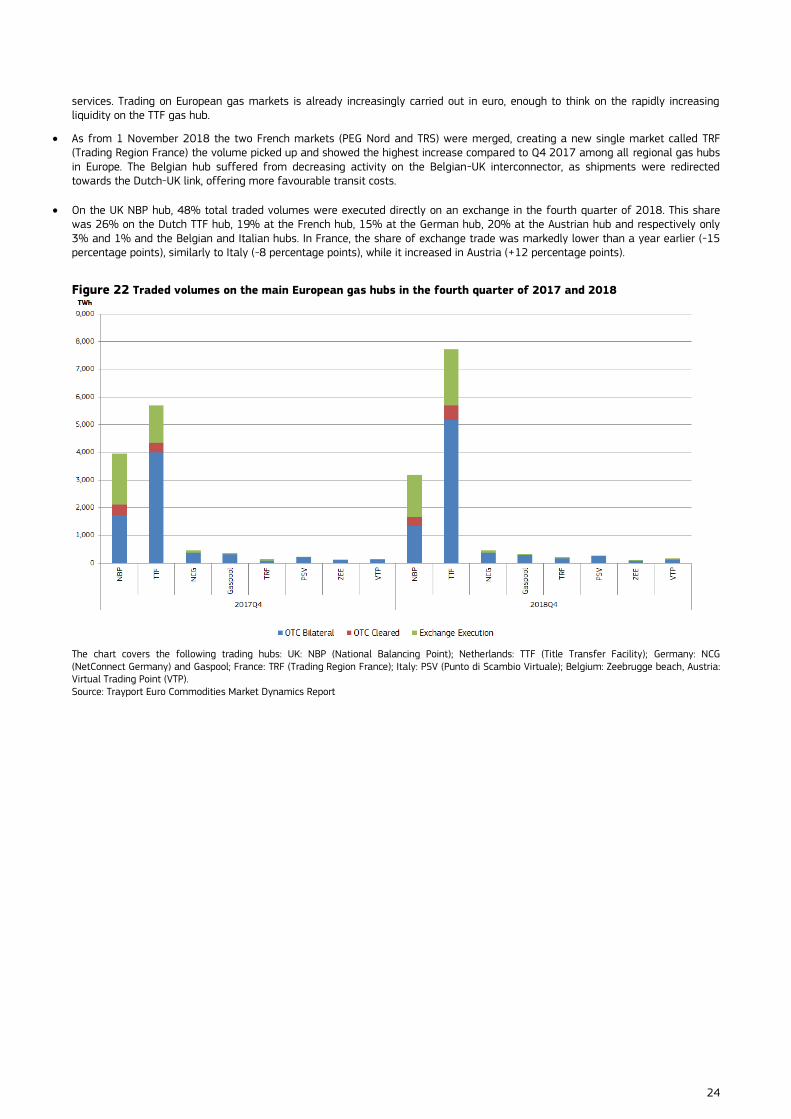
As Figure 21 and Figure 22 show, liquidity on the main European gas hubs increased in the fourth of 2018: total traded volumes amounted to around 12 414 TWh (equivalent to around 1 144 bcm), 12% more than in the same period of 2017. This was around 11 times more than the gas consumption in the seven Member States18 covered by the analysis in Q4 2018. In October and November traded volume of gas on the European hubs showed a strong increase in year-on-year comparison (in November 2018, with a volume of 4 615 TWh, reaching the highest since the beginning of available data series), however in December it fell back again.
Traded volumes in the fourth quarter of 2018 increased year-on-year in the French (53%), Dutch (36%), Austrian (22%), And Italian hubs (19%), while in the UK (-19%) and Belgium (-18%) traded volumes decreased compared to. Q3 2017. On the German hub the traded volumes did not show any change in year-on-year comparison.
The significant increase on the TTF hub further reinforced the leading role of TTF in Europe, providing for a liquid continental benchmark, having the advantage of euro-denomination, and benefiting from its good connection to various supply sources. On the other hand, decrease on the NBP hub further signalled a shift from once Europe's most liquid market, where the quarterly traded volume was barely half of that on TTF in Q4 2018.
On 5 December 2018 the European Commission adopted its communication on 'Towards a stronger international role of the euro19'. On the top of this communication a recommendation on the role of the euro in the field of energy20 was published, aiming
at promoting the wider use of euro in international agreements and non-binding instruments on energy, in energy-related transactions of European market participants and energy related projects and transactions by companies providing financial
18 Netherlands, UK, Germany, France, Italy, Belgium, Austria 19 https://ec.europa.eu/commission/sites/beta-political/files/recommendation_-_the_international_role_of_the_euro_in_the_field_of_energy.pdf 20 https://ec.europa.eu/commission/sites/beta-political/files/recommendation_-_the_international_role_of_the_euro_in_the_field_of_energy.pdf
24
services. Trading on European gas markets is already increasingly carried out in euro, enough to think on the rapidly increasing liquidity on the TTF gas hub.
As from 1 November 2018 the two French markets (PEG Nord and TRS) were merged, creating a new single market called TRF (Trading Region France) the volume picked up and showed the highest increase compared to Q4 2017 among all regional gas hubs in Europe. The Belgian hub suffered from decreasing activity on the Belgian-UK interconnector, as shipments were redirected towards the Dutch-UK link, offering more favourable transit costs.
On the UK NBP hub, 48% total traded volumes were executed directly on an exchange in the fourth quarter of 2018. This share was 26% on the Dutch TTF hub, 19% at the French hub, 15% at the German hub, 20% at the Austrian hub and respectively only 3% and 1% and the Belgian and Italian hubs. In France, the share of exchange trade was markedly lower than a year earlier (-15 percentage points), similarly to Italy (-8 percentage points), while it increased in Austria (+12 percentage points).
Figure 22 Traded volumes on the main European gas hubs in the fourth quarter of 2017 and 2018
The chart covers the following trading hubs: UK: NBP (National Balancing Point); Netherlands: TTF (Title Transfer Facility); Germany: NCG (NetConnect Germany) and Gaspool; France: TRF (Trading Region France); Italy: PSV (Punto di Scambio Virtuale); Belgium: Zeebrugge beach, Austria: Virtual Trading Point (VTP). Source: Trayport Euro Commodities Market Dynamics Report

25
Figure 23 Traded volumes on the main European gas hubs
"Other" includes the following trading hubs: Germany: NCG (NetConnect Germany) and Gaspool; France: PEG (Point d’Echange Gaz) ; Italy: PSV (Punto di Scambio Virtuale); Belgium: Zeebrugge beach. 1 bcm is equivalent to 10.647 TWh. Source: Trayport Euro Commodities Market Dynamics Report
On the European hubs as whole, 63% of the total trade was OTC bilateral, 7% was OTC cleared and 30% was exchange executed, showing little change in Q4 2018 compared to the same period of the 2017.
The total OTC traded volume (bilateral and cleared) rose by almost 13% in Q4 2018 in year-on-year, actually driving liquidity in the EU gas hubs. Exchange executed volumes increased by 11% in the same period. In Q4 2018 the shift towards the OTC markets, to the detriment of the exchange executed contracts, seemed to have come to a halt, at least temporarily.
Figure 24 Share of traded volumes on the main European gas hubs
The chart covers the following trading hubs: UK: NBP (National Balancing Point); Netherlands: TTF (Title Transfer Facility); Germany: NCG (NetConnect Germany) and Gaspool; France: PEG (Point d’Echange Gaz); Italy: PSV (Punto di Scambio Virtuale); Belgium: Zeebrugge beach, Austria: Virtual Trading Point (VTP). Source: Trayport Euro Commodities Market Dynamics Report

26
2.3.2. Wholesale price developments in the EU
European hub prices were averaging around 24-26 €/MWh in the fourth quarter of 2018, which was lower than the five-year peak in September 2018 (27-29 €/MWh), but it was higher than the range in Q4 2017 (19-22 €/MWh). In fact, in the fourth quarter of 2018 hub prices were up by 16-31% in year-on-year comparison. The average TTF hub price increased by 28% on Q4 2018.
The main factors impacting the decrease in wholesale gas prices in the fourth quarter of 2018 were the generally decreasing energy commodity prices, namely crude oil and coal prices. Moreover, strong increase in LNG imports resulted in abundant gas supplies in Europe, which impacted the price level as well. A milder than usual weather in Q4 2018 across much of Europe weighed on gas demand for heating, having a lowering impact on sport prices.
Figure 25 Wholesale day-ahead gas prices on gas hubs in the EU
Source: S&P Global Platts
UK and German benchmarks in the fourth quarter of 2018 were well-aligned with the Dutch TTF, showing only a minor premium
(0.2 – 0.3 €/MWh) on quarterly average. During the winter period the UK market normally shows a premium to its continental needs, as opposed to the summer, when it shows discount (during wintertime import demand for gas increasing due to limited storage capacities in the UK).
In parallel with decreasing European hub prices and the end of the interconnector maintenance works at the northern borders of Italy, the price premium of the Italian hub shrunk compared to the previous quarter and was only 1.3 €/MWh in Q4 2018. The Austrian gas hub showed a minor premium, while the Belgian hub showed a minor price discount to the TTF in Q4 2018 on average.
October 2018 marked the last month of trading on the French TRS hub (PEG Sud); in this month the average price was 25.7 €/MWh., showing convergence to the PEG Nord hub before the merger of the two trading platforms on 1 November 2018. In November-December the new French TRF hub remained closely aligned with other peers in North-Western Europe. As the southern part of France still depends on LNG send-outs, in spite of reinforced infrastructure links with the north of the country, the price convergence of the new merged market with its regional peers might be tested in a sudden increase of gas demand (e.g.: a cold snap during wintertime).

27
Figure 26 Premium of wholesale day-ahead gas prices at selected hubs compared to TTF
Source: S&P Global Platts
Figure 26 looks at the development of forward prices one, two and three years ahead in comparison to the development of the day-ahead price on the Dutch TTF.
In the third fourth of 2018 spot prices on the TTF hub were higher than forward contracts (otherwise saying, the gas price curve was in backwardation), reflecting the anticipation of market participants on lower prices in the future.. At the end of December 2018 the spot TTF gas price (22.1 €/MWh) was 0.6 €/MWh higher than the year-ahead price and almost 2.2 €/MWh higher than the three-year ahead contract. It seems that in parallel with less strong energy market fundamentals and decreasing gas spot prices, the difference between spot and curve prices became lower (compared to the end of Q3 2018), that might reflect lower price volatility in the forthcoming period.
Figure 27 Forward gas prices on the Dutch gas hub
Source: S&P Global Platts

28
2.3.3. Comparing the prices of different contracts for gas in the EU
Figure 27 compares a selection of estimated border prices of gas deliveries from the main exporters to the EU: Russia, Norway, and Algeria. For comparison, the evolution of the day-ahead prices on the Dutch TTF hub is also presented.
Over the last few years, most of the European gas contracts remained well aligned, however, in the periods of general price falls or rises on the energy markets (e.g.: at the end of 2015 – beginning of 2016, or in 2018), amid increasing price volatility, price differentials among different contracts tended to increase as well. This stems from slower responsiveness in time of oil-indexed contracts to market developments, compared to hub-based pricing.
In the fourth quarter of 2018 most of oil-indexed contract prices (Russian gas import in Latvia and the Czechia, and Algerian import in Italy) continued their increase, following the rising oil prices in earlier quarters and reflecting the impact of the time-lagged nature of oil-indexed contracts. In contrast, hub based contracts, such as the Norwegian import, or hub prices, reversed their increasing trend of the second and third quarters of 2018 and underwent a visible decrease in Q4 2018. Interestingly, reported German border prices showed only minor rise over Q4 2018, probably owing to increasing importance of hub based contracts in the German imports that might have counter-balanced the impact of increasing prices of oil-indexed contracts.
In December 2018, the difference between the highest and lowest price depicted on Figure 27 fell to 6.8 €/MWh from 8.6 €/MWh measured in September 2018. On quarterly average, in Q4 2018 the price differential was 6.6 €/MWh, being still twice as high as in the fourth quarter of 2017.
Figure 28 Comparison of EU wholesale gas price estimations
Source: Eurostat COMEXT and European Commission estimations, BAFA, S&P Global Platts *The difference between the highest and lowest price depicted on the graph Note: Border prices are estimations of prices of piped gas imports paid at the border of the importing country, based on information collected by customs agencies, and are deemed to be representative of long-term contracts.

29
Map 1. Comparison of EU wholesale gas prices in the fourth quarter of 2018
Note: Border prices are estimations of prices of piped gas imports paid at the border of the importing country, based on information collected by customs agencies, and are deemed to be representative of long-term gas contracts.

30
3. Retail gas markets in the EU and international price comparison
Figures 28 and 30 show the degree of convergence of retail gas prices for household and industrial consumers, using as a metric the relative standard deviation of the prices in individual Member States. Monthly retail prices are estimated by using half-yearly prices from Eurostat (with the latest available figures relating to the first half of 2018) and Harmonised Consumer Price Indices (HICP) for both the household prices and industrial consumers.
For household consumers, the estimated average retail price in the EU (including all taxes) showed an increasing trend between 2010 and 2015 and decreased in 2016-2017. In the fourth quarter of 2018 retail gas prices for household customers were stable in the EU. In the most typical consumption band, D2, the estimated average price (including all taxes) in the fourth quarter of 2018 was 6.22 Eurocents/kWh. (See the estimated household prices on Map 2).
Retail prices for households showed an increasingly diverging trend in 2015-2016, as shown by the increase of the relative standard deviation in Figure 27. This trends seems to be have reversed as of mid-2017 and the decrease in relative standard deviation, especially for prices with middle and higher level consumption, continued in Q4 2018, implying a better price convergence across Europe for household gas customers. Observed price differences are normally higher for the consumers with lower annual consumption, primarily owing to the higher share of fixed elements (not related to the actual consumption) in the final consumer bills.
There are still significant differences in retail gas prices across the EU: in the fourth quarter of 2018, the estimated household price in consumption band D2 varied between 3.51 Eurocent/kWh in Romania and 11.47 Eurocent/kWh in Sweden, resulting in a price differential ratio of 3.3 between the cheapest and the most expensive Member State. This ratio gradually decreased since the second quarter of 2012 when it reached 4.8.
Figure 29 Relative standard deviation of gas prices paid by household customers in EU Member States
Note: all taxes included. Source: European Commission estimates based on Eurostat data on consumer prices adjusted by the HICP
Figure 29 shows the level and the breakdown of residential end-user gas prices paid by typical households in 25 European capitals in December 2018. On average, 46% of the price covered the energy component, while the rest covered distribution/storage costs (28%), energy taxes (9%) and VAT (17%).21
21 Note that these are arithmetic averages.

31
There were significant differences across Member States, with the share of energy cost ranging from 29% (Copenhagen) to 67% (Tallinn), the share of distribution/storage costs ranging from 8% (Tallinn) to 45% (Sofia) and the share of taxes ranging from 7% (London) to 51% (Amsterdam). For 7 of the 25 capitals covered, the price does not include an energy tax component. While there were significant differences across Member States in network costs and taxes, Figure 28 also shows that even the energy component is very variable: it was 6 times higher in Stockholm than in Budapest in December 2018.
In 21 out of the 25 capitals prices were higher in December 2018 than a year earlier, with the biggest increase in Bucharest (21%), driven by a 42% growth of the energy component. In December 2018 Budapest was the cheapest capital in the EU in terms of gas prices for household consumers. Prices decreased by 6% in Lisbon compared to December 2017, in Prague they were down by 4% and in Budapest by 3% in December 2018.
Figure 30 Breakdown of gas price paid by typical household customers in European capitals, December 2018
Source: VaasaETT
After a relative stability in 2017 and the first half of 2018, retail gas prices for industrial customers began to increase in Q3 2018 on EU average, which trend continued in the fourth quarter of 2018. The average estimated price (VAT and other recoverable taxes excluded) in consumption band I4 was 2.62 Eurocent/kWh in the fourth quarter of 2018, 13% more than in the same period of 2017. (See the estimated industrial prices on Map 3.) Prices increased in Q4 2018 year-on-year in most of the EU Member States. It seems that the impact of increasing gas wholesale market prices in the preceding two quarters started to filter in the increasing retail prices.
Figure 29 indicates that, for industrial customers, the relative standard deviation has been significantly lower than in the case of households, indicating smaller price differences across Member States. In most consumption bands the standard deviation was fairly stable in 2017 and in the first half of 2018, and in the third and the fourth quarter of 2018 it started to slightly decrease. However, in July 2018 prices started to diverge more in Band I5. Higher annual gas consumption normally translates into the lower observed price differentials across EU Member States, reflecting the higher share of the energy costs element (as opposed to network charges and tax components) in the case of customers with higher annual consumption.
In the fourth quarter of 2018, Bulgaria had the lowest estimated industrial price in consumption band I4 (2.27 Eurocent/kWh), while the highest price was observed in Sweden (4.2 Eurocent/kWh), resulting in a ratio of 1.9. The price differential ratio between the cheapest and the most expensive Member State has been fluctuating between 1.6 and 2.4 since the beginning of 2008.

32
Figure 31 Relative standard deviation of gas prices paid by industrial customers in EU Member States
Note: Excluding VAT and other recoverable taxes. Source of data: European Commission estimates based on Eurostat data on industrial prices adjusted by the HICP
The next chart shows the evolution of industrial retail gas prices in the EU, compared with some important trade partners of the European economy. In December 2018 retail gas prices for industrial customers were generally higher in Brazil, China and Korea compared to the EU average, however, in the United States and Russia retail gas prices were lower compared to the EU.
Figure 32 The EU average industrial retail gas price in comparison with the price range of some important trade
partners of the EU
Source: Eurostat (EU average, for industrial consumption band I4) and CEIC. Data of the United States, China, Russia, Brazil, Korea and Indonesia were taken into account.
Maps 2 and 3 show the estimated retail gas prices paid by households and industrial customers in the fourth quarter of 2018.

33
Map 2. Retail gas price estimates for households in the EU – Fourth quarter of 2018

34
Map 3. Retail gas price estimates for industrial consumers in the EU – Fourth quarter of 2018

35
4. Glossary
Backwardation occurs when the closer-to-maturity contract is priced higher than the contract which matures at a later stage.
Clean dark spreads are defined as the average difference between the price of coal and carbon emission, and the equivalent
price of electricity. Dark spreads are reported as indicative prices giving the average difference between the cost of coal delivered ex-ship and the power price. As such, they do not include operation, maintenance or transport costs. Spreads are defined for a coal-fired plant with 35 % efficiency. Dark spreads are given for UK and Germany, with the coal and power reference price as reported by S&P Global Platts. Clean spark spreads are defined as the average difference between the cost of gas and emissions, and the equivalent price of
electricity. Spark spreads are indicative prices showing the average difference between the cost of gas delivered on the gas transmission system and the power price. As such, they do not include operation, maintenance or transport costs. The spark spreads are calculated for gas-fired plants with standard efficiencies of 50% and 60%. This report uses the 50% efficiency. Spreads are quoted for the UK, German and Benelux markets. Contango: A situation of contango arises in the when the closer to maturity contract has a lower price than the contract which is
longer to maturity on the forward curve. Flow against price differentials (FAPDs): By combining daily price and flow data, Flow Against Price Differentials (FAPDs) are
designed to give a measure of the consistency of economic decisions of market participants in the context of close to real time operation of natural gas systems. With the closure of the day-ahead markets (D-1), the price for delivering gas in a given hub on day D is known by market participants. Based on price information for adjacent areas, market participants can establish price differentials. Later in D-1, market participants also nominate commercial schedules for day D. An event labelled as an FAPD occurs when commercial nominations for cross border capacities are such that gas is set to flow from a higher price area to a lower price area. The FAPD event is defined by the minimum threshold of price difference under which no FAPD is recorded. The minimum threshold for gas is set at 0.5 €/MWh. After the day ahead market closes, market participants still have the opportunity to level off their positions on the balancing market. That is why a high level of FAPD does not necessarily equate to irrational behaviour. In addition, it should be noted that close-to real time transactions represent only a fractional amount of the total trade on gas contracts. The FAPD chart provides detailed information on adverse flows. It has two panels: The first panel estimates the ratio of the number of days with adverse flows to the total number of trading days in a given period. It also estimates the monetary value of energy exchanged under adverse flow conditions (mark-up) compared to the total value of energy exchanged across the border. The mark-up is also referred to as "welfare loss". A colour code informs about the relative size of FAPD events in the observed sample, going from green if less than 10% of traded days in a given period are FAPDs to red if more than 50% of the days are FAPDs. The second panel gives the split of FAPDs by sub-category of pre-established intervals of price differentials. It represents the average exchanged energy and relative importance of each sub-category on two vertical axes. Heating degree days (HDDs) express the severity of a meteorological condition for a given area and in a specific time period.
HDDs are defined relative to the outdoor temperature and to what is considered as comfortable room temperature. The colder is the weather, the higher is the number of HDDs. These quantitative indices are designed to reflect the demand for energy needed to heat a building. LNG sendout expresses the amount of gas flowing out of LNG terminals into pipelines.
Long-term average for HDD comparisons: In the case of the heating degree days, actual temperature conditions are expressed
as the deviation from the long-term temperature values (average of 1975-2016) in a given period.
Monthly estimated retail gas prices: Twice-yearly Eurostat retail gas price data and the gas component of the monthly
Harmonised Index for Consumer Prices (HICP) for each EU Member States to estimate monthly retail gas prices for each consumption band. The estimated quarterly average retail gas prices on the maps for households and industrial customers are computed as the simple arithmetic mean of the three months in each quarter.
Relative standard deviation is the ratio of standard deviation (measuring the dispersion within a statistical set of values from
the mean) and the mean (statistical average) of the given set of values. It measures in percentage how the data points of the dataset are close to the mean (the higher is the standard deviation, the higher is the dispersion). Relative standard deviation enables to compare the dispersion of values of different magnitudes, as by dividing the standard deviation by the average the impact of absolute values is eliminated, making possible the comparison of different time series on a single chart.


