20
MACQUARIE AGRICULTURAL FUNDS MANAGEMENT SEPTEMBER 2011 Macquarie Agri View: Agricultural primer – grains and oilseeds

1
Macquarie Research
Quarterly report
Macquarie Agri View: Agricultural primer – grains and oilseeds
MaCQuarIe AGRICULTURAL FUNDS MANAGEMENT SEPTEMBER 2011
Macquarie Agri View: Agricultural primer – grains and oilseeds

2
Macquarie Research Macquarie Agri View: Agricultural primer – grains and oilseeds
Macquarie Agri View: Agricultural Primer –grains and oilseeds In the last decade grains and oilseeds have moved from being commodities with abundant supply and weakening real prices to having significant scarcity globally with dramatic implications for global inflation.
“We not only need to grow an extra one billion tonnes of cereals a year by 2050… but do so from a diminishing resource base of land and water in many of the world’s regions, and in an environment increasingly threatened by global warming and climate change.”
Jacques Diouf, Director General, Food and Agriculture Organization of the United Nations (FAO)
Agricultural commodities have become increasingly volatile in recent years as rapid demand growth has significantly reduced global stocks. When stock levels are low, the impact of weather events has a magnified impact on prices as the requirement to ration demand is far greater.
We provide in this report a brief description of each of the major grains and oilseeds and the characteristics of their production. We also break down grain and oilseed demand into its major components, from feed usage to bio fuels.
Source: FAO, Macquarie Research, September 2011
Agricultural prices in the last two decades: Extreme volatility in the last five years

3
Macquarie Research Macquarie Agri View: Agricultural primer – grains and oilseeds
A guide to the major grains and oilseedsWheatWheat is the main cereal grain crop for food consumption in most of the world. Wheat is also one of the oldest harvested grains, known to have been grown since 10,000 BC. It is thought to have originated in the Nile Delta, but to have been first domesticated in Turkey. In using wheat to bake bread, the early Egyptians formed one of the earliest food production industries.
IntroductionEmerging market and bio fuel demand have reshaped the grain and oilseed complex, moving them from a position of surplus to critically tight stock levels. The change in demand has come in combination with serious weather events over the last five years, which has significantly restricted supply.
As demand for grains and oilseeds is expected to continue to grow, marginal arable land in South America and the Former Soviet Union (FSU) will need to be brought into production.
Source: USDA, Macquarie Research, September 2011
Figure 3 The Black Sea region is playing an increasingly important role in world wheat trade
Figure 4 Wheat yields globally have begun to plateau
Source: USDA, Macquarie Research, September 2011
Figure 2 Growth in population continues to outstrip growth in available arable land
Source: USDA, Macquarie Research, September 2011
1995 2025Water withdrawal as a percentage of total available water
more than 40 %
from 40 % to 20 %
from 20 % to 10 %
less than 10 %
Source: USDA, Macquarie Research, September 2011
Figure 1 Main regions with grain demand growth have inadequate water supply

4
Macquarie Research Macquarie Agri View: Agricultural primer – grains and oilseeds
developing world, increased usage of fertiliser has raised yields. Fertiliser usage in the developing world has increased by 25 times over the past four decades. In places like Australia’s southern areas, despite a relatively low rainfall, farmers have used increased rotation cropping (planting wheat alternatively with other crops) to increase their yields.
BarleyLike wheat, barley was one of the earliest domestically grown crops. Early barley harvests have been traced to the Middle and Near East region, with crops having first been grown around 10,000 years ago. Today, barley is grown in around 100 countries, with the EU, Russia, Ukraine, Canada and Australia accounting for around three quarters of global production of 150 million tonnes (Figure 9) in 2009/10. The major uses for barley are as an animal feed and for producing malt for beer production. In the US, where it is grown in 27 states, over half of all barley grown is used as animal feed. Barley is also used in a wide range of breads, soups and flours, and is increasingly seen as important health food. Barley is a tough crop, relatively tolerant to drought and able to cope with greater levels of salinity than wheat. It is often grown as a summer crop, or as a winter crop in warmer areas. As it has a short growing season, it is a relatively drought tolerant crop. Increasing global consumption of animal protein, particularly in developing countries, will continue to be one of the main drivers of barley demand. In addition, rapidly expanding beer production, particularly in the developing world, will increase the demand for malting barley.
Food is the primary use of wheat, as it is widely utilised as flour for producing bread. Wheat forms a fundamental component of the diets of developing countries. Over the past 50 years, global wheat production has continued to rise steadily, from around 200 million metric tonnes in 1960 to almost 700 million tonnes in 2010. The major global producers of wheat are the European Union (EU), China, India, the United States (US) and Russia, which together account for around 67 per cent of global production. Around 20 per cent of wheat produced is exported. The major exporters, the US, the EU, Australia, Canada and Russia account for around 75 per cent of global exports. The main importers of wheat are mostly regions which lack the acreage or natural resources required to grow adequate volumes or qualities of wheat for their requirements. Globally, demand for wheat is fairly widespread, with no one country having major market power. For example, the largest five importers of wheat – Egypt, Brazil, the EU, Indonesia and Japan – account for only 26 per cent of global wheat imports between them. Wheat is grown in a number of varietals, and is often classified in different ways – for example, spring wheat vs. winter wheat, red wheat vs. white wheat, hard wheat vs. soft wheat.
Source: ABARE, USDA, CWB, Macquarie Research, September 2011
Figure 5 Growth in high-quality wheat production lags feed grade wheats
Fig 6 Quality Kansas wheat futures gains relative to CBOT feed grade futures
Source: Reuters, Macquarie Research, September 2011
The most widely grown wheat is common wheat or bread wheat, while the second-most common species, durum wheat, is used in the production of pasta. Different varieties such as Hard Red Spring, Hard Red Winter, Soft Red Winter and Hard White are often used for different varieties of foods, including breads, biscuits, pastries and other baked goods. They are also often traded on different exchanges. Ideal wheat production conditions vary on the region and the climate. In some countries, particularly in the

5
Macquarie Research Macquarie Agri View: Agricultural primer – grains and oilseeds
CornCorn, known as maize in some parts of the world, is a cereal grain which has been grown since prehistoric times. Corn was thought to have been cultivated by the Aztecs and Mayans in southern Mexico, before gradually spreading through the Americas, then in the 16th century to Europe. Corn is the most widely grown crop in the world, with almost half the world’s corn produced in the US, and around 55 per cent of global exports. Between them, the US, China, Brazil, Mexico, Argentina, India and France produce over three quarters of the world’s corn.
Corn’s ability to grow in a wide range of climates played a major role in its wide geographic coverage and popularity. The corn plant has a shallow root system, and as such prefers moist soil. Corn is often grown in rotation with other
crops that provide increased nitrogen to the soil, such as soybeans. Corn is a staple food in many parts of the world, either whole or as cornmeal. It is also processed into many forms, including popcorn and breakfast cereal.
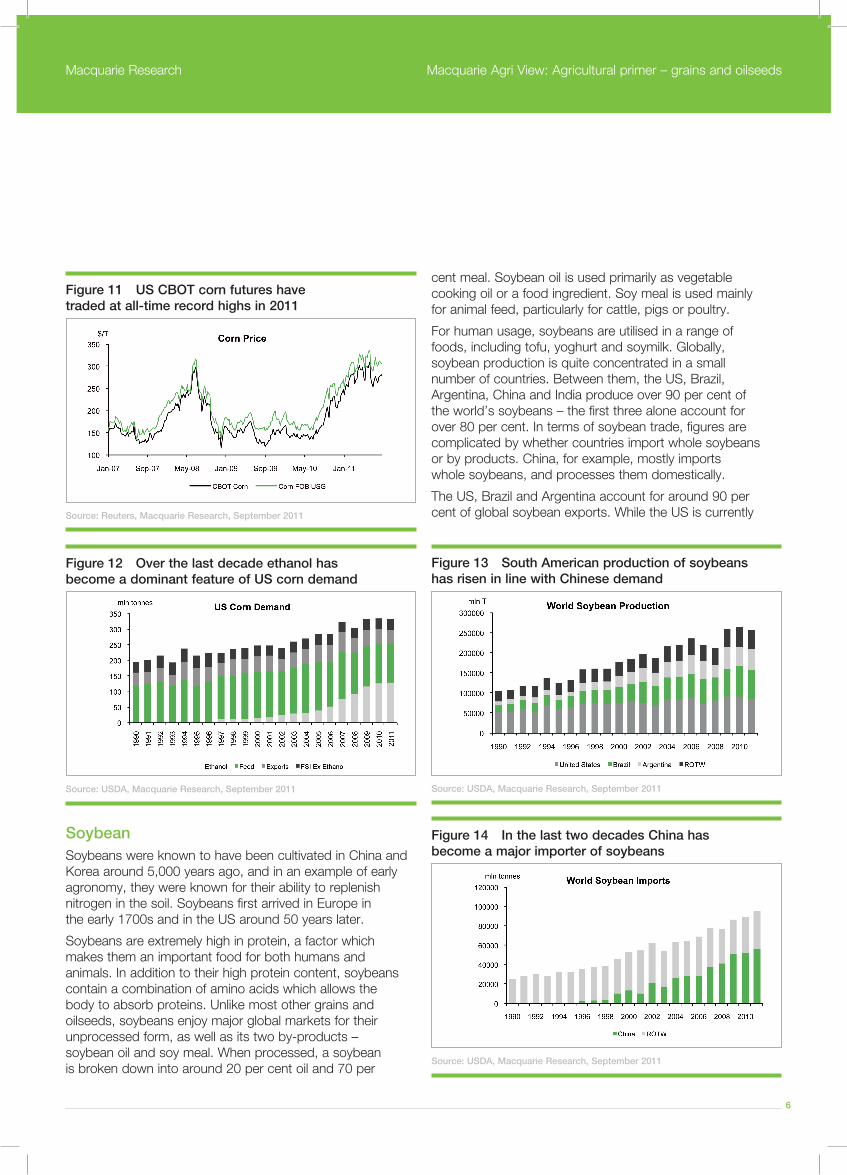
In the US, the largest usage is for animal feed, outstripping human consumption by around 40 times. It is used for livestock in the forms of forage, silage or grain. Corn is also used in other animal foods such as dog food and fish food. In recent years, corn has increasingly been used for the production of ethanol. Around 40 per cent of all corn grown in the US is now used for ethanol production, more than twice the amount which is exported.
Figure 7 World barley production has seen no growth, unlike the other grains
Source: USDA, Macquarie Research, September 2011
Figure 9 The US dominates global corn production and trade
Source: USDA, Macquarie Research, September 2011
Fig 8 Barley price is buffeted by movements in the other grains
Source: Reuters, Macquarie Research, September 2011
Figure 10 US corn yields are the highest in the world
Source: USDA, Macquarie Research, September 2011
6
Macquarie Research Macquarie Agri View: Agricultural primer – grains and oilseeds
SoybeanSoybeans were known to have been cultivated in China and Korea around 5,000 years ago, and in an example of early agronomy, they were known for their ability to replenish nitrogen in the soil. Soybeans first arrived in Europe in the early 1700s and in the US around 50 years later.
Soybeans are extremely high in protein, a factor which makes them an important food for both humans and animals. In addition to their high protein content, soybeans contain a combination of amino acids which allows the body to absorb proteins. Unlike most other grains and oilseeds, soybeans enjoy major global markets for their unprocessed form, as well as its two by-products – soybean oil and soy meal. When processed, a soybean is broken down into around 20 per cent oil and 70 per
cent meal. Soybean oil is used primarily as vegetable cooking oil or a food ingredient. Soy meal is used mainly for animal feed, particularly for cattle, pigs or poultry.
For human usage, soybeans are utilised in a range of foods, including tofu, yoghurt and soymilk. Globally, soybean production is quite concentrated in a small number of countries. Between them, the US, Brazil, Argentina, China and India produce over 90 per cent of the world’s soybeans – the first three alone account for over 80 per cent. In terms of soybean trade, figures are complicated by whether countries import whole soybeans or by products. China, for example, mostly imports whole soybeans, and processes them domestically.
The US, Brazil and Argentina account for around 90 per cent of global soybean exports. While the US is currently
Figure 11 US CBOT corn futures have traded at all-time record highs in 2011
Source: Reuters, Macquarie Research, September 2011
Figure 13 South American production of soybeans has risen in line with Chinese demand
Source: USDA, Macquarie Research, September 2011
Figure 12 Over the last decade ethanol has become a dominant feature of US corn demand
Source: USDA, Macquarie Research, September 2011
Figure 14 In the last two decades China has become a major importer of soybeans
Source: USDA, Macquarie Research, September 2011

7
Macquarie Research Macquarie Agri View: Agricultural primer – grains and oilseeds
the largest exporter, it is expected that Brazil will claim this mantle in the next few years. The same three countries also account for over 80 per cent of soy oil exports. In terms of soy meal, however, while the same countries account for around 90 per cent of exports, Argentina alone exports over half of the world’s supply. This is primarily due to export taxes on Argentine soybeans, aimed at protecting the domestic soybean processing industry. China is by far the largest importer of soybeans globally, accounting for almost 60 per cent of all exports. China is also the largest importer of soybean oil, accounting for over a quarter of global imports, almost double that of its closest rival, India. The EU remains the world’s largest importer of soybean meal, accounting for almost half of global imports.
Rapeseed/CanolaCanola is a variety of rapeseed. While rapeseed itself has been recorded for hundreds of years, actual canola was first bred from rapeseed in Canada in the early 1970s. The name canola was derived from “Canadian oil, low acid” in 1978. Canola oil is more useable for human consumption than traditional rapeseed, while its reduced levels of toxins also make it preferable as animal feed than rapeseed.
Figure 15 China is also a large importer of vegetable oils, specifically palm oil
Source: Reuters, Macquarie Research, September 2011
Figure 17 Rapeseed production is struggling to keep pace with biodiesel demand
Source: USDA, Oilworld, Macquarie Research, September 2011
Figure 16 Soybean prices have been supported by the influx of Chinese demand
Source: Reuters, Macquarie Research, September 2011Figure 18 As the EU’s biofuel demand grows, the spread between Marché à Terme International de France (MATIF) and ICE futures widens
Source: Reuters, Macquarie Research, September 2011

8
Macquarie Research Macquarie Agri View: Agricultural primer – grains and oilseeds
Like soybeans, canola can be crushed to produce oil and a meal. Canola oil is widely used in many foods and cooking processes. It is regarded as a ‘healthier’ cooking oil, due to being low in saturated fat and containing a relatively high level of omega-3 fatty acids. In addition, canola oil is also used in industrial manufacturing, for products such as candles, lipstick, newspaper inks, industrial lubricants and biofuels. Canola meal is used as a high-quality animal feed. In measuring global production data, canola and rapeseed are often counted together. As such, in looking at overall rapeseed production, the EU, China, Canada, India and Australia account for around 90 per cent of global production. Canada is by far the largest exporter, accounting for around 60 per cent of global shipments, while the EU, Japan, China and Mexico account for half of global imports.
The demand side of the equationThe international demand for grains and oilseeds is increasing due to population growth, increasing income, changing diets and urbanisation. In many ways, each of these have become interlinked – population growth is largely in developing countries, which are the same areas seeing the highest increase in relative incomes, and also with the greatest shift of consumers from rural to urban areas. As a result, these are the regions which are also seeing the greatest changes in population diets, as people move from a grain-based diet up the scale to one with a greater degree of animal protein. As result, greater volumes of grains and oilseeds are required to provide feed for the animals which serve this new diet. In addition to the increasing demand from food and feed, the growth in biofuel production further increases the demand for grains and oilseeds, particularly for ethanol derived from corn and biodiesel derived from oilseeds.
Finally, it is important to also be aware of the increasing usage of grains and oilseeds in industrial products. It is important to examine each of these drivers in more detail, and then to look at the four main areas of grain and oilseed usage, to further realise how the strong long-term growth in demand for grains and oilseeds is evolving.
PopulationPopulation growth is the most basic factor driving the increase in consumption for agricultural products. Every year, the global population increases by around 80 million people – the rough equivalent of adding one new Germany or Ethiopia. The global population has grown substantially over the past few decades, and from its current base of 6.8 billion people, is projected to rise to 8.3 billion by 2030 and 9.1 billion by 2050. This would equate to an increase
in global food growth of 42 per cent by 2030 and 70 per cent by 2050. In addition, by 2050, over 7.5 billion people will be under the age of 50. As life expectancies continue to increase, this translates into further impetus for population growth. Many countries that have previously been self-sufficient in their food needs will increasingly need to rely on food imports. This is the case for countries in the Middle East. For example, Saudi Arabia at one stage grew over four million tonnes of wheat per year, making it at one time the world’s sixth-largest wheat exporter. However, with water shortages becoming a major issue, the country has phased out wheat production and will now import much of its grain needs. Population growth is expected to take place mostly in less developed countries, concentrated in urban areas. The strongest growth in demand is expected to be from Asian economies, particularly China and India. Population growth remains the fundamental base for growth in demand for gains and oilseeds. While an economic slowdown may cause consumers to re-evaluate spending on discretionary items such as clothing, cars and housing, they will continue to buy food. Throughout previous economic slowdowns, consumption of key agricultural commodities has continued to grow steadily. In particular, wheat has been shown to be relatively inelastic to both income and price over a sustained period. Consumption figures for wheat have been largely unaffected by either the price of wheat or the price of potential substitutes, such as corn, oats or rice.
IncomeMany developing countries have continued to maintain strong GDP growth. For example, over the course of the Global Financial Crisis, China and India were among the least affected countries, continuing to maintain GDP growth in 2008 of 8.7 per cent and 5.7 per cent, respectively. In general, growth in incomes translates into rising per capita food demand. Typically, consumers move up from a lower-value staple food to an alternative, such as transitioning from rice to wheat. In turn, as people continue to become wealthier, they move on to consuming products such as meat, fish, dairy products, and fruit and vegetables. In addition, they will also increase their consumption of products such as vegetable oils and processed foods.
For example, studies by the American Soybean Association show that when a developing population’s family income rises above $US1,000/year chicken enters the diet; as it rises above $US3,000/year other meats enter the diet. As mentioned in the previous section, the population increase tends to be seen in urban areas. The urbanisation trend will lead to a shift in dietary patterns, related to the continued expansion of worker incomes in the developing world and
9
Macquarie Research Macquarie Agri View: Agricultural primer – grains and oilseeds
more reliance on purchased food, as opposed to self-sufficiency. For example, the International Food Policy Research Institute (IFPRI) estimate that a one-time increase in the urban population from 1/4 to 2/3 of the national population of China would result in a 10 per cent increase in per capita demand for meat, fish, and dairy products.
On current forecasts, in the Asia Pacific region alone, 600 million people will move from rural to urban areas by 2020. As people move to cities, a number of structural shifts in food demand patterns occur:
a wider choice of food is available in urban markets
enhanced levels of infrastructure and food storage facilities aid the greater choice in foodstuffs
people are increasingly exposed to dietary patterns from foreign cultures
urban citizens seek foods that take less time to prepare.
A major component in this dietary shift is an increasing demand for animal proteins. This in turn triggers a multiplier effect on grain and oilseeds consumption, as these are needed to provide feed for livestock.
FoodAround 41 per cent of grains produced globally are for direct human consumption. The percentage of particular grains and oilseeds used for human consumption varies markedly. For example, around 70 per cent of all wheat that is produced globally, or 450 million tonnes, is for food. Demand for food wheat continues to increase in emerging markets, where populations are growing and incomes are increasing. In many of these markets, wheat-based products are still considered a luxury item. In the higher income areas of emerging markets, consumption of wheat-based products such as bread, bakery and noodles continues to rise. Cereals – including rice – represent 55-70 per cent of the total calories of food in developing countries. Only a small fraction of oilseeds are consumed for food.
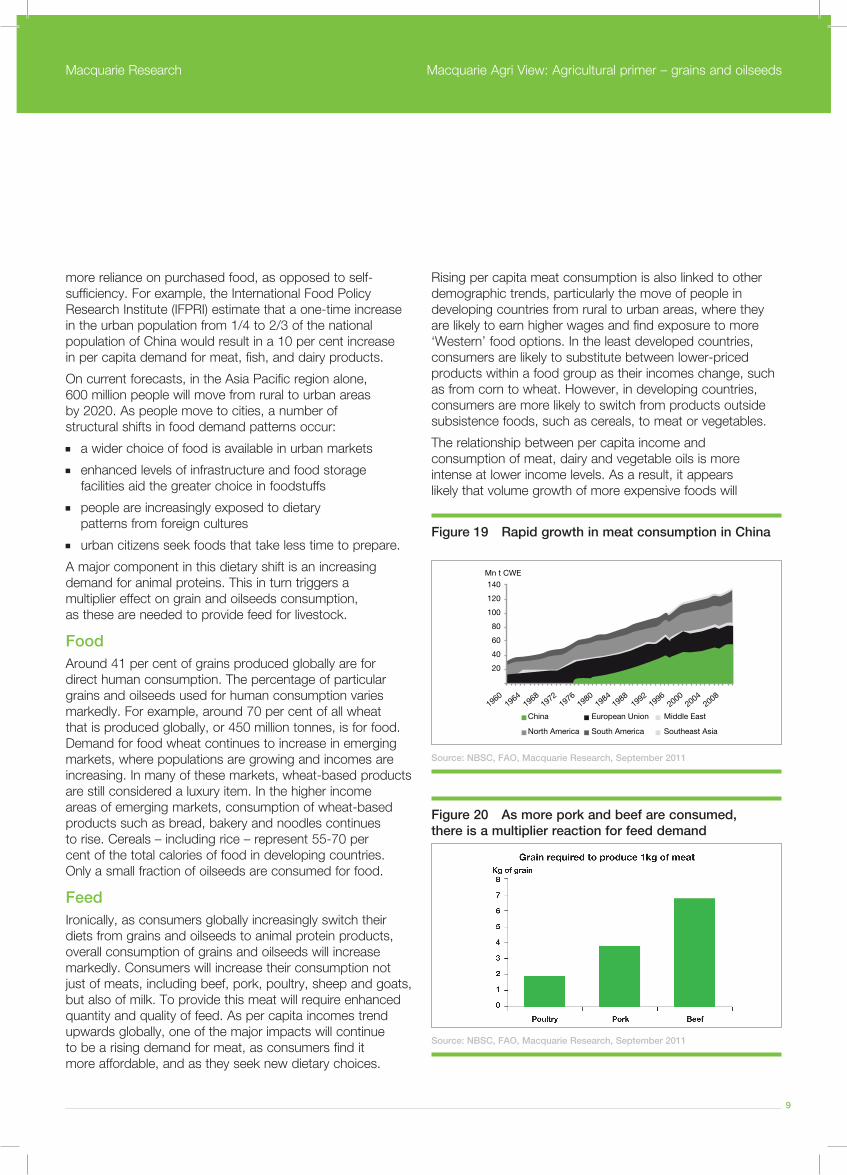
FeedIronically, as consumers globally increasingly switch their diets from grains and oilseeds to animal protein products, overall consumption of grains and oilseeds will increase markedly. Consumers will increase their consumption not just of meats, including beef, pork, poultry, sheep and goats, but also of milk. To provide this meat will require enhanced quantity and quality of feed. As per capita incomes trend upwards globally, one of the major impacts will continue to be a rising demand for meat, as consumers find it more affordable, and as they seek new dietary choices.
Rising per capita meat consumption is also linked to other demographic trends, particularly the move of people in developing countries from rural to urban areas, where they are likely to earn higher wages and find exposure to more ‘Western’ food options. In the least developed countries, consumers are likely to substitute between lower-priced products within a food group as their incomes change, such as from corn to wheat. However, in developing countries, consumers are more likely to switch from products outside subsistence foods, such as cereals, to meat or vegetables.
The relationship between per capita income and consumption of meat, dairy and vegetable oils is more intense at lower income levels. As a result, it appears likely that volume growth of more expensive foods will
Mn t CWE
China
North America
European Union
South America
Middle East
Southeast Asia
140
120
100
80
60
40
20
19601964
19681972
19761980
19841988
19921996
20002004
2008
Figure 19 Rapid growth in meat consumption in China
Source: NBSC, FAO, Macquarie Research, September 2011
Figure 20 As more pork and beef are consumed, there is a multiplier reaction for feed demand
Source: NBSC, FAO, Macquarie Research, September 2011

10
Macquarie Research Macquarie Agri View: Agricultural primer – grains and oilseeds
be most prominent over the next two decades as the major developing countries experience significant and sustained income growth across their population bases.
The switch from grain-based protein to meat protein will result in growing demand for grain and oilseeds, to provide feed for the animals serving the new meat needs. This demand will be proportional, as the conversion ratios of feed to meat is not one to one and thus demand for grains and oilseeds is increased more as meat demand increases. The switch across food groups is most marked in the world’s major markets. In China for example, per capita grain consumption has fallen 40 per cent over the last 15 years, while meat consumption has increased more than 250 per cent. In India, meat consumption has increased 40 per cent over the last 15 years, even though half of all Indian households are vegetarian. For India, however, the major driver of feed consumption is likely to be dairy growth.
Compared to most developing nations, dairy products are already an established component of the Indian diet. According to some forecasts, dairy consumption in India could treble over the next four years. Although India is the largest producer of milk in the world, over 50 per cent of production is still via the unorganised, or informal small-scale sector, so domestic production will be challenged to increase quickly enough to meet this growing demand.
Soybean meal is one of the major sources of animal feed. Demand for feed has been driven by different factors in different regions. In the developing world, particularly China, rising incomes over the past few decades have seen steady growth in meat consumption. In most parts of the world, animals raised for meat are reared indoors for some or all of the year, due to factors such as a lack of available pasture land, or seasonally unsuitable conditions, such as extreme cold. In developed countries, demand for animal feed can be shaped by other factors. For example, as European farmers have banned the import of genetically modified soybeans, they have relied on the import of Brazil’s non-GM soybeans to meet their demands.
In addition, the BSE epidemic, also known as mad cow disease, in Britain was seen by many as being caused by the use of animal bones in livestock feed. Following this, European farmers sought to access a non-animal-based, protein-rich feed for livestock, with soy meal providing an excellent alternative.
FuelAn increasingly important factor in the demand for grains and oilseeds has been the growth of biofuels. Biofuels fall primarily into two categories – ethanol and biodiesel.
In many countries, the main feed stock for producing these is corn for ethanol and vegetable oil for biodiesel. The major exception is Brazil, where ethanol is produced from sugar. Biofuels are now mandated for use in around 41 countries. The growth in biofuels has been due to a number of factors. Biofuels are increasingly seen as more environmentally friendly than fossil fuels, in producing lower greenhouse gas emissions. For countries seeking to reduce their dependence on imported oil, biofuels provide a domestically produced alternative. Ethanol is produced primarily from corn. Around 40 per cent of all corn grown in the US is now used for ethanol feedstock.
Ethanol has long been used as a fuel for automobiles – the original Model T Ford could be adapted to run on ethanol. Ethanol produced from other feed-stocks, particularly corn or woodchips, is commonly known as cellulosic ethanol. Biodiesel is largely produced from vegetable oils, particularly palm and soybean oil. Around 90 per cent of all biodiesel in the US is produced from soy oil. Soybeans and canola both produce around 100 gallons of biodiesel per acre. Globally, the US is both the major producer and consumer of ethanol. Within the US, the current target is for gasoline to contain 10 per cent ethanol, although there is a push from ethanol lobby groups to have this increased to 15 per cent.
In the US, the level of biofuel production is established under the Renewable Fuels Schedule (RFS). The RFS was originally put in place by the Bush administration in 2007, and re-enforced by the Obama administration in 2010. Under the RFS, the US commits to producing a gradually increasing volume of biofuels from 2008 to 2022. For ethanol, this figure is set at nine billion gallons in 2008, rising to 36 billion gallons in 2022. Under the legislation, the level of ethanol to be produced from corn was capped at 15 billion gallons. The remainder of the ethanol was forecast to be made up largely of cellulosic ethanol. However, recent announcements from the EPA have seen forecasts for cellulosic ethanol cut dramatically, from 100 million gallons to 6.5 million, due to both the technology and the economics of producing cellulosic ethanol being well behind initial forecasts. As a result, it seems increasingly likely that increased levels of corn will be required as feedstock to meet future ethanol demands.
On one hand, ethanol’s environmental credentials have only been enhanced. In addition, subsequent restrictions on drilling for oil look likely to increase the role that ethanol will play in US energy supplies. Such a scenario would have a number of impacts on the grain and oilseed sector. In terms of supply, an increased amount of corn being utilised for ethanol would draw even further volumes out of US domestic

11
Macquarie Research Macquarie Agri View: Agricultural primer – grains and oilseeds
and export supply, increasing the competition for other grains. Secondly, increasing biofuel demand for corn would likely place upward pressure on corn prices, leading to an increase in corn acreage, at the expense of other crops. This level of competition, which would particularly affect US wheat supplies, would have an impact of reducing supplies of corn’s competing crops. Biodiesel is increasingly used across a range of transport modes. In Europe, biodiesel can be blended with regular diesel at approximately five per cent, with moves to lift this to 10 per cent.
Some national standards in EU countries allow biodiesel to be distributed as a stand-alone fuel, notably in Germany, for specially adapted vehicles. Progress is being made toward running trains on up to 100 per cent biodiesel, particularly in the US and the UK, while biodiesel-powered planes have already successfully flown. While biodiesel usage seems set to continue growing, it may well be with far greater levels of soybean oil as a feedstock than previously used. The growth of palm oil in natural habitats continues to create controversy and it is foreseeable that ongoing palm oil development will flatten or decline. As a result, it is likely that biodiesel processors will seek to utilise greater levels of soybean oil, further rising demand for global soybean supplies. Overall, it is important to remember that biofuels currently take up only small percentage of global grain and oilseed supplies. However, on a global basis, this accounts for major volume of grains and oilseeds. As a follow on, it means that these grains and oilseeds are being removed from other areas, particularly exports, putting upward pressure on export prices. For uses such as animal feed, it means that other grains and oilseeds, such as wheat, now need to feed the gap filled by the loss of these feed-stocks. In terms of production, the result is that fewer acres are available for growing crops for food and feed.
IndustrialWhile not as well known as food, feed and fuel, the use of grains and oilseeds in industrial products will play an increasing role in the demand of these commodities going forward. A number of factors are behind the push to use more grains and oilseeds in industrial products. As with biofuels, societies are increasingly seeking to replace petrochemical feed stocks with renewable resources. Finally, the increased need to address environmental and community concerns forms a growing part of product marketing. One major example is DuPont’s commitment to source 20 per cent of its products from renewable sources. Industrial products from grains and oilseeds come in an array of forms. An increasing number of pharmaceuticals are made from crops. Biopolymers,
which are used in products such as packaging materials, resins, adhesives, biolubricants, can be sourced from starches from cereals, as well as oils from oilseeds.
The development of BiOH polyols has created a potentially large new market for soybeans. BiOH polyols use soy-based ingredients for flexible foam used in upholstered bedding and furniture, carpet backing and automotive seats. Increasingly they are also being used for airport seating around the world. As a soy-based product, they replace petroleum ingredients typically used in foam production and are seen as environmentally responsible.
A growing number of cosmetics and sunscreen are also using soy oil rather than petroleum-based products. In addition to soybeans, wheat is also being sourced for a number of industrial uses. Wheat has the ability to be elastic and form films that can be stabilised with heat. As such, wheat gluten can be useful for preparation of adhesives, coatings, polymers and resins, straw particle board, strengthened paper, and adhesives, such as those used on postage stamps.
Demand conclusionOverall, the diversity of uses for grains and oilseeds will result in overall demand continuing to increase strongly. Fundamentally, it is important to note that overall demand growth is not dependent on any one factor. Hypothetically, even if the world were inexplicably not to get richer, population growth alone would still continue to drive demand for grains and oilseeds. Or even in the unlikely event that biofuel policies were to change in some countries, grain and oilseed demand for animal feed would still increase due to improving diets through rising incomes. And even if the demand for grains and oilseeds to provide the feedstock for a growing range of industrial products were to soften, the strong rise in demand for biofuels, increasingly pushed by environmental concerns, would still be a major source of growth. Taken as a whole, the combination of these factors will continue to see grains and oilseeds demand climb well into the future.
Grains sensitivities Grain Vs. Fertiliser – Correlation between grains prices
and fertiliser is relatively high. Fertiliser prices are strongly influenced by the demand side of the equation. So when grains prices are high and farmer s margins are good they consume more fertiliser and are willing to pay more. This relationship works in the same way when grains prices fall.

12
Macquarie Research Macquarie Agri View: Agricultural primer – grains and oilseeds
Grain Vs. Gasoline – Gasoline prices influence both the supply side and the demand side of the grains markets. As gasoline prices rise there is more cost pressure on farmers reducing there margins. This is only a small element in their costs though, so the impact is minimal. The reason gasoline prices are positively correlated with grains prices is because of the ethanol story. As gasoline prices rise, ethanol prices usually follow, making ethanol production more profitable and therefore increasing demand for corn.
Grain Vs. Oil – Oil prices have also become increasingly correlated to grains prices because of the ethanol story. There is another element that has led the increase in correlation between agri and energy commodities. The rise
of index funds investing in a basket of commodities across the entire sector means that their trade flows create an additional link between the two commodities subdivisions.
Grain Vs. Equity – There is a very weak correlation between movements in the equity market and movements in the grains market. This is one reason why investors have seen grains as a good diversification investment.
Fertilisers influence on CofP – Fertiliser is by far the largest cost of producing grains in the US, so along with the actual grains price fertiliser costs will be a significant influence on profitability. Fertiliser makes up a large proportion of the costs in the marginal producer of Brazil, but the hidden costs of transportation and currency movements are a big influence too.
Figure 21 There is a relatively high correlation between grains and fertiliser
Source: Reuters, Macquarie Research, September 2011
Figure 23 The oil and grain correlation continues as bio fuels become a larger portion of demand
Source: Macquarie Research, September 2011
Figure 22 Bio fuels has linked the fuels costs and the grain price the farmer receives
Source: Reuters, Macquarie Research, September 2011
Figure 24 Equities show limited correlation with the grains markets over the last 15 years
Source: Macquarie Research, September 2011

13
Macquarie Research Macquarie Agri View: Agricultural primer – grains and oilseeds
Impact of Currency – Movements in the $R have an increasing correlation with grains prices, specifically soybeans. The growing importance of Brazil to world production and as they remain one of the marginal producers means as the $R appreciates vs. the dollar cost of production increase, this leads prices to strengthen.
Figure 25 Fertiliser makes up the largest proportion of total US corn production costs
Source: USDA, Macquarie Research, September 2011
Figure 26 Fertiliser makes up approx. 30-40 per cent of total production costs for corn and soybeans in Brazil
Source: Macquarie Research, September 2011
Figure 27 Movements in the $R have a strong inverse correlation with soybean price as Brazil is the marginal producer
Source: Reuters, Macquarie Research, September 2011
14
Macquarie Research Macquarie Agri View: Agricultural primer – grains and oilseeds
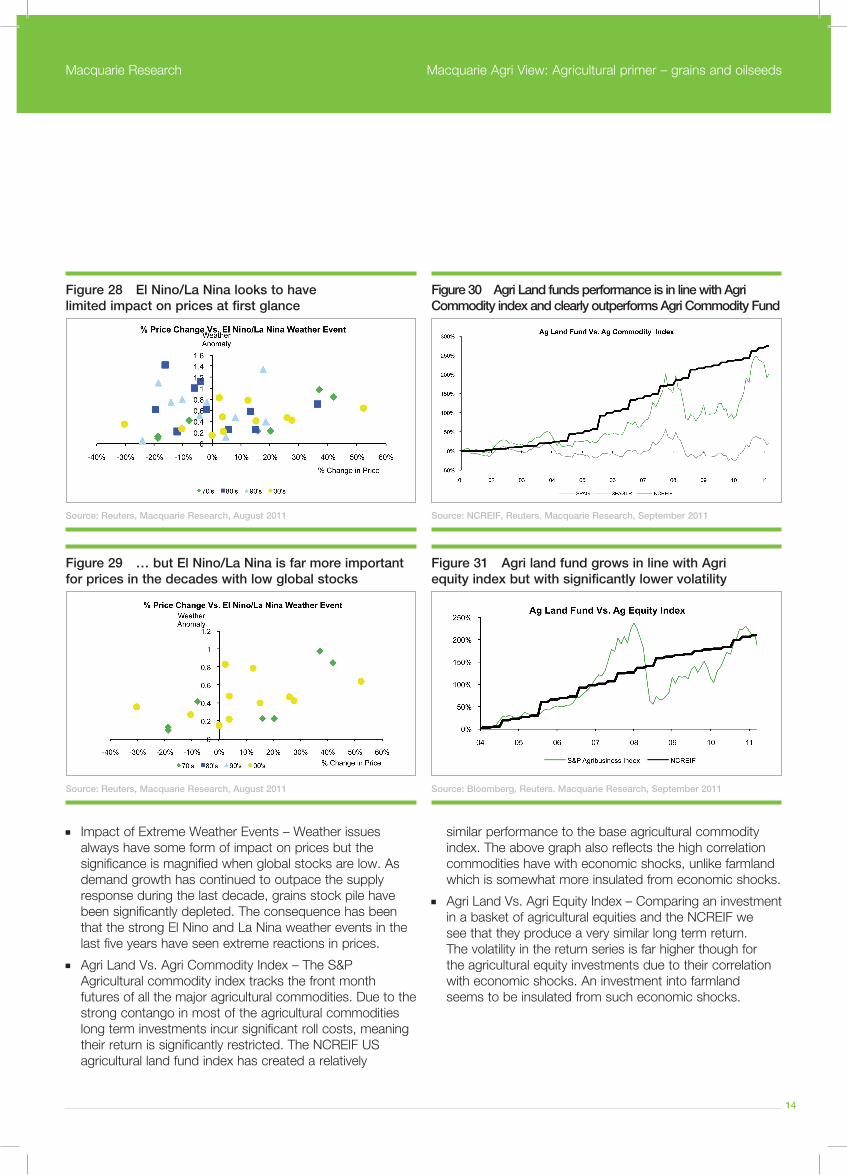
Impact of Extreme Weather Events – Weather issues always have some form of impact on prices but the significance is magnified when global stocks are low. As demand growth has continued to outpace the supply response during the last decade, grains stock pile have been significantly depleted. The consequence has been that the strong El Nino and La Nina weather events in the last five years have seen extreme reactions in prices.
Agri Land Vs. Agri Commodity Index – The S&P Agricultural commodity index tracks the front month futures of all the major agricultural commodities. Due to the strong contango in most of the agricultural commodities long term investments incur significant roll costs, meaning their return is significantly restricted. The NCREIF US agricultural land fund index has created a relatively
similar performance to the base agricultural commodity index. The above graph also reflects the high correlation commodities have with economic shocks, unlike farmland which is somewhat more insulated from economic shocks.
Agri Land Vs. Agri Equity Index – Comparing an investment in a basket of agricultural equities and the NCREIF we see that they produce a very similar long term return. The volatility in the return series is far higher though for the agricultural equity investments due to their correlation with economic shocks. An investment into farmland seems to be insulated from such economic shocks.
Figure 28 El Nino/La Nina looks to have limited impact on prices at first glance
Source: Reuters, Macquarie Research, August 2011
Figure 30 Agri Land funds performance is in line with Agri Commodity index and clearly outperforms Agri Commodity Fund
Source: NCREIF, Reuters. Macquarie Research, September 2011
Figure 29 … but El Nino/La Nina is far more important for prices in the decades with low global stocks
Source: Reuters, Macquarie Research, August 2011
Figure 31 Agri land fund grows in line with Agri equity index but with significantly lower volatility
Source: Bloomberg, Reuters. Macquarie Research, September 2011

15
Macquarie Research Macquarie Agri View: Agricultural primer – grains and oilseeds
Weather’s influence on grains prices El Nino and La Nina weather events have different impacts on different areas of the world. As we see in Figure 33,
La Nina leads to dryness in the US so corn yields on average underperform trend yields in this environment. Conversely in Figure 34 we see that Brazilian yields normally outperform trend when a La Nina weather events occur.
Figure 32 The strength of the La Nina & El Nino events in the last five yrs has been a key driver of grains price vol.
Source: Macquarie Research, September 2011
Figure 33 In the US Corn yields tend to beat trend with El Nino and underperformer with La Nina
Source: USDA, Macquarie Research, September 2011
Figure 34 The scenario is the opposite for Brazil soybeans, La Nina is good and El Nino is bad
Source: Conab, Macquarie Research, September 2011
La Nina = Low US Yield
El Nino = High US YieldLa Nina = High BRL Yield
El Nino = Low BRL Yield

16
Macquarie Research Macquarie Agri View: Agricultural primer – grains and oilseeds
Fertiliser application
KG/Ha Argentina Australia Brazil Canada China Eqypt EU-27 India Russia Ukraine US
Corn Nitrogen
Phosphorous
Potassium
79
35
0.3
87.9
58.8
7
57.5
48.6
49.8
148.5
39.6
69.1
170.5
28
4.4
480.1
38
12.2
158.9
49
44.9
43.1
9.7
2.6
69.2
22.6
17.9
74.8
23.3
16.6
154.8
65
82.2
Barley Nitrogen
Phosphorous
Potassium
56.5
28.4
0.2
20.7
22.3
2.2
43.6
47.5
46.4
66.6
19.2
3.2
181.7
79
10.2
233.2
27.5
7.8
129.4
27.1
19.9
109.1
38.1
7.1
20.3
8.2
3.3
27
11.7
4.8
76.7
36.8
33.6
Soybean Nitrogen
Phosphorous
Potassium
3.6
14.6
0.1
5
72.9
66.9
8.3
23
22.4
51.1
41.1
7.1
16.8
16.3
3
17.9
52.6
77.5
Rapeseed Nitrogen
Phosphorous
Potassium
67.9
55.4
5.7
71.5
16.3
14.3
169
54.5
14.2
136.8
35.3
53.9
107.2
28
28
278.7
127.7
99.2
Sunseed Nitrogen
Phosphorous
Potassium
10
6.6
0.2
104.2
26.3
13.7
34.5
12.8
8.1
31
37.2
11.3
48.9
11.2
13
Figure 35 Fertiliser application rates for different crops around the world
Source: FAPRI, Macquarie Research, September 2011

17
Macquarie Research Macquarie Agri View: Agricultural primer – grains and oilseeds
Important disclosures:
Company Specific Disclosures:Important disclosure information regarding the subject companies covered in this report is available at www.macquarie.com/disclosures.
Analyst Certification: The views expressed in this research accurately reflect the personal views of the analyst(s) about the subject securities or issuers and no part of the compensation of the analyst(s) was, is, or will be directly or indirectly related to the inclusion of specific recommendations or views in this research. The analyst principally responsible for the preparation of this research receives compensation based on overall revenues of Macquarie Group Ltd ABN 94 122 169 279 (AFSL No. 318062) (MGL) and its related entities (the Macquarie Group) and has taken reasonable care to achieve and maintain independence and objectivity in making any recommendations.
General Disclaimers: Macquarie Securities (Australia) Ltd; Macquarie Capital (Europe) Ltd; Macquarie Capital Markets Canada Ltd; Macquarie Capital Markets North America Ltd; Macquarie Capital (USA) Inc; Macquarie Capital Securities Ltd and its Taiwan branch; Macquarie Capital Securities (Singapore) Pte Ltd; Macquarie Securities (NZ) Ltd; Macquarie First South Securities (Pty) Limited; Macquarie Capital Securities (India) Pvt Ltd; Macquarie Capital Securities (Malaysia) Sdn Bhd; Macquarie Securities Korea Limited and Macquarie Securities (Thailand) Ltd are not authorized deposit-taking institutions for the purposes of the Banking Act 1959 (Commonwealth of Australia), and their obligations do not represent deposits or other liabilities of Macquarie Bank Limited ABN 46 008 583 542 (MBL) or MGL. MBL does not guarantee or otherwise provide assurance in respect of the obligations of any of the above mentioned entities. MGL provides a guarantee to the Monetary Authority of Singapore in respect of the obligations and liabilities of Macquarie Capital Securities (Singapore)
Recommendation definitions
Macquarie - australia/New Zealand Outperform – return >3% in excess of benchmark returnNeutral – return within 3% of benchmark return Underperform – return >3% below benchmark return
Benchmark return is determined by long term nominal GDP growth plus 12 month forward market dividend yield
Macquarie – Asia/Europe Outperform – expected return >+10% Neutral – expected return from -10% to +10% Underperform – expected return <-10%
Macquarie First South - South Africa Outperform – expected return >+10% Neutral – expected return from -10% to +10% Underperform – expected return <-10%
Macquarie - Canada Outperform – return >5% in excess of benchmark returnNeutral – return within 5% of benchmark return Underperform – return >5% below benchmark return
Macquarie - USA Outperform (Buy) – return >5% in excess of Russell 3000 index return Neutral (Hold) – return within 5% of Russell 3000 index return Underperform (Sell)– return >5% below Russell 3000 index return
Volatility index definition*
This is calculated from the volatility of historical price movements.
Very high–highest risk – Stock should be expected to move up or down 60–100% in a year – investors should be aware this stock is highly speculative.
High – stock should be expected to move up or down at least 40–60% in a year – investors should be aware this stock could be speculative.
Medium – stock should be expected to move up or down at least 30–40% in a year.
Low–medium – stock should be expected to move up or down at least 25–30% in a year.
Low – stock should be expected to move up or down at least 15–25% in a year.
* Applicable to Australian/NZ/Canada stocks only
Recommendations – 12 months
Note: Quant recommendations may differ from Fundamental Analyst recommendations
Financial definitions
All “Adjusted” data items have had the following adjustments made:
Added back: goodwill amortisation, provision for catastrophe reserves, IFRS derivatives & hedging, IFRS impairments & IFRS interest expense
Excluded: non recurring items, asset revals, property revals, appraisal value uplift, preference dividends & minority interests
EPS = adjusted net profit / efpowa*
ROA = adjusted ebit / average total assets
ROA Banks/Insurance = adjusted net profit /average total assets
ROE = adjusted net profit / average shareholders funds
Gross cashflow = adjusted net profit + depreciation
*equivalent fully paid ordinary weighted average number of shares
All Reported numbers for Australian/NZ listed stocks are modelled under IFRS (International Financial Reporting Standards).
Recommendation proportions – For quarter ending 30 June 2011
AU/NZ Asia RSA USA CA EUR
Outperform 50.37% 64.60% 64.62% 45.63% 67.74% 48.02% (for US coverage by MCUSA, 12.44% of stocks covered are investment banking clients)
Neutral 36.86% 21.22% 29.23% 51.30% 28.50% 38.42% (for US coverage by MCUSA, 12.95% of stocks covered are investment banking clients)
Underperform 12.77% 14.18% 6.15% 3.07% 3.76% 13.56% (for US coverage by MCUSA, 0.00% of stocks covered are investment banking clients)

18
Macquarie Research Macquarie Agri View: Agricultural primer – grains and oilseeds
Pte Ltd for up to SGD 35 million. This research has been prepared for the general use of the wholesale clients of the Macquarie Group and must not be copied, either in whole or in part, or distributed to any other person. If you are not the intended recipient you must not use or disclose the information in this research in any way. If you received it in error, please tell us immediately by return e-mail and delete the document. We do not guarantee the integrity of any e-mails or attached files and are not responsible for any changes made to them by any other person. MGL has established and implemented a conflicts policy at group level (which may be revised and updated from time to time) (the “Conflicts Policy”) pursuant to regulatory requirements (including the FSA Rules) which sets out how we must seek to identify and manage all material conflicts of interest. Nothing in this research shall be construed as a solicitation to buy or sell any security or product, or to engage in or refrain from engaging in any transaction. In preparing this research, we did not take into account your investment objectives, financial situation or particular needs. Before making an investment decision on the basis of this research, you need to consider, with or without the assistance of an adviser, whether the advice is appropriate in light of your particular investment needs, objectives and financial circumstances. There are risks involved in securities trading. The price of securities can and does fluctuate, and an individual security may even become valueless. International investors are reminded of the additional risks inherent in international investments, such as currency fluctuations and international stock market or economic conditions, which may adversely affect the value of the investment. This research is based on information obtained from sources believed to be reliable but we do not make any representation or warranty that it is accurate, complete or up to date. We accept no obligation to correct or update the information or opinions in it. Opinions expressed are subject to change without notice. No member of the Macquarie Group accepts any liability whatsoever for any direct, indirect, consequential or other loss arising from any use of this research and/or further communication in relation to this research. Clients should contact analysts at, and execute transactions through, a Macquarie Group entity in their home jurisdiction unless governing law permits otherwise.
Country-Specific Disclaimers: Australia: In Australia, research is issued and distributed by Macquarie Securities (Australia) Ltd (AFSL No. 238947), a participating organisation of the Australian Securities Exchange. New Zealand: In New Zealand, research is issued and distributed by Macquarie Securities (NZ) Ltd, a NZX
Firm. Canada: In Canada, research is prepared, approved and distributed by Macquarie Capital Markets Canada Ltd, a participating organisation of the Toronto Stock Exchange, TSX Venture Exchange & Montréal Exchange. Macquarie Capital Markets North America Ltd., which is a registered broker-dealer and member of FINRA, accepts responsibility for the contents of reports issued by Macquarie Capital Markets Canada Ltd in the United States and sent to US persons. Any person wishing to effect transactions in the securities described in the reports issued by Macquarie Capital Markets Canada Ltd should do so with Macquarie Capital Markets North America Ltd. The Research Distribution Policy of Macquarie Capital Markets Canada Ltd is to allow all clients that are entitled to have equal access to our research. United Kingdom: In the United Kingdom, research is issued and distributed by Macquarie Capital (Europe) Ltd, which is authorised and regulated by the Financial Services Authority (No. 193905). Germany: In Germany, research is issued and distributed by Macquarie Capital (Europe) Ltd, Niederlassung Deutschland, which is authorised and regulated in the United Kingdom by the Financial Services Authority (No. 193905). France: In France, research is issued and distributed by Macquarie Capital (Europe) Ltd, which is authorised and regulated in the United Kingdom by the Financial Services Authority (No. 193905). Hong Kong & Mainland China: In Hong Kong, research is issued and distributed by Macquarie Capital Securities Ltd, which is licensed and regulated by the Securities and Futures Commission. In Mainland China, Macquarie Securities (Australia) Limited Shanghai Representative Office only engages in non-business operational activities excluding issuing and distributing research. Only non-A share research is distributed into Mainland China by Macquarie Capital Securities Ltd. Japan: In Japan, research is issued and distributed by Macquarie Capital Securities (Japan) Limited, a member of the Tokyo Stock Exchange, Inc. and Osaka Securities Exchange Co. Ltd (Financial Instruments Firm, Kanto Financial Bureau (kin-sho) No. 231, a member of Japan Securities Dealers Association, Financial Futures Association of Japan and Japan Securities Investment Advisers Association). India: In India, research is issued and distributed by Macquarie Capital Securities (India) Pvt Ltd., 92, Level 9, 2 North Avenue, Maker Maxity, Bandra Kurla Complex, Bandra (East), Mumbai – 400 051, India, which is a SEBI registered Stock Broker having membership with National Stock Exchange of India Limited (INB231246738) and Bombay Stock Exchange Limited (INB011246734). Malaysia: In Malaysia, research is issued and distributed by Macquarie Capital Securities (Malaysia) Sdn. Bhd. (Company registration number: 463469-W) which is a Participating

19
Macquarie Research Macquarie Agri View: Agricultural primer – grains and oilseeds
Organisation of Bursa Malaysia Berhad and a holder of Capital Markets Services License issued by the Securities Commission. Taiwan: Information on securities/instruments that are traded in Taiwan is distributed by Macquarie Capital Securities Ltd, Taiwan Branch, which is licensed and regulated by the Financial Supervisory Commission. No portion of the report may be reproduced or quoted by the press or any other person without authorisation from Macquarie. Nothing in this research shall be construed as a solicitation to buy or sell any security or product. Thailand: In Thailand, research is issued and distributed by Macquarie Securities (Thailand) Ltd, a licensed securities company that is authorized by the Ministry of Finance, regulated by the Securities and Exchange Commission of Thailand and is an exchange member no. 28 of the Stock Exchange of Thailand. The Thai Institute of Directors Association has disclosed the Corporate Governance Report of Thai Listed Companies made pursuant to the policy of the Securities and Exchange Commission of Thailand. Macquarie Securities (Thailand) Ltd does not endorse the result of the Corporate Governance Report of Thai Listed Companies but this Report can be accessed at: http://www.thai-iod.com/en/publications.asp?type=4. South Korea: In South Korea, unless otherwise stated, research is prepared, issued and distributed by Macquarie Securities Korea Limited, which is regulated by the Financial Supervisory Services. Information on analysts in MSKL is disclosed at http://dis.kofia.or.kr/fs/dis2/fundMgr/DISFundMgrAnalystPop.jsp?companyCd2=A03053&pageDiv=02. South Africa: In South Africa, research is issued and distributed by Macquarie First South Securities (Pty) Limited, a member of the JSE Limited. Singapore: In Singapore, research is issued and distributed by Macquarie Capital Securities (Singapore) Pte Ltd (Company Registration Number: 198702912C), a Capital Markets Services license holder under the Securities and Futures Act to deal in securities and provide custodial services in Singapore. Pursuant to the Financial Advisers (Amendment) Regulations 2005, Macquarie Capital Securities (Singapore) Pte Ltd is exempt from complying with sections 25, 27 and 36 of the Financial Advisers Act. All Singapore-based recipients of research produced by Macquarie Capital (Europe) Limited, Macquarie Capital Markets Canada Ltd, Macquarie First South Securities (Pty) Limited and Macquarie Capital (USA) Inc. represent and warrant that they are institutional investors as defined in the Securities and Futures Act.
United States: In the United States, research is issued and distributed by Macquarie Capital (USA) Inc., which is a registered broker-dealer and member of FINRA. Macquarie Capital (USA) Inc, accepts responsibility for the content of each research report prepared by one of its non-US affiliates when the research report is distributed in the United States by Macquarie Capital (USA) Inc. Macquarie Capital (USA) Inc.’s affiliate’s analysts are not registered as research analysts with FINRA, may not be associated persons of Macquarie Capital (USA) Inc., and therefore may not be subject to FINRA rule restrictions on communications with a subject company, public appearances, and trading securities held by a research analyst account. Any persons receiving this report directly from Macquarie Capital (USA) Inc. and wishing to effect a transaction in any security described herein should do so with Macquarie Capital (USA) Inc. Important disclosure information regarding the subject companies covered in this report is available at www.macquarie.com/research/disclosures, or contact your registered representative at 1-888-MAC-STOCK, or write to the Supervisory Analysts, Research Department, Macquarie Securities, 125 W.55th Street, New York, NY 10019.
© Macquarie Group
Available to clients on the world wide web at www.macquarieresearch.com and through Thomson Financial, FactSet, Reuters, Bloomberg, CapitalIQ and TheMarkets.com

Macquarie Agri View: Agricultural primer – grains and oilseedsMacquarie Research
For more information about Macquarie Agricultural Funds Management, please contact:
Tim Hornibrook (AUS) Co-Head, Macquarie AgriculturalFunds ManagementP: +61 2 8232 0579 F: +61 2 8232 9999 E: [email protected] Macquarie Group Limited 1 Shelley Street Sydney NSW 2000 Australia
Andrew Sliper (Hong Kong) Agricultural Product SpecialistP: +852 3922 1258 E: [email protected] Macquarie Group Limited One IFC Business Centre Level 19, 1 Harbour View Street Central Hong Kong
Daniel Hough (EU) Agricultural Product SpecialistP: +44 20 3037 2853 E: [email protected] Macquarie Bank International Limited 28 Ropemaker Street London EC2Y 9HD United Kingdom


