16
S Mobility Limited Quarterly Review for the period ended December 31, 2013
S Mobility Limited
Quarterly Review for the period ended December 31, 2013
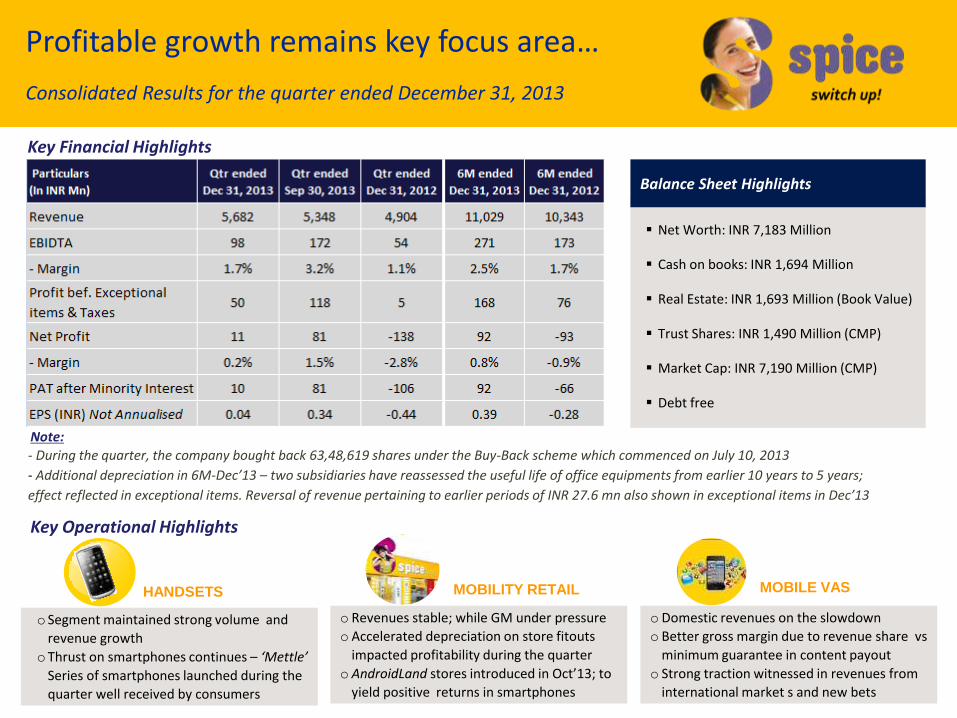
Profitable growth remains key focus area…
Consolidated Results for the quarter ended December 31, 2013
Key Financial Highlights
o Segment maintained strong volume and
revenue growth
oThrust on smartphones continues – ‘Mettle’
Series of smartphones launched during the
quarter well received by consumers
Net Worth: INR 7,183 Million
Cash on books: INR 1,694 Million
Real Estate: INR 1,693 Million (Book Value)
Trust Shares: INR 1,490 Million (CMP)
Market Cap: INR 7,190 Million (CMP)
Debt free
Balance Sheet Highlights
oDomestic revenues on the slowdown
o Better gross margin due to revenue share vs
minimum guarantee in content payout
o Strong traction witnessed in revenues from
international market s and new bets
o Revenues stable; while GM under pressure
o Accelerated depreciation on store fitouts
impacted profitability during the quarter
o AndroidLand stores introduced in Oct’13; to
yield positive returns in smartphones
HANDSETS MOBILITY RETAIL MOBILE VAS
- During the quarter, the company bought back 63,48,619 shares under the Buy-Back scheme which commenced on July 10, 2013
- Additional depreciation in 6M-Dec’13 – two subsidiaries have reassessed the useful life of office equipments from earlier 10 years to 5 years;
effect reflected in exceptional items. Reversal of revenue pertaining to earlier periods of INR 27.6 mn also shown in exceptional items in Dec’13
Note:
Key Operational Highlights
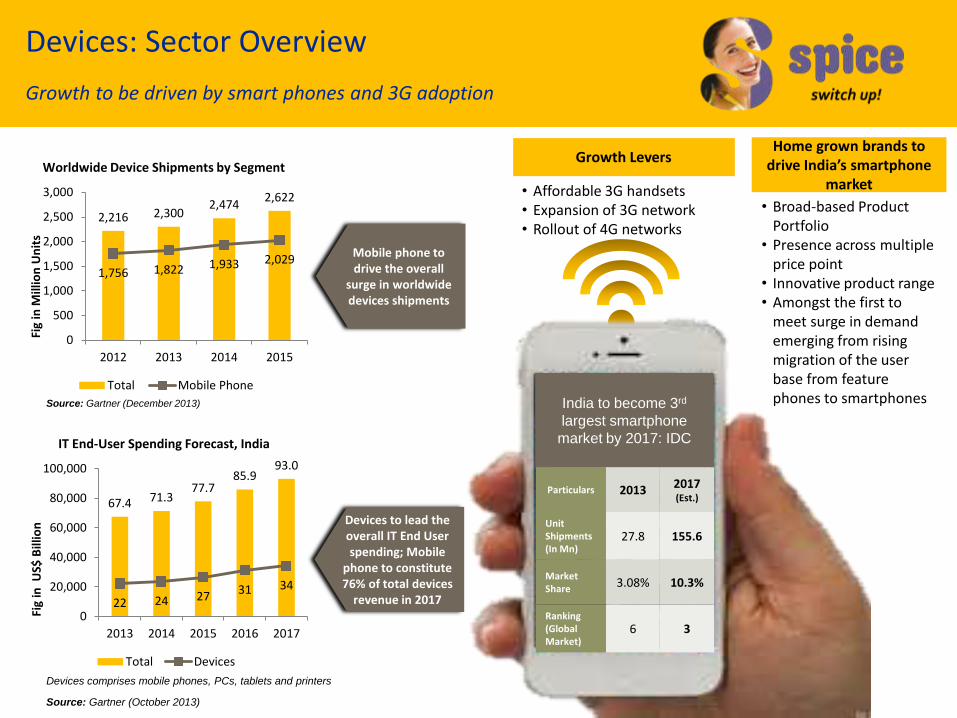
Devices to lead the overall IT End User spending; Mobile
phone to constitute 76% of total devices
revenue in 2017
Devices: Sector Overview
Growth to be driven by smart phones and 3G adoption
2,216 2,300 2,474
2,622
1,756 1,822 1,933 2,029
0
500
1,000
1,500
2,000
2,500
3,000
2012 2013 2014 2015
Fig
in M
illio
n U
nit
s
Worldwide Device Shipments by Segment
Total Mobile Phone
Source: Gartner (December 2013)
67.4 71.3 77.7
85.9 93.0
22 24 27 31 34
0
20,000
40,000
60,000
80,000
100,000
2013 2014 2015 2016 2017
Fig
in U
S$ B
illio
n
IT End-User Spending Forecast, India
Total Devices
Source: Gartner (October 2013)
Devices comprises mobile phones, PCs, tablets and printers
India to become 3rd
largest smartphone
market by 2017: IDC
Particulars 2013 2017 (Est.)
Unit Shipments (In Mn)
27.8 155.6
Market Share
3.08% 10.3%
Ranking (Global Market)
6 3
Growth Levers
• Affordable 3G handsets • Expansion of 3G network • Rollout of 4G networks
• Broad-based Product Portfolio
• Presence across multiple price point
• Innovative product range • Amongst the first to
meet surge in demand emerging from rising migration of the user base from feature phones to smartphones
Home grown brands to drive India’s smartphone
market
Devices to lead the overall IT End User spending; Mobile phone to head the overall devices segment
Mobile phone to drive the overall
surge in worldwide devices shipments

13.97 cm HD display
Android 4.2
1.2 GHz quad Core Processor
8 GB ROM+1GB RAM
2500mAh Battery
Dual SIM
16 Million colors
8MP Auto focus + 2 MP camera
HSPA+
GPS/AGPS
Wi-Fi & EDGE
Expandable Memory up to 32 GB
Bluetooth
FM Radio
G-Sensor
3.5mm jack
LED Flash
Devices: Spice-branded smart phone launches
Quarter ended December 31, 2013
` 3K – 4K
` 4K – 6K
` 6K – 8K
` 8K – 10K
Mi-504
Mi-426
Mi-349 Mi-356
Pri
ce R
an
ge
12.7 cm FWVGA Capacitive Touch
Jellybean 4.2
1.3 GHz Dual Core Processor Battery 1800mAh
Dual SIM (2G + 2G)
8MP + 1.3 camera
4GB ROM +512 MB RAM
512MB ROM +256 MB RAM
Wi-Fi & EDGE
Expandable Memory up to 32 GB
Bluetooth
FM Radio
G-Sensor
3.5mm jack
LED Flash
10.1 cm WVGA Capacitive Touch
Jellybean 4.2
1.3 GHz Dual Core Processor
Battery 1300mAh
Dual SIM (2G + 2G)
3.2MP + 1.3MP camera
AGPS/GSM
GPS/AGPS
Wi-Fi Tethering
Expandable Memory up to 32 GB
Proximity, Gyrosensor,Magnetic Sensor,Ambient Light Sensor,G-sensor
Bluetooth 4.0
Dual LED Flash
9.5mm slim
8.89 cms Capacitive Touch
Android 2.3 Ginger bread
1 GHz single Core Processor
Battery 1200mAh
Wi-Fi/ EDGE Support
AGPS/GMS
FM Radio
Media Player
Expandable Memory up to 32 GB
Bluetooth
LED Flash
8.89 cms Capacitive Touch
1 GHz Dual Core Processor
Android Ver 4.2HVGA Screen
Battery 1200mAh
Dual SIM (2G + 2G)
512MB+256 MB
2MP+ 1.3MP camera
Mi-550
Dual SIM (2G + 2G)
VGA + VGA camera
EDGE Support
AGPS
MI-504 Launched with BBM App
S Mobility signed an agreement
with Blackberry for BBM integration
on Spice Devices during the quarter
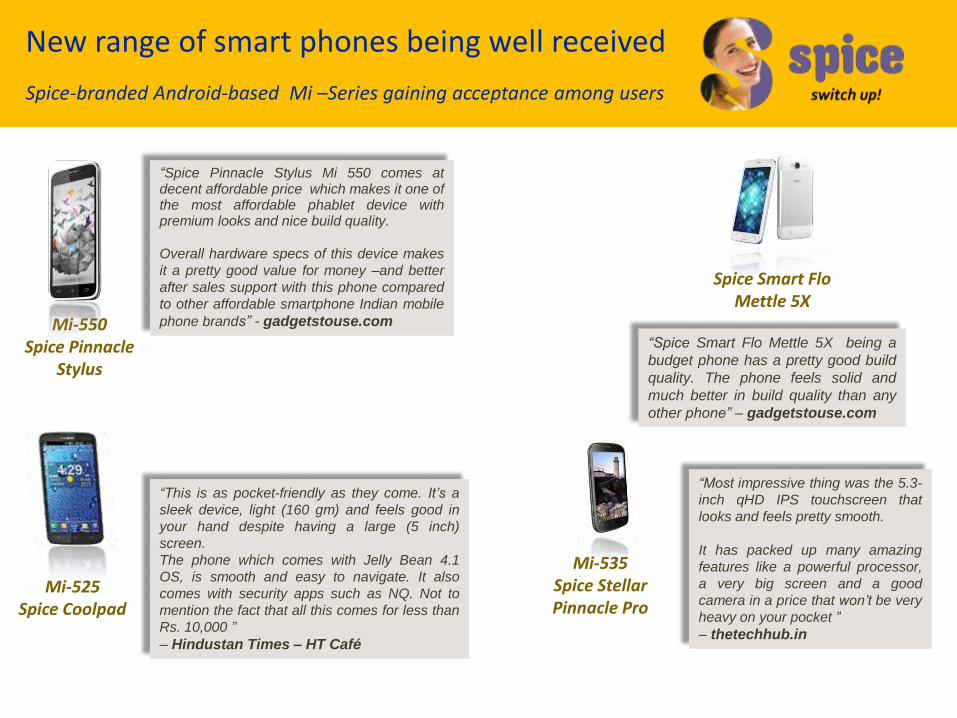
New range of smart phones being well received
Spice-branded Android-based Mi –Series gaining acceptance among users
Mi-535 Spice Stellar Pinnacle Pro
“Spice Pinnacle Stylus Mi 550 comes at decent affordable price which makes it one of the most affordable phablet device with premium looks and nice build quality.
Overall hardware specs of this device makes
it a pretty good value for money –and better
after sales support with this phone compared
to other affordable smartphone Indian mobile
phone brands” - gadgetstouse.com
“This is as pocket-friendly as they come. It’s a
sleek device, light (160 gm) and feels good in
your hand despite having a large (5 inch)
screen.
The phone which comes with Jelly Bean 4.1
OS, is smooth and easy to navigate. It also
comes with security apps such as NQ. Not to
mention the fact that all this comes for less than
Rs. 10,000 ”
– Hindustan Times – HT Café
“Spice Smart Flo Mettle 5X being a
budget phone has a pretty good build
quality. The phone feels solid and
much better in build quality than any
other phone” – gadgetstouse.com
Spice Smart Flo Mettle 5X
Mi-550 Spice Pinnacle
Stylus
Mi-525 Spice Coolpad
“Most impressive thing was the 5.3-
inch qHD IPS touchscreen that
looks and feels pretty smooth.
It has packed up many amazing
features like a powerful processor,
a very big screen and a good
camera in a price that won’t be very
heavy on your pocket ”
– thetechhub.in
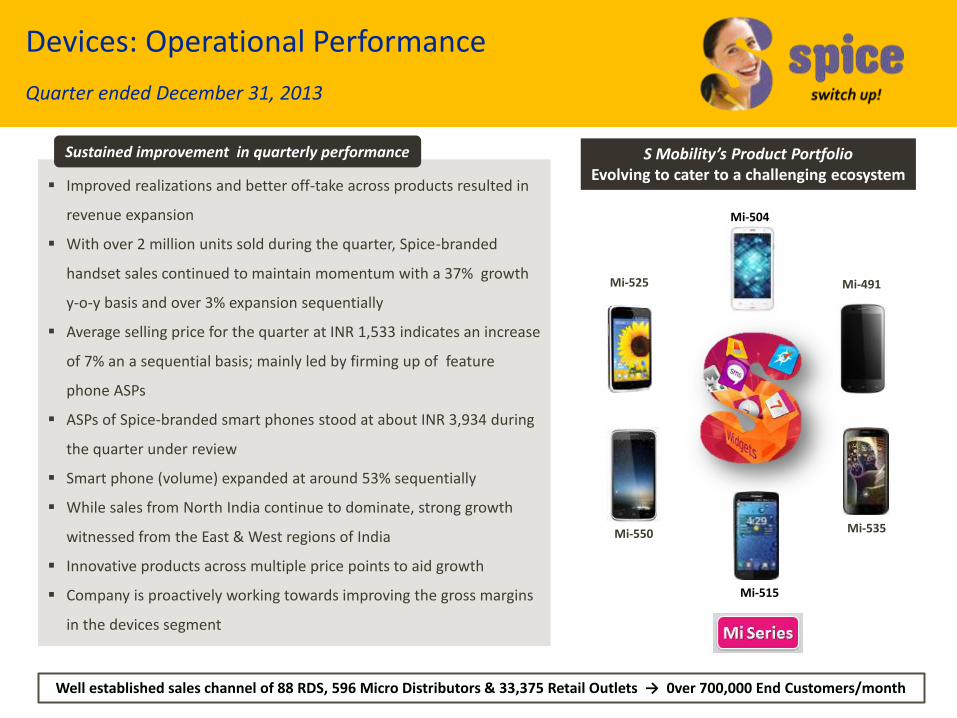
Devices: Operational Performance
Quarter ended December 31, 2013
Well established sales channel of 88 RDS, 596 Micro Distributors & 33,375 Retail Outlets → 0ver 700,000 End Customers/month
Improved realizations and better off-take across products resulted in
revenue expansion
With over 2 million units sold during the quarter, Spice-branded
handset sales continued to maintain momentum with a 37% growth
y-o-y basis and over 3% expansion sequentially
Average selling price for the quarter at INR 1,533 indicates an increase
of 7% an a sequential basis; mainly led by firming up of feature
phone ASPs
ASPs of Spice-branded smart phones stood at about INR 3,934 during
the quarter under review
Smart phone (volume) expanded at around 53% sequentially
While sales from North India continue to dominate, strong growth
witnessed from the East & West regions of India
Innovative products across multiple price points to aid growth
Company is proactively working towards improving the gross margins
in the devices segment
Sustained improvement in quarterly performance S Mobility’s Product Portfolio Evolving to cater to a challenging ecosystem
Mi-504
Mi-525
Mi-515
Mi-550 Mi-535
Mi-491
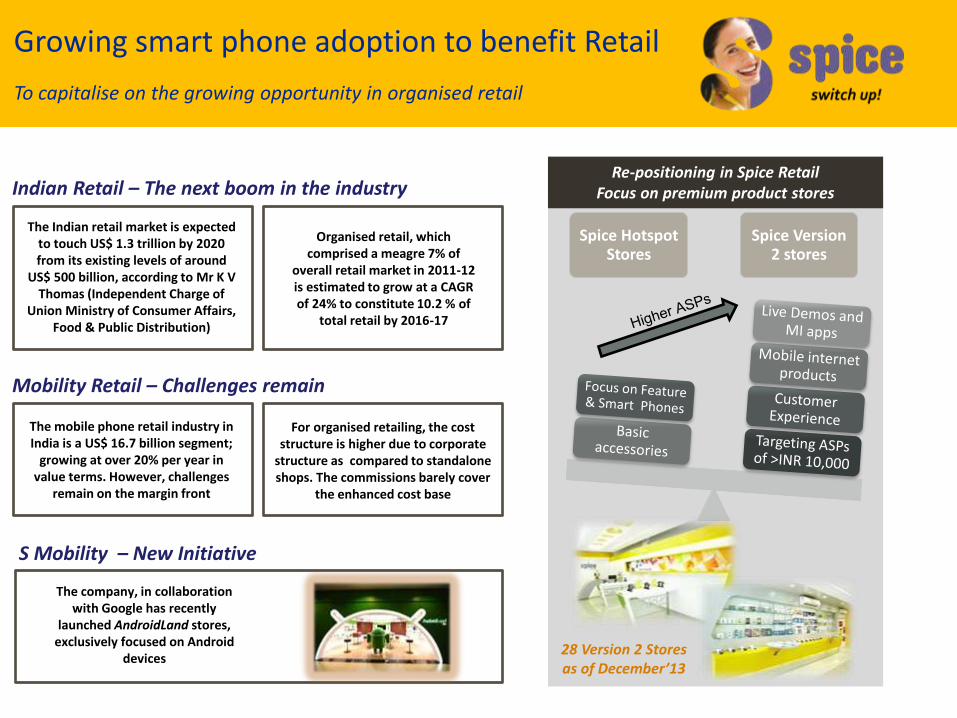
Growing smart phone adoption to benefit Retail
To capitalise on the growing opportunity in organised retail
Re-positioning in Spice Retail Focus on premium product stores
Spice Hotspot Stores
Spice Version 2 stores
Indian Retail – The next boom in the industry
The Indian retail market is expected to touch US$ 1.3 trillion by 2020 from its existing levels of around
US$ 500 billion, according to Mr K V Thomas (Independent Charge of
Union Ministry of Consumer Affairs, Food & Public Distribution)
Organised retail, which comprised a meagre 7% of
overall retail market in 2011-12 is estimated to grow at a CAGR of 24% to constitute 10.2 % of
total retail by 2016-17
The mobile phone retail industry in India is a US$ 16.7 billion segment;
growing at over 20% per year in value terms. However, challenges
remain on the margin front
For organised retailing, the cost structure is higher due to corporate
structure as compared to standalone shops. The commissions barely cover
the enhanced cost base
Mobility Retail – Challenges remain
The company, in collaboration with Google has recently
launched AndroidLand stores, exclusively focused on Android
devices 28 Version 2 Stores as of December’13
S Mobility – New Initiative
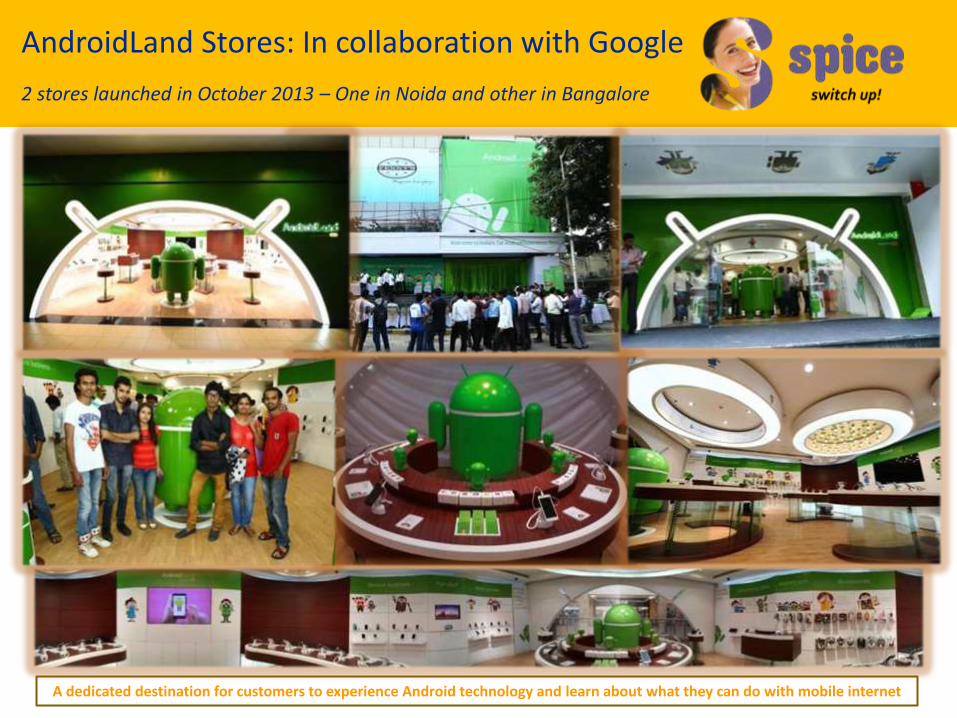
AndroidLand Stores: In collaboration with Google
2 stores launched in October 2013 – One in Noida and other in Bangalore
A dedicated destination for customers to experience Android technology and learn about what they can do with mobile internet

December '13 December '12
88
67
53
28
By Value (%)
By Volume (%)
December '13 December '12
7,921
5,814
13,012 13,804
Overall
Smart Phone
Retail: Operational Performance
Quarter ended December 2013
Share of smartphones in total sales at 88% by value & 53% by volume
Retail ASP during the quarter stood at INR 7,921 up 36% y-o-y, indicative of
our diversified product mix – dominated by sales of smart phones
Smart phone ASPs in retail stores stood at INR 13,012 for the quarter
ended December 2013
Share of S-branded handsets in retail sales improved over that in December
2012; and stood at 19% by volume & 7% by value
Accelerated depreciation on store fitout; old accessories written off in the
six months ended Dec’13
AndroidLand stores introduced in Oct’13; to positively impact sale of
smartphones
Revenues stable; focus on Android-based smart phones continues…
S Mobility’s thrust on organized mobility retailing continues, with more than 400 retail touch points across the country
Spice Hotspots are geared to focus on sale of 3G handsets, laptops, tablets… Share of Smart phone sales (%) Retail ASP trend (INR)
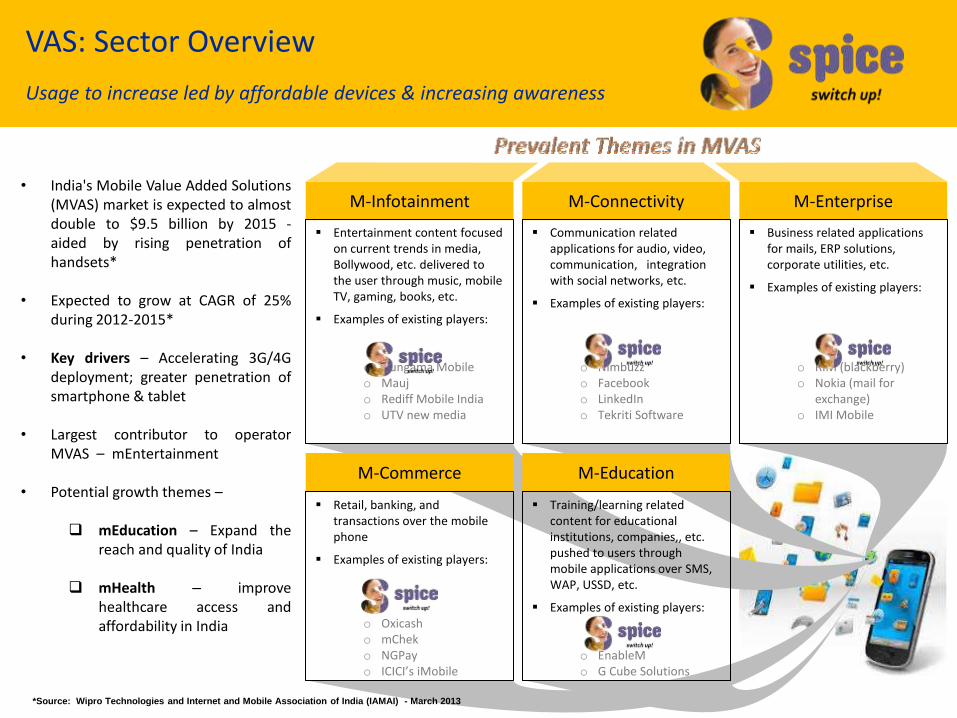
VAS: Sector Overview
Usage to increase led by affordable devices & increasing awareness
• India's Mobile Value Added Solutions (MVAS) market is expected to almost double to $9.5 billion by 2015 - aided by rising penetration of handsets*
• Expected to grow at CAGR of 25%
during 2012-2015* • Key drivers – Accelerating 3G/4G
deployment; greater penetration of smartphone & tablet
• Largest contributor to operator MVAS – mEntertainment
• Potential growth themes –
mEducation – Expand the reach and quality of India
mHealth – improve
healthcare access and affordability in India
M-Infotainment M-Connectivity M-Enterprise
M-Commerce M-Education
Entertainment content focused on current trends in media, Bollywood, etc. delivered to the user through music, mobile TV, gaming, books, etc.
Examples of existing players:
o Hungama Mobile o Mauj o Rediff Mobile India o UTV new media
Retail, banking, and transactions over the mobile phone
Examples of existing players:
o Oxicash o mChek o NGPay o ICICI’s iMobile
Communication related applications for audio, video, communication, integration with social networks, etc.
Examples of existing players:
o Nimbuzz o Facebook o LinkedIn o Tekriti Software
Training/learning related content for educational institutions, companies,, etc. pushed to users through mobile applications over SMS, WAP, USSD, etc.
Examples of existing players:
o EnableM o G Cube Solutions
Business related applications for mails, ERP solutions, corporate utilities, etc.
Examples of existing players:
o RIM (blackberry) o Nokia (mail for
exchange) o IMI Mobile
*Source: Wipro Technologies and Internet and Mobile Association of India (IAMAI) - March 2013
VAS: Operational Performance
Quarter ended December 2013
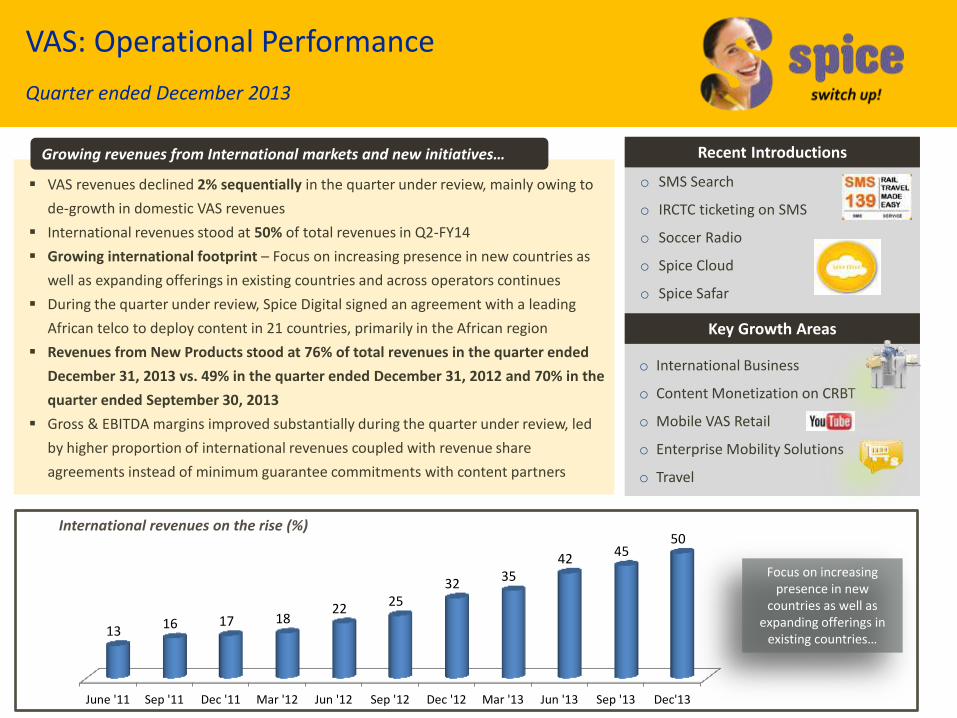
VAS revenues declined 2% sequentially in the quarter under review, mainly owing to
de-growth in domestic VAS revenues
International revenues stood at 50% of total revenues in Q2-FY14
Growing international footprint – Focus on increasing presence in new countries as
well as expanding offerings in existing countries and across operators continues
During the quarter under review, Spice Digital signed an agreement with a leading
African telco to deploy content in 21 countries, primarily in the African region
Revenues from New Products stood at 76% of total revenues in the quarter ended
December 31, 2013 vs. 49% in the quarter ended December 31, 2012 and 70% in the
quarter ended September 30, 2013
Gross & EBITDA margins improved substantially during the quarter under review, led
by higher proportion of international revenues coupled with revenue share
agreements instead of minimum guarantee commitments with content partners
Growing revenues from International markets and new initiatives…
International revenues on the rise (%)
o SMS Search
o IRCTC ticketing on SMS
o Soccer Radio
o Spice Cloud
o Spice Safar
Recent Introductions
Key Growth Areas
o International Business
o Content Monetization on CRBT
o Mobile VAS Retail
o Enterprise Mobility Solutions
o Travel
June '11 Sep '11 Dec '11 Mar '12 Jun '12 Sep '12 Dec '12 Mar '13 Jun '13 Sep '13 Dec'13
13 16 17 18
22 25
32 35
42 45
50
Focus on increasing presence in new
countries as well as expanding offerings in
existing countries…
• S Mobility Limited is a part of Spice Global, a multi-faceted group with an extensive telecom eco-system in India
• Initially established in 2004, the Company is amongst the top 3 mobile brands nationally
• S Mobility is the flagship of the Spice Global business offering a combined and unique experience of devices, digital lifestyle, retail, mobile VAS and Apps to its customers across geographies
• S Mobility is the proud winner of the Golden Peacock Award for innovative product / service for the year 2007 and for 2010
• Debuted with dual SIM handsets targeting entry, mid and premium segments as the brand grows rapidly with its expansive bouquet of offerings
• S Mobility added more firsts to its credit by announcing the Global premier of the World’s first ‘Movie Phone’ and peoples’ phone at the World Mobile Congress, Barcelona in February 2008
• Riding on the success of its venture, S Mobility Ltd. has strengthened its footprint, built a strong value proposition with the customers and established itself as a competitive brand amongst the host of International players
• The Company aims at achieving higher brand acceptability among all target segments by manufacturing cutting-edge handsets that combine mobile phone functionality with enriched content and smart device capabilities for greater high-speed voice and data capacity
S Mobility Limited
A brief background
Annexure
Results for the quarter ended December 31, 2013
S Mobility Limited
Financial Results for the period ended December 31, 2013

(Rs. In Lacs)
12 months
ended
31.12.2013 30.9.2013 31.12.2012 31.12.2013 31.12.2012 30.6.2013
(Unaudited) (Unaudited) (Unaudited) (Unaudited) (Unaudited) (Audited)
1 a. Net Sales/Income from operation 56,704 53,402 49,037 110,106 103,377 186,895
b. Other Operating Income 112 76 6 188 48 99
Total 56,816 53,478 49,043 110,294 103,425 186,994
2 Expenditure:
a. (Increase) / Decrease in stock in trade 836 (5,309) (574) (4,473) 1,976 2,670
b. Purchase of Finished/Traded Goods 44,278 45,765 37,307 90,043 76,747 136,924
c. Consumption of Raw Materials and components - - - - - 2
d.Connectivity and Content Cost 1,666 1,826 2,474 3,492 4,834 8,945
e. Staff Cost 2,876 2,819 3,134 5,695 6,104 11,970
f. Depreciation/Amortisation 977 879 877 1,856 1,747 3,625
g. Branding Expenses 1,518 1,699 1,080 3,217 2,060 4,126
h. Other expenditure 4,660 4,954 5,079 9,614 9,973 16,932
Total expenditure 56,811 52,633 49,377 109,444 103,441 185,194
3 Profit/(Loss) from Operations before other income, finance cost,
exceptional items and taxes (1-2)
5 845 (334) 850 (14) 1,800
4 Other Income 520 377 420 897 820 1,455
5 Profit before finance cost, exceptional items and taxes (3+4) 525 1,222 86 1,747 806 3,255
6 Finance Cost 21 46 38 67 48 103
7 Profit before exceptional items and taxes (5-6) 504 1,176 48 1,680 758 3,152
8 Exceptional Items
- Provision against claims / expected claims for earlier periods - - (1,320) - (1,547) (227)
- Impairment of Goodwill of a subsidiary company - - - - - (1,045)
- Additional Depreciation due to change of useful life (Refer Note no. 3 below) (16) (264) - (280) - -
- Reversal of revenue pertaining to earlier periods (276) - - (276) - -
9 Profit/(Loss) from ordinary activities before taxes (7+8) 212 912 (1,272) 1,124 (789) 1,880
10 Provision for Taxation 104 101 105 205 136 1,410
11 Net Profit/(Loss) for the period (9-10) 108 811 (1,377) 919 (925) 470
12 Minority Interest 6 (2) (315) 4 (265) (78)
13 Net Profit/(Loss) after Minority Interest (11-12) 102 813 (1,062) 915 (660) 548
14 Paid up Equity Share Capital (Face value of Rs.3/- each) 6,836 7,027 7,143 6,836 7,143 7,143
15 Reserves excluding revaluation reserves 67,556
16 Basic and Diluted Earnings Per Share (in Rs.) (Not Annualised) 0.04 0.34 (0.44) 0.39 (0.28) 0.23
A. PARTICULARS OF SHAREHOLDING
1 Public Shareholding
- No. of Shares 58,418,512 64,772,131 68,658,496 58,418,512 68,658,496 68,638,715
- Percentage of Shareholding 25.64% 27.65% 28.84% 25.64% 28.84% 28.83%
2 Promoters & promoter group shareholding
a) Pledged / Encumbered
- Number of shares - - - - - -
- Percentage of shares (as a % of the total shareholding of - - - - - -
promoters & promoter group)
- Percentage of shares (as a % of the total share capital - - - - - -
of the Company)
b) Non-encumbered
- Number of shares 169,447,570 169,447,570 169,427,789 169,447,570 169,427,789 169,447,570
- Percentage of shares (as a % of the total shareholding of 100% 100% 100% 100% 100% 100%
promoters and promoter group)
- Percentage of shares (as a % of the total share capital 74.36% 72.35% 71.16% 74.36% 71.16% 71.17%
of the Company)
B. INVESTOR COMPLAINTS
Pending at the beginning of the quarter Nil
Received during the quarter 8
Disposed off during the quarter 8
Remaining unresolved at the end of the quarter Nil
Sl.No. Particulars Consolidated
3 months ended 6 months ended
S MOBILITY LIMITED
Regd. Office : 19A &19B, Sector - 125, Noida 201301, District Gautam Budh Nagar , Uttar Pradesh
Unaudited Consolidated Financial Results for the quarter and six months period ended December 31, 2013
PART I STATEMENT OF CONSOLIDATED UNAUDITED FINANCIAL RESULTS FOR THE QUARTER AND SIX MONTHS PERIOD ENDED DECEMBER 31, 2013
PART II SELECT INFORMATION FOR THE QUARTER AND SIX MONTHS PERIOD ENDED DECEMBER 31, 2013
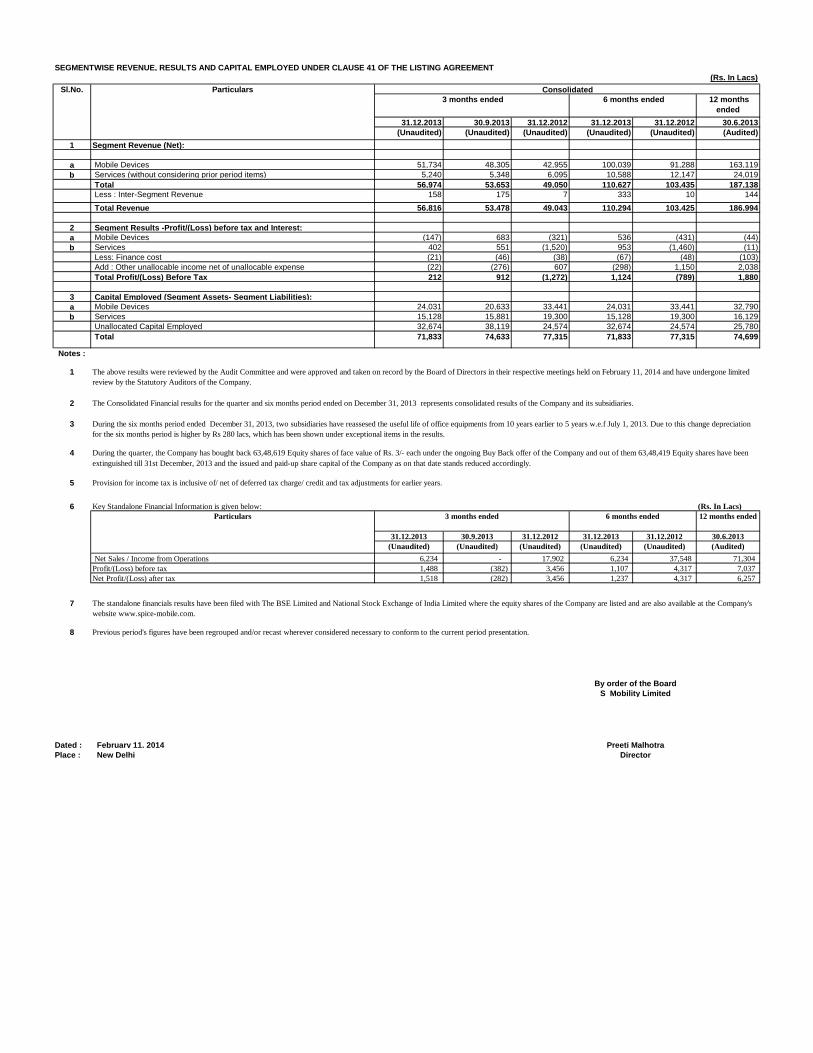
SEGMENTWISE REVENUE, RESULTS AND CAPITAL EMPLOYED UNDER CLAUSE 41 OF THE LISTING AGREEMENT
(Rs. In Lacs)
12 months
ended
31.12.2013 30.9.2013 31.12.2012 31.12.2013 31.12.2012 30.6.2013
(Unaudited) (Unaudited) (Unaudited) (Unaudited) (Unaudited) (Audited)
1 Segment Revenue (Net):
a Mobile Devices 51,734 48,305 42,955 100,039 91,288 163,119
b Services (without considering prior period items) 5,240 5,348 6,095 10,588 12,147 24,019
Total 56,974 53,653 49,050 110,627 103,435 187,138
Less : Inter-Segment Revenue 158 175 7 333 10 144
Total Revenue 56,816 53,478 49,043 110,294 103,425 186,994
- - - - - -
2 Segment Results -Profit/(Loss) before tax and Interest:
a Mobile Devices (147) 683 (321) 536 (431) (44)
b Services 402 551 (1,520) 953 (1,460) (11)
Less: Finance cost (21) (46) (38) (67) (48) (103)
Add : Other unallocable income net of unallocable expense (22) (276) 607 (298) 1,150 2,038
Total Profit/(Loss) Before Tax 212 912 (1,272) 1,124 (789) 1,880
0.00 - 0.00 (0.20) 0.00 -
3 Capital Employed (Segment Assets- Segment Liabilities):
a Mobile Devices 24,031 20,633 33,441 24,031 33,441 32,790
b Services 15,128 15,881 19,300 15,128 19,300 16,129
Unallocated Capital Employed 32,674 38,119 24,574 32,674 24,574 25,780
Total 71,833 74,633 77,315 71,833 77,315 74,699
Notes :
1
2
3
4
5
6 Key Standalone Financial Information is given below: (Rs. In Lacs)
12 months ended
31.12.2013 30.9.2013 31.12.2012 31.12.2013 31.12.2012 30.6.2013
(Unaudited) (Unaudited) (Unaudited) (Unaudited) (Unaudited) (Audited)
Net Sales / Income from Operations 6,234 - 17,902 6,234 37,548 71,304
Profit/(Loss) before tax 1,488 (382) 3,456 1,107 4,317 7,037
Net Profit/(Loss) after tax 1,518 (282) 3,456 1,237 4,317 6,257
7
8
Dated : February 11, 2014
Place : New Delhi
Sl.No. Particulars Consolidated
3 months ended 6 months ended
The standalone financials results have been filed with The BSE Limited and National Stock Exchange of India Limited where the equity shares of the Company are listed and are also available at the Company's
website www.spice-mobile.com.
The above results were reviewed by the Audit Committee and were approved and taken on record by the Board of Directors in their respective meetings held on February 11, 2014 and have undergone limited
review by the Statutory Auditors of the Company.
The Consolidated Financial results for the quarter and six months period ended on December 31, 2013 represents consolidated results of the Company and its subsidiaries.
During the six months period ended December 31, 2013, two subsidiaries have reassesed the useful life of office equipments from 10 years earlier to 5 years w.e.f July 1, 2013. Due to this change depreciation
for the six months period is higher by Rs 280 lacs, which has been shown under exceptional items in the results.
During the quarter, the Company has bought back 63,48,619 Equity shares of face value of Rs. 3/- each under the ongoing Buy Back offer of the Company and out of them 63,48,419 Equity shares have been
extinguished till 31st December, 2013 and the issued and paid-up share capital of the Company as on that date stands reduced accordingly.
Provision for income tax is inclusive of/ net of deferred tax charge/ credit and tax adjustments for earlier years.
Particulars 3 months ended 6 months ended
S Mobility Limited
Preeti Malhotra
Director
Previous period's figures have been regrouped and/or recast wherever considered necessary to conform to the current period presentation.
By order of the Board
FFoorr ffuurrtthheerr iinnffoorrmmaattiioonn pplleeaassee ccoonnttaacctt::
Certain statements in this document may be forward-looking statements. Such forward-looking statements are subject to certain
risks and uncertainties like government actions, local political or economic developments, technological risks, and many other
factors that could cause our actual results to differ materially from those contemplated by the relevant forward-looking
statements. Spice Mobility will not be in any way responsible for any action taken based on such statements and undertakes no
obligation to publicly update these forward-looking statements to reflect subsequent events or circumstances.
Gavin Desa / Suraj Digawalekar Citigate Dewe Rogerson Tel: +91 22 66451237 / 66451235 Fax: +91 22 66451213 Email: [email protected] / [email protected]
Hetal Shah S Mobility Limited Tel: +91-8652777500 Email: [email protected]
S Mobility Limited


