Page 1
1
QUARTERLY SECTOR STATISTICS REPORT
THIRD QUARTER OF THE FINANCIAL YEAR 2013/14
(JAN-MAR 2014)
Direct any queries to this report to:
Director/Competition, Tariffs and Market Analysis
Tel:+254-703 042000
Email: [email protected]
Website: www.ac.go.ke
Disclaimer:
Although every effort has been made to ensure accuracy of the data contained in this report, the
Commission is not liable for inaccuracies in any of the information contained in this report,
which is contingent upon the operators/service providers’ compliance returns.
Page 2
2
TABLE OF CONTENTS
LIST OF ABBREVIATIONS ........................................................................................................ 5
I. PRELIMINARY NOTES ....................................................................................................... 6
II. THE QUARTER IN SUMMARY .......................................................................................... 6
1. CELLULAR MOBILE SERVICES....................................................................................... 8
1.1 Subscriptions ............................................................................................................. 8
1.2 Mobile Money Transfer Service ............................................................................ 11
1.3 Mobile Number Portability .................................................................................... 11
1.4 Mobile Traffic and Usage Pattern ......................................................................... 12 1.4.1 Voice Traffic ............................................................................................................. 12
1.4.2 Voice Traffic by Operator ......................................................................................... 14
1.4.3 Minutes of Use .......................................................................................................... 15
1.4.4 Roaming Traffic ........................................................................................................ 17
1.1.1 International Mobile Traffic ..................................................................................... 18
1.2 Mobile Revenue and Investments .......................................................................... 19
2. FIXED TELEPHONE SERVICE ....................................................................................... 20
2.1 Subscriptions ........................................................................................................... 20
2.2 Fixed Network Traffic ............................................................................................ 21
3. DATA AND INTERNET SERVICE ................................................................................... 22
3.1 Internet/Data Service .............................................................................................. 22
3.2 Broadband Service .................................................................................................. 25
3.3 International Bandwidth ........................................................................................ 26
3.4 Revenue and Investment in the Data/Internet Market ....................................... 27
4. ELECTRONIC TRANSACTIONS ...................................................................................... 27
5. BROADCASTING ............................................................................................................... 28
6. POSTAL AND COURIER SERVICE ................................................................................. 29
6.1 Postal and Courier Traffic ..................................................................................... 29
6.2 Number of Postal Outlets ....................................................................................... 29
6.3 Postal and Courier Revenue and Investment ....................................................... 30
7. CONCLUSION..................................................................................................................... 30
Page 3
3
LIST OF TABLES
Table 1: Mobile Subscriptions ....................................................................................... 8
Table 2: Mobile Subscription per operator .................................................................... 9
Table 3: Mobile Money Transfer ................................................................................. 11
Table 4: Number of In-ports ........................................................................................ 12
Table 5: Local Mobile Voice Traffic in Minutes ........................................................ 13
Table 6: Voice Traffic by Operator ............................................................................. 15
Table 7: Short Messaging Service per Operator .......................................................... 17
Table 8: Multimedia Messaging Service ..................................................................... 17
Table 9: Roaming Traffic ............................................................................................ 18
Table 10: International Mobile Traffic (Minutes) ......................................................... 19
Table 11: Mobile Revenue and Investment (KES) ........................................................ 20
Table 12: Fixed Network Subscriptions ........................................................................ 20
Table 13: Local Fixed Network Traffic in Minutes ...................................................... 21
Table 14: Fixed Network International Voice Traffic ................................................... 22
Table 15: Internet Subscriptions and Internet Users ..................................................... 23
Table 16: Mobile data/internet subscription by operator ............................................... 24
Table 17: Other Fixed/Wireless Internet Subscriptions by Operator ............................ 25
Table 18: International Internet Available Bandwidth (Mbps) ..................................... 26
Table 19: International Internet Connectivity Bandwidth (Mbps) ................................ 26
Table 20: Data/Internet Revenue and Investment ......................................................... 27
Table 21: Average Broadcast Audience ........................................................................ 28
Table 22: Percentage program content (Both TV and Radio) ....................................... 28
Table 23: Postal and Courier Traffic ............................................................................. 29
Table 24: Postal and Courier Revenue and Investments ............................................... 30
Page 4
4
LIST OF FIGURES
FIGURE 1: NET ADDITIONS IN MOBILE SUBSCRIPTIONS ................................................................. 9
FIGURE 2: PERCENTAGE MARKET SHARE SUBSCRIPTION PER OPERATOR .................................. 10
FIGURE 3: PERCENTAGE MOBILE PENETRATION ......................................................................... 11
FIGURE 4: PROPORTION OF VOICE TRAFFIC ON-NET OFF-NET ..................................................... 14
FIGURE 5: MINUTES OF USE ....................................................................................................... 16
FIGURE 6: ESTIMATED NUMBER OF INTERNET USERS AND INTERNET PENETRATION ................. 24
FIGURE 7: BROADBAND SUBSCRIPTIONS .................................................................................... 25
FIGURE 8: DOMAIN NAMES REGISTRATION ................................................................................. 27
Page 5
5
LIST OF ABBREVIATIONS
ICTs EASSy EVDO GSM LION2
Information Communication Technologies Eastern Africa Submarine Cable System Evolution-Data Optimized Global Systems for Mobile Communications Lower Indian Ocean Network
Mbps MMS
Megabits per second Multimedia Service
MoU SEACOM
Minutes of Use Sea Sub-Marine Communications Limited
SIM Subscriber Identification Module SMS Short Messaging Service
TEAMS The East African Marine System
VSAT Very Small Aperture Terminal
FY Financial Year
Page 6
6
I. PRELIMINARY NOTES
This report is based on data provided by service providers.
The information provided in this quarterly report is subject to alteration in case of any
revisions or updates from the service providers.
II. THE QUARTER IN SUMMARY
The ICT Sector Quarterly Statistics Report for quarter three of the Financial Year 2013/14 (Q3
FY 2013/14) provides an overview of the performance and development trends in the ICT sector
using data analysis of indicators from the following service categories:
Mobile telephony
Fixed telephony
Internet/Data
Electronic Transactions
Broadcasting
Postal and Courier
As has been the trend, mobile telephony experienced a marginal increase in the number of
mobile subscriptions during the quarter to post 31.8 million subscriptions up from 31.3 million
recorded during the last quarter. This represented growth of 1.7 per cent during the period.
Prepaid subscriptions increased by 1.5 per cent during the quarter to stand at 31.2 million
subscriptions up from 30.7 million during the previous quarter. Post-paid subscriptions have
continued to record an upward trend with the quarter under review registering growth of 8.4 per
cent to reach 607,569 up from 560,503 subscriptions posted during the previous quarter.
Mobile penetration grew by 1.3 percentage points during the quarter to stand at 78.2 per cent.
Mobile money transfer demonstrated an upward trend of 0.9 per cent to record 26.2 million
subscriptions from 26.0 million posted in the previous quarter. Similarly, the number of money
transfer agents increased by 10.6 per cent to stand at 103,660 agents.
Mobile Number Portability has shown mixed trends over time. During the period under review,
the number of in-ports increased by 31.2 per cent to stand at 362 in-ports up from 276 in-ports
recorded in the previous quarter.
Despite the growth in mobile subscriptions, there was a recorded decline in local mobile voice
traffic of 2.7 per cent to post 7.6 billion minutes down from 7.8 billion minutes recorded during
the previous quarter. Moreover subscriber average minutes of use was recorded at 80.3 minutes
per month compared to 84.1 minutes registered in the last quarter.
Similarly, SMS traffic declined by 1.0 per cent to reach 6.22 billion down from 6.28 billion
messages sent during the preceding quarter. Thus, each subscriber sent out an average of 65.1
messages per month.
Page 7
7
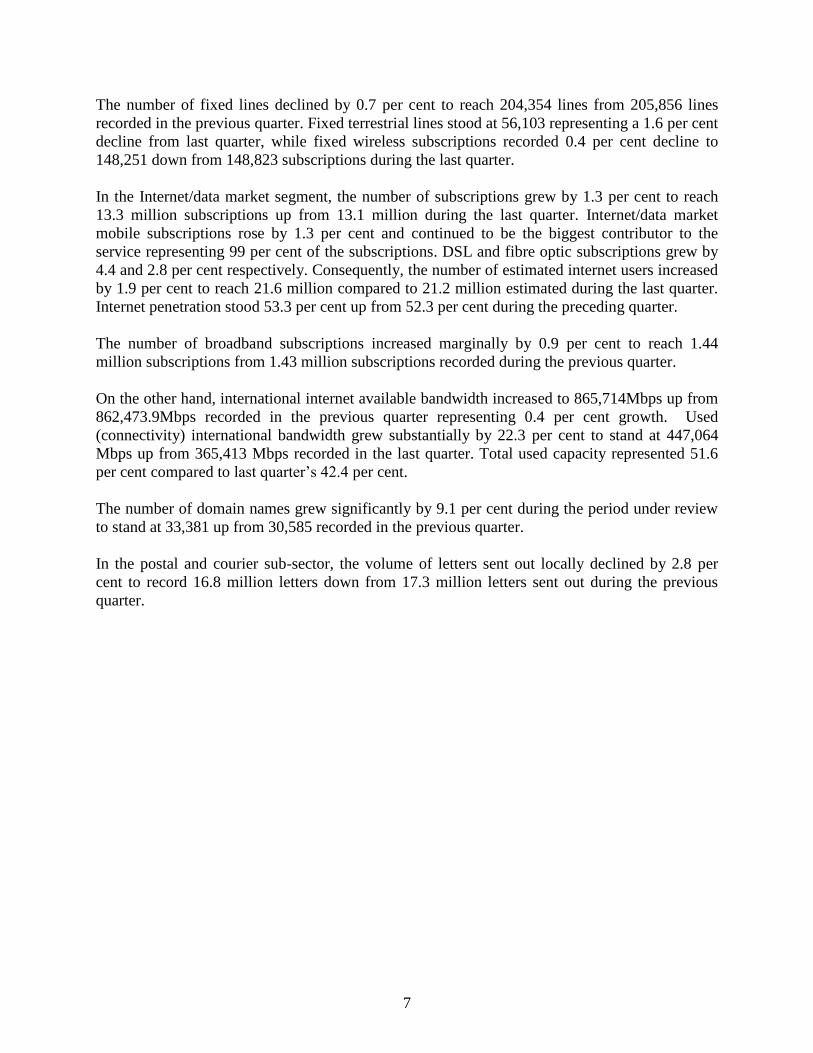
The number of fixed lines declined by 0.7 per cent to reach 204,354 lines from 205,856 lines
recorded in the previous quarter. Fixed terrestrial lines stood at 56,103 representing a 1.6 per cent
decline from last quarter, while fixed wireless subscriptions recorded 0.4 per cent decline to
148,251 down from 148,823 subscriptions during the last quarter.
In the Internet/data market segment, the number of subscriptions grew by 1.3 per cent to reach
13.3 million subscriptions up from 13.1 million during the last quarter. Internet/data market
mobile subscriptions rose by 1.3 per cent and continued to be the biggest contributor to the
service representing 99 per cent of the subscriptions. DSL and fibre optic subscriptions grew by
4.4 and 2.8 per cent respectively. Consequently, the number of estimated internet users increased
by 1.9 per cent to reach 21.6 million compared to 21.2 million estimated during the last quarter.
Internet penetration stood 53.3 per cent up from 52.3 per cent during the preceding quarter.
The number of broadband subscriptions increased marginally by 0.9 per cent to reach 1.44
million subscriptions from 1.43 million subscriptions recorded during the previous quarter.
On the other hand, international internet available bandwidth increased to 865,714Mbps up from
862,473.9Mbps recorded in the previous quarter representing 0.4 per cent growth. Used
(connectivity) international bandwidth grew substantially by 22.3 per cent to stand at 447,064
Mbps up from 365,413 Mbps recorded in the last quarter. Total used capacity represented 51.6
per cent compared to last quarter’s 42.4 per cent.
The number of domain names grew significantly by 9.1 per cent during the period under review
to stand at 33,381 up from 30,585 recorded in the previous quarter.
In the postal and courier sub-sector, the volume of letters sent out locally declined by 2.8 per
cent to record 16.8 million letters down from 17.3 million letters sent out during the previous
quarter.
Page 8
8
1. CELLULAR MOBILE SERVICES
1.1 Subscriptions
During the quarter under review Jan-Mar of the FY 2013/14, the number of mobile subscriptions
rose by 1.7 per cent to reach 31.8 million subscriptions up from 31.3 million subscriptions
registered during the previous quarter. This trend is similar to those observed over the last two
years where quarter-on-quarter growth has remained below 2 per cent. The same period of the
previous year had recorded a decline of 2.9 per cent.
The growth of mobile subscriptions is shown in Table 1.
Table 1: Mobile Subscriptions
Subscription
type
Mar-14 Dec-13 Quarterly
Variation (%)
Mar-13 Dec-12 Quarterly
Variation (%)
Prepaid
Subscriptions 31,222,434 30,748,514 1.5 29,459,207 30,429,351 -3.2
Post-Paid
Subscriptions 607,569 560,503 8.4 390,129 302,403 29.0
Total Mobile
Subscriptions 31,830,003 31,309,017 1.7 29,849,336 30,731,754 -2.9
Source: CA, Operators’ Returns,
In terms of subscription by type, the number of pre-paid subscriptions grew by 1.5 per cent to
post 31.2 million subscriptions up from 30.7 million recorded during the previous quarter.
However, in comparison with the same period in the previous year, a 3.2 per cent decline per
cent was realized.
Post-paid subscriptions have continued to register an upward trend with the quarter under review
recording 8.4 per cent growth to reach 607,569 subscriptions up from 560,503 posted during the
previous quarter. In relation to the same period of the previous year, growth of 29.0 per cent was
recorded. The ratio of post-paid to prepaid subscriptions stood at 1:51 during the quarter under
review compared to 1:55 in the previous quarter.
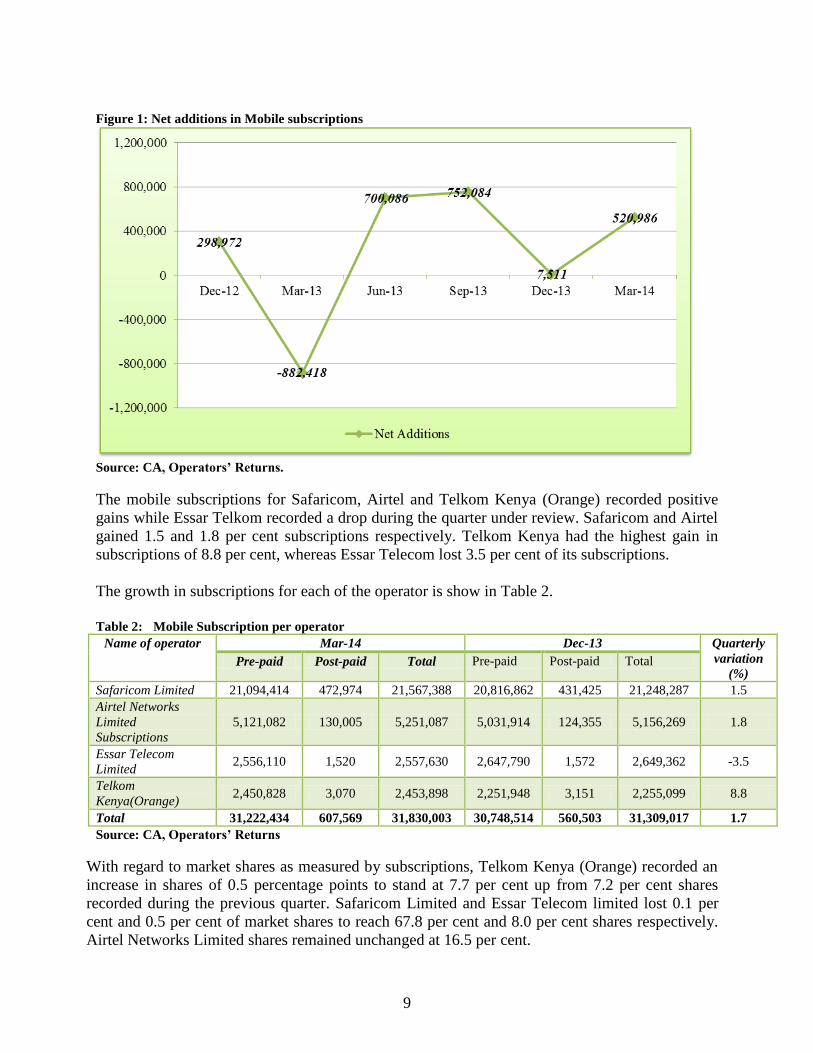
Similarly, the number of new subscriptions defined as net mobile additions1, increased by
520,986 compared to last quarter’s performance of 7,511. The quarter-on-quarter growth in total
additions is shown in Figure 1.
11
Net Mobile additions refer to new subscriptions registered during the period.
Page 9
9
Figure 1: Net additions in Mobile subscriptions
Source: CA, Operators’ Returns.
The mobile subscriptions for Safaricom, Airtel and Telkom Kenya (Orange) recorded positive
gains while Essar Telkom recorded a drop during the quarter under review. Safaricom and Airtel
gained 1.5 and 1.8 per cent subscriptions respectively. Telkom Kenya had the highest gain in
subscriptions of 8.8 per cent, whereas Essar Telecom lost 3.5 per cent of its subscriptions.
The growth in subscriptions for each of the operator is show in Table 2.
Table 2: Mobile Subscription per operator
Name of operator Mar-14 Dec-13 Quarterly
variation
(%) Pre-paid Post-paid Total Pre-paid Post-paid Total
Safaricom Limited 21,094,414 472,974 21,567,388 20,816,862 431,425 21,248,287 1.5
Airtel Networks
Limited
Subscriptions
5,121,082 130,005 5,251,087 5,031,914 124,355 5,156,269 1.8
Essar Telecom
Limited 2,556,110 1,520 2,557,630 2,647,790 1,572 2,649,362 -3.5
Telkom
Kenya(Orange) 2,450,828 3,070 2,453,898 2,251,948 3,151 2,255,099 8.8
Total 31,222,434 607,569 31,830,003 30,748,514 560,503 31,309,017 1.7
Source: CA, Operators’ Returns
With regard to market shares as measured by subscriptions, Telkom Kenya (Orange) recorded an
increase in shares of 0.5 percentage points to stand at 7.7 per cent up from 7.2 per cent shares
recorded during the previous quarter. Safaricom Limited and Essar Telecom limited lost 0.1 per
cent and 0.5 per cent of market shares to reach 67.8 per cent and 8.0 per cent shares respectively.
Airtel Networks Limited shares remained unchanged at 16.5 per cent.
Page 10
10
The growth in market sharers as measured by subscriptions for each of the operator is illustrated in
Figure 2.
Figure 2: Percentage Market Share Subscription per Operator
0.0
10.0
20.0
30.0
40.0
50.0
60.0
70.0
Dec-12 Mar-13 Jun-13 Sep-13 Dec-13 Mar-14
64.5 65.1 65.9 66.7 67.9 67.8
16.9 16.9 17.1 17.616.5 16.5
10.510.9 10.0 8.9 8.5 8.08.1 7.1 7.0 6.8 7.2 7.7
Safaricom Airtel Essar Orange
Source: CA, Operators’ Returns.
The mobile penetration2rate rose to 78.2 per cent during the quarter under review up from 76.9
per cent registered during the last quarter representing a 1.3 percentage points increase.
However, as illustrated in Figure 3, the same period of the previous year reported a decline of 2.4
percentage points.
2 Population used was 40.7 million
Page 11
11
Figure 3: Percentage Mobile Penetration
Source: CA, Operators’ Returns
1.2 Mobile Money Transfer Service
Mobile money transfer service has been experiencing an upward trend. During the quarter under
review the number of subscriptions grew by 0.9 per cent to register 26.2 million up from 26.0
million recorded during the last quarter. When compared to the same quarter of the previous
year, a 10.1 per cent increase was recorded.
In the same way, the number of agents rose by 10.6 per cent to reach 103,660 agents up from
93,689 agents during the previous quarter. In relation to the same period of the previous year, a
19.1 per cent growth was registered.
The growth in mobile money subscriptions and number of agents is indicated in Table 3.
Table 3: Mobile Money Transfer
Mobile Money
Transfer
Mar-14 Dec-13 Quarterly
Variation (%)
Mar-13 Dec-12 Quarterly
Variation (%)
Subscriptions 26,247,761 26,016,499 0.9 23,269,610 21,140,808 10.1
No. of Agents* 103,660 93,689 10.6 74,216 62,300 19.1
Source: CA, Operators Returns, * Data for Mobikash used for Oct-Dec 2013
1.3 Mobile Number Portability
Mobile Number Portability (MNP) has recorded mixed growth over the previous periods. During
the quarter under review, the number of in-ports increased to 362 up from 276 in-ports registered
Page 12
12
during the last quarter representing a 31.2 per cent growth during the period. Conversely, relative
to the same period of the previous year, a decline of 26.1 per cent was recorded.
The growth in number of in-ports is shown in Table 4.
Table 4: Number of In-ports
Source: CA, Operators Returns.
1.4 Mobile Traffic and Usage Pattern
1.4.1 Voice Traffic
In spite of the growth in mobile subscriptions during the quarter, there was a drop of 2.7 per cent
in local mobile traffic to post 7.6 billion minutes down from 7.8 billion minutes registered during
the previous quarter. This decline could be attributed to the reduced effect of the festive season
which ended early January. In relation to the same period of the previous year, a decline of 1.2
per cent was recorded.
On-net traffic declined by a similar margin of 2.6 per cent during the quarter to reach 6.6 billion
minutes down from 6.8 billion minutes posted during the last quarter. However, a marginal
growth of 0.6 per cent was noted when compared to the same period of the previous year.
Off-net traffic declined by 3.2 per cent during the quarter under review to stand at 971million
minutes down from 1.0 billion minutes recorded during the previous quarter. In comparison with
the same period of the previous year, an 11.1 per cent decline was recorded.
Mobile to fixed network traffic experienced a decline of 25.0 per cent to post 8.7 million minutes
down from 11.6 million minutes recorded in the previous quarter. In the same way, the same
period of the previous year showed a reduction of 31.1 per cent. This performance could be
attributed to the decline of fixed line services in the country.
The growth in mobile traffic is shown in Table 5.
Period
Jan-Mar 14 Oct-Dec13 Quarterly
Variation
(%)
Jan-Mar 13 Oct-Dec12 Quarterly
Variation (%)
Number of In-
ports
362 276 31.2 277 375 -26.1
Page 13
13
Table 5: Local Mobile Voice Traffic in Minutes
Mobile Traffic Jan-Mar 14 Oct-Dec -13 Quarterly
Variation
(%)
Jan-Mar 13 Oct-Dec 12 Quarterly
Variation
(%)
By traffic Originating(Outgoing traffic
Own Network –Own
Network 6,692,455,072 6,871,942,391 -2.6 6,329,133,013 6,294,040,711 0.6
Own Network to Other
Mobile Networks 971,237,869 1,003,147,611 -3.2 918,780,339 1,033,150,168 -11.1
Mobile Network to
Fixed Network 8,726,525 11,637,430 -25.0 13,949,032 20,247,929 -31.1
Total Traffic
Origination
(Outgoing) 7,672,419,466 7,886,727,432 -2.7 7,261,862,384 7,347,438,808 -1.2
By traffic termination(Incoming traffic)
Own Network –Own
Network 6,692,455,072 6,871,942,391 -2.6 6,329,133,013 6,294,040,711 0.6
Other Mobile Networks
to Own Network 1,027,901,534 1,064,722,858 -3.5 993,163,433 1,000,397,283 -0.7
Fixed Network to
Mobile Network 25,144,925 25,206,911 -0.2 23,082,769 24,879,357 -7.2
Total traffic
termination(Incoming) 7,745,501,531 7,961,872,160 -2.7 7,345,379,215 7,319,317,351 0.4
Source: CA, Operators’ Returns
Traffic received on mobile networks dropped by 2.7 per cent to register 7.7 billion minutes down
from 7.9 billion minutes posted during the previous quarter. In comparison with the same period
of the previous year, a marginal growth of 0.4 per cent was realised. Fixed to mobile traffic
declined by 0.2 per cent to 25.1 million minutes during the quarter under review down from 25.2
million in the previous period. Compared to a similar period during the previous year this was a
7.2 per cent decline.
As Figure 4 illustrates, on-net traffic has continued to record marginal growth of 0.1 per cent.
This has also been the trend in the last two quarters as well. On the other hand, off-net traffic
continued to decline by a similar margin of 0.1 percentage points over the same period. During
the quarter under review, on-net traffic accounted for 87.2 per cent of the total traffic while off-
net traffic contributed 12.8 per cent of the total traffic.
Page 14
14
Figure 4: Proportion of voice traffic On-net Off-net
Source: CA, Operators’ Returns
1.4.2 Voice Traffic by Operator
The quarter under review witnessed two operators increase their market shares of voice traffic
while two operators dropped their shares. Safaricom Ltd maintained the lead with 6.0 billion
minutes down from 6.1 billion minutes registered during the previous quarter. Despite this drop,
its market share increased by 0.3 percentage points to reach 78.5 per cent down from 78.2 per
cent shares during the last quarter. The same period of the previous year revealed an increase of
2.0 percentage points’ shares.
Telkom (Orange) traffic volume reached 234 million minutes down from 208 million minutes
registered during the previous quarter, representing a market share of 3.1 per cent. This is a gain
of 0.5 percentage points during the quarter. In comparison with the same period of the previous
year, a decline of 0.1 per cent was recorded.
Airtel Networks Limited lost 0.4 percentage shares to reach 10.9 per cent equivalent to 835
million minutes during the quarter down from 892 million minutes posted during the last quarter.
In relation to the same period of the previous year, a decrease of 1.0 percentage points was
recorded.
Similarly, Essar Telecom Limited recorded a 0.3 percentage drop to post 7.6 per cent shares
corresponding to 583 million minutes during the quarter. When compared to the same period of
the previous year, a drop of 1.0 percentage points was realised.
The traffic volumes and corresponding market shares for each of the operators is shown in Table
6.
Page 15
15
Table 6: Voice Traffic by Operator
Period Name of
Operator/Indicator
Safaricom
Limited
Airtel
Networks
Kenya Limited
Essar Telecom
Kenya Limited
Telkom Kenya
Limited
(Orange)
Jan-Mar 14
On-net 5,722,273,200 385,601,539 427,371,118 157,209,215
Off-net 297,507,187 449,421,833 155,847,316 77,188,058
Total 6,019,780,387 835,023,372 583,218,434 234,397,273
Market share (%) 78.5 10.9 7.6 3.1
Oct-Dec13
On-net 5,845,925,529 428,267,461 460,810,769 136,938,632
Off-net 319,831,419 464,187,261 158,772,790 71,993,571
Total 6,165,756,948 892,454,722 619,583,559 208,932,203
Market Share (%) 78.2 11.3 7.9 2.6
Jan-Mar13
On-net 5,461,219,864 391,376,604 419,213,311 57,323,234
Off-net 311,354,447 446,931,170 135,674,958 38,768,796
Total 5,772,574,311 838,307,774 554,888,269 96,092,030
Market Share (%) 79.5 11.5 7.6 1.3
Oct-Dec12
On-net 5,376,302,861 391,376,604 474,309,791 52,051,455
Off-net 320,199,542 527,185,652 157,656,337 48,356,566
Total 5,696,502,403 918,562,256 631,966,128 100,408,021
Market Share (%) 77.5 12.5 8.6 1.4
Source: CA, Operators’ Returns
1.4.3 Minutes of Use
As illustrated in Figure 5, the monthly minutes of use by each subscriber dropped to 80.3 from
84.1 minutes recorded during the previous quarter representing a decline of 4.5 per cent during
the quarter. In comparison with the same period of the previous year, an increase of 1.8 per cent
was recorded.
Page 16
16
Figure 5: Minutes of Use
Source: CA, Operators’ Returns
In the quarter under review, the volume of SMS declined by 1.0 per cent to reach 6.22 billion
SMS down from 6.28 billion messages recorded during the previous quarter. Subsequently, each
subscriber sent out an average of 65 SMS per month. The previous quarters had recorded an
upward trend in SMS volumes despite the popularity in the use of Over-The-Top (OTT)
messaging services such as WhatsApp and therefore it might be too early to predict if the decline
was contributed by OTT.
Safaricom Limited recorded the largest share of 96.4 per cent resulting from an increase of 0.6
percentage points during the quarter. Airtel Networks Limited shares declined by 0.5 per cent to
2.7 per cent shares from 3.2 per cent recorded during the previous quarter. Similarly, Essar lost
0.2 percentage points to reach 0.4 per cent shares from 0.6 per cent shares during the previous
quarter. Telkom Kenya (Orange) shares remained unchanged at 0.4 per cent.
Table 7 indicates the performance of market shares by the operators as measured by SMS.
Page 17
17
Table 7: Short Messaging Service per Operator
Period Name of
Operator/Indicat
or
Safaricom
Limited
Airtel
Networks
Kenya
Limited
Essar Telecom
Kenya Limited
Telkom Kenya
Limited
(Orange)
Total SMS
Jan-Mar 14
On-net 5,897,688,335 98,083,657 6,936,589 6,846,847 6,009,555,428
Off-net 101,457,620 70,451,935 20,664,939 18,106,504 210,680,998
Total 5,999,145,955 168,535,592 27,601,528 24,953,351 6,220,236,426
Market Share
(%) 96.4 2.7 0.4 0.4
Oct-Dec13
On-net 5,929,051,461 120,434,392 8,618,571 6,540,240 6,064,644,664
Off-net 87,493,526 82,912,497 26,327,996 20,061,869 216,795,888
Total 6,016,544,987 203,346,889 34,946,567 26,602,109 6,281,440,552
Market Share (%) 95.8 3.2 0.6 0.4
Jan-Mar 13
On-net 3,751,690,036 98,716,999 8,112,712 5,460,860 3,863,980,607
Off-net 120,419,687 61,461,820 24,737,136 12,944,903 219,563,546
Total 3,872,109,723 160,178,819 32,849,848 18,405,763 4,083,544,153
Market Share (%) 94.8 3.9 0.8 0.5
Oct-Dec12
On-net 3,362,382,350 92,940,200 14,181,871 5,476,700 3,474,981,121
Off-net 98,746,630 71,615,403 29,898,319 18,085,900 218,346,252
Total 3,461,128,980 164,555,603 44,080,190 17,528,578 3,687,293,351
Market Share (%) 93.7 4.5 1.2 0.6
Source: CA, Operators’ Returns.
Contrary to the positive performance that the Multimedia Messaging Service (MMS) had
recorded during the previous quarter, the quarter under review registered a decline of 17.8 per
cent to record 2.4 million messages down from 3.0 million messages recorded during the
previous quarter. In comparison with the same period of the previous year, a 2.5 per cent growth
was recorded.
In addition each subscriber sent out an average of less than one message per month.as shown in
Table 8.
Table 8: Multimedia Messaging Service
MMS Traffic Jan-Mar 14 Oct-Dec 13 Quarterly
Variation (%)
Jan-Mar 13 Oct-Dec 12 Quarterly
Variation (%)
MMS 2,497,654 3,039,392 -17.8 1,917,673 2,657,592 -27.8
MMS per Subscriber
per Month 0.03 0.03 0.0 0.02 0.03 -28.6
Source: CA, Operators’ Returns.
1.4.4 Roaming Traffic
During the quarter under review, the volume of roaming-out3 voice traffic declined to 8.5 million
minutes from 12.7 million minutes posted during the previous quarter, representing a decrease of
3 Roaming out is traffic originated and terminated by subscribers of national networks as users of foreign networks abroad.
Page 18
18
33.2 per cent during the period. This decline could be attributed to customers’ preference to buy
and use foreign SIM cards in order to avoid incurring high roaming charges. However, when
compared to the same period of the previous year, an increase of 7.9 per cent was recorded.
Conversely, roaming-in4 voice traffic increased by 35.5 per cent to reach 12.9 million minutes up
from 9.5 million minutes recorded during the previous quarter. In comparison with the same
period of the previous year, a decline of 11.3 per cent was observed.
Roaming out SMS declined by 36.4 per cent during the quarter to post 7.1 million messages
down from 11.2 million messages recorded during the previous quarter. When compared to the
same period of the previous year, this was a 20.4 per cent decline.
On the other hand, roaming in SMS experienced an increase of 35.1 per cent to reach 7.5 million
messages from 5.5 million messages recorded during the previous quarter. However, when
compared to the same period of the previous year, a decrease of 13.6 per cent was observed.
The growth in roaming traffic is indicated in Table 9.
Table 9: Roaming Traffic
Roaming Traffic Jan-Mar 14 Oct-Dec13 Quarterly
Variation (%)
Jan-Mar 13 Oct-Dec12 Quarterly
Variation (%)
Roaming Voice Minutes
Own Subscribers on
Foreign Networks
8,544,577 12,793,890 -33.2 12,578,193 11,662,645 7.9
Roaming Voice Minutes
Foreign Subscribers on
Local Network
12,902,333 9,519,137 35.5 10,985,934 12,391,655 -11.3
Roaming SMS - Own
Subscribers on Foreign
Networks
7,176,943 11,290,284 -36.4 8,135,934 10,227,055 -20.4
Roaming SMS - Foreign
Subscribers on Local
Network
7,517,145 5,563,021 35.1 12,865,136 14,892,715 -13.6
Source: CA, Operators’ Returns
1.1.1 International Mobile Traffic
International incoming voice traffic continued to drop with the quarter under review declining by
1.6 per cent to stand at 144 million minutes from 146 million posted during the previous quarter.
Availability of other alternative OTT voice and/or video services such Skype, Viber, Ovoo could
be the reason behind this decline. In relation to the same quarter of the previous year, a decline of
0.5 per cent was registered.
4Roaming in is traffic originated and terminated by foreign subscribers as users of local networks
Page 19
19
International outgoing voice traffic declined by 4.3 per cent to reach 113.8 million minutes down
from 118.9 million minutes during the last quarter. In addition, the same period of the previous
year showed a decline of 16.9 per cent.
There was an increase in international incoming SMS of 6.8 per cent to post 34.8 million SMS
from 32.6 million SMS recorded during the previous quarter. In comparison with the same
quarter of the previous year, growth of 39.9 per cent was recorded.
There was also decline in international outgoing SMS of 7.4 per cent to stand at 11.8 million
SMS down from 12.7 million posted during the previous quarter. However, in comparison with
the same period of the previous year, a considerable growth of 39.3 per cent was observed.
The decline in International outgoing voice and SMS traffic could be attributed to the increased
use of internet applications such as Whatsapp and Skype which allow reliable exchange of
multimedia messages and video calls respectively at a fair cost.
The international mobile voice traffic and SMS are shown in Table 10.
Table 10: International Mobile Traffic (Minutes)
International Mobile
Traffic and SMS
Jan-Mar 14 Oct-Dec 13 Quarterly
Variation (%)
Jan-Mar 13 Oct-Dec 12 Quarterly
Variation (%)
International
Incoming Mobile
Voice Minutes
144,083,652 146,353,778 -1.6 203,956,727 204,955,902 -0.5
International
Outgoing Mobile
Minutes
113,879,049 118,949,784 -4.3 126,954,749 152,774,194 -16.9
International
Incoming Mobile
SMS
34,838,753 32,629,211 6.8 20,541,319 14,679,764 39.9
International
Outgoing Mobile
SMS
11,847,376 12,793,808 -7.4 12,624,007 9,063,577 39.3
Source: CA, Operators’ Returns.
1.2 Mobile Revenue and Investments
Table 11 below shows mobile market revenues and investments as at June 2013. This
information will be updated upon receipt of operators latest audited financial accounts at the end
of their respective financial years.
Page 20
20
Table 11: Mobile Revenue and Investment (KES)5
Mobile
Revenues
and
Investments*
2012** 2011 2010 2009 2008 Variation
(%) Over
2011
Variation
(%) Over
2010
Variation
(%) Over
2009
Variation
(%) Over
2008
Mobile
Revenue
(KES
Millions)
133,508 116,640 104,552* 90,394 72,625 11,346 11.6 29.0 60.6
Mobile
Investments
(KES
Millions)
33,827 34,590 27,126* 40,260 29,436 9,679 27.5 -14.1 17.5
Source: CA, Operators’ Returns.
2. FIXED TELEPHONE SERVICE
2.1 Subscriptions
During the quarter under review, the fixed line network continued to decline as witnessed over
the previous periods. The number of fixed lines declined by 1,502 to stand at 204,354 lines from
205,856 registered during the last quarter. This decline was lower compared to that of 30,280
experienced in the same period of the preceding year.
The number of fixed terrestrial lines stood at 56,103 representing a 1.6 per cent decline from last
quarter and 8.9 per cent decline when compared to the same period of the previous year. Further,
fixed wireless subscriptions declined by 0.4 per cent to post 148,251 down from 148,823
subscriptions. Compared to the same quarter of the previous year a decline of 13.1 per cent was
recorded.
Table 12 demonstrates the trend in fixed network subscriptions
Table 12: Fixed Network Subscriptions
Fixed Network
Subscription Mar-14 Dec-13
Quarterly
Variation (%) Mar-13 Dec-12
Quarterly
Variation (%)
Fixed
Terrestrial
Subscriptions
56,103 57,033 -1.6 59,851 65,710 -8.9
Fixed Wireless
Subscriptions 148,251 148,823 -0.4 161,436 185,857 -13.1
Total Main
Fixed Network
Subscriptions
204,354 205,856 -0.7 221,287 251,567 -12.0
Source: CA, Operators Returns.
5 The information on mobile revenue and investment will be updated every end of financial year to reflect the current status of the
market.
Page 21
21
2.2 Fixed Network Traffic
Despite the decreased number of fixed lines during the quarter, local fixed network traffic grew
by 1.8 per cent to record 30.6 million minutes up from 30.1 million minutes during the previous
quarter.
In reference to Table 13, fixed wireless recorded 6.0 million minutes which was a decrease of 2.5
per cent from last quarter’s 6.1 million. In contrast, fixed to fixed traffic recorded growth of 1.8
per cent to stand at 495,290 minutes up from 486,637 minutes.
Fixed network to other voice networks seems to have been the key contributor to local fixed
network traffic growth posting 24.1 million minutes up from 23.4 million recorded during the
previous quarter representing 3.0 per cent increase.
Table 13 illustrates the trend in fixed network traffic
Table 13: Local Fixed Network Traffic in Minutes
Local Fixed Network
traffic Jan-Mar 14 Oct-Dec 13
Quarterly
Variation (%) Jan-Mar 13 Oct-Dec 12
Quarterly
Variation (%)
Intra-network traffic
Fixed-fixed 495,290 486,637 1.8 606,833 2,219,016 -72.7
Fixed Wireless-fixed
wireless 6,004,504 6,158,803 -2.5 4,138,513 25,864,509 -84.0
Inter-network traffic
Fixed to other
Networks(Network
voice providers)
24,170,238 23,468,289 3.0 23,083,110 25,238,552 -8.5
Total Local Fixed
network traffic 30,670,032 30,113,729 1.8 27,828,456 53,322,077 -47.8
Source: CA, Operators’ Returns,
International incoming fixed traffic has exhibited mixed trends over time with the period under
review recording a significant growth of 80 per cent to post 3.2 million minutes in contrast to the
previous quarter which marked a 54.6 per cent decline to stand at 1.7 million minutes. The same
quarter of the previous year had recorded a decline of 15.4 per cent.
International outgoing fixed traffic grew by 4.3 per cent to reach 3.9 million up from the 3.7
million minutes recorded in the last quarter. This was a significant growth when compared to
19.7 per cent decline which was recorded in the same period of the preceding year. Moreover,
international outgoing fixed VoIP traffic increased by 21.3 per cent to post 2.1 million minutes
compared to last quarter’s 1.8 million minutes. This growth is more remarkable compared to 2.0
percentage growth posted during the same period of the previous year.
The growth in international fixed line traffic is shown in Table 14.
Page 22
22
Table 14: Fixed Network International Voice Traffic
Fixed Network
Subscription Jan-Mar 14 Oct-Dec 13
Quarterly
Variation
(%)
Jan-Mar 13 Oct-Dec 12
Quarterly
Variation
(%)
International
Incoming Fixed
Network Voice
traffic
3,222,199 1,790,587 80.0 3,126,825 3,697,579 -15.4
International
Outgoing Fixed
Network Voice
traffic
3,923,754 3,761,709 4.3 3,314,630 4,129,962 -19.7
International
Outgoing Fixed
Network VoIP
traffic
2,193,476 1,808,646 21.3 2,084,075 2,042,300 2.0
Source: CA, Operators Returns.
3. DATA AND INTERNET SERVICE
3.1 Internet/Data Service
The quarter under review witnessed growth in data/internet subscriptions by 1.3 per cent to reach
13.3 million subscriptions from 13.1 million subscriptions for the previous quarter. The
continued growth in data/internet market is largely driven by growth in mobile based internet
penetration as a result of increased operators focus on growing revenue from the data market. In
addition, consistent promotions and special offers have attracted subscribers of mobile services
to acquire data bundle offers and other incentives to drive the use of data/internet services. In
relation to the same period of the previous year, an increase of 1.9 per cent was recorded.
As has been the trend, mobile data/internet sector maintained its largest share of 99 per cent of
total internet subscriptions which indicates that the continued expansion of 3G services as well as
popularity in the use of social networking sites may be playing a major role in the growth of
mobile data/internet service. During the quarter under review, the number of mobile data/internet
subscriptions rose to 13.2 million up from 13.0 million posted during the previous quarter
representing growth of 1.3 per cent. In comparison with the same period of the previous year,
growth of 1.9 per cent was noted.
On the other hand, the mixed growth in satellite subscriptions continued to be exhibited during
the quarter to reach 700 subscriptions up from 682 subscriptions during the previous quarter.
Compared to the same period of the previous year, an increase of 6.3 per cent was recorded.
The growth in data/internet subscriptions is indicated in Table 15.
Page 23
23
Table 15: Internet Subscriptions and Internet Users
Internet/Data Subscriptions Mar 14 Dec 13 Quarterly
Variation (%)
Mar-13 Dec 12 Quarterly
Variation (%)
Total Internet Subscriptions 13,356,415 13,186,968 1.3 9,680,011 9,496,573 1.9
Mobile Data/Internet
Subscriptions 13,257,309 13,090,348 1.3 9,589,851 9,406,843 1.9
Terrestrial Wireless Data/Internet
Subscriptions 16,540 16,429 0.7 24,011 23,814 0.8
Satellite Data/Internet
Subscriptions 700 682 2.6 727 684 6.3
Fixed DSL Data/Internet
Subscriptions 12,547 12,014 4.4 10,390 10,807 -3.9
Fixed Fibre Optic Data/Internet
Subscriptions 69,377 67,470 2.8 55,007 54,400 1.1
Fixed Cable Modem Subscriptions 25 25 0.0 25 25 0.0
Total Internet Users6 21,679,309 21,273,738 1.9 16,444,861 16,236,583 1.3
Source: CA, Operators’ Returns
Fibre subscriptions have been steadily growing with the quarter under review recording a rise of
2.8 per cent to reach 69,377 subscriptions from 67,470 registered during the last quarter.
The number of estimated internet users grew by 1.9 per cent representing 21.6million users up
from 21.2million recorded in the previous quarter. When compared to the same period of the
previous year, a 1.3 per cent increase was realised.
At the same time, the quarter under review had 53.3 per cent of the population that had access to
internet services. This is an increase of 1.0 percentage points from the previous quarter and 0.5
percentage points increase when related to the same period of the previous year.
The growth in internet access is illustrated in Figure 6.
6Internet users is estimated by multiplying by 1 the number of mobile data/Internet subscriptions, by 10 terrestrial wireless
subscriptions and by 100 fixed DSL, fibre optic and satellite subscriptions. There is no scientific method of estimating Internet
users; for the purpose of this report the methodology adopted is borrowed from the Internet Market Study 2006. The multiplier of
2 for mobile data/Internet users has been adjusted to1 as per the ITU recommendations.
Page 24
24
Figure 6: Estimated Number of Internet Users and Internet Penetration
Source: CA, Operators’ Returns.
The market share for each of the mobile operators as measured by data/internet subscriptions
changed during the quarter under review. Safaricom Limited lost 1.5 percentage shares to record
72.1 per cent shares down from 73.6 per cent registered during the previous quarter. In the same
way, Airtel Networks lost 1.2 percentage points to record 13.7 per cent from 14.9 per cent shares
during the last quarter. There was however gain in shares by Telkom Kenya (Orange) of 3.4
percentage to record 10.3 per cent up from 6.9 per cent shares during the last quarter. Essar
Telecom shares declined by 0.5 per cent to stand at 3.9 per cent from 4.6 per cent shares
recorded in the previous quarter.
The market shares for mobile data/Internet market by operator are shown in Table 16.
Table 16: Mobile data/internet subscription by operator
Source: CA, Operators’ Returns
In terms of market shares for other fixed/terrestrial wireless data/Internet subscriptions,
Wananchi Telecom maintained its largest share at 44.7 per cent up from 43.0 per cent from the
last quarter representing an increase of 1.7 percentage points during the quarter. It was followed
by Liquid Telecom (formerly Kenya Data Networks Limited) with 17.8 per cent shares from
16.8 per cent during the previous quarter increasing by 1.0 percentage shares during the quarter.
Access Kenya Limited lost 1.1 percentage points to record 11.5 per cent shares from 12.6 per
cent shares posted during the previous quarter.
Name of Operator Mar 14 % Market
share
Dec 13 % Market
Share
Safaricom Limited 9,561,810 72.1 9,637,828 73.6
Airtel Networks Kenya Limited 1,821,938 13.7 1,945,152 14.9
Telkom Kenya Limited (Orange) 1,361,249 10.3 904,739 6.9
Essar Telecom Kenya Limited 512,312 3.9 602,629 4.6
Page 25
25
The market shares for the top10 operators are shown in Table 17.
Table 17: Other Fixed/Wireless Internet Subscriptions by Operator
Name of Operator Mar 14 Market
Share (%)
Dec 13 Market Share
(%)
Wananchi Telecom Limited 44,254 44.7 44,254 43.0
Liquid Telecom Limited 17,600 17.8 16,400 16.8
Access Kenya Limited* 11,360 11.5 11,360 12.6
Telkom Kenya Limited 11,524 11.6 11,279 11.7
Safaricom Limited 7,020 7.1 6,999 7.8
Iway Africa 1,923 1.9 2,121 3.0
Jamii Telecommunication Limited 2,574 2.6 2,324 2.1
Mobile Telephony Networks Limited 1,372 1.4 1,363 1.3
Call Key Networks Limited 547 0.6 534 0.6
Tangerine Limited 280 0.3 261 0.3
Other fixed/Terrestrial wireless
operators 652 0.7 835 0.8
Source: CA, Operators’ Returns, * Data used for Oct-Dec 2013
3.2 Broadband Service
Over the last three quarters, the number of broadband subscriptions has been growing with the
quarter under review registering 0.9 per cent growth to reach 1.44 million subscriptions from
1.43 million subscriptions recorded during the previous quarter. In comparison with the same
period of the previous year, an increase of 1.9 per cent was registered.
The growth in broadband subscriptions is shown in Figure 7.
Figure 7: Broadband Subscriptions
Source: CA, Operators’ Returns.
Page 26
26
3.3 International Bandwidth
The quarter under review experienced marginal change in the growth of 0.4 per cent of available
international internet capacity in the country to reach 865,714Mbps from 862,473.9Mbps during
the previous quarter. Compared to the same period of the previous quarter an increase of 1.7 per
cent was registered.
Satellite capacity dropped by 15.3 per cent during the quarter to stand at 223.6Mbps down from
263.9Mbps posted in the last quarter. In relation to the same quarter of the previous year, a
substantial decline of 63.8 per cent was noted.
The trend on international Internet available bandwidth is shown in Table 18.
Table 18: International Internet Available Bandwidth (Mbps)
International Connectivity Bandwidth Mar 14 Dec 13 Quarterly
Variation
(%)
Mar 13 Dec-12 Quarterly
Variation
(%)
SEACOM-International Internet Capacity
(Mbps) 583,680 578,400 0.9 655,360 640,000 2.4
TEAMS - International Internet Capacity
(Mbps) 119,970 119,970 0.0 101,990 101,990 0.0
Telkom Kenya Limited (EASSY) 120,880 122,880 -1.6 122,880 122,880 0.0
Lion 2 40,960 40,960 0.0 40,960 40,960 0.0
VSAT (Mbps) 223.6 263.9 -15.3 128.8 355.8 -63.8
Total International Internet Bandwidth
(Mbps) 865,714 862,473.90 0.4 921,319 906,186 1.7
Source: CA, Operators’ Returns
The total used (connectivity) bandwidth grew by 22.3 per cent to reach 447,061 Mbps during the
quarter up from 365,413Mbps recorded in the preceding quarter. Thus, the total used bandwidth
represented 51.6 per cent from last quarter’s 42.4 per cent of the total available bandwidth
capacity. Accordingly, the used capacity increased by 9.2 percentage points which was mainly
contributed by satellite used bandwidth which grew by more than two-folds. This growth could
be attributed to the additional capacity acquired by one of the satellite providers to meet
increasing demand from new clients as well as satisfy existing clients who extended their
platforms.
The trend in international connectivity bandwidth is shown in Table 19.
Table 19: International Internet Connectivity Bandwidth (Mbps)
International Leased Bandwidth Mar 14 Dec 13 Quarterly
Variation
(%)
Mar 13 Dec 12 Quarterly
Variation
(%)
International Undersea Internet
Connectivity Bandwidth (Mbps) 446,865 365,330 22.3 307,210 328,483 -6.5
International Satellite Internet
Connectivity Bandwidth 195.63 83.43 134.5 97.28 157.8 -38.4
Total International Internet
Connectivity Bandwidth (Mbps) 447,061 365,413 22.3 307,307.3 328,640.8 -6.5
Source: CA, Operators’ Returns;
Page 27
27
3.4 Revenue and Investment in the Data/Internet Market
Table 20 below on Data/Internet Revenue and Investment will be updated once the financial data
for the year ending December 2013 is available.
Table 20: Data/Internet Revenue and Investment
Data/Internet
Revenue
and
Investments*
2012 2011 2010 2009 2008 Variation (%)
Over 2011
Variation (%)
Over 2010
Variation
(%) Over
2009
Variation
(%) Over
2008
Data/Internet
Revenue
(KES
Millions)
7,420 5,898 3,640 2,277 7,595 25.8 62.0 59.9 -70.0
Data/Internet
Investments
(KES
Millions)
3,914 3,424 2,760 53,870 1,171 14.3 24.1 -94.88 4500.34
Source: CA, Operators’ Returns. * Note that revenue in data market is not inclusive of data revenues from
mobile sector.
4. ELECTRONIC TRANSACTIONS
As illustrated in Figure 8, the number of domain names rose to 33,381 up from 30,585 domain
names posted during the previous quarter representing growth of 9.1 per cent during the quarter.
In relation to the same period of the previous year, an increase of 3.1 per cent was registered.
Figure 8: Domain Names registration
Source: CA, Kenya Network Information Centre (KeNIC)
Page 28
28
5. BROADCASTING
As illustrated in Table 21, listenership and viewership of both radio and Television has been on
an upward trend. In the period under review, TV broadcast grew significantly by 81.8 per cent to
stand at an average weekly viewership of 654,500. Similarly, Radio listenership increased by
19.9 per cent to record 4.4 million average weekly audiences.
The growth in Television viewership could be attributed to the increased number of premier
league games especially the English Premier League which were aired live during the period
under review. Moreover, the increase in radio listenership could have been driven by the
numerous Radio competition shows run during the quarter such as The Competition and Search
for Kenya’s Next Big Radio Host.
Table 21: Average Broadcast Audience
Broadcast Category Jan-Mar 14 Oct-Dec 13 Quarterly Variation (%)
TV Average Weekly
Viewership 654,500 360,000 81.8
Radio average Weekly
Audience 4,465,500 3,725,441 19.9
Source: CA, Operators’ Returns
As illustrated in Table 22, local content remains dominant for drama, news, discussions and
documentaries. However, foreign music and movies still hold the highest percentage in terms of
programming for both radio and television.
Table 22: Percentage program content (Both TV and Radio)
Source: CA, Operators’ Returns
Program Content Internally (Local)
Produced (%)
Third Party
Produced (%)
Foreign (%)
Music 15.1 19.2 65.7
Drama/Plays 70.1 13.1 16.8
Movies 7.4 23.6 69.0
News 83.9 8.4 7.7
Documentaries 56.7 15.4 27.9
Discussions 94.8 2.1 3.1
Page 29
29
6. POSTAL AND COURIER SERVICE
6.1 Postal and Courier Traffic
The postal and courier sub-sector experienced a downward trend during the period under review
unlike in the preceding quarter which recorded a significant growth. In the quarter, the number of
letters posted locally decreased by 2.8 per cent to stand at 16,846,228 letters down from
17,324,016 letters recorded during the last quarter. This decline could have been as a result of
conclusion of the festive season during which the postal and courier traffic grew significantly.
Likewise, the number of courier items sent during the quarter stood at 477,526 items down from
478,434 items sent in the last quarter representing a decline of 0.2 per cent. In comparison to the
same period of the preceding year, a 15.0 per cent growth was witnessed.
International incoming letters decreased by 2.4 per cent during the quarter under review to post
2.4 million letters down from 2.5 million. During the same period in the previous year, a
significant dip of 15.7 per cent was recorded.
International outgoing letters exhibited the highest decline of 16.9 per cent to post 812,923 letters
during the quarter.
The postal and courier traffic is shown in Table 23.
Table 23: Postal and Courier Traffic
Post and Courier Traffic Jan-Mar 14 Oct-Dec 13 Quarterly
Variation (%) Jan-Mar 13 Oct-Dec 12
Quarterly
Variation (%)
Number of Letters Posted
Locally 16,846,228 17,324,016 -2.8 16,235,185 17,386,730
-6.6
Total Courier Items Sent
Locally 477,526 478,434 -0.2 202,439 175,982
15.0
International Incoming
Letters 2,461,791 2,522,641 -2.4 2,734,701 3,243,523
-15.7
International Outgoing
Letters 812,923 978,525 -16.9 1,329,454 1,990,920
-33.2
Source: CA, Operators’ Returns.
6.2 Number of Postal Outlets
The number of postal outlets has remained at 622 similar to the same quarter of the previous
year. The number of Postal Outlets over the period is illustrated in Figure 9.
Page 30
30
Figure 9: Number of Postal Outlets
Source: CA, Operators’ Returns.
6.3 Postal and Courier Revenue and Investment
Table 24 on Postal and Courier Revenue and Investment will be updated once licensees submit
their audited financial accounts for the year ending December 2013.
Table 24: Postal and Courier Revenue and Investments
Post/Courier
Revenue and
Investment
2012* 2011 2010 2009 2008 Variation
(%) Over
2011
Variation
(%) Over
2010
Variation
(%) Over
2009
Variation
(%) Over
2008
Revenue
(KES
Millions)
4,950 6,094 5,815 4,255 13,907 -18.8 4.8 43.2 -56.2
Investments
(KES
Millions)
51 222 335 558 798 -77.0 -33.7 -60.2 -72.2
Source: CA, Operators’ Returns, * Incomplete data from the operators
7. CONCLUSION
The cellular phone industry in the country has continued to transform the lives of Kenyans, with
increased penetration of on mobile subscriptions, mobile data services on 3G platform as well as
mobile banking and payment. Mobile subscriptions grew marginally while voice traffic declined
during the quarter. The fixed telephony sector continued to experience a downward trend in the
face of mobile technology.
The Data/Internet market experienced growth of 1.3 per cent in the number of subscriptions
during the quarter with mobile data/internet contributing the greatest number of subscriptions as
has been the trend over the years. It is expected that the data/internet market will maintain an
upward trend in the coming periods considering the increasing integration of ICTs within various
sectors of the economy.
Page 31
31
The available International Internet Bandwidth grew marginally by 0.4 per cent in the quarter to
stand at 865,714 Mbps up from 862,473.9 Mbps recorded in the preceding quarter. Similarly, the
utilized capacity stood at 447,061 Mbps during the quarter marking a significant increase of 22.3
per cent in comparison to the last quarter and consistent with the increased uptake of
internet/data services. This represented 51.6 per cent of the total International Internet capacity.
Unlike the previous quarter during which the postal and courier sub-sector experienced a
remarkable growth attributed to the festive season, the period under review experienced a
downward trend for both local and international postal and courier traffic. The decrease was
significantly higher for International outgoing letters that also exhibited a decrease in the last
quarter.
Published: July 2014
Author: CA