29
QUARTERLY SOFTWARE SECTOR REVIEW | 1Q 2019

QUARTERLY SOFTWARE SECTOR REVIEW | 1Q 2019

T E C H N O L O G Y , M E D I A & T E L E C O M PAGE | 1
SOFTWARE SECTOR REVIEW | 1Q 2019
has merged with
DEAL SPOTLIGHT
M&A TRANSACTIONS – 1Q 2019
SOFTWARE M&A ACTIVITY
SOFTWARE SECTOR OVERVIEWS
SOFTWARE PRIVATE PLACEMENTS
SOFTWARE PUBLIC COMPARABLES
TECHNOLOGY IPOS
DEBT MARKETS
APPENDIX: PUBLIC COMPARABLES DETAIL
Managing [email protected]
Managing [email protected]
Managing [email protected]
Managing [email protected]
Managing [email protected]
Compliance Software
CRM and Member Management Software
Data and Analytics
Enterprise Software
Human Capital Management
Infrastructure and Security Software
IT and Tech Enabled Services
Managed Services, Hosting, Data Center Solutions
Online Marketing, Data, and Research
Architecture, Engineering, and Construction
eCommerce and Retail Software
Education Technology
Energy Technology
Facilities and Real Estate Technology
Financial Technology
Government Technology
Healthcare IT
Industrial and Supply Chain Software
Founded in 1991
330+ professionals across eight offices globally
21st record year in 2018
10 industry groups
HW Office
has been acquired by
&
has been acquired byhas acquiredhas been acquired byhas acquiredhas been acquired byhas acquired has been acquired byhas received a strategic
investment fromhas acquired has been acquired by
T E C H N O L O G Y , M E D I A & T E L E C O M PAGE | 2
SOFTWARE SECTOR REVIEW | 1Q 2019
has received a strategic investment from
Managing [email protected]
415-217-3411
617-654-2115
Managing [email protected]
617-654-2133
HW’s TMT Group advised PayIt on its strategic investment from Insight Partners.
PayIt is a leading provider of next generation, integrated digital government software and payment solutions, designed to improve government operations, revenue collection, and citizen engagement.
Through its highly configurable and extensible rules-based SaaS platform, PayIt improves the way citizens interact with government by simplifying the maze of government agencies to provide users with an intuitive, contextual experience.
The Company’s solution seamlessly integrates across existing technology infrastructure to connect disparate systems and data, making government smarter, modern, and more convenient for all constituents.
T E C H N O L O G Y , M E D I A & T E L E C O M PAGE | 3
SOFTWARE SECTOR REVIEW | 1Q 2019
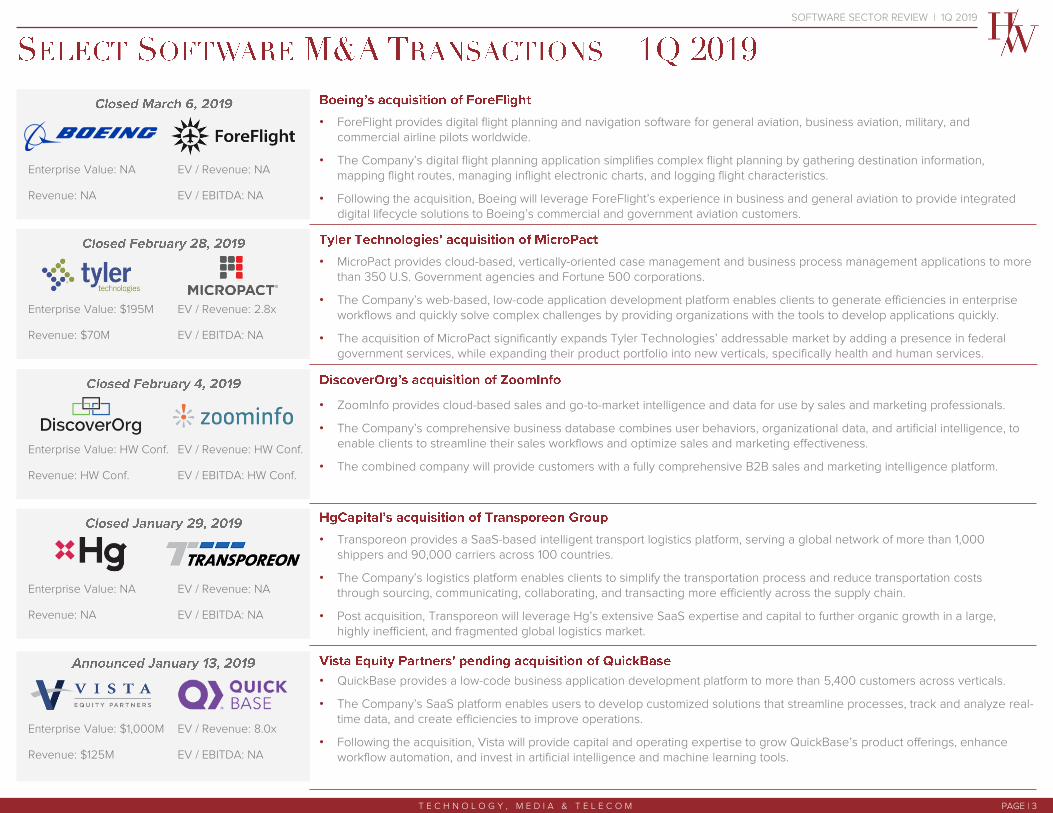
• MicroPact provides cloud-based, vertically-oriented case management and business process management applications to morethan 350 U.S. Government agencies and Fortune 500 corporations.
• The Company’s web-based, low-code application development platform enables clients to generate efficiencies in enterpriseworkflows and quickly solve complex challenges by providing organizations with the tools to develop applications quickly.
• The acquisition of MicroPact significantly expands Tyler Technologies’ addressable market by adding a presence in federalgovernment services, while expanding their product portfolio into new verticals, specifically health and human services.
Enterprise Value: $195M
Revenue: $70M EV / EBITDA: NA
EV / Revenue: 2.8x
• ForeFlight provides digital flight planning and navigation software for general aviation, business aviation, military, andcommercial airline pilots worldwide.
• The Company’s digital flight planning application simplifies complex flight planning by gathering destination information,mapping flight routes, managing inflight electronic charts, and logging flight characteristics.
• Following the acquisition, Boeing will leverage ForeFlight’s experience in business and general aviation to provide integrateddigital lifecycle solutions to Boeing’s commercial and government aviation customers.
Enterprise Value: NA
Revenue: NA EV / EBITDA: NA
EV / Revenue: NA
• Transporeon provides a SaaS-based intelligent transport logistics platform, serving a global network of more than 1,000shippers and 90,000 carriers across 100 countries.
• The Company’s logistics platform enables clients to simplify the transportation process and reduce transportation coststhrough sourcing, communicating, collaborating, and transacting more efficiently across the supply chain.
• Post acquisition, Transporeon will leverage Hg’s extensive SaaS expertise and capital to further organic growth in a large,highly inefficient, and fragmented global logistics market.
Enterprise Value: NA
Revenue: NA EV / EBITDA: NA
EV / Revenue: NA
• QuickBase provides a low-code business application development platform to more than 5,400 customers across verticals.
• The Company’s SaaS platform enables users to develop customized solutions that streamline processes, track and analyze real-time data, and create efficiencies to improve operations.
• Following the acquisition, Vista will provide capital and operating expertise to grow QuickBase’s product offerings, enhanceworkflow automation, and invest in artificial intelligence and machine learning tools.
Enterprise Value: $1,000M
Revenue: $125M
• ZoomInfo provides cloud-based sales and go-to-market intelligence and data for use by sales and marketing professionals.
• The Company’s comprehensive business database combines user behaviors, organizational data, and artificial intelligence, toenable clients to streamline their sales workflows and optimize sales and marketing effectiveness.
• The combined company will provide customers with a fully comprehensive B2B sales and marketing intelligence platform.
Enterprise Value: HW Conf.
Revenue: HW Conf. EV / EBITDA: HW Conf.
EV / Revenue: HW Conf.
EV / EBITDA: NA
EV / Revenue: 8.0x

T E C H N O L O G Y , M E D I A & T E L E C O M PAGE | 4
SOFTWARE SECTOR REVIEW | 1Q 2019
9
1 5 1 4
7 8 9
36
4 4
1 0
1 2
4
7 4 2
91
2 3
1 7
7
4
68
5 3
4 52
2
2
1
22
1 13
2019 YTD
2018
2017
2016
The 10 most active strategic softwareacquirers registered 14 acquisitions in 1Q2019. Activity among large strategicsoftware acquirers continues to be onpace with 2018 levels.
Dassault Systemes was among the mostactive strategic acquirers in 1Q 2019,completing three acquisitions. Thecompany continues to bolster itsmanufacturing and engineering softwaresolutions through its acquisitions ofIQMS, Argosim, and Elecworks.
Globally, strategic software M&A registered 490 acquisitions in 1Q 2019, a 9% increase from 4Q 2018.
Large strategic acquirers remain flush with cash and continue to pursue high growth software acquisitions to fuel innovation, fill technological gaps, and expand into new end-markets.
(# of Transactions)
(# of Transactions)
Note: Includes control investments only.
454 437 434 406341 358 351 348 328
381 402 395 3814 1 0
450490
2Q '15 3Q '15 4Q '15 1Q '16 2Q '16 3Q '16 4Q '16 1Q '17 2Q '17 3Q '17 4Q '17 1Q '18 2Q '18 3Q '18 4Q '18 1Q '19

T E C H N O L O G Y , M E D I A & T E L E C O M PAGE | 5
SOFTWARE SECTOR REVIEW | 1Q 2019
1 0
7 8
53 4 4 5 4 3
9
5
7
6
66
3 2
1 2
1 0
1 2 5
3 8 6
7
46 5
4
6
2
4
11
1
2019 YTD
2018
2017
2016
54 5647 50
617 3
827 3
9180 83
901 02 1 00 95
1 05
2Q '15 3Q '15 4Q '15 1Q '16 2Q '16 3Q '16 4Q '16 1Q '17 2Q '17 3Q '17 4Q '17 1Q '18 2Q '18 3Q '18 4Q '18 1Q '19
The 10 most active software investorscompleted 19 new platform investmentsin 1Q 2019. Portfolio company M&Aactivity remained high as well, asevidenced by 38 add-on acquisitions in1Q 2019 among this group.
Thoma Bravo was the most activesoftware private equity firm in 1Q 2019,completing six platform acquisitions andten add-on acquisitions. Notableplatform acquisitions in 1Q include EllieMae, Connectwise, Apttus, and Mailgun.
Globally, private equity buyersregistered 105 new software platforminvestments in 1Q 2019, the highestquarter ever.
Private equity investment across thesoftware sector continues to exhibitstrong momentum as dry powderremains at all-time highs and fundraisingactivity continues its strong momentum,especially for technology focused funds.
(# of Platform Transactions)
(# of Platform Transactions)
Note: Includes control new platform investments only. Excludes add-on acquisitions.
T E C H N O L O G Y , M E D I A & T E L E C O M PAGE | 6
SOFTWARE SECTOR REVIEW | 1Q 2019
3Q'14
4Q'14
1Q '1
5
2Q '1
5
3Q '1
5
4Q '1
5
1Q '1
6
2Q '1
6
3Q '1
6
4Q '1
6
1Q '1
7
2Q '1
7
3Q '1
7
4Q '1
7
1Q '1
8
2Q '1
8
3Q '1
8
4Q '1
8
1Q '1
9
3Q'14
4Q'14
1Q '1
5
2Q '1
5
3Q '1
5
4Q '1
5
1Q '1
6
2Q '1
6
3Q '1
6
4Q '1
6
1Q '1
7
2Q '1
7
3Q '1
7
4Q '1
7
1Q '1
8
2Q '1
8
3Q '1
8
4Q '1
8
1Q '1
9
1.4x
2.5x
2.3x
2.5x 2.4x2.5x
2.3x
2.7x
2.3x2.4x
2.7x
2.5x 2.4x
2.8x
3.0x
3.5x3.4x
272
319 320 316 314
281
298 307
291 288
337 346
366 373
380 394
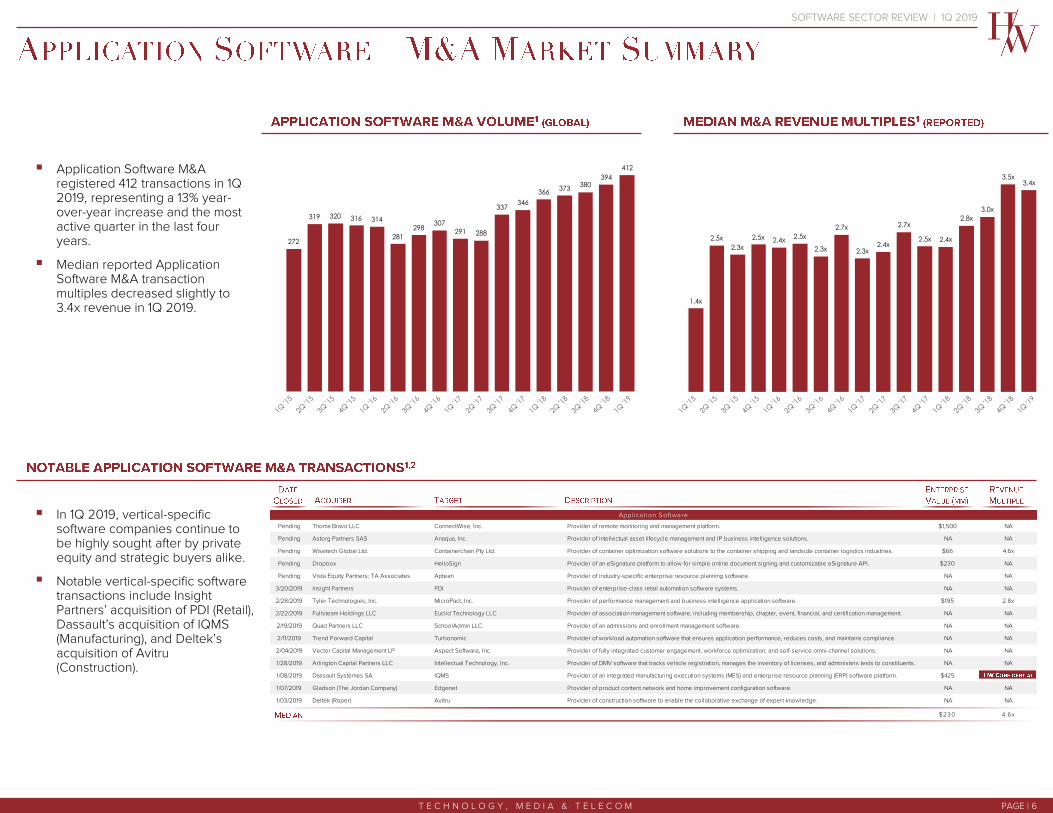
412 Application Software M&Aregistered 412 transactions in 1Q2019, representing a 13% year-over-year increase and the mostactive quarter in the last fouryears.
Median reported ApplicationSoftware M&A transactionmultiples decreased slightly to3.4x revenue in 1Q 2019.
In 1Q 2019, vertical-specificsoftware companies continue tobe highly sought after by privateequity and strategic buyers alike.
Notable vertical-specific softwaretransactions include Insight Partners’ acquisition of PDI (Retail), Dassault’s acquisition of IQMS (Manufacturing), and Deltek’sacquisition of Avitru(Construction).
Applicat ion Software
Pending Thoma Bravo LLC ConnectWise, Inc. Provider of remote monitoring and management platform. $1,500 NA
Pending Astorg Partners SAS Anaqua, Inc. Provider of intellectual asset lifecycle management and IP business intelligence solutions. NA NA
Pending Wisetech Global Ltd. Containerchain Pty Ltd. Provider of container optimization software solutions to the container shipping and landside container logistics industries. $66 4.6x
Pending Dropbox HelloSign Provider of an eSignature platform to allow for simple online document signing and customizable eSignature API. $230 NA
Pending Vista Equity Partners; TA Associates Aptean Provider of industry-specific enterprise resource planning software. NA NA
3/20/2019 Insight Partners PDI Provider of enterprise-class retail automation software systems. NA NA
2/28/2019 Tyler Technologies, Inc. MicroPact, Inc. Provider of performance management and business intelligence application software. $195 2.8x
2/22/2019 Fullsteam Holdings LLC Euclid Technology LLC Provider of association management software, including membership, chapter, event, financial, and certification management. NA NA
2/19/2019 Quad Partners LLC SchoolAdmin LLC Provider of an admissions and enrollment management software. NA NA
2/11/2019 Trend Forward Capital Turbonomic Provider of workload automation software that ensures application performance, reduces costs, and maintains compliance. NA NA
2/04/2019 Vector Capital Management LP Aspect Software, Inc. Provider of fully integrated customer engagement, workforce optimization, and self-service omni-channel solutions. NA NA
1/28/2019 Arlington Capital Partners LLC Intellectual Technology, Inc. Provider of DMV software that tracks vehicle registration, manages the inventory of licenses, and administers tests to constituents. NA NA
1/08/2019 Dassault Systèmes SA IQMS Provider of an integrated manufacturing execution systems (MES) and enterprise resource planning (ERP) software platform. $425 6.1x
1/07/2019 Gladson (The Jordan Company) Edgenet Provider of product content network and home improvement configuration software. NA NA
1/03/2019 Deltek (Roper) Avitru Provider of construction software to enable the collaborative exchange of expert knowledge. NA NA
$230 4.6x

T E C H N O L O G Y , M E D I A & T E L E C O M PAGE | 7
SOFTWARE SECTOR REVIEW | 1Q 2019
SaaS
Pending Advance Publications, Inc. Turnitin LLC Provider of cloud-based formative feedback and originality checking software for the education industry. $1,750 NA
Pending Vista Equity Partners Plansource Benefits Administration, Inc. Provider of a SaaS-based benefits administration platform to automate benefit transactions and connect with insurance carriers. NA NA
Pending Hellman & Friedman The Ultimate Software Group, Inc. Provider of cloud-based human capital management software. $10,352 9.1x
Pending Corcentric LLC Determine, Inc. Provider of SaaS source-to-pay and enterprise contract lifecycle management solutions. $48 2.0x
Pending TA Associates ARI Network Services Provider of a SaaS-based e-commerce and e-catalog platform. NA NA
Pending Thoma Bravo LLC Ellie Mae, Inc. Provider of on-demand software solutions and services for the residential mortgage industry. $3,151 6.6x
3/06/2019 The Boeing Co. ForeFlight LLC Provider of digital flight navigation software that enables pilots and flight crews to gather weather and destination information. NA NA
3/05/2019 Certify, Inc. (K1 Investment Management LLC) Chrome River Technologies, Inc. Provider of a cloud-based expense reporting and supplier invoice automation platform. NA NA
2/27/2019 Spectrum Equity Agilis Systems Provider of a fleet management software designed to reduce costs, improve safety, and boost productivity. NA NA
2/26/2019 ServiceMax, Inc. Zinc, Inc. Provider of a mobile communication platform created to facilitate real-time sharing of information. NA NA
2/25/2019 Urban Compass, Inc. Contactually, Inc. Provider of a web-based intelligent customer relationship management platform intended for service-oriented professionals. NA NA
2/19/2019 GTY Technology Holdings, Inc. CityBase, Inc. Provider of a SaaS platform designed to make government and utilities more personal and responsive. $135 NA
2/19/2019 GTY Technology Holdings, Inc. Bonfire Interactive Ltd. Provider of a cloud-based sourcing enablement platform designed to simplify and automate procurement decisions. $108 NA
2/14/2019 Avetta LLC Browz LLC Provider of SaaS-based supply chain risk management software. NA NA
2/05/2019 VERTU Capital; BDC Capital Firmex, Inc. Provider of a global virtual data room marketplace designed to share large volumes of confidential documents. NA NA
2/04/2019 Silver Lake Management Co. LLC ServiceMax, Inc. Provider of a field-service management platform that manages contracts and scheduling to increase productivity and efficiency. NA NA
1/29/2019 HgCapital LLP Transporeon GmbH Provider of a cloud-based logistics platform for intelligent transport logistics. NA NA
1/29/2019 Propertybase (Providence Strategic Growth) BoldLeads.com, Inc. Provider of real estate software intended to offer leads for real estate buyers and sellers. NA NA
1/02/2019 Vector Capital Management LP Host Analytics, Inc. Provider of enterprise performance management software for businesses in the life sciences and manufacturing industries. NA NA
$943 6.6x
3.9x
4.4x4.2x
4.6x
4.9x
5.6x5.4x
4.8x4.6x
4.7x4.8x
4.5x
4.8x
5.0x4.8x
5.0x4.9x65
68 70
55
52 51 52 54
48
43
55 57
55
52 53
56
59
SaaS M&A continued its upwardmomentum, registering 59 transactions in 1Q 2019.
Median reported SaaS transactionrevenue multiples decreased slightly to 4.9x in 1Q 2019, but remain in line with last year.
As cloud continues to become thedelivery model of choice, sectoractivity remains robust, withstrong interest from both privateequity investors and strategicbuyers.
In particular, supply chaintechnology companies areincreasingly being sought after asevidenced by Corcentric’spending acquisition of Determine,HgCapital’s acquisition ofTransporeon, GTY’s acquisitionsof Bonfire and CityBase, Avetta’sacquisition of Browz, andSpectrum Equity’s acquisition ofAgilis.
3Q'14
4Q'14
1Q '1
5
2Q '1
5
3Q '1
5
4Q '1
5
1Q '1
6
2Q '1
6
3Q '1
6
4Q '1
6
1Q '1
7
2Q '1
7
3Q '1
7
4Q '1
7
1Q '1
8
2Q '1
8
3Q '1
8
4Q '1
8
1Q '1
9
3Q'14
4Q'14
1Q '1
5
2Q '1
5
3Q '1
5
4Q '1
5
1Q '1
6
2Q '1
6
3Q '1
6
4Q '1
6
1Q '1
7
2Q '1
7
3Q '1
7
4Q '1
7
1Q '1
8
2Q '1
8
3Q '1
8
4Q '1
8
1Q '1
9
T E C H N O L O G Y , M E D I A & T E L E C O M PAGE | 8
SOFTWARE SECTOR REVIEW | 1Q 2019
Data and Analyt ics
Pending KKR OneStream Software Provider of corporate performance management solutions for mid-sized to large enterprises. $500 NA
Pending Atlassian Corp. Plc AgileCraft LLC Provider of an all-in-one agile management solution suite for scaled agile software services. $166 NA
3/19/2019 3i Group Magnitude Software, Inc. Provider of enterprise information management software. $179 2.9x
3/07/2019 TIBCO Software, Inc. SnappyData, Inc. Provider of a hybrid transactional analytics database designed to develop in-memory data grid products. NA NA
2/27/2019 Formstack (Providence Strategic Growth) Bedrock Data, Inc. Provider of a data management and integration platform. NA NA
2/26/2019 Walmart, Inc. Aspectiva Ltd. Provider of a content analysis platform designed to turn consumer opinions into comprehensive and valuable insights. NA NA
2/26/2019 DataRobot, Inc. Cursor Data, Inc. Provider of a data collaboration platform intended to simplify data search and analytics. NA NA
2/19/2019 Dynata Reimagine Holdings Group, Inc. Provider of data creation software solutions for business intelligence. NA NA
2/12/2019 mTAB LLC Slideworx GmbH Provider of customer market research software intended to provide customer insights. NA NA
2/08/2019 CC Capital; TH Lee; Cannae Holdings Dun & Bradstreet Corp. Provider of commercial data analytics solutions used for risk management, sales prospects research, and mailing list creation. $6,521 3.6x
2/05/2019 Activa Capital Explore SAS Provider of document management and database solutions. $46 3.3x
2/04/2019 DiscoverOrg ZoomInfo Provider of analytics software that combines user behaviors and business data to streamline the sales workflow. NA NA
2/04/2019 Microsoft Corp. DataSense Provider of a data integration platform for the education industry. NA NA
1/31/2019 Open Text Corp. Catalyst Repository Systems, Inc. Provider of fast and powerful document repositories intended for large-scale discovery and regulatory compliance. $75 NA
1/23/2019 SAP SE Qualtrics International, Inc. Provider of an enterprise data collection and analysis software intended to survey employees, markets, and customers. $7,992 21.5x
1/17/2019 Lightview Capital Educational Measures Provider of live event software focused on audience engagement and associated data and analytics. NA NA
1/16/2019 Insight Partners; Canada Pension Plan Veeam Software Provider of intelligent data management and workload software intended to automatically anticipate needs and meet demand. $500 NA
1/08/2019 Plaid, Inc. Quovo, Inc. Provider of a wealth management data analytics platform designed to offer connectivity to consumer financial accounts. $200 NA
1/07/2019 Lovell Minnick Partners ATTOM Data Solutions Provider of property data solutions, intended to increase real estate transparency. NA NA
1/07/2019 Alibaba Group Holding Ltd. Data Artisans GmbH Provider of an open source data stream processing platform. $103 NA
1/03/2019 Cloudera, Inc. Hortonworks, Inc. Provider of an enterprise-ready open and connected data platform designed for storing, managing, and analyzing data. $1,757 5.4x
$200 3.6x
89
105
112
102
82
87
97 100
105 106 107 110
122
115
110 112
121
2.8x
2.0x
2.6x2.6x
1.9x
3.1x
2.4x2.5x
2.8x
2.5x
3.1x3.0x
2.8x2.7x
2.6x
2.8x2.7x
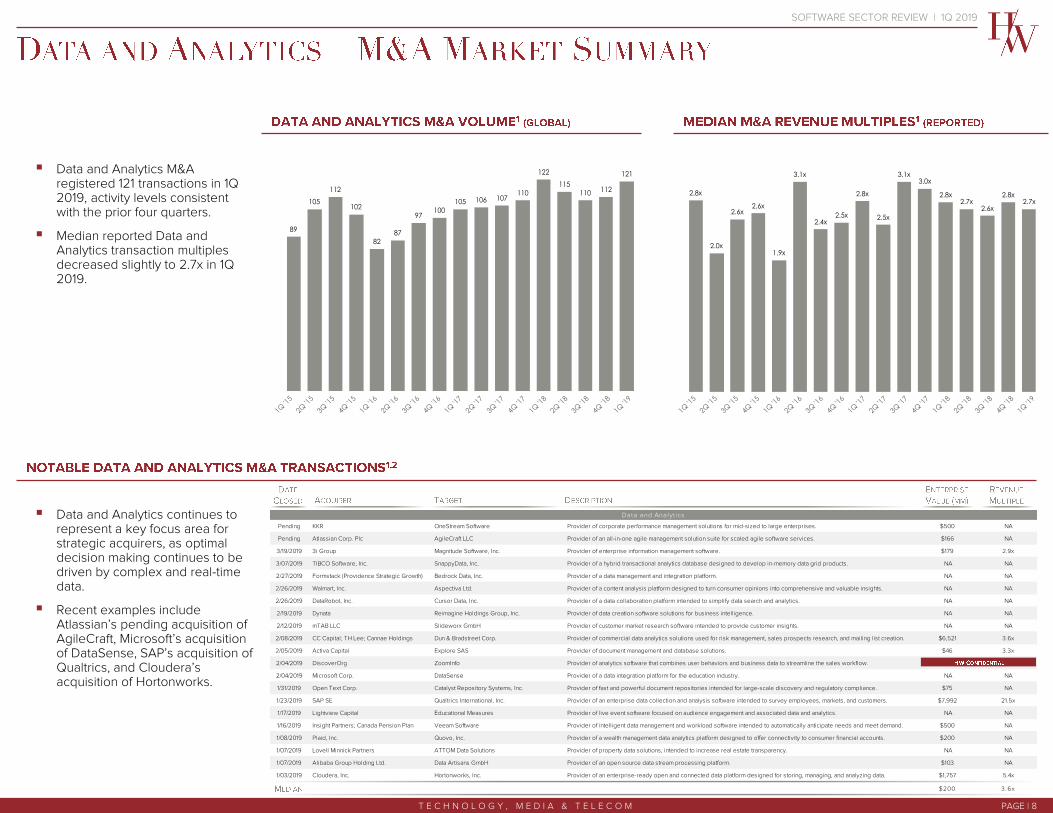
Data and Analytics M&Aregistered 121 transactions in 1Q2019, activity levels consistentwith the prior four quarters.
Median reported Data andAnalytics transaction multiples decreased slightly to 2.7x in 1Q 2019.
Data and Analytics continues torepresent a key focus area forstrategic acquirers, as optimaldecision making continues to bedriven by complex and real-timedata.
Recent examples includeAtlassian’s pending acquisition ofAgileCraft, Microsoft’s acquisitionof DataSense, SAP’s acquisition ofQualtrics, and Cloudera’sacquisition of Hortonworks.
3Q'14
4Q'14
1Q '1
5
2Q '1
5
3Q '1
5
4Q '1
5
1Q '1
6
2Q '1
6
3Q '1
6
4Q '1
6
1Q '1
7
2Q '1
7
3Q '1
7
4Q '1
7
1Q '1
8
2Q '1
8
3Q '1
8
4Q '1
8
1Q '1
9
3Q'14
4Q'14
1Q '1
5
2Q '1
5
3Q '1
5
4Q '1
5
1Q '1
6
2Q '1
6
3Q '1
6
4Q '1
6
1Q '1
7
2Q '1
7
3Q '1
7
4Q '1
7
1Q '1
8
2Q '1
8
3Q '1
8
4Q '1
8
1Q '1
9

T E C H N O L O G Y , M E D I A & T E L E C O M PAGE | 9
SOFTWARE SECTOR REVIEW | 1Q 2019
Infrast ructure Software
Pending Vista Equity Partners QuickBase, Inc. Provider of a low-code application development platform. $1,000 8.0x
Pending Carbonite, Inc. Webroot, Inc. Provider of internet threat detection and endpoint security solutions. $619 2.9x
Pending Palo Alto Networks, Inc. Demisto, Inc. Provider of an automated incident response and security orchestration platform designed to offer integrated threat intelligence. $560 NA
Pending F5 Networks, Inc. NGINX Software, Inc. Provider of an open sourced enterprise application platform designed to help in developing and delivering modern applications. $670 NA
Pending NTT Security WhiteHat Security, Inc. Provider of a risk management platform intended to offer website security services. NA NA
3/06/2019 Veritas Technologies APTARE, Inc. Provider of data protection and data center optimization solutions. NA NA
2/25/2019 Marlin Equity Partners Worksoft, Inc. Provider of automation software created for high-velocity business process discovery and testing. NA NA
2/21/2019 JFrog Ltd. Shippable, Inc. Provider of a continuous integration and DevOps automation platform. NA NA
2/21/2019 BlackBerry Ltd. Cylance, Inc. Provider of a cybersecurity platform designed to predict and prevent execution of advanced threats and malware. $1,500 13.8x
2/20/2019 Zix Corp. AppRiver LLC Provider of channel-first cybersecurity and productivity solutions. $275 3.8x
2/20/2019 Perforce Software (Clearlake Capital) Rogue Wave Software, Inc. Provider of cross-platform software developer tools and embedded components. NA NA
2/12/2019 Symantec Corp. Luminate Security Ltd. Provider of a cloud-based security platform designed for access to corporate applications in hybrid clouds. $200 NA
1/24/2019 Microsoft Corp. Citus Data, Inc. Provider of a database-as-a-service platform designed to make PostgreSQL databases faster and more scalable. NA NA
1/10/2019 Amazon.com, Inc. CloudEndure, Inc. Provider of cloud migration, disaster recovery, and continuous backup solutions. $250 NA
1/04/2019 CVC Capital ConvergeOne Holdings, Inc. Provider of collaboration, enterprise networking, data center, and security software solutions. $1,671 1.5x
1/01/2019 Thoma Bravo LLC Veracode, Inc. Provider of an application security platform designed to find and fix security-related defects in the software development lifecycle. $950 NA
$644 3 .8x
3.0x
3.2x3.3x
2.6x
2.9x
2.6x2.7x
3.1x
2.6x
2.4x
3.0x 3.0x
3.2x
2.8x2.9x
2.5x
2.8x
45
50
36
52
44
57 60
75
63 62
76
71
67 70
89
84 82
Infrastructure Software M&Aregistered 82 transactions in 1Q 2019, representing a slight decrease from the prior quarter.
In 1Q 2019, median reportedInfrastructure Software transactionmultiples increased slightly to 2.8xrevenue.
Private equity investors remainhighly active buyers ofinfrastructure and DevOps assetsas they look to compete withestablished strategic acquirers in alarge, but fragmented market.
Noteworthy private equitytransactions in 1Q 2019 includeVista Equity Partners’ pendingacquisition of QuickBase, CVC’sacquisition of ConvergeOne, andThoma Bravo’s acquisition ofVeracode.
3Q'14
4Q'14
1Q '1
5
2Q '1
5
3Q '1
5
4Q '1
5
1Q '1
6
2Q '1
6
3Q '1
6
4Q '1
6
1Q '1
7
2Q '1
7
3Q '1
7
4Q '1
7
1Q '1
8
2Q '1
8
3Q '1
8
4Q '1
8
1Q '1
9
3Q'14
4Q'14
1Q '1
5
2Q '1
5
3Q '1
5
4Q '1
5
1Q '1
6
2Q '1
6
3Q '1
6
4Q '1
6
1Q '1
7
2Q '1
7
3Q '1
7
4Q '1
7
1Q '1
8
2Q '1
8
3Q '1
8
4Q '1
8
1Q '1
9
T E C H N O L O G Y , M E D I A & T E L E C O M PAGE | 10
SOFTWARE SECTOR REVIEW | 1Q 2019
4% 4% 2% 4% 2% 2% 1 % 2% 2% 1 % 1 % 2% 1 % 1 % 2% 3% 1 %
22% 28%
1 6%22%
1 7 %1 1 % 8%
1 7 %1 2% 1 1 % 1 4%
1 7 % 1 9% 1 5%1 8%
21 %1 5%
33% 26%
1 7 %
32%
26%
25%21 %
32%
20%1 2%
29% 1 8% 21 %1 7 %
23%20%
26%
22%1 7 %
29%
1 4% 39%
28%
20%
20%
20%28%
1 7 %24% 1 9%
22%
1 9% 20% 1 9%
1 8%25%
36%28%
1 5%
34%
50%
29%
46% 48%39% 38% 41 % 45%
38% 36% 38%
1Q-15 2Q-15 3Q-15 4Q-15 1Q-16 2Q-16 3Q-16 4Q-16 1Q-17 2Q-17 3Q-17 4Q-17 1Q-18 2Q-18 3Q-18 4Q-18 1Q-19
Seed Series A Series B Series C Series D / or later
9971,033
960
757
869896
811774 790
743
849898 920
978 976945
981
$0
$4 ,000
$8,000
$12,000
$16,000
$20,000
$24,000
$28,000
0
100
200
300
400
500
600
700
800
900
1,000
1,100
1,200
1Q-15 2Q-15 3Q-15 4Q-15 1Q-16 2Q-16 3Q-16 4Q-16 1Q-17 2Q-17 3Q-17 4Q-17 1Q-18 2Q-18 3Q-18 4Q-18 1Q-19
$ i
n M
illio
ns
Vo
lum
e
Application Software SaaS Data & Analytics Infrastructure Software Total New Capital (Reported)
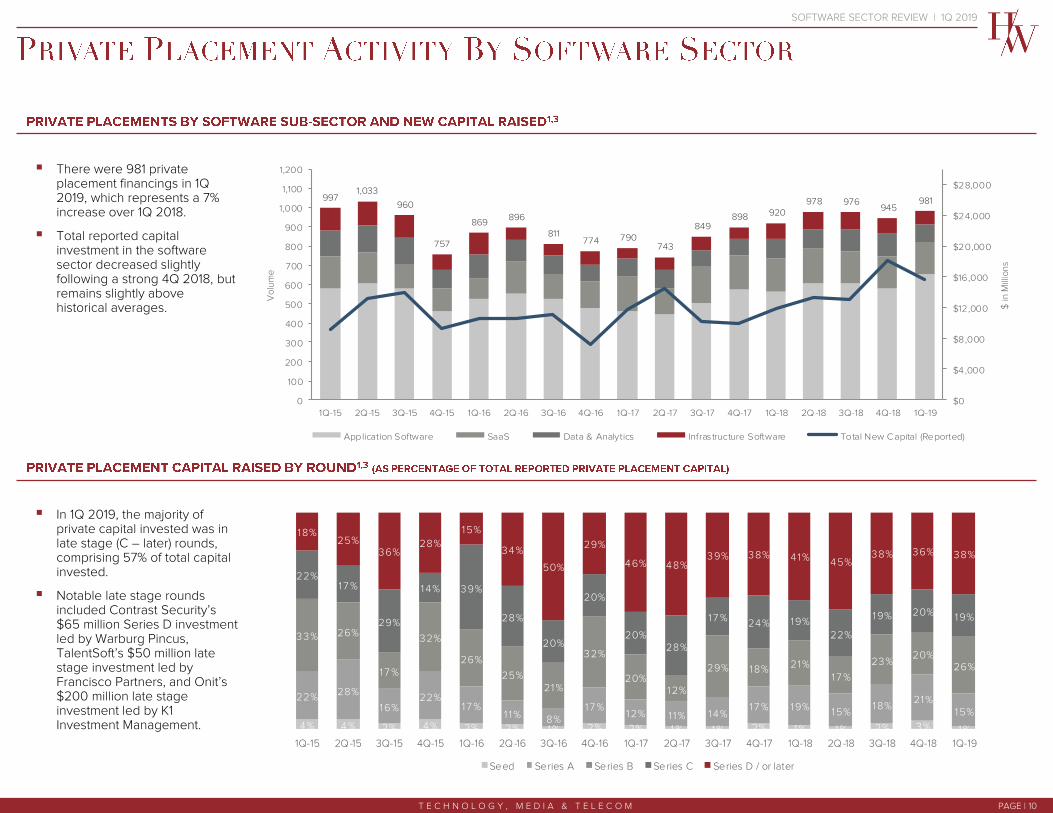
There were 981 private placement financings in 1Q 2019, which represents a 7% increase over 1Q 2018.
Total reported capital investment in the software sector decreased slightly following a strong 4Q 2018, but remains slightly above historical averages.
In 1Q 2019, the majority of private capital invested was in late stage (C – later) rounds, comprising 57% of total capital invested.
Notable late stage rounds included Contrast Security’s $65 million Series D investment led by Warburg Pincus, TalentSoft’s $50 million late stage investment led by Francisco Partners, and Onit’s$200 million late stage investment led by K1 Investment Management.
T E C H N O L O G Y , M E D I A & T E L E C O M PAGE | 11
SOFTWARE SECTOR REVIEW | 1Q 2019
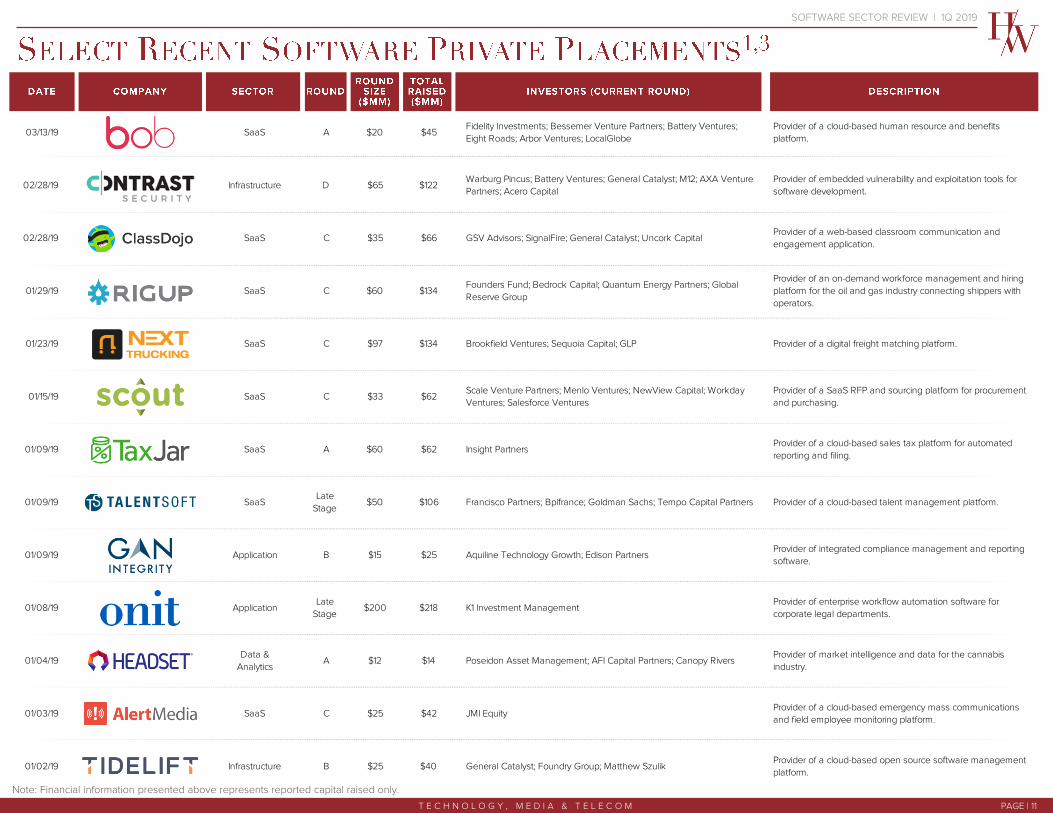
03/13/19 SaaS A $20 $45 Fidelity Investments; Bessemer Venture Partners; Battery Ventures;
Eight Roads; Arbor Ventures; LocalGlobe
Provider of a cloud-based human resource and benefits
platform.
02/28/19 Infrastructure D $65 $122 Warburg Pincus; Battery Ventures; General Catalyst; M12; AXA Venture
Partners; Acero Capital
Provider of embedded vulnerability and exploitation tools for
software development.
02/28/19 SaaS C $35 $66 GSV Advisors; SignalFire; General Catalyst; Uncork CapitalProvider of a web-based classroom communication and
engagement application.
01/29/19 SaaS C $60 $134 Founders Fund; Bedrock Capital; Quantum Energy Partners; Global
Reserve Group
Provider of an on-demand workforce management and hiring
platform for the oil and gas industry connecting shippers with
operators.
01/23/19 SaaS C $97 $134 Brookfield Ventures; Sequoia Capital; GLP Provider of a digital freight matching platform.
01/15/19 SaaS C $33 $62 Scale Venture Partners; Menlo Ventures; NewView Capital; Workday
Ventures; Salesforce Ventures
Provider of a SaaS RFP and sourcing platform for procurement
and purchasing.
01/09/19 SaaS A $60 $62 Insight PartnersProvider of a cloud-based sales tax platform for automated
reporting and filing.
01/09/19 SaaSLate
Stage$50 $106 Francisco Partners; Bpifrance; Goldman Sachs; Tempo Capital Partners Provider of a cloud-based talent management platform.
01/09/19 Application B $15 $25 Aquiline Technology Growth; Edison PartnersProvider of integrated compliance management and reporting
software.
01/08/19 ApplicationLate
Stage$200 $218 K1 Investment Management
Provider of enterprise workflow automation software for
corporate legal departments.
01/04/19Data &
Analytics A $12 $14 Poseidon Asset Management; AFI Capital Partners; Canopy Rivers
Provider of market intelligence and data for the cannabis
industry.
01/03/19 SaaS C $25 $42 JMI EquityProvider of a cloud-based emergency mass communications
and field employee monitoring platform.
01/02/19 Infrastructure B $25 $40 General Catalyst; Foundry Group; Matthew SzulikProvider of a cloud-based open source software management
platform.
Hibob
Contrast Security, Inc.
ClassDojo
RigUp, Inc.
Next Trucking, Inc.
ScoutRFP, Inc.
TaxJar
TalentSoft SA
GAN Integrity, Inc.
Onit Inc.
Headset, Inc.
Alert Media, Inc.
Tidelift, Inc.
Note: Financial information presented above represents reported capital raised only.

T E C H N O L O G Y , M E D I A & T E L E C O M PAGE | 12
SOFTWARE SECTOR REVIEW | 1Q 2019
8.8x
6.6x7.1x
2.1x
5.3x
7.9x
7.0x
5.8x6.6x
5.0x4.6x 4.6x
4.2x3.7x
2.9x 2.9x 3.2x
13.8x
9.5x9.1x 9.0x 8.8x
8.4x 8.2x
7.1x
5.8x5.4x 5.3x 5.2x
4.5x 4.3x 4.1x 4.1x
3.0x
1Q 2018 1Q 2019
55.5x
29.9x24.6x
60.7x
19.2x 19.7x
34.9x
19.5x 21.2x15.9x 15.9x 16.2x
44.6x
28.5x
20.4x22.0x 19.3x
68.8x65.9x
33.3x
41.9x
33.8x
22.9x
36.0x
24.2x 23.0x19.3x
16.9x 16.4x19.4x
29.1x
21.2x
16.7x18.5x
1Q 2018 1Q 2019
52.4%
52.4%
18.7%
35.5%
28.3%
18.1%
28.7%
22.1%
11.4%
22.4%
17.0%
13.7%
1.5%
4.5%
11.0%
17.1%
17.2%
217.4%
78.1%
137.2%
118.0%
104.3%
100.1%
74.2%
74.2%
106.5%
77.0%
52.8%
64.2%
60.9%
60.6%
109.3%
16.6%
37.5%
1 Yr - Index Change 3 Yr - Index Change
Large-Cap SaaS
HCM
PLM & Engineering
Marketing
IT Security
Financial
SCM & Logistics
Data & Analytics
EdTech / Public Sector
IT Operations Mgmt.
Bellwethers
Enterprise
Data Storage
Small-Cap SaaS
Energy
HCIT
Communication

T E C H N O L O G Y , M E D I A & T E L E C O M PAGE | 13
SOFTWARE SECTOR REVIEW | 1Q 2019
`
30% 121% 14% 62% 26% -
18% 67% 19% 77% - 32%
11% 32% 23% - - 18%
16% 65% 16% 77% 80% 89%
17% 40% 25% 24% - 43%
10% 20% 35% 10% 24% 26%
17% 32% 24% 85% - 79%
17% 87% 13% 67% - 81%
19% 26% 23% 85% 90% 50%
10% 33% 30% 96% 38% -
8% 18% 30% 78% 79% 29%
8% 12% 30% 76% 89% 26%
18% 91% 20% 28% 19% 11%
17% 68% 16% 37% - -
5% 24% 18% 94% 72% 100%
10% 46% 18% 28% 34% 56%
12% 45% 22% 97% 100% 100%
13.8x
9.5x
9.1x
9.0x
8.8x
8.4x
8.2x
7.1x
5.8x
5.4x
5.3x
5.2x
4.5x
4.3x
4.1x
4.1x
3.0x
Large-Cap SaaS
HCM
PLM & Engineering
Marketing
IT Security
Financial
SCM & Logistics
Data & Analytics
EdTech / Public Sector
IT Operations Mgmt.
Bellwethers
Enterprise
Data Storage
Small-Cap SaaS
Energy
HCIT
Communication
T E C H N O L O G Y , M E D I A & T E L E C O M PAGE | 14
SOFTWARE SECTOR REVIEW | 1Q 2019
30%
56%
15%
< 25% 25 - 75% > 75%
21%
18% 61%
$0-50M $50-500M $500M-$1B $1B+
38%
63%
$50 - 100M $100 - 250M $250M +
5
15
3
8
0
2
9
4
5
6
1
8
3
9
3 3
1
1Q-15 2Q-15 3Q-15 4Q-15 1Q-16 2Q-16 3Q-16 4Q-16 1Q-17 2Q-17 3Q-17 4Q-17 1Q-18 2Q-18 3Q-18 4Q-18 1Q-19
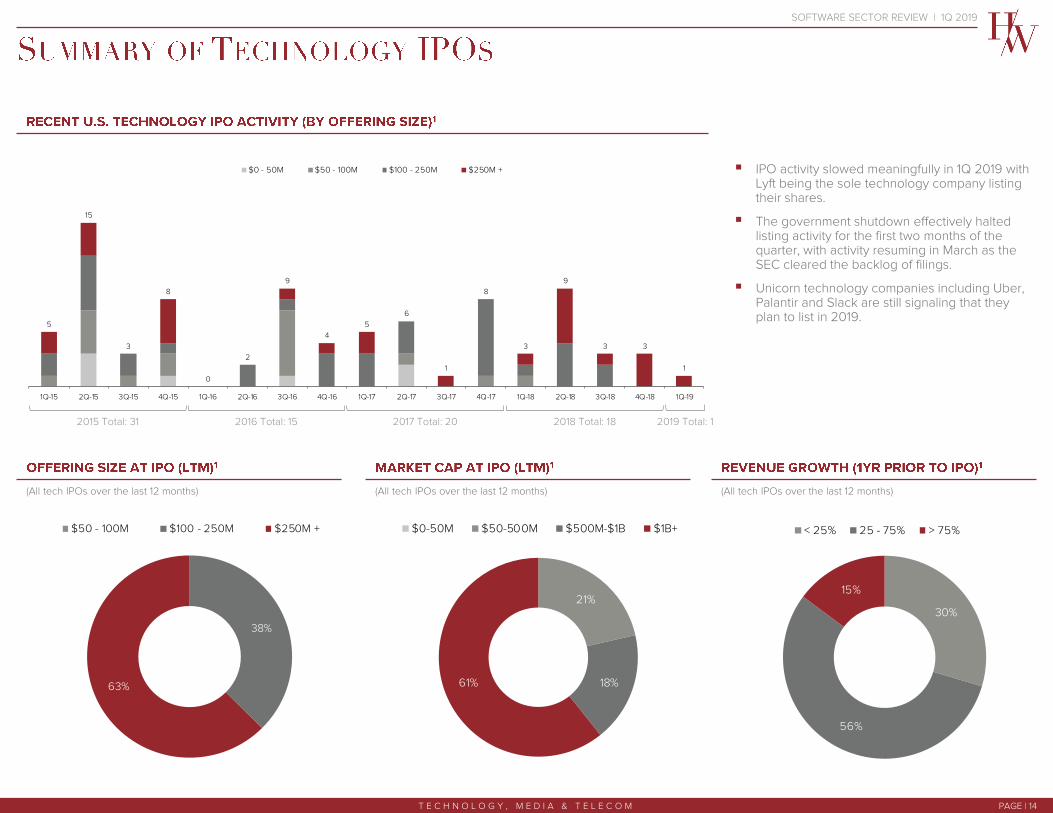
$0 - 50M $50 - 100M $100 - 250M $250M + IPO activity slowed meaningfully in 1Q 2019 withLyft being the sole technology company listingtheir shares.
The government shutdown effectively haltedlisting activity for the first two months of thequarter, with activity resuming in March as theSEC cleared the backlog of filings.
Unicorn technology companies including Uber, Palantir and Slack are still signaling that they plan to list in 2019.
(All tech IPOs over the last 12 months) (All tech IPOs over the last 12 months) (All tech IPOs over the last 12 months)
2019 Total: 12016 Total: 152015 Total: 31 2017 Total: 20 2018 Total: 18

T E C H N O L O G Y , M E D I A & T E L E C O M PAGE | 15
SOFTWARE SECTOR REVIEW | 1Q 2019
11/14/17 11/17/17 2/8/18 3/15/18 3/22/18 4/12/18 4/26/18 4/26/18 4/27/18 5/4/18 6/15/18 6/28/18 9/19/18 9/25/18 10/4/18
$16.00 $12.00 $13.00 $16.00 $21.00 $14.00 $29.00 $22.00 $15.00 $19.00 $24.00 $21.00 $23.00 $12.00 $36.00
$672.4 $1,026.6 $253.8 $1,877.3 $911.4 $1,127.6 $4,411.2 $2,999.0 $174.5 $1,250.7 $1,559.5 $455.5 $1,800.0 $1,493.7 $2,501.7
$131.2 $240.0 $70.2 $192.0 $756.0 $154.0 $629.3 $462.0 $174.5 $152.0 $180.0 $193.2 $230.0 $180.0 $252.0
238.0% 139.3% 27.2% 343.3% 3.8% 43.1% 78.8% 133.2% 171.9% (26.6%) 132.5% 92.0% (16.7%) 51.8% 121.9%
(150.0%)
(100.0%)
(50.0%)
0.0%
50.0%
100.0%
150.0%
200.0%
250.0%
238.0%
139.3%
27.2%
343.3%
3.8%
43.1%
78.8%
133.2%
171.9%
(26.6%)
132.5%
92.0%
(16.7%)
51.8%
121.9% 131.5%
30.1%
Circle Size Denotes Revenue ($)
40.8%
70.6%
15.6%
53.5% 31.0% 48.6% 35.9%
8.4%
66.1%
36.5% 34.7% 55.9% 51.1%
12.6%
79.1% 65.9%
18.5%
(150.0%)
(50.0%)
50.0%
150.0%

T E C H N O L O G Y , M E D I A & T E L E C O M PAGE | 16
SOFTWARE SECTOR REVIEW | 1Q 2019
3.8x 3.8x
4.3x
4.7x 4.7x
5.6x
4.5x
3.3x
4.2x 4.3x4.5x
4.8x
5.3x 5.4x5.2x
5.5x 5.6x5.7x
FLD/EBITDA SLD/EBITDA Other Sr Debt/EBITDA Sub Debt/EBITDA
57% 55% 54%
60% 58% 56%
50%
53% 55%
50%
2010 2011 2012 2013 2014 2015 2016 2017 2018 1Q '1914.8%
4.2%
7.0%
9.3%
17.0%
22.7%
24.9%
Other
Healthcare
Aerospace & Defense
Entertainment & Leisure
Automotive
Services & Leasing
Technology
Median middle market LBO loan multiples in 1Q 2019 increased slightly to 5.7x leverage.
Middle market LBO loan volume decreased to $0.6 billion in 1Q 2019, continuing a downward trend over the past two quarters.
Technology companies were the largest recipients of middle market LBO loans in 1Q 2019, representing 24.9% of new issuance.
Median LBO debt percentages decreased slightly to 50% of total purchase price in 1Q 2019.
YTD 2019 New Issue LBO Loans Percentage of Total Purchase Price
Defined as Issuers with EBITDA of $50 Million or Less($ in billions)
Defined as Issuers with EBITDA of $50 Million or Less
$0.4
$0.9
$1.2
$0.7
$0.9 $1.1
$1.8
$2.9
$1.1
$1.6
$1.8
$1.5
$0.9
$0.6
4Q'15 1Q'16 2Q'16 3Q'16 4Q'16 1Q'17 2Q'17 3Q'17 4Q'17 1Q'18 2Q'18 3Q'18 4Q'18 1Q'19
Institutional Pro Rata

T E C H N O L O G Y , M E D I A & T E L E C O M PAGE | 17
SOFTWARE SECTOR REVIEW | 1Q 2019
acquired bysignificant equity investment from
acquired by
acquired by
and
acquired bystrategic investment
fromacquired byacquired byacquired by minority investment fromacquired byacquired by
GFI Energy Groupa division of
acquired byacquired byacquired
majority recapitalization by
recapitalized by acquired by acquired byacquired byacquired byacquired byacquired byacquired byacquired by acquired byacquired byacquired byacquired byacquired by
acquired byacquired byacquired bymerged withstrategic investment
fromacquired byacquired byacquired byminority investment from acquired bymajority investment fromacquired by
acquired a majority stake in
acquired byacquired by
acquired byacquired byacquired byacquired byacquired byacquired byrecapitalized byacquired by
B2C
acquired byacquired by acquired byacquired byacquiredacquired byrecapitalized by
majority investment fromacquired byacquired bygrowth Investment frommajority investment fromacquiredacquired byacquired byacquired byacquired byacquired byacquired
majority investment from
acquired by
acquired byinvestment frommerged withacquired byacquiredacquired byacquired byacquired by acquired by
&
acquired byinvested in
a wholly-owned affiliate of
acquired by
&
acquired by acquired bymerged with
acquired
acquired byacquiredacquired by
&
acquired byacquiredacquired byacquiredacquired by acquired byacquiredstrategic investment
fromacquired
investment from
investment from majority investment from

T E C H N O L O G Y , M E D I A & T E L E C O M PAGE | 18
SOFTWARE SECTOR REVIEW | 1Q 2019
Software Bellwethers Microsoft Google Cisco Oracle IBM SAP Adobe Salesforce HPE
Communication Software Twilio NICE Nuance MobileIron Synchronoss
Enterprise Software Oracle IBM SAP Adobe ADP Intuit Amadeus Constellation OpenText Sage
Human Capita l Management (HCM) Workday ADP Paychex Paycom Ceridian Paylocity Cornerstone Benefitfocus
Marketing Software Adobe Salesforce HubSpot Acxiom Criteo ChannelAdvisor
PLM & Engineering Software Hexagon AB Dassault Autodesk Cadence Synopsys Ansys Trimble PTC Nemetschek Altair
Supply Cha in & Logist ics Software Coupa Wisetech Manhattan Descartes SPS Kinaxis American Amber Road
Energy Software AspenTech AVEVA Itron PSI
Financia l Software Fiserv Square SS&C MSCI Jack Henry Black Knight Oracle FSS Envestnet Q2 Holdings Blackline
Healthcare IT (HCIT) Veeva Cerner Medidata Inovalon HMS Allscripts NextGen Evolent Health Model N
EdTech / Public Sector Software Constellation Tyler Tech Blackbaud 2U Instructure K12 NIC
Large-Cap SaaS (≥ $2Bn Mk t Cap) Salesforce Workday ServiceNow Atlassian Check Point Veeva Paycom ZenDesk DocuSign RingCentral
Large-Cap SaaS (cont'd) HubSpot Guidewire Proofpoint Coupa Anaplan RealPage Smartsheet Xero Medidata CyberArk
Large-Cap SaaS (cont'd) LogMeIn Avalara Cornerstone Qualys Five9 Q2 Holdings Alarm.Com Box Mimecast Rapid7
Large-Cap SaaS (cont'd) Yext
Small-Cap SaaS (≤ $2Bn Mk t Cap) Ebix SPS Benefitfocus Instructure Eventbrite Model N Castlight Health Domo Amber Road
Data & Ana lyt ics Verisk Splunk Tableau Pegasystems Teradata Verint Inovalon PROS Holdings Talend MicroStrategy
IT Operations Management VMware ServiceNow Arista Micro Focus Citrix F5 Networks SolarWinds New Relic NetScout Software AG
IT Operations Management (cont'd) Progress Radware
Data Storage Iron Mountain NetApp Dropbox Nutanix Pure Storage Box CommVault Carbonite
IT Security Cisco Palo Alto Symantec VeriSign Check Point Fortinet Proofpoint Trend Micro CyberArk FireEye
IT Security (cont'd) Qualys Mimecast Rapid7 SailPoint ForeScout Varonis SecureWorks Cheetah Mobile

T E C H N O L O G Y , M E D I A & T E L E C O M PAGE | 19
SOFTWARE SECTOR REVIEW | 1Q 2019
Twilio, Inc. TWLO $17,971 $15,910 94.7% NM NM 62.9% 78.2% NM 27.6x 15.5x NM NM NM
NICE Systems Ltd. NICE-IL 7,772 7,306 96.8% 27.0% 82.2% 8.4% 11.7% 24.6% 5.4x 4.8x 21.9x 14.9x 45.9x
Nuance Communications, Inc. NUAN 6,132 4,825 94.6% 7.4% (7.3%) 4.6% (6.9%) 20.0% 3.0x 3.2x 15.0x 10.5x NM
MobileIron, Inc. MOBL 555 588 96.5% NM NM 9.5% 12.0% NM 2.9x 2.6x NM 84.1x NM
Synchronoss Technologies, Inc. SNCR 464 257 49.8% NM NM (19.0%) 6.8% NM 1.4x 1.3x NM 12.5x NM
Median $6,132 $4,825 94.7% 17 .2% 37 .5% 8.4% 11.7% 22.3% 3.0x 3.2x 18.5x 13.7x 45.9x
Oracle Corporation ORCL $211,831 $182,879 98.4% 17.0% 31.5% 0.4% 1.2% 42.8% 5.3x 5.3x 12.5x 11.1x 17.0x
IBM Corporation IBM 173,068 125,080 86.8% (8.4%) (5.9%) 0.6% (1.9%) 21.7% 2.2x 2.2x 10.0x 9.3x 14.3x
SAP SE SAP 141,278 141,755 90.9% 10.0% 44.2% 9.0% 7.7% 28.8% 4.8x 4.5x 16.9x 14.3x 29.4x
Adobe Inc. ADBE 133,608 129,985 96.0% 23.3% 185.8% 23.6% 24.4% 33.6% 14.1x 11.3x 41.9x 25.4x 48.5x
Automatic Data Processing, Inc. ADP 70,458 69,378 99.7% 40.4% 78.1% 8.2% 8.2% 23.4% 5.1x 4.7x 21.7x 19.4x 38.2x
Intuit Inc. INTU 68,716 67,525 99.9% 50.5% 154.3% 18.3% 10.5% 31.0% 10.7x 9.7x 34.4x 26.0x 45.9x
Amadeus IT Group AMS-ES 38,211 34,891 82.8% 7.8% 89.3% 6.4% 8.4% 41.1% 6.6x 6.1x 16.0x 14.9x 29.5x
Constellation Software Inc. CSU-CA 17,755 17,978 94.9% 25.1% 106.5% 23.4% 19.8% 25.2% 5.8x 4.8x 23.0x 18.2x 47.4x
Open Text Corporation OTEX 12,514 10,272 96.1% 10.5% 50.3% 8.0% 5.2% 36.5% 4.4x 4.2x 12.0x 10.9x 39.3x
Sage Group plc SGE-GB 10,917 9,923 95.4% 1.9% 3.3% 14.2% 6.4% 28.5% 4.4x 4.1x 15.4x 15.6x 25.0x
Median $69,587 $68,452 95.7% 13.7% 64.2% 8.6% 7 .9% 29.9% 5.2x 4.8x 16.4x 15.2x 33.9x
Microsoft Corporation MSFT $868,692 $902,674 97.4% 28.9% 115.1% 20.1% 13.3% 41.8% 7.3x 6.5x 17.6x 15.0x 26.9x
Alphabet Inc. GOOGL 728,235 812,553 90.6% 12.8% 52.8% 23.4% 24.5% 29.6% 5.3x 4.3x 18.0x 11.9x 26.4x
Cisco Systems, Inc. CSCO 220,133 235,575 98.7% 24.8% 90.5% 5.7% 4.0% 31.4% 4.3x 4.2x 13.8x 11.7x 18.3x
Oracle Corporation ORCL 211,831 182,879 98.4% 17.0% 31.5% 0.4% 1.2% 42.8% 5.3x 5.3x 12.5x 11.1x 17.0x
IBM Corporation IBM 173,068 125,080 86.8% (8.4%) (5.9%) 0.6% (1.9%) 21.7% 2.2x 2.2x 10.0x 9.3x 14.3x
SAP SE SAP 141,278 141,755 90.9% 10.0% 44.2% 9.0% 7.7% 28.8% 4.8x 4.5x 16.9x 14.3x 29.4x
Adobe Inc. ADBE 133,608 129,985 96.0% 23.3% 185.8% 23.6% 24.4% 33.6% 14.1x 11.3x 41.9x 25.4x 48.5x
salesforce.com, inc. CRM 125,876 121,394 94.4% 35.5% 118.0% 26.7% 24.5% 16.2% 9.5x 7.6x 58.4x 32.3x 109.4x
Hewlett Packard Enterprise Co. HPE 28,322 21,111 86.2% (12.1%) 50.3% 20.9% 1.1% 16.5% 0.9x 0.9x 5.6x 5.5x 29.9x
Median $173,068 $141,755 94.4% 17 .0% 52.8% 20.1% 7 .7% 29.6% 5.3x 4.5x 16.9x 11.9x 26.9x
Enterprise Market % of 52 1- Year Stock 3- Year Stock Revenue Growth LTM EBITDA Enterprise Value / Price /
Company Ticker Value ($mm) Cap ($mm) Week High Performance Performance LTM NTM Margin LTM Rev. NTM Rev. LTM EBITDA NTM EBITDA Earnings
Large-Cap SaaS
Small-Cap SaaS
Data & Analytics
IT Operations
Data Storage
IT Security
Software Bellwethers
Communication
Enterprise
HCM
Marketing
PLM & Engineering
SCM & Logistics
Energy
Financial
HCIT
EdTech / Public Sector
T E C H N O L O G Y , M E D I A & T E L E C O M PAGE | 20
SOFTWARE SECTOR REVIEW | 1Q 2019
Hexagon AB HEXA.B-SE $177,587 $18,869 84.0% (12.2%) 40.4% 13.3% 3.8% 27.1% 40.0x 38.5x 147.5x 118.7x 21.9x
Dassault Systemes SA DSY-FR 36,845 38,779 90.3% 9.2% 89.7% 12.7% 8.8% 30.0% 9.0x 8.3x 29.9x 23.9x 57.7x
Autodesk, Inc. ADSK 36,021 34,041 91.8% 23.6% 166.5% 25.9% 31.8% 4.8% 14.0x 10.6x NM 35.5x NM
Cadence Design Systems, Inc. CDNS 18,410 17,751 99.5% 71.7% 167.7% 10.0% 8.8% 25.8% 8.6x 7.9x 33.3x 24.8x 51.3x
Synopsys, Inc. SNPS 17,905 17,139 99.5% 37.6% 137.2% 11.7% 7.8% 20.7% 5.6x 5.2x 27.3x 19.8x 29.1x
ANSYS, Inc. ANSS 15,017 15,272 95.7% 16.3% 105.4% 18.1% 13.7% 41.4% 11.6x 10.2x 28.0x 22.2x 36.4x
Trimble Inc. TRMB 12,257 10,225 91.0% 13.0% 63.2% 17.1% 10.4% 19.5% 3.9x 3.6x 20.2x 15.5x 36.2x
PTC Inc. PTC 11,657 10,884 85.4% 17.7% 179.1% 7.0% 11.6% 15.3% 9.2x 8.2x 59.9x 27.6x 184.2x
Nemetschek SE NEM-DE 6,418 6,384 91.6% 48.2% 245.5% 22.0% 14.8% 27.7% 11.8x 10.3x 42.6x 38.0x 70.7x
Altair Engineering Inc. ALTR 2,847 2,651 85.3% 19.6% NA 18.9% 24.8% 9.1% 7.2x 5.8x 79.3x 41.7x 193.3x
Median $16,461 $16,206 91.3% 18.7% 137 .2% 15.2% 11.0% 23.3% 9.1x 8.2x 33.3x 26.2x 51.3x
Adobe Inc. ADBE $133,608 $129,985 96.0% 23.3% 185.8% 23.6% 24.4% 33.6% 14.1x 11.3x 41.9x 25.4x 48.5x
salesforce.com, inc. CRM 125,876 121,394 94.4% 35.5% 118.0% 26.7% 24.5% 16.2% 9.5x 7.6x 58.4x 32.3x 109.4x
HubSpot, Inc. HUBS 7,700 6,863 92.7% 54.0% 264.7% 36.6% 34.3% NM 15.0x 11.2x NM 88.7x NM
Acxiom Holdings, Inc. ACXM 4,050 3,743 86.4% 140.6% 153.9% (49.6%) (19.6%) NM 9.0x 11.1x NM NM NM
Criteo SA CRTO 1,051 1,250 53.1% (24.7%) (51.4%) (0.8%) (55.2%) 10.5% 0.5x 1.0x 4.4x 3.4x 14.1x
Channeladvisor Corporation ECOM 328 343 79.0% 35.7% 12.7% 7.1% 6.7% NM 2.5x 2.3x NM 22.4x NM
Median $5,875 $5,303 89.5% 35.6% 136.0% 15.3% 15.5% 16.2% 9.2x 9.4x 41.9x 25.4x 48.5x
Workday, Inc. WDAY $78,007 $42,973 96.8% 52.4% 160.5% 32.1% 29.9% NM 27.6x 21.2x NM 112.2x NM
Automatic Data Processing, Inc. ADP 70,458 69,378 99.7% 40.4% 78.1% 8.2% 8.2% 23.4% 5.1x 4.7x 21.7x 19.4x 38.2x
Paychex, Inc. PAYX 29,196 28,650 98.8% 29.5% 46.4% 10.7% 12.1% 41.9% 8.0x 7.1x 19.0x 17.5x 27.7x
Paycom Software, Inc. PAYC 11,216 11,074 99.3% 76.3% 440.8% 30.8% 32.6% 35.9% 19.8x 14.9x 55.2x 36.5x 80.9x
Ceridian HCM Holding, Inc. CDAY 8,159 7,091 98.2% NA NA (0.6%) 12.5% 14.3% 10.9x 9.7x 76.6x 41.9x NM
Paylocity Holding Corp. PCTY 4,950 4,753 97.1% 75.3% 185.8% 25.1% 27.3% 14.8% 11.9x 9.3x 79.8x 32.0x 89.4x
Cornerstone Ondemand, Inc. CSOD 3,632 3,228 90.8% 39.7% 66.3% 11.6% 8.3% 7.0% 6.8x 6.2x 96.8x 26.2x NM
Benefitfocus, Inc. BNFT 1,709 1,546 79.5% 97.7% 46.8% 0.8% 22.8% NM 6.6x 5.4x NM 77.0x NM
Median $9,687 $9,083 97 .6% 52.4% 78.1% 11.2% 17 .7% 19.1% 9.5x 8.2x 65.9x 34.2x 59.6x
Large-Cap SaaS
Small-Cap SaaS
Data & Analytics
IT Operations
Data Storage
IT Security
Software Bellwethers
Communication
Enterprise
HCM
Marketing
PLM & Engineering
SCM & Logistics
Energy
Financial
HCIT
Enterprise Market % of 52 1- Year Stock 3- Year Stock Revenue Growth LTM EBITDA Enterprise Value / Price /
Company Ticker Value ($mm) Cap ($mm) Week High Performance Performance LTM NTM Margin LTM Rev. NTM Rev. LTM EBITDA NTM EBITDA Earnings
EdTech / Public Sector

T E C H N O L O G Y , M E D I A & T E L E C O M PAGE | 21
SOFTWARE SECTOR REVIEW | 1Q 2019
Fiserv, Inc. FISV $47,630 $34,503 99.4% 23.6% 73.4% 2.2% 7.3% 35.7% 8.2x 7.6x 22.9x 19.7x 29.1x
Square, Inc. SQ 36,350 31,515 74.3% 52.7% 446.7% 49.0% (25.9%) 3.6% 11.0x 14.9x NM 76.3x NM
SS&C Technologies Holdings, Inc. SSNC 27,024 15,975 98.5% 18.2% 100.1% 104.2% 39.2% 32.4% 7.9x 5.7x 24.4x 14.5x 154.8x
MSCI Inc. MSCI 18,644 16,699 99.6% 32.5% 172.5% 12.5% 9.4% 53.9% 13.0x 11.9x 24.1x 21.6x 32.9x
Jack Henry & Associates, Inc. JKHY 10,729 10,708 84.8% 14.7% 64.3% 7.4% 3.9% 35.0% 6.8x 6.5x 19.4x 19.3x 34.6x
Black Knight Financial Services, Inc. BKFS 9,595 8,165 96.4% 15.6% 77.4% 5.9% 8.8% 43.9% 8.6x 7.9x 19.6x 15.9x 48.5x
Oracle Financial Services Software Ltd. 532466-IN 4,238 4,200 73.5% (14.6%) (7.1%) 2.5% 10.6% 41.4% 6.0x 5.4x 14.4x 12.4x 22.1x
Envestnet, Inc. ENV 3,504 3,139 96.5% 13.8% 135.9% 18.8% 14.0% 11.7% 4.3x 3.8x 36.8x 18.4x NM
Q2 Holdings, Inc. QTWO 3,365 3,026 96.4% 52.4% 205.2% 24.3% 34.7% NM 14.0x 10.4x NM 130.5x NM
BlackLine, Inc. BL 2,595 2,547 79.6% 18.0% NA 28.7% 28.4% NM 11.4x 8.9x NM 108.6x NM
Median $10 ,162 $9,437 96.4% 18.1% 100.1% 15.7% 10 .0% 35.4% 8.4x 7 .8x 22.9x 19.5x 33.7x
Aspen Technology, Inc. AZPN $7,591 $7,258 87.7% 32.2% 191.1% 3.2% 11.0% 41.4% 15.0x 13.5x 36.2x 26.9x 41.9x
AVEVA Group plc AVV-GB 6,649 6,704 98.8% 55.1% 192.8% 243.8% 4.9% 22.2% 6.7x 6.4x 30.3x 23.1x 93.3x
Itron, Inc. ITRI 2,915 1,862 64.9% (34.7%) 11.1% 17.7% 2.6% 10.2% 1.2x 1.2x 12.1x 10.4x NM
PSI Aktiengesellschaft PSAN-DE 357 299 89.8% (10.2%) 27.4% 11.9% 4.8% 13.0% 1.5x 1.4x 11.7x 13.7x 24.0x
Median $4,782 $4,283 88.7% 11.0% 109.3% 14.8% 4.9% 17 .6% 4.1x 3.9x 21.2x 18.4x 41.9x
Coupa Software, Inc. COUP $6,448 $5,538 90.7% 98.9% NA 39.4% 31.0% NM 24.8x 18.9x NM NM NM
Wisetech Global Ltd. WTC-AU 5,122 5,166 90.0% 126.7% NA 57.3% 36.7% 35.4% 24.1x 17.6x 68.0x 53.3x 142.8x
Manhattan Associates, Inc. MANH 3,649 3,594 88.6% 32.0% (2.2%) (6.0%) 2.7% 25.5% 6.5x 6.4x 25.6x 27.8x 34.3x
Descartes Systems Group Inc. DSG-CA 2,770 2,753 99.1% 25.4% 87.8% 15.9% 21.4% 32.3% 10.1x 8.3x 31.2x 22.9x 88.0x
SPS Commerce, Inc. SPSC 1,801 1,892 94.0% 66.2% 160.1% 12.5% 13.3% 15.9% 7.3x 6.4x 45.7x 27.2x 79.2x
Kinaxis, Inc. KXS-CA 1,379 1,511 75.2% (9.8%) 93.2% 13.1% 28.9% 22.4% 9.1x 7.1x 40.8x 28.4x 104.9x
American Software, Inc. AMSWA 381 373 63.4% (7.7%) 34.2% 2.0% 3.8% 12.5% 3.4x 3.3x 27.3x 22.9x 60.3x
Amber Road, Inc. AMBR 274 246 83.3% (2.5%) 60.6% 7.7% 7.3% NM 3.2x 3.0x NM 41.2x NM
Median $2,285 $2,323 89.3% 28.7% 74.2% 12.8% 17 .3% 24.0% 8.2x 6.8x 36.0x 27 .8x 83.6x
Large-Cap SaaS
Small-Cap SaaS
Data & Analytics
IT Operations
Data Storage
IT Security
Software Bellwethers
Communication
Enterprise
HCM
Marketing
PLM & Engineering
SCM & Logistics
Energy
Financial
HCIT
Enterprise Market % of 52 1- Year Stock 3- Year Stock Revenue Growth LTM EBITDA Enterprise Value / Price /
Company Ticker Value ($mm) Cap ($mm) Week High Performance Performance LTM NTM Margin LTM Rev. NTM Rev. LTM EBITDA NTM EBITDA Earnings
EdTech / Public Sector

T E C H N O L O G Y , M E D I A & T E L E C O M PAGE | 22
SOFTWARE SECTOR REVIEW | 1Q 2019
Constellation Software Inc. CSU-CA $17,755 $17,978 94.9% 25.1% 106.5% 23.4% 19.8% 25.2% 5.8x 4.8x 23.0x 18.2x 47.4x
Tyler Technologies, Inc. TYL 8,169 7,883 81.5% (2.4%) 58.2% 11.3% 19.2% 22.8% 8.7x 7.3x 38.3x 24.8x 53.5x
Blackbaud, Inc. BLKB 4,357 3,852 65.9% (22.1%) 26.5% 7.6% 6.1% 16.9% 5.1x 4.8x 30.3x 23.2x 85.9x
2U, Inc. TWOU 4,001 4,207 73.3% (14.0%) 214.6% 43.6% 43.1% NM 9.7x 6.8x NM NM NM
Instructure, Inc. INST 1,633 1,663 95.5% 11.4% 166.2% 31.9% 29.0% NM 7.8x 6.0x NM NM NM
K12 Inc. LRN 1,293 1,387 99.7% 143.2% 247.6% 10.6% 7.0% 13.1% 1.3x 1.2x 10.1x 9.3x 36.7x
NIC Inc. EGOV 981 1,152 97.2% 28.3% (4.2%) 2.5% 0.1% 24.7% 2.8x 2.8x 11.5x 12.2x 20.0x
Median $4,001 $3,852 94.9% 11.4% 106.5% 11.3% 19.2% 22.8% 5.8x 4.8x 23.0x 18.2x 47 .4x
Veeva Systems Inc VEEV 19,966 18,400 98.3% 73.5% 409.9% 25.8% 23.0% 27.4% 23.2x 18.8x 84.5x 50.8x 80.1x
Cerner Corporation CERN 18,046 18,489 84.4% (1.7%) 8.7% 4.4% 8.8% 26.4% 3.4x 3.1x 12.7x 10.5x 29.3x
Medidata Solutions, Inc. MDSO 4,711 4,579 82.8% 17.1% 95.4% 16.5% 20.7% 13.5% 7.4x 6.1x 54.8x 24.8x 88.2x
Inovalon Holdings, Inc. INOV 2,804 1,905 80.0% 17.5% (34.8%) 17.4% 22.1% 21.9% 5.3x 4.4x 24.2x 13.6x NM
HMS Holdings Corp. HMSY 2,715 2,550 78.4% 77.6% 117.7% 14.8% 10.3% 25.0% 4.5x 4.1x 18.2x 15.2x 46.4x
Allscripts Healthcare Solutions, Inc. MDRX 2,128 1,651 64.5% (21.9%) (24.7%) (3.1%) 4.0% 9.8% 1.2x 1.2x 12.4x 6.9x NM
NextGen Healthcare, Inc. QSII 1,096 1,095 71.3% 24.0% 13.9% 0.5% 4.7% 13.5% 2.1x 2.0x 15.3x 12.2x 115.0x
Evolent Health Inc. EVH 939 998 43.3% (11.8%) 16.6% 44.2% 37.8% 10.9% 1.5x 1.1x 13.8x 49.0x NM
Model N, Inc. MODN 612 553 86.2% (2.9%) 61.6% 6.0% (1.7%) NM 4.1x 4.1x NM 52.2x NM
Median $2,7 15 $1,905 80.0% 17 .1% 16.6% 14.8% 10 .3% 17 .7% 4.1x 4.1x 16.7x 15.2x 80.1x
Large-Cap SaaS
Small-Cap SaaS
Data & Analytics
IT Operations
Data Storage
IT Security
Software Bellwethers
Communication
Enterprise
HCM
Marketing
PLM & Engineering
SCM & Logistics
Energy
Financial
HCIT
EdTech / Public Sector
Enterprise Market % of 52 1- Year Stock 3- Year Stock Revenue Growth LTM EBITDA Enterprise Value / Price /
Company Ticker Value ($mm) Cap ($mm) Week High Performance Performance LTM NTM Margin LTM Rev. NTM Rev. LTM EBITDA NTM EBITDA Earnings
T E C H N O L O G Y , M E D I A & T E L E C O M PAGE | 23
SOFTWARE SECTOR REVIEW | 1Q 2019
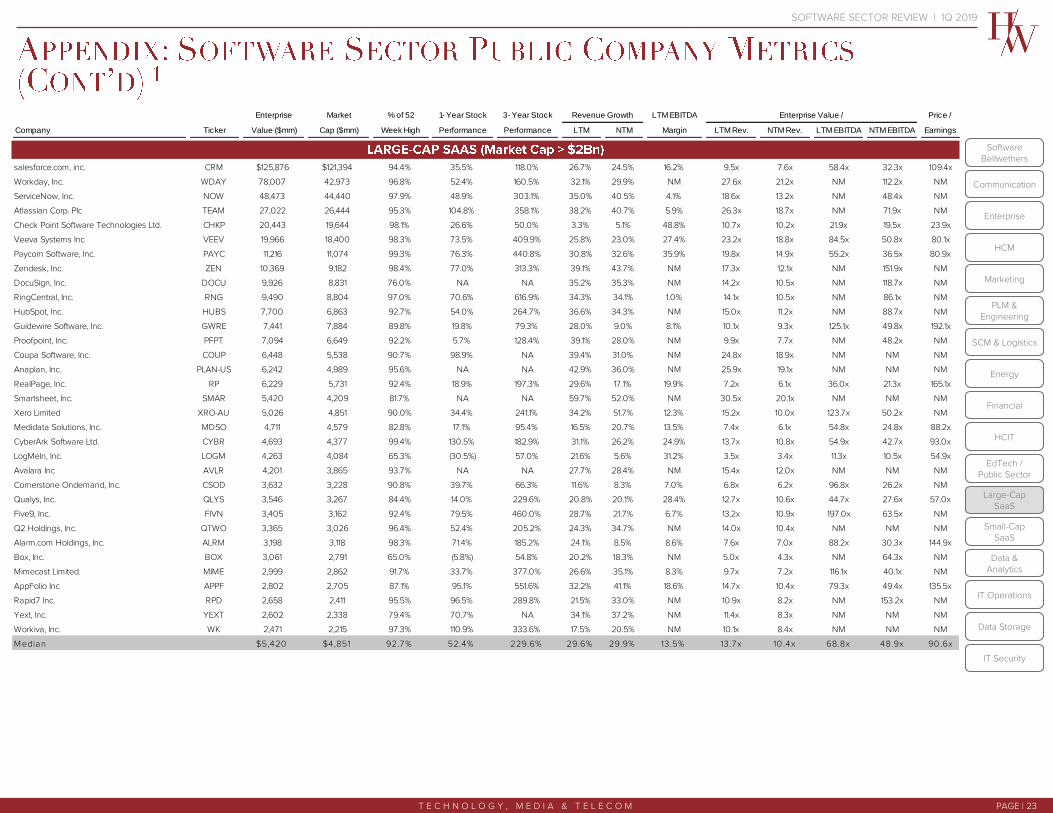
salesforce.com, inc. CRM $125,876 $121,394 94.4% 35.5% 118.0% 26.7% 24.5% 16.2% 9.5x 7.6x 58.4x 32.3x 109.4x
Workday, Inc. WDAY 78,007 42,973 96.8% 52.4% 160.5% 32.1% 29.9% NM 27.6x 21.2x NM 112.2x NM
ServiceNow, Inc. NOW 48,473 44,440 97.9% 48.9% 303.1% 35.0% 40.5% 4.1% 18.6x 13.2x NM 48.4x NM
Atlassian Corp. Plc TEAM 27,022 26,444 95.3% 104.8% 358.1% 38.2% 40.7% 5.9% 26.3x 18.7x NM 71.9x NM
Check Point Software Technologies Ltd. CHKP 20,443 19,644 98.1% 26.6% 50.0% 3.3% 5.1% 48.8% 10.7x 10.2x 21.9x 19.5x 23.9x
Veeva Systems Inc VEEV 19,966 18,400 98.3% 73.5% 409.9% 25.8% 23.0% 27.4% 23.2x 18.8x 84.5x 50.8x 80.1x
Paycom Software, Inc. PAYC 11,216 11,074 99.3% 76.3% 440.8% 30.8% 32.6% 35.9% 19.8x 14.9x 55.2x 36.5x 80.9x
Zendesk, Inc. ZEN 10,369 9,182 98.4% 77.0% 313.3% 39.1% 43.7% NM 17.3x 12.1x NM 151.9x NM
DocuSign, Inc. DOCU 9,926 8,831 76.0% NA NA 35.2% 35.3% NM 14.2x 10.5x NM 118.7x NM
RingCentral, Inc. RNG 9,490 8,804 97.0% 70.6% 616.9% 34.3% 34.1% 1.0% 14.1x 10.5x NM 86.1x NM
HubSpot, Inc. HUBS 7,700 6,863 92.7% 54.0% 264.7% 36.6% 34.3% NM 15.0x 11.2x NM 88.7x NM
Guidewire Software, Inc. GWRE 7,441 7,884 89.8% 19.8% 79.3% 28.0% 9.0% 8.1% 10.1x 9.3x 125.1x 49.8x 192.1x
Proofpoint, Inc. PFPT 7,094 6,649 92.2% 5.7% 128.4% 39.1% 28.0% NM 9.9x 7.7x NM 48.2x NM
Coupa Software, Inc. COUP 6,448 5,538 90.7% 98.9% NA 39.4% 31.0% NM 24.8x 18.9x NM NM NM
Anaplan, Inc. PLAN-US 6,242 4,989 95.6% NA NA 42.9% 36.0% NM 25.9x 19.1x NM NM NM
RealPage, Inc. RP 6,229 5,731 92.4% 18.9% 197.3% 29.6% 17.1% 19.9% 7.2x 6.1x 36.0x 21.3x 165.1x
Smartsheet, Inc. SMAR 5,420 4,209 81.7% NA NA 59.7% 52.0% NM 30.5x 20.1x NM NM NM
Xero Limited XRO-AU 5,026 4,851 90.0% 34.4% 241.1% 34.2% 51.7% 12.3% 15.2x 10.0x 123.7x 50.2x NM
Medidata Solutions, Inc. MDSO 4,711 4,579 82.8% 17.1% 95.4% 16.5% 20.7% 13.5% 7.4x 6.1x 54.8x 24.8x 88.2x
CyberArk Software Ltd. CYBR 4,693 4,377 99.4% 130.5% 182.9% 31.1% 26.2% 24.9% 13.7x 10.8x 54.9x 42.7x 93.0x
LogMeIn, Inc. LOGM 4,263 4,084 65.3% (30.5%) 57.0% 21.6% 5.6% 31.2% 3.5x 3.4x 11.3x 10.5x 54.9x
Avalara Inc AVLR 4,201 3,865 93.7% NA NA 27.7% 28.4% NM 15.4x 12.0x NM NM NM
Cornerstone Ondemand, Inc. CSOD 3,632 3,228 90.8% 39.7% 66.3% 11.6% 8.3% 7.0% 6.8x 6.2x 96.8x 26.2x NM
Qualys, Inc. QLYS 3,546 3,267 84.4% 14.0% 229.6% 20.8% 20.1% 28.4% 12.7x 10.6x 44.7x 27.6x 57.0x
Five9, Inc. FIVN 3,405 3,162 92.4% 79.5% 460.0% 28.7% 21.7% 6.7% 13.2x 10.9x 197.0x 63.5x NM
Q2 Holdings, Inc. QTWO 3,365 3,026 96.4% 52.4% 205.2% 24.3% 34.7% NM 14.0x 10.4x NM NM NM
Alarm.com Holdings, Inc. ALRM 3,198 3,118 98.3% 71.4% 185.2% 24.1% 8.5% 8.6% 7.6x 7.0x 88.2x 30.3x 144.9x
Box, Inc. BOX 3,061 2,791 65.0% (5.8%) 54.8% 20.2% 18.3% NM 5.0x 4.3x NM 64.3x NM
Mimecast Limited MIME 2,999 2,862 91.7% 33.7% 377.0% 26.6% 35.1% 8.3% 9.7x 7.2x 116.1x 40.1x NM
AppFolio Inc APPF 2,802 2,705 87.1% 95.1% 551.6% 32.2% 41.1% 18.6% 14.7x 10.4x 79.3x 49.4x 135.5x
Rapid7 Inc. RPD 2,658 2,411 95.5% 96.5% 289.8% 21.5% 33.0% NM 10.9x 8.2x NM 153.2x NM
Yext, Inc. YEXT 2,602 2,338 79.4% 70.7% NA 34.1% 37.2% NM 11.4x 8.3x NM NM NM
Workiva, Inc. WK 2,471 2,215 97.3% 110.9% 333.6% 17.5% 20.5% NM 10.1x 8.4x NM NM NM
Median $5,420 $4,851 92.7% 52.4% 229.6% 29.6% 29.9% 13.5% 13.7x 10 .4x 68.8x 48.9x 90.6x
Large-Cap SaaS
Small-Cap SaaS
Data & Analytics
IT Operations
Data Storage
IT Security
Software Bellwethers
Communication
Enterprise
HCM
Marketing
PLM & Engineering
SCM & Logistics
Energy
Financial
HCIT
Enterprise Market % of 52 1- Year Stock 3- Year Stock Revenue Growth LTM EBITDA Enterprise Value / Price /
Company Ticker Value ($mm) Cap ($mm) Week High Performance Performance LTM NTM Margin LTM Rev. NTM Rev. LTM EBITDA NTM EBITDA Earnings
EdTech / Public Sector

T E C H N O L O G Y , M E D I A & T E L E C O M PAGE | 24
SOFTWARE SECTOR REVIEW | 1Q 2019
Large-Cap SaaS
Small-Cap SaaS
Data & Analytics
IT Operations
Data Storage
IT Security
Software Bellwethers
Communication
Enterprise
HCM
Marketing
PLM & Engineering
SCM & Logistics
Energy
Financial
HCIT
Enterprise Market % of 52 1- Year Stock 3- Year Stock Revenue Growth LTM EBITDA Enterprise Value / Price /
Company Ticker Value ($mm) Cap ($mm) Week High Performance Performance LTM NTM Margin LTM Rev. NTM Rev. LTM EBITDA NTM EBITDA Earnings
EdTech / Public Sector
Ebix, Inc. EBIX $2,123 $1,507 55.4% (33.8%) 20.4% 36.8% 28.5% 34.1% 4.3x 3.3x 12.5x 10.0x 16.2x
SPS Commerce, Inc. SPSC 1,801 1,892 94.0% 66.2% 160.1% 12.5% 13.3% 15.9% 7.3x 6.4x 45.7x 27.2x 79.2x
Benefitfocus, Inc. BNFT 1,709 1,546 79.5% 97.7% 46.8% 0.8% 22.8% NM 6.6x 5.4x NM NM NM
Instructure, Inc. INST 1,633 1,663 95.5% 11.4% 166.2% 31.9% 29.0% NM 7.8x 6.0x NM NM NM
Eventbrite, Inc. EB 1,385 1,524 48.4% NA NA 48.3% 16.6% 1.4% 4.5x 3.9x NM 34.8x NM
Model N, Inc. MODN 612 553 86.2% (2.9%) 61.6% 6.0% (1.7%) NM 4.1x 4.1x NM 52.2x NM
Castlight Health, Inc. CSLT 527 548 64.1% 4.5% 17.7% 19.0% 2.8% NM 3.4x 3.3x NM 64.4x NM
Domo, Inc. DOMO 409 1,058 85.3% NA NA 31.3% 26.5% NM 2.9x 2.3x NM NM NM
Amber Road, Inc. AMBR 274 246 83.3% (2.5%) 60.6% 7.7% 7.3% NM 3.2x 3.0x NM 41.2x NM
Median $1,385 $1,507 83.3% 4.5% 60.6% 19.0% 16.6% 15.9% 4.3x 3.9x 29.1x 38.0x 47 .7x

T E C H N O L O G Y , M E D I A & T E L E C O M PAGE | 25
SOFTWARE SECTOR REVIEW | 1Q 2019
VMware, Inc. VMW $77,730 $73,740 95.2% 48.0% 249.5% 13.3% 13.5% 30.0% 8.7x 7.6x 28.9x 20.1x 30.4x
ServiceNow, Inc. NOW 48,473 44,440 97.9% 48.9% 303.1% 35.0% 40.5% 4.1% 18.6x 13.2x NM 48.4x NM
Arista Networks, Inc. ANET 24,278 23,794 99.2% 23.1% 407.7% 30.7% 29.6% 32.8% 11.3x 8.7x 34.4x 23.4x 72.6x
Micro Focus International plc MCRO-GB 15,288 10,642 96.8% 87.3% 15.6% 64.2% 8.2% 44.5% 4.8x 4.5x 10.8x 10.4x 22.6x
Citrix Systems, Inc. CTXS 15,087 13,163 85.6% 7.7% 60.9% 5.3% 4.9% 28.2% 5.1x 4.8x 18.0x 13.6x 22.9x
F5 Networks, Inc. FFIV 9,527 9,279 78.3% 8.1% 49.4% 4.0% 3.8% 31.2% 4.4x 4.2x 14.0x 11.1x 18.7x
SolarWinds Corp. SWI-US 7,706 6,016 91.5% NA NA 14.4% 14.6% 45.0% 9.3x 8.1x 20.6x 16.6x NM
New Relic, Inc. NEWR 5,762 5,686 86.4% 33.8% 291.7% 35.0% 34.8% 0.1% 12.9x 9.6x NM NM NM
NetScout Systems, Inc. NTCT 2,406 2,167 87.6% 5.7% 23.5% (15.2%) 2.9% 11.8% 2.6x 2.6x 22.4x NA NM
Software AG SOW-DE 2,384 2,491 62.8% (35.7%) (11.3%) 7.2% (1.5%) 30.8% 2.3x 2.3x 7.5x 8.0x 13.8x
Progress Software Corporation PRGS 2,054 2,020 94.1% 16.5% 77.0% (2.0%) 2.0% 33.7% 5.2x 5.1x 15.5x 12.4x 33.7x
Radware Ltd. RDWR 1,291 1,184 91.7% 22.4% 120.6% 10.9% 11.4% 7.4% 5.5x 4.9x 74.6x 33.8x 100.9x
Median $8,617 $7 ,648 91.6% 22.4% 77 .0% 12.1% 9.8% 30.4% 5.4x 5.0x 19.3x 15.1x 26.7x
Verisk Analytics Inc VRSK $24,948 $21,740 99.7% 27.9% 69.2% 11.6% 8.6% 47.3% 10.4x 9.6x 22.0x 19.9x 36.3x
Splunk Inc. SPLK 19,278 18,702 86.8% 26.7% 155.0% 41.9% 26.9% NM 10.7x 8.4x NM 50.2x NM
Tableau Software, Inc. DATA 11,938 10,944 92.3% 56.3% 176.7% 31.7% 23.7% NM 10.3x 8.4x NM 51.7x NM
Pegasystems Inc. PEGA 5,469 5,083 95.4% 6.8% 159.5% 6.1% 11.5% 2.9% 6.1x 5.5x NM 88.4x NM
Teradata Corporation TDC 5,181 5,158 88.9% 10.7% 65.8% 0.4% (5.5%) 9.0% 2.4x 2.5x 26.6x 13.0x 171.9x
Verint Systems Inc. VRNT 4,533 4,005 99.5% 43.9% 74.2% 8.3% 12.5% 16.5% 3.7x 3.3x 22.3x 13.2x 60.7x
Inovalon Holdings, Inc. INOV 2,804 1,905 80.0% 17.5% (34.8%) 17.4% 22.1% 21.9% 5.3x 4.4x 24.2x 13.6x NM
PROS Holdings, Inc. PRO 1,690 1,606 95.3% 27.9% 262.8% 16.7% 21.8% NM 8.6x 7.0x NM NM NM
Talend SA TLND 1,649 1,525 68.8% 5.1% NA 36.2% 28.5% NM 8.1x 6.3x NM NM NM
MicroStrategy Incorporated MSTR 1,513 1,500 96.5% 13.1% (17.9%) (1.4%) 6.0% 3.4% 3.0x 2.9x 88.6x 45.2x 66.7x
Median $4,857 $4,544 93.8% 22.1% 74.2% 14.2% 17 .1% 12.8% 7 .1x 5.9x 24.2x 32.5x 63.7x
Large-Cap SaaS
Small-Cap SaaS
Data & Analytics
IT Operations
Data Storage
IT Security
Software Bellwethers
Communication
Enterprise
HCM
Marketing
PLM & Engineering
SCM & Logistics
Energy
Financial
HCIT
Enterprise Market % of 52 1- Year Stock 3- Year Stock Revenue Growth LTM EBITDA Enterprise Value / Price /
Company Ticker Value ($mm) Cap ($mm) Week High Performance Performance LTM NTM Margin LTM Rev. NTM Rev. LTM EBITDA NTM EBITDA Earnings
EdTech / Public Sector

T E C H N O L O G Y , M E D I A & T E L E C O M PAGE | 26
SOFTWARE SECTOR REVIEW | 1Q 2019
Cisco Systems, Inc. CSCO $220,133 $235,575 98.7% 24.8% 90.5% 5.7% 4.0% 31.4% 4.3x 4.2x 13.8x 11.7x 18.3x
Palo Alto Networks, Inc. PANW 24,038 22,519 92.2% 32.4% 50.9% 30.3% 24.6% 5.1% 9.3x 7.4x 180.2x 26.5x NM
Symantec Corporation SYMC 23,156 14,676 78.6% (11.2%) 24.9% 0.3% 4.6% 25.2% 4.9x 4.7x 19.4x 11.4x NM
VeriSign, Inc. VRSN 22,542 21,797 98.0% 53.6% 104.3% 4.3% 2.0% 67.1% 18.6x 18.2x 27.6x 25.0x 37.4x
Check Point Software Ltd. CHKP 20,443 19,644 98.1% 26.6% 50.0% 3.3% 5.1% 48.8% 10.7x 10.2x 21.9x 19.5x 23.9x
Fortinet, Inc. FTNT 15,083 14,244 88.5% 55.8% 187.1% 20.5% 19.4% 21.0% 8.4x 7.0x 39.9x 26.5x 42.9x
Proofpoint, Inc. PFPT 7,094 6,649 92.2% 5.7% 128.4% 39.1% 28.0% NM 9.9x 7.7x NM 48.2x NM
Trend Micro Incorporated 4704-JP 6,847 6,830 73.2% (16.1%) 33.6% 9.4% 7.7% 32.3% 4.7x 4.4x 14.6x 13.7x 26.6x
CyberArk Software Ltd. CYBR 4,693 4,377 99.4% 130.5% 182.9% 31.1% 26.2% 24.9% 13.7x 10.8x 54.9x 42.7x 93.0x
FireEye, Inc. FEYE 3,597 3,396 81.2% (1.2%) (6.6%) 10.6% 8.5% NM 4.3x 4.0x NM 30.3x NM
Qualys, Inc. QLYS 3,546 3,267 84.4% 14.0% 229.6% 20.8% 20.1% 28.4% 12.7x 10.6x 44.7x 27.6x 57.0x
Mimecast Limited MIME 2,999 2,862 91.7% 33.7% 377.0% 26.6% 35.1% 8.3% 9.7x 7.2x 116.1x 40.1x NM
Rapid7 Inc. RPD 2,658 2,411 95.5% 96.5% 289.8% 21.5% 33.0% NM 10.9x 8.2x NM 153.2x NM
SailPoint Technologies SAIL 2,574 2,522 82.4% 37.8% NA 33.8% 24.7% 8.7% 10.3x 8.3x 118.9x NM NM
ForeScout Technologies, Inc. FSCT 2,203 1,874 90.8% 30.0% NA 34.8% 30.3% NM 7.4x 5.7x NM NM NM
Varonis Systems, Inc. VRNS 1,790 1,774 71.2% (2.2%) 226.0% 24.3% 14.6% NM 6.6x 5.8x NM NM NM
SecureWorks Corp. SCWX 1,442 1,476 72.5% 123.6% NA 10.9% 11.2% NM 2.8x 2.5x NM NM NM
Cheetah Mobile, Inc. CMCM 490 917 44.9% (52.1%) (61.4%) 2.3% 4.6% 10.3% 0.7x 0.6x 6.3x 10.4x 5.0x
Median $4,145 $3,886 89.7% 28.3% 104.3% 20.7% 17 .0% 25.0% 8.8x 7 .1x 33.8x 26.5x 32.0x
Iron Mountain, Inc. IRM $18,369 $10,245 95.9% 8.9% 6.8% 9.9% 3.4% 34.0% 4.3x 4.2x 12.8x 12.1x 32.0x
NetApp, Inc. NTAP 15,200 16,942 77.9% 11.2% 151.7% 7.7% 3.3% 21.9% 2.5x 2.4x 11.2x 9.2x 16.2x
Dropbox DBX 8,418 8,978 50.3% (30.0%) NA 25.7% 21.9% NM 6.0x 5.0x NM 21.5x NM
Nutanix, Inc. NTNX 7,484 6,851 58.0% (23.4%) NA 26.7% 18.3% NM 6.0x 5.1x NM NM NM
Pure Storage, Inc. PSTG 5,596 5,342 74.9% 9.3% 63.9% 32.9% 34.8% NM 4.1x 3.1x NM 28.4x NM
Box, Inc. BOX 3,061 2,791 65.0% (5.8%) 54.8% 20.2% 18.3% NM 5.0x 4.3x NM NM NM
CommVault Systems, Inc. CVLT 2,687 2,980 89.4% 13.5% 58.0% 3.9% 8.7% 4.9% 3.8x 3.5x 76.0x 16.4x NM
Carbonite, Inc. CARB 1,380 857 57.2% (13.4%) 219.5% 23.8% 61.5% 17.9% 4.7x 2.9x 26.0x 10.0x 113.4x
Median $6,540 $6,096 69.9% 1.5% 60.9% 22.0% 18.3% 19.9% 4.5x 3.8x 19.4x 14.3x 32.0x
Large-Cap SaaS
Small-Cap SaaS
Data & Analytics
IT Operations
Data Storage
IT Security
Software Bellwethers
Communication
Enterprise
HCM
Marketing
PLM & Engineering
SCM & Logistics
Energy
Financial
HCIT
Enterprise Market % of 52 1- Year Stock 3- Year Stock Revenue Growth LTM EBITDA Enterprise Value / Price /
Company Ticker Value ($mm) Cap ($mm) Week High Performance Performance LTM NTM Margin LTM Rev. NTM Rev. LTM EBITDA NTM EBITDA Earnings
EdTech / Public Sector

Healthcare & Life Sciences
IndustrialsEnergy, Power & Infrastructure
Industrials
Harris Williams has a broad range of industry expertise, which create powerful opportunities. Our clients benefit form our deep-sectorexperience, integrated industry intelligence and collaboration across the firm, and our commitment to learning what makes them unique. Formore information, visit our website at www.harriswilliams.com/industries.
Aerospace, Defense & Government Services
Building Products & Materials
Business Services
Consumer Specialty Distribution
Technology, Media & Telecom
Transportation & Logistics
One International PlaceSuite 2620Boston, Massachusetts 02110Phone: +1 (617) 482-7501
1900 East 9th Street20th FloorCleveland, Ohio 44114Phone: +1 (216) 689-2400
222 South 9th StreetSuite 3350Minneapolis, Minnesota 55402Phone: +1 (612) 359-2700
1001 Haxall Point9th FloorRichmond, Virginia 23219Phone: +1 (804) 648-0072
575 Market Street31st FloorSan Francisco, California 94105Phone: +1 (415) 288-4260
800 17th St. NW2nd FloorWashington, D.C. 20006Phone: +1 (202) 207-2300
Bockenheimer Landstrasse 33-3560325 FrankfurtGermanyPhone: +49 069 3650638 00
63 Brook StreetLondon W1K 4HS, EnglandPhone: +44 (0) 20 7518 8900
SOFTWARE SECTOR REVIEW | 1Q 2019
T E C H N O L O G Y , M E D I A & T E L E C O M PAGE | 27
Technology, Media & Telecom

T E C H N O L O G Y , M E D I A & T E L E C O M PAGE | 28
SOFTWARE SECTOR REVIEW | 1Q 2019
The information and views contained in this report were prepared by Harris Williams LLC (“Harris Williams”). It is not a research report, as such term is defined by applicable law and regulations, and is provided for informational purposes only. It is not to be construed as an offer to buy or sell or a solicitation of an offer to buy or sell any securities or financial instruments or to participate in any particular trading strategy. The information contained herein is believed by Harris Williams to be reliable but Harris Williams makes no representation as to the accuracy or completeness of such information. Harris Williams and/or its affiliates may be market makers or specialists in, act as advisers or lenders to, have positions in and effect transactions in securities of companies mentioned herein and also may provide, may have provided, or may seek to provide investment banking services for those companies. In addition, Harris Williams and/or its affiliates or their respective officers, directors and employees may hold long or short positions in the securities, options thereon or other related financial products of companies discussed herein. Opinions, estimates and projections in this report constitute Harris Williams’ judgment and are subject to change without notice. The securities and financial instruments discussed in this report may not be suitable for all investors and investors must make their own investment decisions using their own independent advisors as they believe necessary and based upon their specific financial situations and investment objectives. Also, past performance is not necessarily indicative of future results. No part of this material may be copied or duplicated in any form or by any means, or redistributed, without Harris Williams’ prior written consent.
Harris Williams LLC is a registered broker-dealer and member of FINRA and SIPC. Harris Williams & Co. Ltd is a private limited company incorporated under English law with its registered office at 5th Floor, 6 St. Andrew Street, London EC4A 3AE, UK, registered with the Registrar of Companies for England and Wales (registration number 07078852). Harris Williams & Co. Ltd is authorized and regulated by the Financial Conduct Authority. Harris Williams & Co. Corporate Finance Advisors GmbH is registered in the commercial register of the local court of Frankfurt am Main, Germany, under HRB 107540. The registered address is Bockenheimer Landstrasse 33-35, 60325 Frankfurt am Main, Germany (email address: [email protected]). Geschäftsführer/Directors: Jeffery H. Perkins, Paul Poggi. (VAT No. awaited). Harris Williams is a trade name under which Harris Williams LLC, Harris Williams & Co. Ltd and Harris Williams & Co. Corporate Finance Advisors GmbH conduct business.
Copyright© 2019 Harris Williams, all rights reserved.
1. FactSet.
2. HW proprietary transaction information.
3. PitchBook.
4. PNC Capital Markets.
5. S&P LCD stats.


