23
Quarterly Statement January 1 to March 31, 2020 Dräger Group

Quarterly StatementJanuary 1 to March 31, 2020Dräger Group

THE DRÄGER GROUP OVER THE PAST FIVE YEARS
Three months
2020 2019 2018 2017 2016
Order intake € million 1,392.7 647.6 621.4 639.4 599.6
Net sales € million 640.0 601.6 495.6 535.0 532.4
Gross profit € million 283.2 254.3 205.1 240.4 223.4
Gross profit/Net sales % 44.2 42.3 41.4 44.9 42.0
EBITDA 1, 2 € million 29.8 18.9 –18.8 22.8 4.1
EBIT 2, 3 € million –0.6 –10.7 –39.8 2.3 –15.7
EBIT 2, 3/Net sales % –0.1 –1.8 –8.0 0.4 –2.9
Interest result € million –9.1 –4.0 –3.2 –3.2 –4.4
Income taxes € million 3.0 4.6 14.0 0.2 6.4
Net profit € million –6.7 –10.1 –29.0 –0.7 –13.6
Earnings per share on full distribution 4
per preferred share € –0.36 –0.57 –1.60 –0.04 –0.76
per common share € –0.38 –0.59 –1.62 –0.06 –0.78
DVA 5, 6, 7 € million –22.3 –0.6 28.6 68.4 –39.5
Equity 5, 8 € million 862.0 1,062.6 1,041.5 1,013.5 907.8
Equity ratio 5, 8 % 32.0 42.9 45.3 44.7 40.3
Capital employed 2, 8, 9, 10 € million 1,377.0 1,424.9 1,245.8 1,218.6 1,248.2
EBIT 3, 6/Capital employed 2, 8, 9, 10 (ROCE) 5 % 5.6 6.4 9.1 12.7 4.0
Net financial debt 2, 8 € million 358.7 136.6 12.4 18.0 153.3
Headcount as of March 31 14,900 14,603 13,866 13,352 13,679
1 EBITDA = earnings before net interest result, income taxes, depreciation and amortization2 For effects of the first-time application of IFRS 16 on the figures as of December 31, 2019, see table on page 37 of the Annual Report 2019.3 EBIT = earnings before net interest result and income taxes4 Based on an imputed actual full distribution of earnings attributable to shareholders 5 The first-time application of IFRS 16 in fiscal year 2019 impacts this key figure. Therefore, comparability is limited.6 Value of the last twelve months7 Dräger Value Added = EBIT less cost of capital of average invested capital8 Value as of reporting date9 Capital employed = total assets less deferred tax assets, securities, cash and cash equivalents, non-interest-bearing liabilities and other non-operating items10 Due to the redefinition of Capital employed in December 2019, the figures for 2019 have been adjusted.11 Including the payment obligation from the termination of the participation certificates

1FURTHER FINANCIAL INFORMATIONQUARTERLY STATEMENT
The Dräger Group in the first quarter of 2020
DRÄGER OFF TO AN EXCEPTIONAL START IN FISCAL YEAR 2020
− Order intake more than doubles– Net sales rose considerably– Earnings increase significantly year on year
“The corona pandemic is affecting the whole world. At Dräger, it has led to an extraordinary increase in orders for ventilators and respiratory protection masks. But demand for hospital consumables, patient moni-toring and anesthesia devices has also increased,” said Stefan Dräger, Chairman of the Executive Board of Drägerwerk Verwaltungs AG. “Our ‘Technology for Life’ has never been so sought after. It is now paying off that we have invested in a state-of-the-art factory in Lübeck and we have agreed flexible working hours and innovative labour organization models with the works council and trade unions. This allows us to quadruple the production volumes. We do as much as we can to fulfil our social respon-sibility to provide for society. We do our utmost to serve our country and people all over the world. It is with pride and humility that we face the importance of this task. Despite all our efforts and know-how the overall demand cannot be met. It is estimated that it is ten times the capabilities of the entire industry”.
Possible rounding differences in this quarterly statement may lead to slight discrepancies.
This Quarterly Report has been set up in German and English language. In case of any discrepancy between the German and English version, the German version shall prevail.
2 BUSINESS PERFORMANCE OF THE DRÄGER GROUP
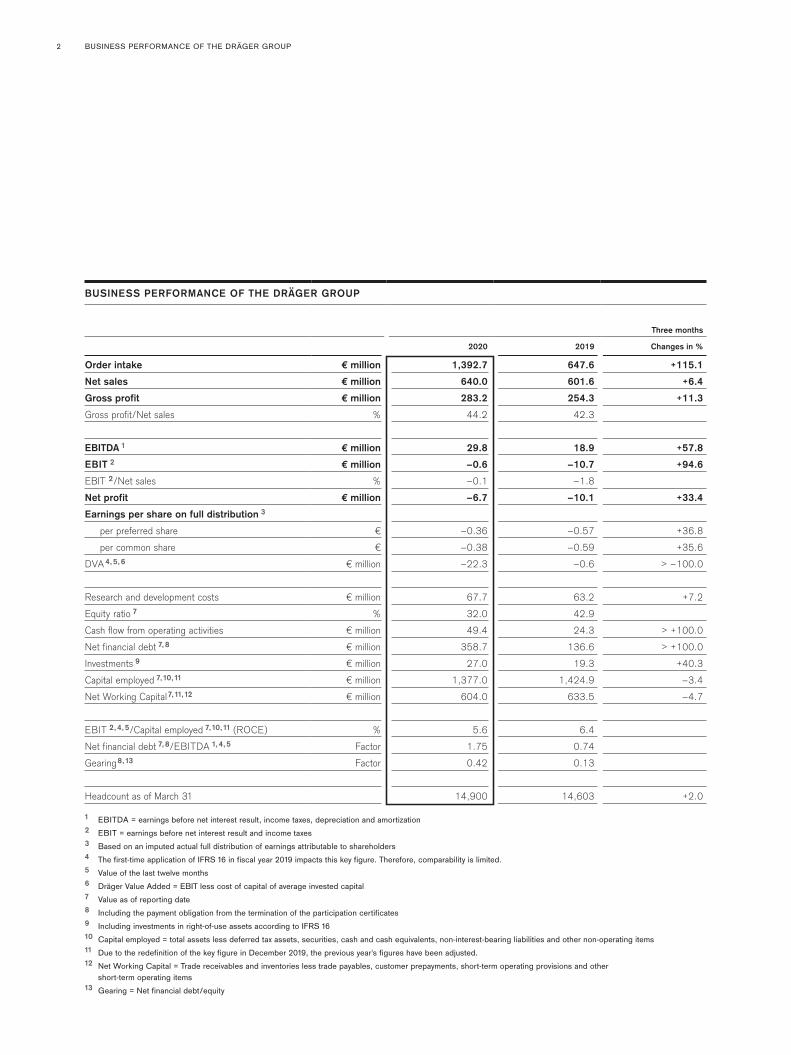
BUSINESS PERFORMANCE OF THE DRÄGER GROUP
Three months
2020 2019 Changes in %
Order intake € million 1,392.7 647.6 +115.1Net sales € million 640.0 601.6 +6.4Gross profit € million 283.2 254.3 +11.3Gross profit/Net sales % 44.2 42.3
EBITDA 1 € million 29.8 18.9 +57.8EBIT 2 € million –0.6 –10.7 +94.6EBIT 2/Net sales % –0.1 –1.8
Net profit € million –6.7 –10.1 +33.4Earnings per share on full distribution 3
per preferred share € –0.36 –0.57 +36.8
per common share € –0.38 –0.59 +35.6
DVA 4, 5, 6 € million –22.3 –0.6 > –100.0
Research and development costs € million 67.7 63.2 +7.2
Equity ratio 7 % 32.0 42.9
Cash flow from operating activities € million 49.4 24.3 > +100.0
Net financial debt 7, 8 € million 358.7 136.6 > +100.0
Investments 9 € million 27.0 19.3 +40.3
Capital employed 7, 10, 11 € million 1,377.0 1,424.9 –3.4
Net Working Capital 7, 11, 12 € million 604.0 633.5 –4.7
EBIT 2, 4, 5/Capital employed 7, 10, 11 (ROCE) % 5.6 6.4
Net financial debt 7, 8/EBITDA 1, 4, 5 Factor 1.75 0.74
Gearing 8, 13 Factor 0.42 0.13
Headcount as of March 31 14,900 14,603 +2.0
1 EBITDA = earnings before net interest result, income taxes, depreciation and amortization 2 EBIT = earnings before net interest result and income taxes3 Based on an imputed actual full distribution of earnings attributable to shareholders4 The first-time application of IFRS 16 in fiscal year 2019 impacts this key figure. Therefore, comparability is limited.5 Value of the last twelve months 6 Dräger Value Added = EBIT less cost of capital of average invested capital7 Value as of reporting date8 Including the payment obligation from the termination of the participation certificates9 Including investments in right-of-use assets according to IFRS 16
10 Capital employed = total assets less deferred tax assets, securities, cash and cash equivalents, non-interest-bearing liabilities and other non-operating items11 Due to the redefinition of the key figure in December 2019, the previous year's figures have been adjusted.12 Net Working Capital = Trade receivables and inventories less trade payables, customer prepayments, short-term operating provisions and other
short-term operating items13 Gearing = Net financial debt/equity

3FURTHER FINANCIAL INFORMATIONQUARTERLY STATEMENT
Business performance of the Dräger Group
ORDER INTAKE
ORDER INTAKE
Three months
in € million2020
2019 Changes
in %Net of currency
effects in %
Medical business 1,043.1 378.5 +175.5 +177.2
Safety business 349.6 269.0 +29.9 +31.6
Total 1,392.7 647.6 +115.1 +116.7thereof Europe 915.6 348.9 +162.4 +163.2
Germany 511.3 147.2 +247.2 +247.2
thereof Americas 189.7 121.8 +55.8 +58.3
thereof Africa, Asia, and Australia 287.4 176.9 +62.5 +65.2
Order intake (net of currency effects) rose by 116.7 percent in the first quarter. At the Group level, the Europe region made the most significant contribution to that growth. There were also large rises in the Africa, Asia, and Australia region, and in the Americas region.
At 177.2 percent, the greatest increase in orders (net of currency effects) was in the medical division segment. By far the strongest growth was in Europe, and Germany in particular, as a result of the German federal government’s major order for ventilators, among others. Demand also increased strongly in the Africa, Asia, and Australia region, and in the Americas region.
In the safety division, order intake increased by 31.6 percent (net of currency effects). The Europe region again accounted for the largest rise, while growth in the Africa, Asia, and Australia region, and in the Americas region, was lower.

4 BUSINESS PERFORMANCE OF THE DRÄGER GROUP
NET SALES
NET SALES
Three months
in € million2020
2019 Changes
in %Net of currency
effects in %
Medical business 395.6 368.4 +7.4 +8.0
Safety business 244.4 233.2 +4.8 +5.7
Total 640.0 601.6 +6.4 +7.1thereof Europe 362.7 326.7 +11.0 +11.4
Germany 140.8 122.4 +15.0 +15.0
thereof Americas 120.1 122.2 –1.7 –0.4
thereof Africa, Asia, and Australia 157.2 152.7 +2.9 +3.9
Net sales increased by 7.1 percent (net of currency effects) in the first quarter, and there-fore only reflected the strong growth in order intake to a limited extent. Net sales increased in both the medical and safety divisions. While deliveries in Europe and the Africa, Asia, and Australia region increased, there was a slight year-on-year decrease (net of currency effects) in the Americas region.
EARNINGS
In the first quarter of 2020, gross profit totaled EUR 283.2 million, a EUR 28.8 million increase compared to the same quarter in the prior year. At 44.2 percent, our gross mar-gin was up by 1.9 percentage points year on year (3 months 2019: 42.3 percent). Both stronger net sales and a higher gross margin led to the increase in gross profit. Currency effects thereby had a negative impact on both the gross margin and gross profit.
As a result of higher volumes and improved margins, we achieved a comparable increase in gross profit in both divisions. The safety division achieved the greatest rise in the gross margin, while net sales growth was higher in the medical division.
Dräger’s functional costs were up by 6.8 percent (net of currency effects) year on year (+6.6 percent in nominal terms) in the first quarter of 2020. Among other things, invest-ments in both research and development and sales, as well as wage and salary increases, contributed to that rise.
Sales and marketing costs were up 6.0 percent year on year, net of slight relief effects relat-ed to currency. The increase related to both divisions, with a greater rise in costs in the

5FURTHER FINANCIAL INFORMATIONQUARTERLY STATEMENT
safety division. In addition to investment in sales, logistics costs increased due to the high-er net sales volume and freight rates.
Net of the change in exchange rates, research and development (R&D) costs increased by 6.5 percent (+7.2 percent in nominal terms). A significant proportion of R&D costs are incurred in US dollars. Because the euro has lost value against the US dollar, the effect of the change in exchange rates was negative here, contrary to the effect on functional costs in total. The ratio of R&D costs to net sales (R&D ratio) was roughly on par with the prior year, at 10.6 percent (3 months 2019: 10.5 percent). Net of currency effects, our adminis-trative costs increased by 9.1 percent, primarily due to higher personnel costs and costs for IT projects.
The financial result declined by EUR 1.2 million to EUR –2.2 million (3 months 2019: EUR –1.0 million).
Despite higher functional costs, Dräger’s Group earnings before interest and taxes (EBIT) improved to EUR –0.6 million (3 months 2019: EUR –10.7 million) due to the higher net sales volume and improved gross margin. The EBIT margin improved from –1.8 percent and now stands at –0.1 percent. The interest result decreased by EUR 5.1 million to EUR –9.1 million (3 months 2019: EUR –4.0 million). The change in interest result was due to the interest effect of the termination of the series D participation certificates.
With regard to income from the current year, the tax rate in the first quarter of 2020 remained unchanged year on year at 32.5 percent. Due to aperiodic tax effects, the actual tax rate stood at 31.0 percent in the first quarter of 2020. Earnings after income taxes amounted to EUR –6.7 million (3 months 2019: EUR –10.1 million).
INVESTMENTS
In the first quarter of 2020, Dräger invested EUR 17.8 million in property, plant, and equip-ment (3 months 2019: 14.1 million), EUR 1.0 million in intangible assets (3 months 2019: EUR 1.0 million), and EUR 8.2 million due to capitalized right of use assets pursuant to IFRS 16 (3 months 2019: EUR 4.2 million). Total investment in the first three months of 2020 amounted to EUR 27.0 million (3 months 2019: EUR 19.3 million) and mainly related to replacement investments. Depreciation and amortization amounted to EUR 30.4 mil-lion in the first quarter of 2020 (3 months 2019: EUR 29.6 million). Investments covered 89 percent of depreciation and amortization, meaning that non-current assets saw a net decrease of EUR 3.4 million.
6 BUSINESS PERFORMANCE OF THE DRÄGER GROUP
EQUITY
Equity fell by EUR 214.3 million to EUR 862.0 million in the first three months of 2020. The equity ratio came to 32.0 percent as of March 31, 2020, which was significantly lower than the figure as of December 31, 2019 (41.9 percent). That change was primarily due to the termination of the series D participation certificates. The termination resulted in a total decrease in equity of EUR 191.1 million. Of that sum, EUR 21.0 million related to the former carrying value of the equity component of the terminated participation certifi-cates. The buyback value of the series D participation certificates is EUR 309.6 million. That sum is due in January 2023 and is recognized in the balance sheet at a discounted value of EUR 289.7 million. The difference between the discounted buyback value of EUR 289.7 million and the former carrying value of the debt components of the participation certificates from series D of EUR 19.2 million increased non-current liabilities by EUR 270.5 million. A net interest effect from the termination of the series D participation cer-tificates and the related taxes of EUR 3.5 million was recognized in the income statement.
Additionaly, an actuarial loss resulted in an increase in pension provisions after tax effects of EUR 19.0 million and reduced retained earnings recognized directly in equity.
DRÄGER VALUE ADDED
Dräger Value Added (DVA) decreased by EUR 21.6 million to EUR –22.3 million year on year in the 12 months to March 31, 2020 (12 months to March 31, 2019: EUR –0.6 million). Rolling EBIT fell year on year by EUR 15.1 million. Capital costs rose by EUR 6.6 million, since average capital employed increased by 7.1 percent to EUR 1,413.4 million. That was primarily due to the initial application of IFRS 16 in 2019, as the right-of-use assets in average capital employed in the prior year were only included on a pro-rata basis for three months. Average current assets saw a somewhat greater increase than net sales. As a result, days working capital (coverage of current assets) rose by one day to 107.1 days. The calculation of days working capital was adjusted at the end of 2019, primarily to fully reflect contract liabilities pursuant to IFRS 15. The prior year’s figures were amended accordingly to allow the comparable presentation of the development of this key figure.

8 BUSINESS PERFORMANCE OF THE MEDICAL DIVISION
BUSINESS PERFORMANCE OF THE MEDICAL DIVISION
Three months
2020
2019 Changes in %
Net of currency effects in %
Order intake with third parties € million 1,043.1 378.5 +175.5 > +100.0
thereof Germany € million 411.7 79.1 +420.8 > +100.0Net sales with third parties € million 395.6 368.4 +7.4 +8.0
thereof Germany € million 81.6 74.6 +9.4 +9.4
EBITDA 1 € million 8.8 –1.5 > +100.0EBIT 2 € million –6.9 –17.2 +60.2EBIT 2/Net sales % –1.7 –4.7
Capital employed 3, 4 € million 801.5 845.7 –5.2
EBIT 2, 5, 6/Capital employed 3, 4 (ROCE) % 2.9 3.1
DVA 5, 6, 7 € million –34.4 –28.1 –22.5
1 EBITDA = earnings before net interest result, income taxes, depreciation and amortization2 EBIT = earnings before net interest result and income taxes3 Capital employed = total assets less deferred tax assets, securities, cash and cash equivalents, non-interest-bearing liabilities and other non-operating items4 Value as of reporting date5 The first-time application of IFRS 16 in fiscal year 2019 impacts this key figure. Therefore, comparability is limited. 6 Value of the last twelve months7 Dräger Value Added = EBIT less cost of capital of average invested capital

9FURTHER FINANCIAL INFORMATIONQUARTERLY STATEMENT
Business performance of the medical division ORDER INTAKE
ORDER INTAKE
Three months
in € million2020
2019 Changes
in %Net of currency
effects in %
Europe 678.0 187.3 +262.0 +262.4
thereof Germany 411.7 79.1 +420.8 +420.8
Americas 143.0 75.8 +88.6 +91.8
Africa, Asia, and Australia 222.1 115.4 +92.4 +95.0
Total 1,043.1 378.5 +175.5 +177.2
There was an extraordinary increase in order intake of 177.2 percent (net of currency effects) in the medical division in the first quarter.
Demand for ventilators rose exponentially year-on-year, and order intake in the accessories business, patient monitoring, and data management more than doubled. A significant rise was also recorded for anesthesia devices. There were double-digit increases in orders in the service and hospital infrastructure businesses. In the first quarter, only orders for thermo-regulation equipment decreased.
In Europe, order intake more than tripled in the first three months of the year, with a 262.4 percent rise (net of currency effects). Orders in Germany, including the German federal government’s major order for ventilators, made the largest contribution to that growth. However, demand also almost doubled in the Africa, Asia, and Australia region, with an increase of 95.0 percent (net of currency effects). Order intake in the Americas region also increased almost twofold, by 91.8 percent (net of currency effects).
In absolute terms, the growth in demand in the first quarter was greatest in Germany, the United Kingdom, China, and the U.S. Meanwhile, orders decreased year on year in Japan, Thailand, the Czech Republic, and the Philippines.

10 BUSINESS PERFORMANCE OF THE MEDICAL DIVISION
NET SALES
NET SALES
Three months
in € million2020
2019 Changes
in %Net of currency
effects in %
Europe 205.1 183.2 +12.0 +12.2
thereof Germany 81.6 74.6 +9.4 +9.4
Americas 78.0 81.8 –4.7 –3.1
Africa, Asia, and Australia 112.5 103.4 +8.9 +9.3
Total 395.6 368.4 +7.4 +8.0
Net sales increased by 8.0 percent (net of currency effects) in the medical division in the first quarter. The Europe region and the Africa, Asia, and Australia region both contribut-ed to that development, while deliveries in the Americas region decreased.
EARNINGS
Thanks to a rise in net sales volume and a higher gross margin, gross profit in the medical division improved by 9.6 percent in the first quarter of 2020. An improved product mix resulted in a 0.8 percentage-point rise in the gross margin.
Functional costs were up 2.1 percent (net of currency effects) year on year (2.1 percent in nominal terms) in the first quarter of 2020. The main drivers of this development were significantly higher research and development costs, and higher cross-division costs.
EBIT for the medical division stood at EUR –6.9 million in the first quarter of 2020, improving year on year (3 months 2019: EUR –17.2 million). The EBIT margin rose from –4.7 percent to –1.7 percent.
In the medical division, Dräger Value Added fell by EUR 6.3 million year on year to EUR –34.4 million as of March 31, 2020 (12 months to March 31, 2019: EUR –28.1 million). Dräger’s rolling EBIT saw a year-on-year decrease of EUR 2.8 million, whereas capital costs rose by EUR 3.5 million.
12 BUSINESS PERFORMANCE OF THE SAFETY DIVISION
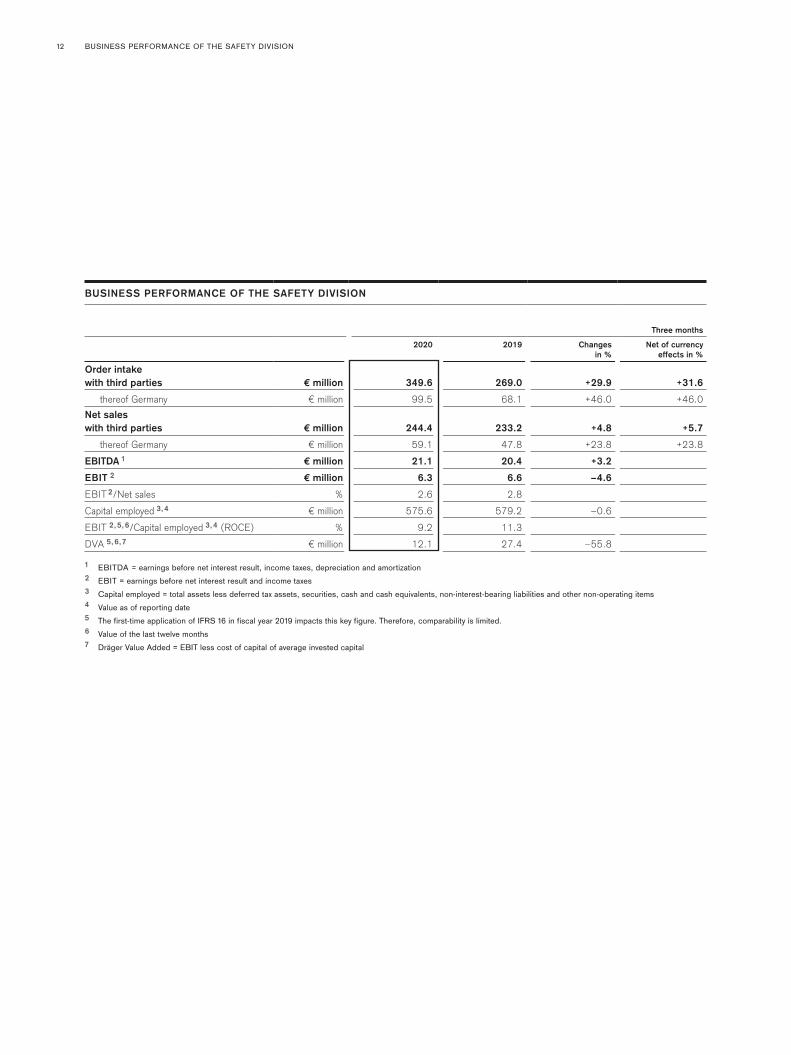
BUSINESS PERFORMANCE OF THE SAFETY DIVISION
Three months
2020
2019 Changes in %
Net of currency effects in %
Order intake with third parties € million 349.6 269.0 +29.9 +31.6
thereof Germany € million 99.5 68.1 +46.0 +46.0Net sales with third parties € million 244.4 233.2 +4.8 +5.7
thereof Germany € million 59.1 47.8 +23.8 +23.8
EBITDA 1 € million 21.1 20.4 +3.2EBIT 2 € million 6.3 6.6 –4.6EBIT 2/Net sales % 2.6 2.8
Capital employed 3, 4 € million 575.6 579.2 –0.6
EBIT 2, 5, 6/Capital employed 3, 4 (ROCE) % 9.2 11.3
DVA 5, 6, 7 € million 12.1 27.4 –55.8
1 EBITDA = earnings before net interest result, income taxes, depreciation and amortization2 EBIT = earnings before net interest result and income taxes3 Capital employed = total assets less deferred tax assets, securities, cash and cash equivalents, non-interest-bearing liabilities and other non-operating items4 Value as of reporting date5 The first-time application of IFRS 16 in fiscal year 2019 impacts this key figure. Therefore, comparability is limited. 6 Value of the last twelve months7 Dräger Value Added = EBIT less cost of capital of average invested capital

13FURTHER FINANCIAL INFORMATIONQUARTERLY STATEMENT
Business performance of the safety division
ORDER INTAKE
ORDER INTAKE
Three months
in € million2020
2019 Changes
in %Net of currency
effects in %
Europe 237.6 161.6 +47.0 +48.2
thereof Germany 99.5 68.1 +46.0 +46.0
Americas 46.7 46.0 +1.5 +2.9
Africa, Asia, and Australia 65.3 61.5 +6.2 +9.3
Total 349.6 269.0 +29.9 +31.6
Order intake in the safety division rose by 31.6 percent (net of currency effects) in the first quarter.
Demand for light respiratory protection jumped, with orders for safety accessories almost tripling. The service business also grew significantly, and there were rises in the gas detec-tion and alcohol detection businesses. By contrast, there was a significant decrease in the engineered solutions business. Demand for respiratory and personal protection products declined slightly year on year.
In Europe, order intake increased significantly in the first three months of the year, with a 48.2 percent rise (net of currency effects). In the Africa, Asia, and Australia region, orders were 9.3 percent higher (net of currency effects), while order intake in the Americas region grew by 2.9 percent (net of currency effects).
Increased demand in Germany, Sweden, South Africa, Turkey, and France was offset by decreases in Taiwan, Saudi Arabia, the U.S., and New Zealand.

14 BUSINESS PERFORMANCE OF THE SAFETY DIVISION | OUTLOOK
NET SALES
NET SALES
Three months
in € million2020
2019 Changes
in %Net of currency
effects in %
Europe 157.6 143.5 +9.8 +10.3
thereof Germany 59.1 47.8 +23.8 +23.8
Americas 42.1 40.4 +4.4 +5.0
Africa, Asia, and Australia 44.7 49.3 –9.4 –7.2
Total 244.4 233.2 +4.8 +5.7
Net sales in the safety division increased by 5.7 percent (net of currency effects) in the first three months of the year. Deliveries rose in Europe and the Americas region, whereas they fell in the Africa, Asia, and Australia region.
EARNINGS
Gross profit in the safety division increased by 13.9 percent in the first quarter due to a rise in net sales volume and a substantial improvement in the gross margin. The gross margin improved by 3.8 percentage points due to a positive product mix.
Functional costs were up 15.2 percent (net of currency effects) year on year (14.7 percent in nominal terms) in the first quarter of 2020. The main drivers of this development were higher research and development costs, increased marketing costs, and a rise in cross- division costs (particularly sales expenses).
EBIT in the safety division stood at EUR 6.3 million in the first quarter of 2020, and was down slightly year on year (3 months 2019: EUR 6.6 million). The EBIT margin decreased slightly to 2.6 percent (3 months 2019: 2.8 percent).
In the safety division, Dräger Value Added fell by EUR 15.3 million to EUR 12.1 million in the 12 months to March 31, 2020 (12 months to March 31, 2019: EUR 27.4 million). Dräger’s rolling EBIT saw a year-on-year decrease of EUR 12.3 million, whereas capital costs increased by EUR 3.1 million to EUR 41.0 million.
15FURTHER FINANCIAL INFORMATIONQUARTERLY STATEMENT
Outlook
FUTURE SITUATION OF THE COMPANY
The following section should be read in conjunction with the “Outlook” section in the management report of the 2019 annual report (pages 60 et seq.), which describes our expectations for 2020 in detail. The forecast horizon generally covers one fiscal year.
Due to the very dynamic development of order intake as a result of the COVID-19 pandem-ic, Dräger has very good opportunities to significantly exceed planned net sales and earn-ings.
Dräger has therefore withdrawn its previous forecast for the fiscal year (net sales growth of between 1.0 and 4.0 percent net of currency effects and an EBIT margin of between 1.0 and 4.0 percent). However, as the further development of business is subject to exceptional uncertainty, and there are risks to net sales realization, particularly due to international supply chains, the forecast for the fiscal year cannot be determined with sufficient accura-cy at present.
The current development of business also affects the predictability of the other forecast figures, with the result that we can only make one prediction regarding trends at this time:
We predict that the gross margin will exceed the previous forecast on trend, because we expect a beneficial product mix as a result of a higher proportion of device business.
The termination of the D participation certificates caused discounting effects which will lead to higher interest expenses in the next years. The termination will also result in high-er net financial liabilities because, pursuant to IFRS, the repayment of EUR 309.6 million to be made in January 2023 must be reported as a liability at present (please refer to p. 19).
To be able to meet the increased demand for Dräger’s products resulting from the COVID-19 pandemic as quickly as possible, we will make investments in expanding production capacities that are not included in the original investment forecast.
We assume that working capital will increase during the year due to higher inventories and receivables.
We will provide more specific forecasts for fiscal year 2020 when we publish our half-year results for 2020.

16 FURTHER FINANCIAL INFORMATION
Further financial information
CONSOLIDATED INCOME STATEMENT OF THE DRÄGER GROUP
in € thousand Three months 2020 Three months 2019
Net sales 639,986 601,628
Cost of sales –356,816 –347,284
Gross profit 283,170 254,344
Research and development costs –67,734 –63,189
Marketing and selling expenses –159,855 –151,186
General administrative costs –53,878 –49,545Impairment losses/gains from the reversal of impairment on financial and contract assets –531 12
Other operating income 691 636
Other operating expenses –234 –740
–281,541 –264,0121,629 –9,668
Loss on net monetary position –403 -187
Profit from other investments 3 –
Other financial result –1,804 –801
Financial result (before interest result) –2,204 –988
EBIT –576 –10,656Interest result –9,143 –4,045
Earnings before income taxes –9,719 –14,700Income taxes 3,013 4,633
Earnings after income taxes –6,706 –10,068
Earnings after income taxes –6,706 –10,068Earnings to non-controlling interests –62 315
Earnings attributable to shareholders and holders of participation certificates 1 –6,644 –10,383
Undiluted/diluted earnings per share on full distribution 2
per preferred share (in €) –0.36 –0.57
per common share (in €) –0.38 –0.59
1 The holders of the participation certificates do not participate in the negative earnings after income taxes.2 The dividend premium of EUR 0.06 on preferred shares is recognized pro rata on a quarterly basis.
17FURTHER FINANCIAL INFORMATIONQUARTERLY STATEMENT
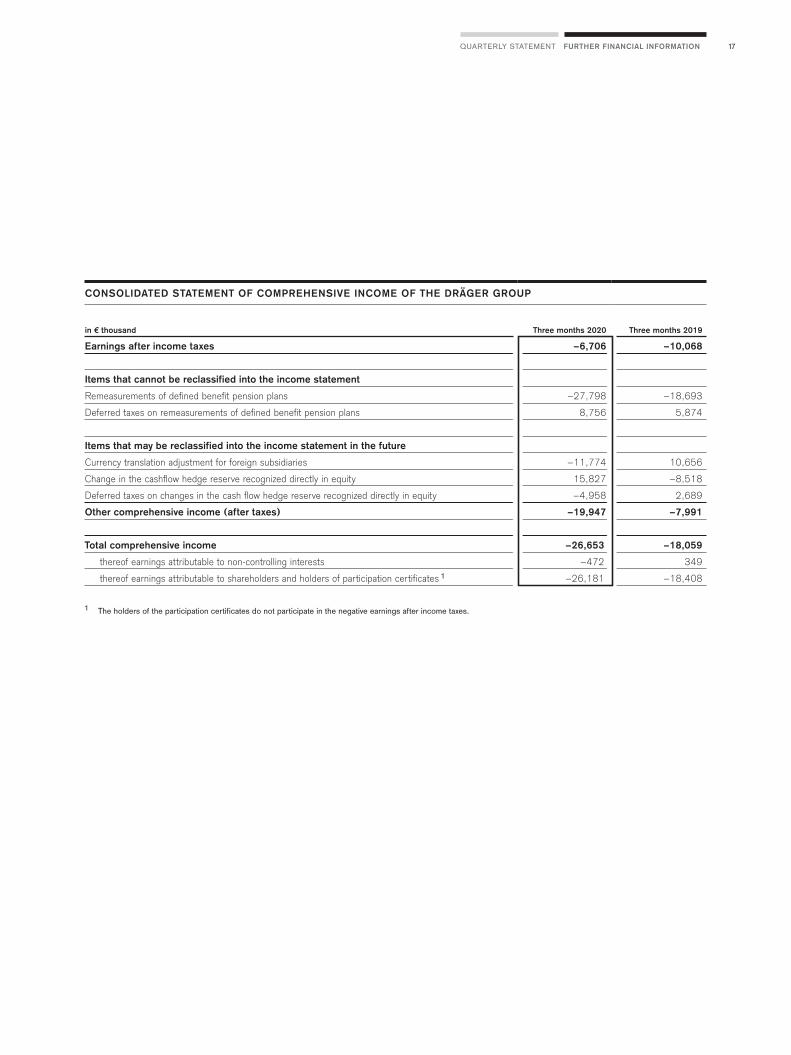
CONSOLIDATED STATEMENT OF COMPREHENSIVE INCOME OF THE DRÄGER GROUP
in € thousand Three months 2020 Three months 2019
Earnings after income taxes –6,706 –10,068
Items that cannot be reclassified into the income statementRemeasurements of defined benefit pension plans –27,798 –18,693
Deferred taxes on remeasurements of defined benefit pension plans 8,756 5,874
Items that may be reclassified into the income statement in the futureCurrency translation adjustment for foreign subsidiaries –11,774 10,656
Change in the cashflow hedge reserve recognized directly in equity 15,827 –8,518
Deferred taxes on changes in the cash flow hedge reserve recognized directly in equity –4,958 2,689
Other comprehensive income (after taxes) –19,947 –7,991
Total comprehensive income –26,653 –18,059 thereof earnings attributable to non-controlling interests –472 349
thereof earnings attributable to shareholders and holders of participation certificates 1 –26,181 –18,408
1 The holders of the participation certificates do not participate in the negative earnings after income taxes.

18 FURTHER FINANCIAL INFORMATION
CONSOLIDATED BALANCE SHEET OF THE DRÄGER GROUP
in € thousand March 31, 2020 December 31, 2019
Assets
Intangible assets 333,351 333,985
Property, plant and equipment 412,466 416,520
Right-of-use assets 106,189 109,734
Investments in associates 7,119 2,475
Non-current trade receivables 1,541 1,499
Other non-current financial assets 13,636 15,501
Deferred tax assets 265,883 177,808
Other non-current assets 3,896 3,910
Non-current assets 1,144,080 1,061,433
Inventories 532,819 485,158
Trade receivables and contract assets 633,262 710,696
Other current financial assets 47,040 28,669
Cash and cash equivalents 216,073 196,314
Current income tax refund claims 30,398 29,436
Other current assets 86,352 59,204
Current assets 1,545,944 1,509,478
Total assets 2,690,024 2,570,910

19FURTHER FINANCIAL INFORMATIONQUARTERLY STATEMENT
in € thousand March 31, 2020 December 31, 2019
Equity and liabilities
Capital stock 45,466 45,466
Capital reserves 234,028 234,028
Reserves retained from earnings, incl. group result 586,787 779,162
Participation capital 8,531 29,497
Other comprehensive income –13,845 –13,350
Non-controlling interests 1,081 1,556
Equity 862,047 1,076,359
Liabilities from participation certificates 7,046 25,988
Provisions for pensions and similar obligations 419,329 390,939
Other non-current provisions 59,147 59,388
Non-current interest-bearing loans and liabilities to banks 111,995 118,569
Other non-current financial liabilities 384,402 98,074
Non-current income tax liabilities 19,230 19,267
Deferred tax liabilities 3,194 3,327
Other non-current liabilities 32,397 32,410
Non-current liabilities 1,036,740 747,962
Other current provisions 190,613 215,120
Current interest-bearing loans and liabilities to banks 59,872 51,009
Trade payables 207,472 205,106
Other current financial liabilities 72,959 70,660
Current income tax liabilities 28,043 22,860
Other current liabilities 232,278 181,833
Current liabilities 791,237 746,589
Total equity and liabilities 2,690,024 2,570,910

20 FURTHER FINANCIAL INFORMATION
CONSOLIDATED CASH FLOW STATEMENT OF THE DRÄGER GROUP
in € thousand Three months 2020 Three months 2019
Operating activitiesEarnings after income taxes –6,706 –10,068
+ Write-down of non-current assets 30,464 29,574
+ Interest result 9,143 4,045
– Income taxes –3,013 –4,633
– Decrease in provisions –23,424 –20,081
+/– Other non-cash expenses/income 18,286 –4,067
+/– Losses/gains from the disposal of non-current assets –113 443
– Increase in inventories –58,639 –42,767
– Increase in leased equipment –3,565 –2,676
+ Decrease in trade receivables 59,694 82,080
– Increase in other assets –27,794 –23,005
+/– Increase/decrease in trade payables 5,436 –19,997
+ Increase in other liabilities 62,492 34,773
+ Dividends received 3 –
+/– Reimbursement of/cash outflow for income taxes –4,684 3,192
– Cash outflow for interests –8,661 –3,177
+ Cash inflow from interests 468 675
Cash inflow from operating activities 49,389 24,309
Investing activities– Cash outflow for investments in intangible assets –969 –1,643
– Cash outflow for investments in property, plant and equipment –16,071 –13,331
+ Cash inflow from disposals of property, plant and equipment 334 1,339
– Cash outflow for investments in non-current financial assets –1,529 –5
– Cash outflow from the acquisition of subsidiaries – –500
Cash outflow from investing activities –18,235 –14,139
Financing activities+ Cash provided by raising loans 1,077 6,326
– Cash used to redeem loans –6,471 –3,469
+/– Net balance of other liabilities to banks 9,229 –30,702
– Repayment of lease liabilities –8,848 –6,568
Cash outflow from financing activities –5,012 –34,413
Change in cash and cash equivalents in the reporting period 26,141 –24,243+/– Effect of exchange rates on cash and cash equivalents –6,382 3,278
+ Cash and cash equivalents at the beginning of the reporting period 196,314 179,561
Cash and cash equivalents on reporting date 216,073 158,595

21FURTHER FINANCIAL INFORMATIONQUARTERLY STATEMENT
BUSINESS PERFORMANCE OF THE DIVISIONS
Three months
Dräger Medical division Dräger Safety division Dräger Group
2020 2019 2020 2019 2020 2019
Order intake with third parties € million 1,043.1 378.5 349.6 269.0 1,392.7 647.6Net sales with third parties € million 395.6 368.4 244.4 233.2 640.0 601.6
EBITDA 1 € million 8.8 –1.5 21.1 20.4 29.8 18.9Depreciation/Amortization € million –15.6 –15.7 –14.8 –13.8 –30.4 –29.6
EBIT 2 € million –6.9 –17.2 6.3 6.6 –0.6 –10.7
Capital employed 3, 4 € million 801.5 845.7 575.6 579.2 1,377.0 1,424.9
EBIT 2/Net sales % –1.7 –4.7 2.6 2.8 –0.1 –1.8
EBIT 2, 5, 6/Capital employed 3, 4 (ROCE) % 2.9 3.1 9.2 11.3 5.6 6.4
DVA 5, 6, 7 € million –34.4 –28.1 12.1 27.4 –22.3 –0.6
1 EBITDA = earnings before net interest result, income taxes, depreciation and amortization2 EBIT = earnings before net interest result and income taxes3 Capital employed = total assets less deferred tax assets, securities, cash and cash equivalents, non-interest bearing liabilities and other non-operative items4 Value as of reporting date5 The first-time application of IFRS 16 in fiscal year 2019 impacts this key figure. Therefore, comparability is limited.6 Value of the last twelve months7 Dräger Value Added = EBIT less cost of capital of average invested capital

22 FURTHER FINANCIAL INFORMATION
FINANCIAL CALENDAR
Report as of June 30, 2020, Conference call August 13, 2020
Virtual annual shareholders’ meeting, Lübeck, Germany September 30, 2020
Report as of September 30, 2020, Conference call October 29, 2020
FORWARD-LOOKING STATEMENTS
This document contains forward-looking statements. The statements are based on the current expectations, presumptions, and forecasts of the Executive Board of Drägerwerk Verwaltungs AG, as well as the information available to it to date. The forward-looking statements do not provide any guarantee of the future developments and results contained therein. Rather, the future developments and results are dependent on a number of fac-tors; they entail various risks and uncertainties and are based on assumptions that could prove to be incorrect. Dräger does not assume any responsibility for updating the for-ward-looking statements made in this report.
This document constitutes a quarterly statement pursuant to Section 51a of the exchange rules for the Frankfurt Stock Exchange.
Lübeck, April 29, 2020
The general partnerDrägerwerk Verwaltungs AGrepresented by its Executive Board
Stefan DrägerRainer KlugGert-Hartwig LescowDr. Reiner PiskeAnton Schrofner

Drägerwerk AG & Co. KGaAMoislinger Allee 53 – 5523558 Lübeck, Germanywww.draeger.com
CommunicationsTel. + 49 451 882 - 3202Fax + 49 451 882 - 3944
Investor RelationsTel. + 49 451 882 - 2685Fax + 49 451 882 - 3296


