19
Greater Peoria EDC Quarterly Economic Update | Q3 2016 1 Quarterly Update 2016 greaterpeoriaedc.org • (309) 495-5910

GreaterPeoriaEDC QuarterlyEconomicUpdate|Q32016 1
QuarterlyUpdate2016greaterpeoriaedc.org•(309)495-5910

GreaterPeoriaEDC QuarterlyEconomicUpdate|Q32016 2
GPEDCPerformance|Expansion/RetentionProjectsasofSeptember2016
Quarter Company Description City County NewJobs RetainedQ1: Crank'sIndustrialCoating ExpansionofIndustrialCompany Pekin Tazewell 2 5 Lonza ExpansionofProcessingCompany Mapleton Peoria 0 0Q2: JustcorePropertiesLLC Expansion Minonk Woodford 3 2 Grosenbach'sGroceryLLC Expansion Minonk Woodford 9 0 MinonkBowl Expansion Minonk Woodford 0 1Total 14 8
126
400
1000
0 500 1000 1500
Created
2016Target
2019Goal
JobsCreated
18
10
25
0 10 20 30
Completed
2016Target
2019Goal
ProjectsCompleted
10 10 10 1310 12
24
0
10
20
30
Q1 Q2 Q3 Q4
ActiveProjects
2015 2016
1 1 2 30
2 11 14
1 03 21 2
57
14 4
02468
ProjectsActiveBySector
Q1 Q2 Q3 Q4
1 0
52 2
0 0
9
03
0 0
15
63
0246810121416
Logan Mason Peoria Tazewell Woodford
ProjectsActiveByCounty
Q1 Q2 Q3 Q4

GreaterPeoriaEDC QuarterlyEconomicUpdate|Q32016 3
GPEDCPerformance|BusinessRetentionVisitsasofSeptember2016
159
200
500
0 100 200 300 400 500 600
Completed
2016Target
2019Goal
BusinessRetentionVisits
1 7
78
472635 35
200
150
80
0
50
100
150
200
250
Logan Mason Peoria Tazewell Woodford
BRV'sByCounty
TotalAchieved 2019Goal
6 8
24
88
416 13
0
20
40
60
80
100
TotalBRV'sBySector

GreaterPeoriaEDC QuarterlyEconomicUpdate|Q32016 4
GPEDCPerformance|BusinessRetentionVisitsasofSeptember2016
CompaniesVisited
HawkEnergySolutions GraingerIndustrialSupply
CarterPaper&PackagingInc. Illco,Inc.
NationalCenterforAgriculturalUtilizationResearch GeorgeJRothanCo.
WinpakHeatSealCorporation HGS
BradleyUniversity HumanServiceCenter
CEFCU Children'sHomeAssociationofIllinois
EncompassGrain&RailCo-op KrumholzTrucking
CESMaterialHandling COREConstruction

GreaterPeoriaEDC QuarterlyEconomicUpdate|Q32016 5
GPEDCPerformance|EconomicGardeningasofSeptember2016
4
10
25
0 5 10 15 20 25 30
Joined
2016Target
2019Goal
EconomicGardening
Quarter Company CompanyDescription
Q1: KempManufacturing PercisionMetalMachining
ITC,Inc. CustomMetalMachining
CalihanPorkProcessing FoodProcessing
Q2: OneFire MarketingConsultant
GreaterPeoriaEDC QuarterlyEconomicUpdate|Q32016 6
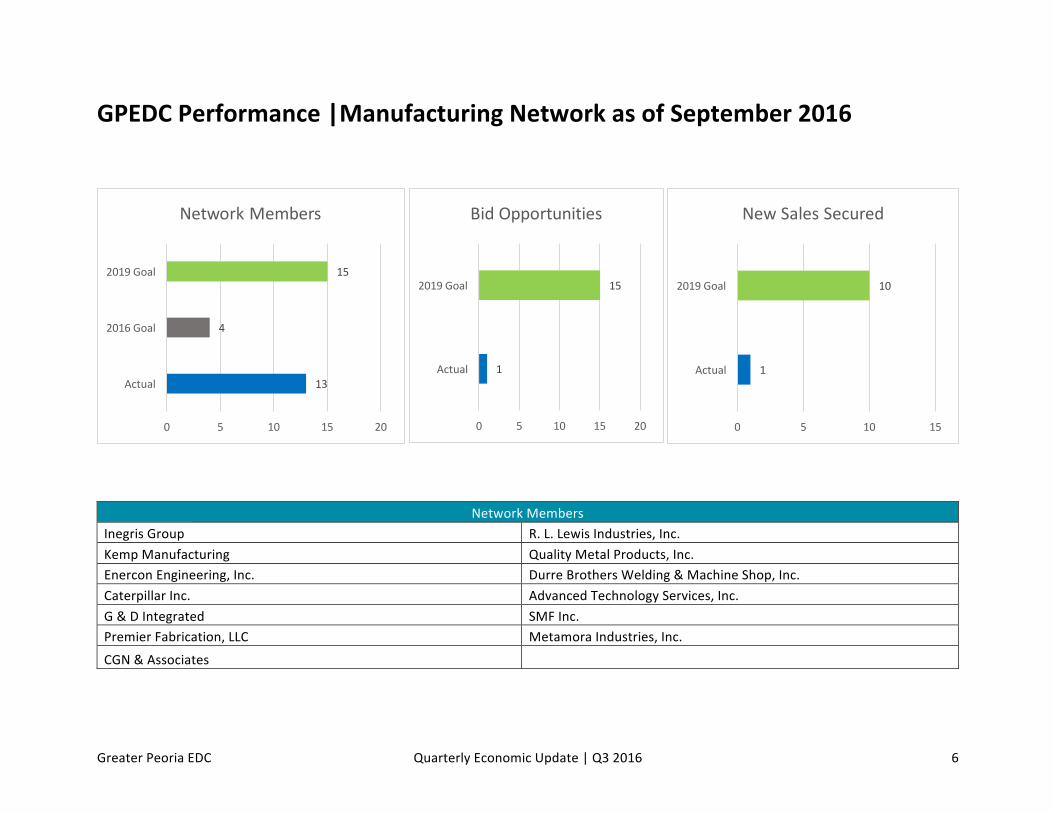
GPEDCPerformance|ManufacturingNetworkasofSeptember2016
NetworkMembersInegrisGroup R.L.LewisIndustries,Inc.KempManufacturing QualityMetalProducts,Inc.EnerconEngineering,Inc. DurreBrothersWelding&MachineShop,Inc.CaterpillarInc. AdvancedTechnologyServices,Inc.G&DIntegrated SMFInc.PremierFabrication,LLC MetamoraIndustries,Inc.CGN&Associates
13
4
15
0 5 10 15 20
Actual
2016Goal
2019Goal
NetworkMembers
1
15
0 5 10 15 20
Actual
2019Goal
BidOpportunities
1
10
0 5 10 15
Actual
2019Goal
NewSalesSecured

GreaterPeoriaEDC QuarterlyEconomicUpdate|Q32016 7
GPEDCPerformance|AttractionProjectsasofSeptember2016
63
300
750
0 100 200 300 400 500 600 700 800
Created
2016Target
2019Goal
JobsCreated
3
4
10
0 2 4 6 8 10 12
Completed
2016Target
2019Goal
ProjectsCompleted
22
19
20
17.5
18
18.5
19
19.5
20
20.5
21
21.5
22
22.5
Q1 Q2 Q3 Q4
ActiveProjects
6
1 1
32
9
32
1
6
2
5
3 3
1
5
1
7
012345678910
ProjectsActiveBySector
Q1 Q2 Q3 Q4

GreaterPeoriaEDC QuarterlyEconomicUpdate|Q32016 8
GPEDCPerformance|StartupPeoriaProjectsasofSeptember2016
17
12
30
0 20 40
Launched
2016Target
2019Goal
BusinessesLaunched
$0
$10,000
$20,000
$30,000
$40,000
DollarsInvestedThroughKeyStart
0
500
1000
1500
2000
2500
1MillionCupsAttendees
21
60
150
0 50 100 150 200
Created
2016Target
2019Goal
JobsCreated
0
2
4
6
8
10
12
14
Jan-15
Feb-15
Mar-15
Apr-15
May-15
Jun-15
Jul-1
5
Aug-15
Sep-15
Oct-15
Nov-15
Dec-15
Jan-16
Feb-16
Mar-16
Apr-16
May-16
Jun-16
Jul-1
6
Aug-16
Sep-16
NestMembership
DayPass FullTime Evenings/Weekends Office 0
20
40
60
80
100
120
1-Jan 1-Feb 1-Mar 1-Apr 1-May 1-Jun 1-Jul 1-Aug 1-Sep
1MillionCupsAttendance
GreaterPeoriaEDC QuarterlyEconomicUpdate|Q32016 9
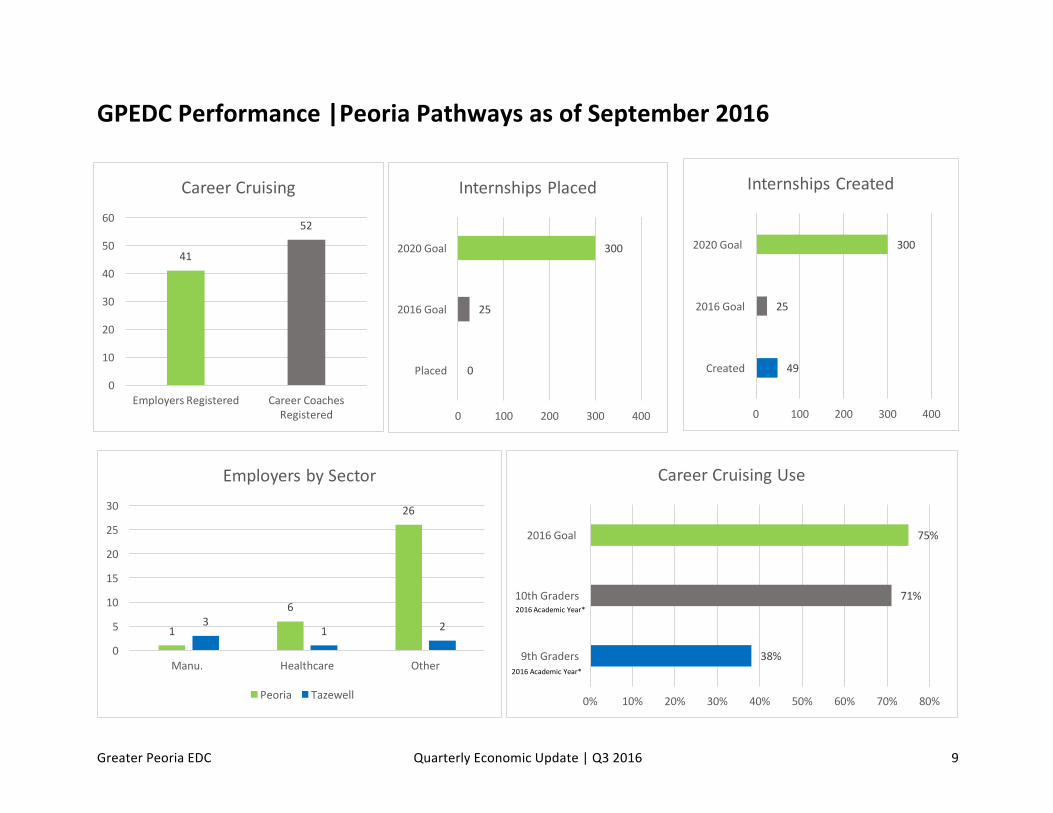
GPEDCPerformance|PeoriaPathwaysasofSeptember2016
0
25
300
0 100 200 300 400
Placed
2016Goal
2020Goal
InternshipsPlaced
41
52
0
10
20
30
40
50
60
EmployersRegistered CareerCoachesRegistered
CareerCruising
49
25
300
0 100 200 300 400
Created
2016Goal
2020Goal
InternshipsCreated
1
6
26
31 2
0
5
10
15
20
25
30
Manu. Healthcare Other
EmployersbySector
Peoria Tazewell
38%
71%
75%
0% 10% 20% 30% 40% 50% 60% 70% 80%
9thGraders
10thGraders
2016Goal
CareerCruisingUse
2016AcademicYear*
2016AcademicYear*

GreaterPeoriaEDC QuarterlyEconomicUpdate|Q32016 10
GPEDCPerformance|MakeYourselfGPasofSeptember2016
668
1267
0
200
400
600
800
1000
1200
1400
Q1 Q2
2016LiveGP.org(users)
93
231
70
150
0
50
100
150
200
250
Peoria Tazewell Woodford Mason Logan
AttendancebyCounty
690
1600
4000
0 1000 2000 3000 4000 5000
TotalAttended
2016Target
2019Goal
ManufacturingExpoStudentAttendance
29
60
150
0 20 40 60 80 100 120 140 160
TotalAttended
2016Target
2019Goal
ManufacturingExpoEducatorAttendance
6
20
50
0 10 20 30 40 50 60
TotalApprentices
2016Goal
2019Goal
SecureSoftwareApprenticeshipProgram
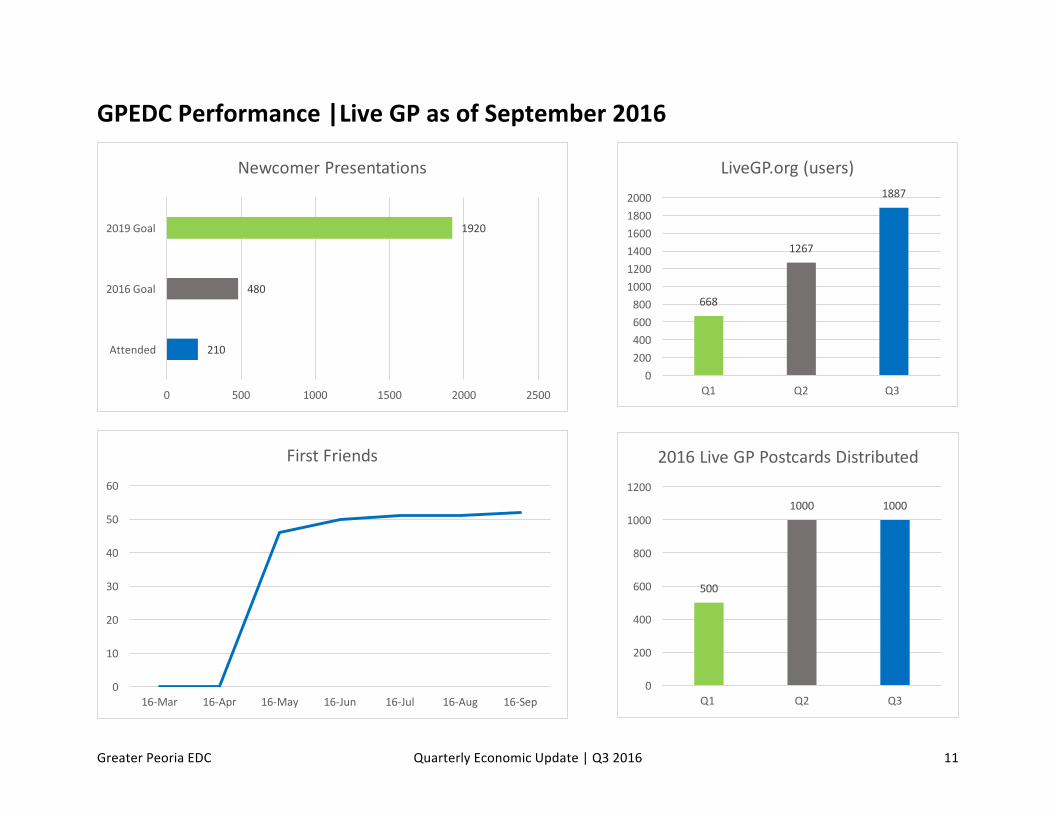
GreaterPeoriaEDC QuarterlyEconomicUpdate|Q32016 11
GPEDCPerformance|LiveGPasofSeptember2016
210
480
1920
0 500 1000 1500 2000 2500
Attended
2016Goal
2019Goal
NewcomerPresentations
668
1267
1887
0200400600800100012001400160018002000
Q1 Q2 Q3
LiveGP.org(users)
0
10
20
30
40
50
60
16-Mar 16-Apr 16-May 16-Jun 16-Jul 16-Aug 16-Sep
FirstFriends
500
1000 1000
0
200
400
600
800
1000
1200
Q1 Q2 Q3
2016LiveGPPostcardsDistributed

GreaterPeoriaEDC QuarterlyEconomicUpdate|Q32016 12
RegionalIndicators|Employment,LaborForce,UnemploymentRates
• GreaterPeoriaemploymentincreasesinthethirdquarter:GreaterPeoriaemploymentattheendofQ3was185,991whichwasup2303(1.24%)fromQ2.Illinoisemploymentincreased.05percentforthisquarteraswellastheUSwhichincreased.1percent.Standoutsofgrowththisquarterwiththeoverallgaininemployment:Mining,Logging,andConstruction(2.5%),andTrade,Transportation,andUtilites(.28%).
• Regionalunemploymentratedecreases:TheGreaterPeoriaseasonally-adjustedunemploymentratedecreasedfrom6.7%inQ2to6.32%inQ3.ForIllinois,unemploymentdecreasedto5.4%attheendofQ3.TheUSunemploymentincreasedto5.0%.GreaterPeoria’sunemploymentoverthelastyearhasgrown0.72%alongwithIllinois’increaseof.1%.However,theUSremainedtheconstant.Theseincreasesinunemploymentcanbeattributedtorecentstrugglesinthemanufacturingindustry.
• Laborforcegrowsslightlyinsecondquarter:theGreaterPeorialaborforcegrewby2,303inQ3to198,295.Thelaborforcehasalsogrewslightlyfortheyearby1168.
170000175000180000185000190000195000200000
Jan-10
Sep-10
May-11
Jan-12
Sep-12
May-13
Jan-14
Sep-14
May-15
Jan-16
Sep-16
GreaterPeoriaTotalEmployment
GreaterPeoria
0.00%2.00%4.00%6.00%8.00%10.00%12.00%14.00%
Jan-10
Aug-10
Mar-11
Oct-11
May-12
Dec-12
Jul-1
3
Feb-14
Sep-14
Apr-15
Nov-15
Jun-16
GreaterPeoriaUnemploymentRates
GreaterPeoria Illinois USA
54.00%56.00%58.00%60.00%62.00%64.00%66.00%68.00%
Jul-1
0
Feb-11
Sep-11
Apr-12
Nov-12
Jun-13
Jan-14
Aug-14
Mar-15
Oct-15
May-16
LaborForceParticipationRate
GreaterPeoria USA
160000
170000
180000
190000
200000
210000
220000
Jan-10
Sep-10
May-11
Jan-12
Sep-12
May-13
Jan-14
Sep-14
May-15
Jan-16
Sep-16
GreaterPeoriaLaborForce
GPLaborForce GPEmployment

GreaterPeoriaEDC QuarterlyEconomicUpdate|Q32016 13
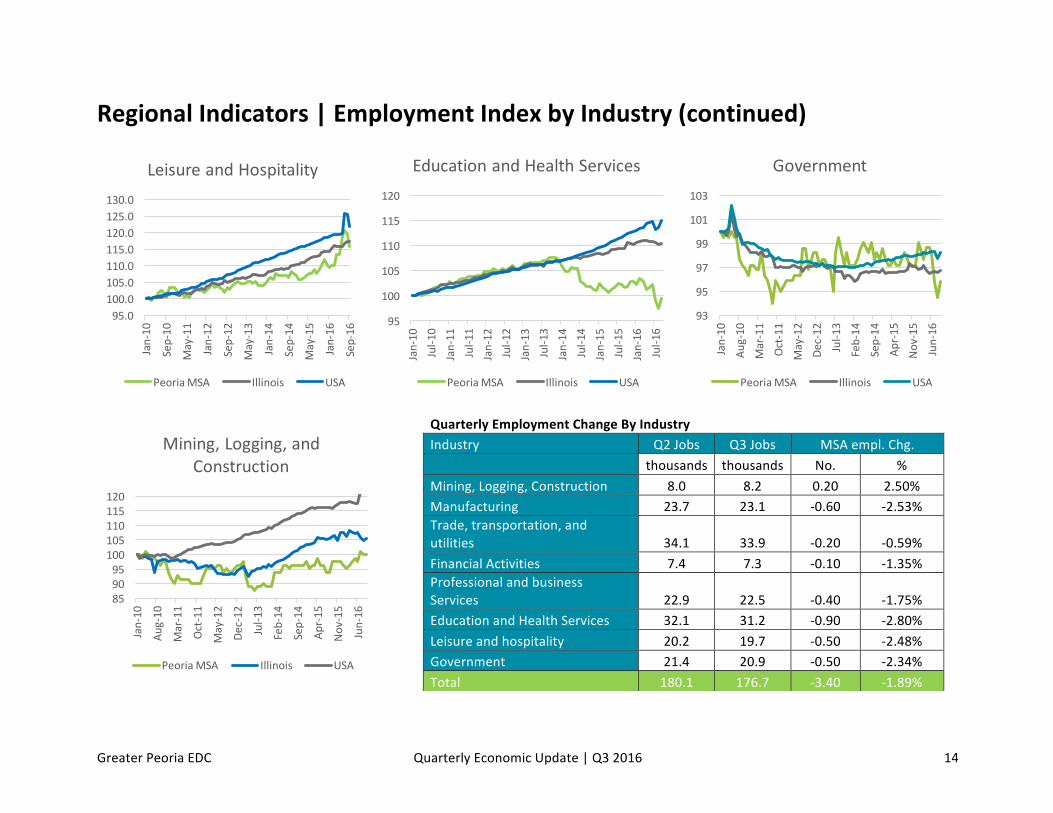
RegionalIndicators|EmploymentIndexbyIndustry
• Chartsonpage13and14showPeoriaMSAemploymentgrowthcomparedtostateandnationalaveragessincethebeginningof2010.
• Overallemploymentwasdownearlyinthequarterbutgrewtowardstheend,andremainsup644sincelastSeptember.
• TwooftheeightmajorindustriessawemploymentincreasesfromQ2toQ3.Forthespanofayear,threeindustrieshavegrown.
Construction,…
Mfg.,13.1%
Trade,transport,utilities,19.2%
FinancialActivities,4.1%Prof.and
Bus.Services,12.7%
Edu.andHealthServices,17.7%
LeisureandHospitality,
11.1%
Govt.,11.8%
Other,5.6%
PeoriaMSAShareofEmploymentByIndustry,Q32016
95
100
105
110
115
120
125
Jan-10
Aug-10
Mar-11
Oct-11
May-12
Dec-12
Jul-1
3Feb-14
Sep-14
Apr-15
Nov-15
Jun-16
Manufacturing
PeoriaMSA Illinois USA
95
100
105
110
115
Jan-10
Aug-10
Mar-11
Oct-11
May-12
Dec-12
Jul-1
3Feb-14
Sep-14
Apr-15
Nov-15
Jun-16
Trade,Transportation,andUtilities
PeoriaMSA Illinois USA
85
90
95
100
105
110
Jan-10
Aug-10
Mar-11
Oct-11
May-12
Dec-12
Jul-1
3Feb-14
Sep-14
Apr-15
Nov-15
Jun-16
FinancialActivities
PeoriaMSA Illinois USA
85.0
95.0
105.0
115.0
125.0
Jan-10
Sep-10
May-11
Jan-12
Sep-12
May-13
Jan-14
Sep-14
May-15
Jan-16
Sep-16
ProfessionalandBusinessServices
PeoriaMSA Illinois USA
GreaterPeoriaEDC QuarterlyEconomicUpdate|Q32016 14
RegionalIndicators|EmploymentIndexbyIndustry(continued)
QuarterlyEmploymentChangeByIndustry Industry Q2Jobs Q3Jobs MSAempl.Chg. thousands thousands No. %Mining,Logging,Construction 8.0 8.2 0.20 2.50%Manufacturing 23.7 23.1 -0.60 -2.53%Trade,transportation,andutilities 34.1 33.9 -0.20 -0.59%FinancialActivities 7.4 7.3 -0.10 -1.35%ProfessionalandbusinessServices 22.9 22.5 -0.40 -1.75%EducationandHealthServices 32.1 31.2 -0.90 -2.80%Leisureandhospitality 20.2 19.7 -0.50 -2.48%Government 21.4 20.9 -0.50 -2.34%Total 180.1 176.7 -3.40 -1.89%
859095100105110115120
Jan-10
Aug-10
Mar-11
Oct-11
May-12
Dec-12
Jul-1
3
Feb-14
Sep-14
Apr-15
Nov-15
Jun-16
Mining,Logging,andConstruction
PeoriaMSA Illinois USA
95.0100.0105.0110.0115.0120.0125.0130.0
Jan-10
Sep-10
May-11
Jan-12
Sep-12
May-13
Jan-14
Sep-14
May-15
Jan-16
Sep-16
LeisureandHospitality
PeoriaMSA Illinois USA
95
100
105
110
115
120
Jan-10
Jul-1
0Jan-11
Jul-1
1Jan-12
Jul-1
2Jan-13
Jul-1
3Jan-14
Jul-1
4Jan-15
Jul-1
5Jan-16
Jul-1
6
EducationandHealthServices
PeoriaMSA Illinois USA
93
95
97
99
101
103
Jan-10
Aug-10
Mar-11
Oct-11
May-12
Dec-12
Jul-1
3Feb-14
Sep-14
Apr-15
Nov-15
Jun-16
Government
PeoriaMSA Illinois USA

GreaterPeoriaEDC QuarterlyEconomicUpdate|Q32016 15
RegionalIndicators|AverageHourlyWage
$12.00
$17.00
$22.00
$27.00
$32.00
2010Q1
2010Q3
2011Q1
2011Q3
2012Q1
2012Q3
2013Q1
2013Q3
2014Q1
2014Q3
2015Q1
2015Q3
2016Q1
LoganCounty
Logan Illinois USA
$12.00
$17.00
$22.00
$27.00
$32.00
2010Q1
2010Q3
2011Q1
2011Q3
2012Q1
2012Q3
2013Q1
2013Q3
2014Q1
2014Q3
2015Q1
2015Q3
2016Q1
MasonCounty
Mason Illinois USA
$19.00
$21.00
$23.00
$25.00
$27.00
$29.00
2010Q1
2010Q3
2011Q1
2011Q3
2012Q1
2012Q3
2013Q1
2013Q3
2014Q1
2014Q3
2015Q1
2015Q3
2016Q1
PeoriaCounty
Peoria Illinois USA
$19.00
$24.00
$29.00
$34.00
$39.00
2010Q1
2010Q3
2011Q1
2011Q3
2012Q1
2012Q3
2013Q1
2013Q3
2014Q1
2014Q3
2015Q1
2015Q3
2016Q1
TazewellCounty
Tazewell Illinois USA
$12.00
$17.00
$22.00
$27.00
$32.00
2010Q1
2010Q3
2011Q1
2011Q3
2012Q1
2012Q3
2013Q1
2013Q3
2014Q1
2014Q3
2015Q1
2015Q3
2016Q1
WoodfordCounty
Woodford Illinois USA
$17.00$19.00$21.00$23.00$25.00$27.00$29.00$31.00
2010Q1
2010Q3
2011Q1
2011Q3
2012Q1
2012Q3
2013Q1
2013Q3
2014Q1
2014Q3
2015Q1
2015Q3
2016Q1
GreaterPeoria
GreaterPeoria Illinois USA

GreaterPeoriaEDC QuarterlyEconomicUpdate|Q32016 16
RegionalIndicators|CommercialRealEstate
RegionalIndicators|AirportPassengers&Flights
0
20
40
60
80
Q12014
Q22014
Q32014
Q42014
Q12015
Q22015
Q32015
Q42015
Q12016
Q22016
Q32016
IndustrialRealEstateVacancys
0
50
100
150
Q12014
Q32014
Q12015
Q32015
Q12016
Q32016
LandRealEstateVacancys
0
50
100
150
200
250
Q12014
Q32014
Q12015
Q32015
Q12016
Q32016
OfficeVacancys
0
50
100
150
200
Q12014
Q32014
Q12015
Q32015
Q12016
Q32016
RetailVacancys
010,00020,00030,00040,00050,00060,00070,00080,00090,000
2010 2011 2012 2013 2014 2015 2016
PeoriaInternationalAirportPassengers
Q1 Q2 Q3 Q4
0
500
1000
1500
2000
2010 2011 2012 2013 2014 2015 2016
PeoriaInternationalAirportDomesticFlights
Q1 Q2 Q3 Q4

GreaterPeoriaEDC QuarterlyEconomicUpdate|Q32016 17
RegionalIndicators|Housing
500
1000
1500
2010 2011 2012 2013 2014 2015 2016
ResidentialSales
Q1 Q2 Q3 Q4
Source:PAAR
$80,000
$90,000
$100,000
$110,000
$120,000
$130,000
$140,000
2010 2011 2012 2013 2014 2015 2016
MedianSale
Q1 Q2 Q3 Q4Source:PAAR
0.00% 0.50% 1.00% 1.50%
PeoriaMSA
Illinois
USA
MSAHousePriceChange,3rdQuarter
2015- 4thQuarter2015
80859095
100105110115120
FHFAHousePriceIndex,1stQuarter2005- 3rdQuarter2016
PeoriaMSA Illinois USA

GreaterPeoriaEDC QuarterlyEconomicUpdate|Q32016 18
RegionalIndicators|CostofLivingIndex
0
20
40
60
80
100
120
140
2012Q2 2013Q2 2014Q2 2015Q2 2016Q2
CostofLivingIndex
Peoria QuadCities Chicago DesMoines Madison FortWayne StLouis

GreaterPeoriaEDC QuarterlyEconomicUpdate|Q32016 19
RegionalPerformance|Expansions&Locations
Q12016ProjectAnnouncements:PEN DigitalPublishing Pekin Tazewell 0 StartupScious DataMunging Peoria Peoria 1 StartupWCSupportCo OnlineShopSupport Bartonville Peoria 0 StartupCrank'sIndustrialCoating GeneralManufacturing Pekin Tazewell 2 ExpansionLonza Biotechnology Mapleton Peoria 0 ExpansionTrefzgersBakery Bakery PeoriaHeights Peoria 4 AttractionMortonBank/HeritageBank Banking Central Illinois 0 MergerQ22016ProjectAnnouncements: JustcorePropertiesLLC ConcreteConstruction Minonk Woodford 3 ExpansionGrosenbach'sGroceryLLC GroceryStore Minonk Woodford 9 ExpansionMinonkBowl BowlingAlley Minonk Woodford 0 ExpansionNaturalFiberWelding WeldingShop Peoria Peoria 2 StartupSchnucks Supermarket Peoria Peoria 130 ExpansionSave-A-Lot GroceryStore Peoria Peoria 25 ExpansionFreeLanceKit MarketingAgency WestPeoria Peoria 0 StartupQ32016ProjectAnnouncements: DollarTree GeneralMerchandiseStore Washington Tazewell 0 ExpansionMulti-TenantBuildingatPGP GreatClips,Blue,MassageEnvy Peoria Peoria 50 ExpansionVillasofHollyBrook AssistedLiving Washington Tazewell 0 ExpansionTotalJobs2016-Attraction: 4 TotalJobs2016-Expansion: 219 TotalJobs2016-Startup: 3 TotalJobs2016: 226


