46
QUEENSLAND REGIONAL PROFILE MORETON BAY REGIONAL Local Government Area (ASGS 2011) 5 July 2013

QUEENSLAND REGIONAL PROFILE
MORETON BAY REGIONALLocal Government Area (ASGS 2011)
5 July 2013

Queensland Regional Profile Page ii
For further information contact:Government StatisticianEconomic and Structural PolicyQueensland Treasury and Trade
PO Box 15037 City East Qld 4002 AustraliaPhone: (07) 3035 6418
Email: [email protected]
Web: www.oesr.qld.gov.au
© The State of Queensland (Queensland Treasury and Trade) 2013
You are free to copy, communicate and adapt the work, as long as you attribute the authors. This document is licensed under a Creative Commons Attribution 3.0 Australia licence. To view a copy of this licence, visithttp://creativecommons.org/licenses/by/3.0/auTo attribute this work, cite Queensland Regional Profile for Moreton Bay Regional Local Government Area, Government Statistician, Queensland Treasury and Trade.
All data and information in this report are believed to be accurate and have come from sources believed to be reliable. However,Queensland Treasury and Trade does not guarantee or represent that the data and the information are accurate, up to date orcomplete, and disclaims liability for all claims, losses, damages or costs of whatever nature and howsoever occurring, arising asa result of relying on the data and information, regardless of the form of action, whether in contract, tort (including negligence),breach of statutory duty or otherwise.
To run this profile again, please click here

Queensland Regional Profile Page 3
Figure 1 Map of Moreton Bay Regional Local Government Area (LGA)
Queensland Regional Profile Page 4
REGION OVERVIEW
Moreton Bay Regional Local Government Area (LGA) has a total area of 2,036.8 km2, or 0.1 per cent of the total areaof Queensland. Moreton Bay Regional LGA has an average daily temperature range of 14.5 oC to 24.5 oC and onaverage it receives 1,351 mm of rainfall each year.
Demography
As at 30 June 2012, the estimated resident population of the region was 399,406 persons, compared with 4,560,059persons in Queensland.
As at 30 June 2011, 21.5 per cent of persons in the region were aged 0 to 14 years, 65.7 per cent were aged 15 to 64years and 12.8 per cent were aged 65 years and over.
As at 30 June 2011, the median age for the region was 36.9 years, an increase of 0.6 year over the five year periodfrom 30 June 2006 to 30 June 2011.
As at 30 June 2011, natural increase as a component of population change increased by 3,454 persons over the yearin the region, compared with assumed net migration which increased by 4,206 persons over the year.
In 2011, the number of registered births to mothers with a usual residence in the region was 5,676. During the sameperiod, the number of deaths registered of persons with a usual residence in the region was 2,311. As a result, thenatural increase for the region was 3,365 persons.
As at 30 June 2031, the population for the region is projected to be 533,170 persons.
At the time of the 2011 Census, the region had 8,484 persons who stated they were of Aboriginal or Torres StraitIslander origin, representing 2.2 per cent of the total population.
At the time of the 2011 Census, the region had 61,947 persons who were living (usually residing) at a differentaddress one year earlier (16.6 per cent of the total population).
At the time of the 2011 Census, the region had 156,143 persons who were living (usually residing) at a differentaddress five years earlier (44.6 per cent of the total population).
At the time of the 2011 Census, the region had 71,713 persons who stated they were born overseas (19.0 per cent ofthe total population) and 288,296 persons who stated they were Australian-born (76.3 per cent of the total population).
At the time of the 2011 Census, the region had 15,760 persons born overseas who stated that they spoke a languageother than English at home (22.0 per cent of the overseas-born population).
At the time of the 2011 Census, there were a total of 104,963 families in the region. The family type with the largestnumber of families was couple family with children (47,132 families). There were 17,374 one-parent families,accounting for 16.6 per cent of all families in the region.
At the time of the 2011 Census, the region had 132,606 occupied private dwellings. Of these private dwellings,113,853 were separate houses, 9,820 were semi-detached and 7,579 were apartments.
At the time of the 2011 Census, 27.9 per cent of the occupied private dwellings in the region were fully owned, 39.8per cent were being purchased and 29.3 per cent were being rented.
At the time of the 2011 Census, the region had 106,218 occupied private dwellings with an internet connection, or 80.1per cent of all occupied private dwellings.
At the time of the 2011 Census, 90.5 per cent of the population of the region were in major cities and 0.0 per cent werein very remote Australia.
Society
At the time of the 2011 Census, 22.8 per cent of the population of the region were in the most disadvantaged quintile,and 24.4 per cent were in the least disadvantaged quintile.
As at 28 February 2013, the region had a total of 214 early childhood education and care services.
At the time of the 2011 Census, the region had 149,545 persons aged 15 years and over whose highest level ofschooling was year 11 or 12 (or equivalent), representing 52.9 per cent of all persons aged 15 years and over.

Queensland Regional Profile Page 5
At the time of 2011 Census, the region had 153,558 persons aged 15 years and over with a qualification, or 52.0 percent of the population in this age group.
In 2011 the region had a total of 24,357 vocational education and training (VET) students. This was made up of 16,247students commencing a VET course and 8,091 students continuing a VET course.
At the time of the 2011 Census, the region had 18,167 persons in need of assistance with a core activity, representing4.8 per cent of the total population.
At the time of the 2011 Census, the region had 50,951 volunteers aged 15 years and over, representing 17.3 per centof total persons aged 15 years and over.
As at 30 June 2012, the region had 59 aged care services with a total of 3,317 operational places.
As at 30 June 2010, the region had 10 police stations, 10 ambulance stations, 10 fire stations, 94 schools and 7hospitals.
Economy
At the time of the 2011 Census, the region had 103,875 persons aged 15 years and over who stated that their totalpersonal weekly income was less than $400, representing 35.2 per cent of all persons aged 15 years and over.
The number of unemployed persons aged 15 years and over (based on a smoothed series) in the region in Decemberquarter 2012 was 10,878. This represented an unemployment rate of 5.8 per cent.
At the time of the 2011 Census, Health Care and Social Assistance was the largest industry of employment for usualresidents in the region, with 22,245 persons or 12.7 per cent of the employed labour force.
At the time of the 2011 Census, Clerical & administrative workers was the largest occupation group of employment forusual residents in the region, with 29,014 persons or 16.6 per cent of the employed labour force.
At the time of the 2011 Census, Retail Trade was the largest industry of employment for employed persons working inthe region, with 14,056 persons or 15.7 per cent of the employed labour force.
At the time of the 2011 Census, Professionals was the largest occupation group of employment for employed personsworking in the region, with 15,098 persons or 16.9 per cent of the employed labour force.
Industry and Development
In the 12 months ending 30 September 2012, there were a total of 7,282 residential dwelling sales in the region. Themedian sale price was $360,000.
At the time of the 2011 Census, the region had 7,834 occupied private dwellings with no motor vehicles, or 5.9 percent of all occupied private dwellings.
Environment
As of 2012, the total park and forest estate in terms of National Park, State Forest, Timber Reserve and ForestReserve in the region was 411.3 km2.
Queensland Regional Profile Page 6
ESTIMATED RESIDENT POPULATION
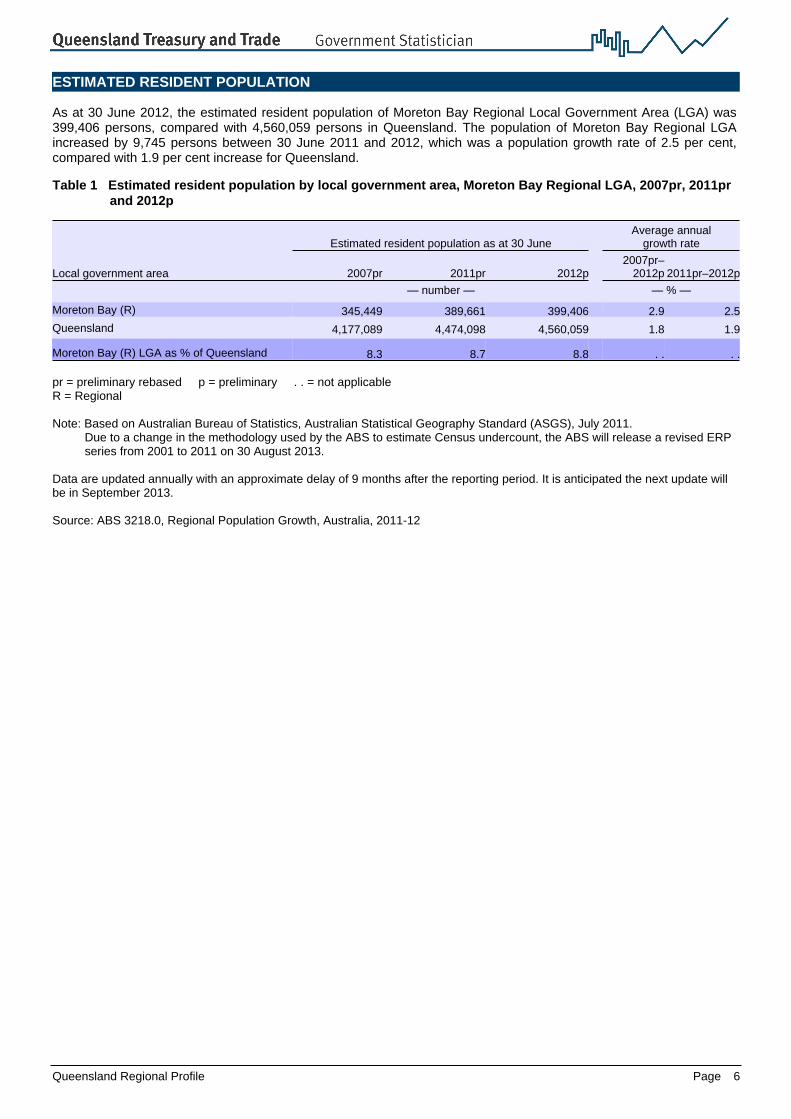
As at 30 June 2012, the estimated resident population of Moreton Bay Regional Local Government Area (LGA) was399,406 persons, compared with 4,560,059 persons in Queensland. The population of Moreton Bay Regional LGAincreased by 9,745 persons between 30 June 2011 and 2012, which was a population growth rate of 2.5 per cent,compared with 1.9 per cent increase for Queensland.
Table 1 Estimated resident population by local government area, Moreton Bay Regional LGA, 2007pr, 2011pr and 2012p
Estimated resident population as at 30 JuneAverage annual
growth rate
Local government area 2007pr 2011pr 2012p2007pr–
2012p 2011pr–2012p
— number — — % —
Moreton Bay (R) 345,449 389,661 399,406 2.9 2.5
Queensland 4,177,089 4,474,098 4,560,059 1.8 1.9
Moreton Bay (R) LGA as % of Queensland 8.3 8.7 8.8 . . . .
pr = preliminary rebased p = preliminary . . = not applicable R = Regional
Note: Based on Australian Bureau of Statistics, Australian Statistical Geography Standard (ASGS), July 2011.Due to a change in the methodology used by the ABS to estimate Census undercount, the ABS will release a revised ERP series from 2001 to 2011 on 30 August 2013.
Data are updated annually with an approximate delay of 9 months after the reporting period. It is anticipated the next update will be in September 2013.
Source: ABS 3218.0, Regional Population Growth, Australia, 2011-12

Queensland Regional Profile Page 7
POPULATION BY AGE AND SEX
As at 30 June 2011 in Moreton Bay Regional Local Government Area (LGA), 21.5 per cent of persons were aged 0 to14 years, 65.7 per cent were aged 15 to 64 years and 12.8 per cent were aged 65 years and over.
Table 2 Estimated resident population by age by local government area, Moreton Bay Regional LGA, 30 June 2011pr
Local government area
Population by age
0–14 15–24 25–44 45–64 65+
number % number % number % number % number %
Moreton Bay (R) 83,831 21.5 52,235 13.4 105,940 27.2 97,641 25.1 50,014 12.8
Queensland 887,487 19.8 625,429 14.0 1,264,341 28.3 1,119,056 25.0 577,785 12.9
Moreton Bay (R) LGA as % of Queensland 9.4 . . 8.4 . . 8.4 . . 8.7 . . 8.7 . .
pr = preliminary rebased . . = not applicable R = Regional
Note: Based on Australian Bureau of Statistics, Australian Statistical Geography Standard (ASGS), July 2011.
Data are updated annually with an approximate delay of 12 months after the reporting period. It is anticipated the next update will be in September 2013.
Source: ABS 3235.0, Population by Age and Sex, Regions of Australia, 2011

Queensland Regional Profile Page 8
The following figure highlights the differences in age groups between Moreton Bay Regional Local Government Area(LGA) and Queensland as at 30 June 2011.
Figure 2 Population by age group and sex, Moreton Bay Regional LGA and Queensland, 30 June 2011pr
pr = preliminary rebased
Note: Based on Australian Bureau of Statistics, Australian Statistical Geography Standard (ASGS), July 2011.
Source: ABS 3235.0, Population by Age and Sex, Regions of Australia, 2011

Queensland Regional Profile Page 9
MEDIAN AGE
As at 30 June 2011, the median age for Moreton Bay Regional Local Government Area (LGA) was 36.9 years, anincrease of 0.6 year over the five year period from 30 June 2006 to 30 June 2011. The median age in Queensland asat 30 June 2011 was 36.6 years, an increase of 0.6 year over the same period.
Table 3 Median age by local government area, Moreton Bay Regional LGA, 2006 and 2011
Local government area
Median age as at 30 June
Change (2006 to 2011)2006 2011
— years — years
Moreton Bay (R) 36.3 36.9 0.6
Queensland 36.0 36.6 0.6
R = Regional
Note: Based on Australian Bureau of Statistics, Australian Statistical Geography Standard (ASGS), July 2011.Median estimates have been calculated by the Office of Economic and Statistical Research.
Data are updated annually with an approximate delay of 12 months after the reporting period. It is anticipated the next update will be in September 2013.
Source: ABS 3235.0, Population by Age and Sex, Regions of Australia, 2011

Queensland Regional Profile Page 10
COMPONENTS OF POPULATION CHANGE
As at 30 June 2011, the estimated resident population of Moreton Bay Regional Local Government Area (LGA) was389,661 persons, representing an increase of 7,660 persons over the year. Natural increase as a component ofpopulation change increased by 3,454 persons over the year, compared with assumed net migration which increasedby 4,206 persons over the year. The estimated resident population of Queensland was 4,474,098 persons, anincrease of 49,940 persons over the year.
Table 4 Components of population change by local government area, Moreton Bay Regional LGA, 30 June 2011pr
Local government areaNatural
increase (a)Assumed netmigration (b)
Estimated residentpopulation
Annualchange
— number —
Moreton Bay (R) 3,454 4,206 389,661 7,660
Queensland 36,433 13,507 4,474,098 49,940
Moreton Bay (R) LGA as % of Queensland 9.5 31.1 8.7 15.3
pr = preliminary rebased . . = not applicable R = Regional
(a) Natural increase is defined as the difference between the births and deaths estimates based on year of registration.(b) Assumed net migration is defined as the difference between the growth in estimated resident population and the natural increase.
Note: Based on Australian Bureau of Statistics, Australian Statistical Geography Standard (ASGS), July 2011.Queensland natural increase was derived from published ABS preliminary births and deaths estimates based on date of registration. It does not equal the sum of natural increase for Queensland LGAs. Accordingly, Queensland assumed net migration does not equal the sum of assumed net migration for Queensland LGAs.
Data are updated annually with an approximate delay of 18 months after the reporting period. It is anticipated the next update will be in April 2014.
Source: ABS 3218.0, Regional Population Growth, Australia, various editions; ABS 3301.0, Births, Australia, unpublished data; ABS 3302.0, Deaths, Australia, unpublished data

Queensland Regional Profile Page 11
POPULATION PROJECTIONS
As at 30 June 2031, the population for Moreton Bay Regional Local Government Area (LGA) is projected to be533,170 persons. The population for the region is projected to increase by an average annual growth rate of 1.6 percent over the 20-year period between 2011 and 2031. In comparison, the population for Queensland is projected toincrease by an average annual growth rate of 1.8 per cent over the same period.
Table 5 Projected population (a) by local government area, Moreton Bay Regional LGA, 2011 (b) to 2031
Projected population as at 30 June
Average annual
growth rate
Local government area 2011 (b) 2016 2021 2026 2031 2011 to 2031
— number — %
Moreton Bay (R) 390,204 430,729 467,860 501,488 533,170 1.6
Queensland 4,611,491 5,092,858 5,588,617 6,090,548 6,592,857 1.8
Moreton Bay (R) LGA as % of Queensland 8.5 8.5 8.4 8.2 8.1 . .
. . = not applicable R = Regional
(a) Data are based on a medium series.(b) The population estimate presented for 30 June 2011 was correct at the time of publication of the Queensland Government population projections. It has subsequently been revised by the Australian Bureau of Statistics as presented in the estimated resident population.
Note: Based on Australian Bureau of Statistics, Australian Statistical Geography Standard (ASGS), July 2011.
Data are updated twice every five years. It is anticipated the next update will be in December 2013.
Source: Queensland Government population projections, 2011 edition (medium series), Government Statistician, Queensland Treasury and Trade

Queensland Regional Profile Page 12
INDIGENOUS POPULATION
At the time of the 2011 Census, Moreton Bay Regional Local Government Area (LGA) had 8,484 persons who statedthey were of Aboriginal or Torres Strait Islander origin. Indigenous persons made up 2.2 per cent of the totalpopulation (compared with 3.6 per cent in Queensland).
Of the 8,484 persons usually resident in the region who stated they were of Indigenous origin, 7,485 persons statedthey were Aboriginal, 547 persons stated they were Torres Strait Islander, and 452 persons stated they were bothAboriginal and Torres Strait Islander.
Table 6 Number of persons by Indigenous status by local government area (a), Moreton Bay Regional LGA, 2011
Indigenous persons
Non-IndigenouspersonsLocal government area Aboriginal
Torres StraitIslander Both (b) Total
Totalpersons (c)
— number — number % number % number
Moreton Bay (R) 7,485 547 452 8,484 2.2 353,506 93.5 378,046
Queensland 122,896 20,094 12,834 155,824 3.6 3,952,707 91.2 4,332,740
Moreton Bay (R) LGA as % of Queensland 6.1 2.7 3.5 5.4 . . 8.9 . . 8.7
. . = not applicable R = Regional
(a) Based on place of usual residence.(b) Applicable to persons who are of 'both Aboriginal and Torres Strait Islander origin'.(c) Includes Indigenous status not stated.
Note: Based on Australian Bureau of Statistics, Australian Statistical Geography Standard (ASGS), July 2011.Census data have 'introduced random error' to ensure no data are released which could risk identifying individuals. As such, cells containing very small counts should be treated with extreme caution.Queensland figures include the 'Migratory - Offshore - Shipping' and 'No Usual Address' counts.
Source: ABS, Census of Population and Housing, 2011, Indigenous Profile - I02

Queensland Regional Profile Page 13
BIRTHS AND DEATHS
In 2011, the number of registered births to mothers with a usual residence in Moreton Bay Regional Local GovernmentArea (LGA) was 5,676. During the same period, the number of deaths registered of persons with a usual residence inthe region was 2,311. As a result, the natural increase for Moreton Bay Regional LGA was 3,365 persons.
Table 7 Registered births and deaths by local government area, Moreton Bay Regional LGA, 2011 (a)
Local government area Births (b) Deaths (c) Natural increase (d)
— number —
Moreton Bay (R) 5,676 2,311 3,365
Queensland (e) 63,253 27,414 35,839
Moreton Bay (R) LGA as % of Queensland 9.0 8.4 9.4
. . = not applicable R = Regional
(a) Data are based on the number of births and deaths registered during a calendar year.(b) Births data are based on the place of usual residence of the mother.(c) Deaths data are based on the place of usual residence of the deceased.(d) Natural increase is defined as the difference between the births and deaths estimates based on year of registration.(e) Queensland totals include births and deaths where the usual residence was overseas, no fixed abode, Offshore and Migratory, and Queensland undefined.
Note: Based on Australian Bureau of Statistics, Australian Statistical Geography Standard (ASGS), July 2011.
Data are updated annually with an approximate delay of 12 months after the reporting period. It is anticipated the next update will be in December 2013.
Source: ABS 3301.0, Births, Australia, 2011; ABS 3302.0, Deaths, Australia, 2011

Queensland Regional Profile Page 14
In 2011, the number of registered births in the Moreton Bay Regional Local Government Area (LGA) was 5,676,compared with 63,253 in Queensland. Between 2006 and 2011, the number of registered births in the region rangedbetween 4,431 (2006) and 5,797 (2009).
Figure 3 Registered births, Moreton Bay Regional LGA and Queensland, 2006 to 2011 (a)(b)(c)
(a) Data are based on the number of births registered during a calendar year.(b) Births data are based on the place of usual residence of the mother.(c) Queensland totals include births where the usual residence was overseas, no fixed abode, Offshore and Migratory, and Queensland undefined.
Note: Based on Australian Bureau of Statistics, Australian Statistical Geography Standard (ASGS), July 2011.As a result of changes in the timeliness of registration of births in Queensland, care should be taken when interpreting changes in Queensland births between 2006 and 2010. This lag has reduced in recent years, indicating potential improvements in the timeliness of registration of births in Queensland. The December quarter 2009 also saw the Queensland Registry of Births, Deaths and Marriages devoting significant time and resources to follow-up and finalise birth registrations where there was previously incomplete information. As part of the Retrospective Births Project, 1,780 births were registered, with approximately 40% registered as Aboriginal and Torres Strait Islander births (see paragraph 40 for more information). This project is now complete.
Source: ABS 3301.0, Births, Australia, 2011; ABS 3302.0, Deaths, Australia, 2011

Queensland Regional Profile Page 15
In 2011, the number of registered deaths in the Moreton Bay Regional Local Government Area (LGA) was 2,311,compared with 27,414 in Queensland. Between 2006 and 2011, the number of registered deaths in the region rangedbetween 1,973 (2006) and 2,311 (2011).
Figure 4 Registered deaths, Moreton Bay Regional LGA and Queensland, 2006 to 2011 (a)(b)(c)
(a) Data are based on the number of deaths registered during a calendar year.(b) Deaths data are based on the place of usual residence of the deceased.(c) Queensland totals include deaths where the usual residence was overseas, no fixed abode, Offshore and Migratory, and Queensland undefined.
Note: Based on Australian Bureau of Statistics, Australian Statistical Geography Standard (ASGS), July 2011.
Source: ABS 3301.0, Births, Australia, 2011; ABS 3302.0, Deaths, Australia, 2011

Queensland Regional Profile Page 16
MIGRATION 1 YEAR AGO
At the time of the 2011 Census, Moreton Bay Regional Local Government Area (LGA) had 61,947 persons who wereliving (usually residing) at a different address one year earlier (16.6 per cent of the total population). In Queensland,17.9 per cent of persons lived at a different address one year earlier. Moreton Bay Regional LGA had 294,628 personswho were living at the same address one year earlier.
Table 8 Place of usual residence one year ago (a)(b) by local government area, Moreton Bay Regional LGA, 2011
Different address Proportion withdifferent address
Totalpersons (d)Local government area Same address Within Australia Overseas Total (c)
— number — % number
Moreton Bay (R) 294,628 57,412 3,592 61,947 16.6 372,813
Queensland 3,278,187 691,522 63,184 764,695 17.9 4,275,277
Moreton Bay (R) LGA as % of Queensland 9.0 8.3 5.7 8.1 . . 8.7
. . = not applicable R = Regional
(a) Based on place of usual residence.(b) Based on persons aged one year and over.(c) Includes persons who stated that they were usually resident at a different address 1 year ago but did not state that address.(d) Includes persons who did not state whether they were usually resident at a different address 1 year ago.
Note: Based on Australian Bureau of Statistics, Australian Statistical Geography Standard (ASGS), July 2011.Census data have 'introduced random error' to ensure no data are released which could risk identifying individuals. As such, cells containing very small counts should be treated with extreme caution.Queensland figures include the 'Migratory - Offshore - Shipping' and 'No Usual Address' counts.
Source: ABS, Census of Population and Housing, 2011, Basic Community Profile - B38

Queensland Regional Profile Page 17
MIGRATION 5 YEARS AGO
At the time of the 2011 Census, Moreton Bay Regional Local Government Area (LGA) had 156,143 persons who wereliving (usually residing) at a different address five years earlier (44.6 per cent of the total population). In Queensland,45.0 per cent of persons lived at a different address five years earlier. Moreton Bay Regional LGA had 175,045persons who were living at the same address five years earlier.
Table 9 Place of usual residence five years ago (a)(b) by local government area, Moreton Bay Regional LGA, 2011
Different address Proportion withdifferent address
Totalpersons (d)Local government area Same address Within Australia Overseas Total (c)
— number — % number
Moreton Bay (R) 175,045 137,629 16,106 156,143 44.6 349,843
Queensland 1,958,914 1,550,344 238,588 1,815,132 45.0 4,034,846
Moreton Bay (R) LGA as % of Queensland 8.9 8.9 6.8 8.6 . . 8.7
. . = not applicable R = Regional
(a) Based on place of usual residence.(b) Based on persons aged five years and over.(c) Includes persons who stated that they were usually resident at a different address 5 years ago but did not state that address.(d) Includes persons who did not state whether they were usually resident at a different address 5 years ago.
Note: Based on Australian Bureau of Statistics, Australian Statistical Geography Standard (ASGS), July 2011.Census data have 'introduced random error' to ensure no data are released which could risk identifying individuals. As such, cells containing very small counts should be treated with extreme caution.Queensland figures include the 'Migratory - Offshore - Shipping' and 'No Usual Address' counts.
Source: ABS, Census of Population and Housing, 2011, Basic Community Profile - B39
Queensland Regional Profile Page 18
COUNTRY OF BIRTH
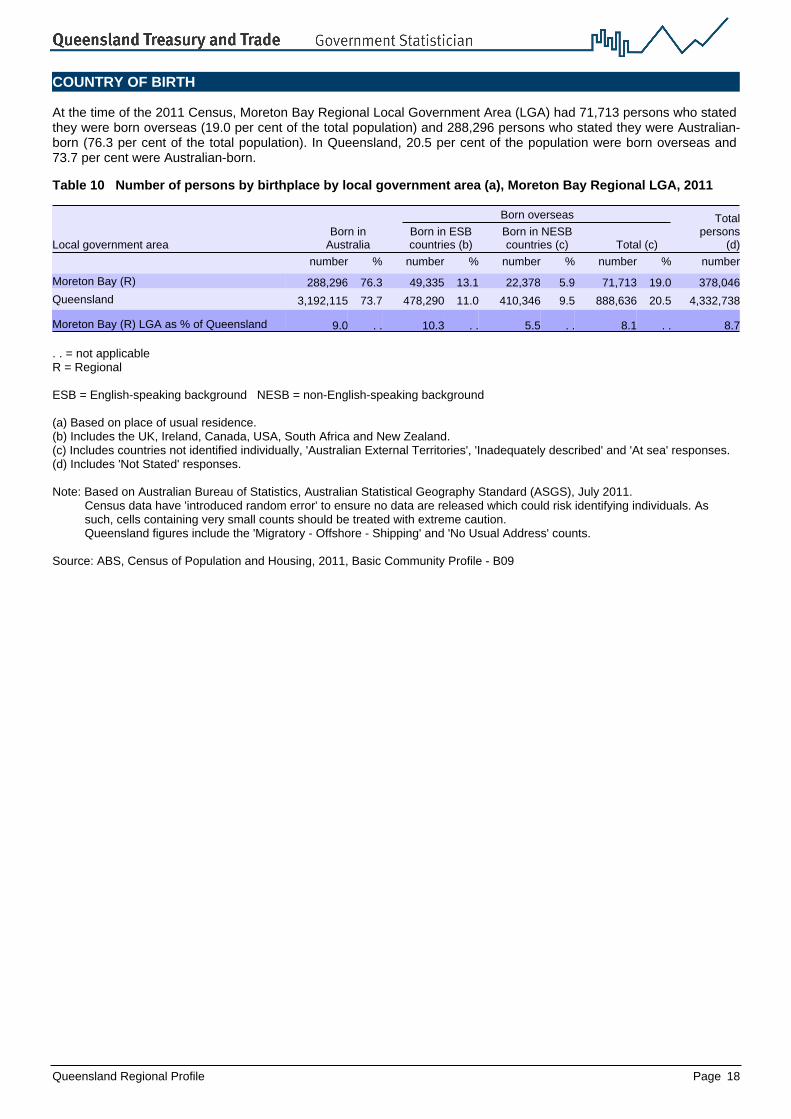
At the time of the 2011 Census, Moreton Bay Regional Local Government Area (LGA) had 71,713 persons who statedthey were born overseas (19.0 per cent of the total population) and 288,296 persons who stated they were Australian-born (76.3 per cent of the total population). In Queensland, 20.5 per cent of the population were born overseas and73.7 per cent were Australian-born.
Table 10 Number of persons by birthplace by local government area (a), Moreton Bay Regional LGA, 2011
Born overseas Totalpersons
(d)Local government areaBorn in
AustraliaBorn in ESBcountries (b)
Born in NESBcountries (c) Total (c)
number % number % number % number % number
Moreton Bay (R) 288,296 76.3 49,335 13.1 22,378 5.9 71,713 19.0 378,046
Queensland 3,192,115 73.7 478,290 11.0 410,346 9.5 888,636 20.5 4,332,738
Moreton Bay (R) LGA as % of Queensland 9.0 . . 10.3 . . 5.5 . . 8.1 . . 8.7
. . = not applicable R = Regional
ESB = English-speaking background NESB = non-English-speaking background
(a) Based on place of usual residence.(b) Includes the UK, Ireland, Canada, USA, South Africa and New Zealand.(c) Includes countries not identified individually, 'Australian External Territories', 'Inadequately described' and 'At sea' responses.(d) Includes 'Not Stated' responses.
Note: Based on Australian Bureau of Statistics, Australian Statistical Geography Standard (ASGS), July 2011.Census data have 'introduced random error' to ensure no data are released which could risk identifying individuals. As such, cells containing very small counts should be treated with extreme caution.Queensland figures include the 'Migratory - Offshore - Shipping' and 'No Usual Address' counts.
Source: ABS, Census of Population and Housing, 2011, Basic Community Profile - B09

Queensland Regional Profile Page 19
PROFICIENCY IN SPOKEN ENGLISH
At the time of the 2011 Census, Moreton Bay Regional Local Government Area (LGA) had 15,760 persons bornoverseas who stated that they spoke a language other than English at home (22.0 per cent of the overseas-bornpopulation). In Queensland, 36.0 per cent of the overseas-born population spoke a language other than English athome.
Of the overseas-born persons in the Moreton Bay Regional LGA who stated that they spoke a language other thanEnglish at home, 1,369 persons stated that they spoke English not well or not at all. This was 1.9 per cent of theoverseas-born population of Moreton Bay Regional LGA, compared with 5.2 per cent in Queensland.
Table 11 Proficiency in spoken English of overseas-born persons by local government area (a), Moreton Bay Regional LGA, 2011
Local government area
Speaks other language at home and speaks English Personsborn
overseas (c)Speaks
English onlyVery well
or wellNot well
or not at all Total (b)
number % number % number % number % number
Moreton Bay (R) 55,789 77.8 14,062 19.6 1,369 1.9 15,760 22.0 71,710
Queensland 565,544 63.6 269,847 30.4 45,927 5.2 319,949 36.0 888,635
Moreton Bay (R) LGA as % of Queensland 9.9 . . 5.2 . . 3.0 . . 4.9 . . 8.1
. . = not applicable R = Regional
(a) Based on place of usual residence.(b) Includes proficiency in English not stated.(c) Excludes persons who did not state their country of birth.
Note: Based on Australian Bureau of Statistics, Australian Statistical Geography Standard (ASGS), July 2011.Census data have 'introduced random error' to ensure no data are released which could risk identifying individuals. As such, cells containing very small counts should be treated with extreme caution.Queensland figures include the 'Migratory - Offshore - Shipping' and 'No Usual Address' counts.
Source: ABS, Census of Population and Housing, 2011, Basic Community Profile - B11

Queensland Regional Profile Page 20
FAMILY COMPOSITION
At the time of the 2011 Census, there were a total of 104,963 families in the Moreton Bay Regional Local GovernmentArea (LGA). The family type with the largest number of families was couple family with children (47,132 families).There were 17,374 one-parent families, accounting for 16.6 per cent of all families in the region. In comparison, 16.1per cent of all families in Queensland were one-parent families.
Table 12 Family composition by local government area (a)(b), Moreton Bay Regional LGA, 2011
Local government areaCouple family
with no children (c)Couple family
with children (c) One-parent family Total (d)
number % number % number % number
Moreton Bay (R) 39,189 37.3 47,132 44.9 17,374 16.6 104,963
Queensland 453,102 39.5 491,200 42.8 184,547 16.1 1,148,179
Moreton Bay (R) LGA as % of Queensland 8.6 . . 9.6 . . 9.4 . . 9.1
. . = not applicable R = Regional
(a) Based on place of usual residence.(b) Includes same-sex couple families.(c) Children are defined as children aged under 15 years or dependent students aged 15 to 24 years.(d) Includes other families.
Note: Based on Australian Bureau of Statistics, Australian Statistical Geography Standard (ASGS), July 2011.Census data have 'introduced random error' to ensure no data are released which could risk identifying individuals. As such, cells containing very small counts should be treated with extreme caution.
Source: ABS, Census of Population and Housing, 2011, Basic Community Profile - B25

Queensland Regional Profile Page 21
DWELLINGS BY DWELLING STRUCTURE
At the time of the 2011 Census, Moreton Bay Regional Local Government Area (LGA) had 132,606 occupied privatedwellings. Of these private dwellings, 113,853 were separate houses, 9,820 were semi-detached and 7,579 wereapartments. Separate houses represented 85.9 per cent of total occupied private dwellings in the region, comparedwith 78.5 per cent for Queensland.
Table 13 Occupied private dwellings (a) by dwelling structure by local government area, Moreton Bay Regional LGA, 2011
Local government areaSeparate
houseSemi-
detached (b) Apartment (c) Total (d)
number % number % number % number
Moreton Bay (R) 113,853 85.9 9,820 7.4 7,579 5.7 132,606
Queensland 1,215,303 78.5 129,430 8.4 181,716 11.7 1,547,303
Moreton Bay (R) LGA as % of Queensland 9.4 . . 7.6 . . 4.2 . . 8.6
. . = not applicable R = Regional
(a) Excludes visitors only and other not classifiable households.(b) Includes row or terrace house, townhouse etc.(c) Includes flat, unit or apartment.(d) Includes other dwelling types and dwelling types not stated.
Note: Based on Australian Bureau of Statistics, Australian Statistical Geography Standard (ASGS), July 2011.Census data have 'introduced random error' to ensure no data are released which could risk identifying individuals. As such, cells containing very small counts should be treated with extreme caution.
Source: ABS, Census of Population and Housing, 2011, Basic Community Profile - B31

Queensland Regional Profile Page 22
DWELLINGS BY TENURE TYPE
At the time of the 2011 Census, Moreton Bay Regional Local Government Area (LGA) had 132,606 occupied privatedwellings. Of these private dwellings, 27.9 per cent were fully owned, 39.8 per cent were being purchased and 29.3per cent were being rented. In comparison, 29.0 per cent of the total dwellings in Queensland were fully owned, 34.5per cent were being purchased and 33.2 per cent were being rented.
Table 14 Occupied private dwellings (a) by tenure type by local government area, Moreton Bay Regional LGA, 2011
Local government area Fully ownedBeing
purchased (b) Rented (c) Total (d)
number % number % number % number
Moreton Bay (R) 36,936 27.9 52,756 39.8 38,908 29.3 132,606
Queensland 448,617 29.0 533,868 34.5 513,415 33.2 1,547,303
Moreton Bay (R) LGA as % of Queensland 8.2 . . 9.9 . . 7.6 . . 8.6
. . = not applicable R = Regional
(a) Excludes visitors only and other not classifiable households.(b) Includes dwellings being purchased under a rent/buy scheme.(c) Includes renting from a real estate agent, state or territory housing authority, renting from a person not in the same household, renting from housing co-operative/community/church group, other landlord type and landlord type not stated.(d) Includes other tenure type and tenure type not stated.
Note: Based on Australian Bureau of Statistics, Australian Statistical Geography Standard (ASGS), July 2011.Census data have 'introduced random error' to ensure no data are released which could risk identifying individuals. As such, cells containing very small counts should be treated with extreme caution.
Source: ABS, Census of Population and Housing, 2011, Basic Community Profile - B32

Queensland Regional Profile Page 23
INTERNET CONNECTION
At the time of the 2011 Census, Moreton Bay Regional Local Government Area (LGA) had 106,218 occupied privatedwellings with an internet connection, or 80.1 per cent of all occupied private dwellings. In comparison, 78.3 per centof the occupied private dwellings in Queensland had an internet connection. Of the 106,218 internet connections in theregion, there were 97,363 broadband connections and 3,871 dial-up connections.
Table 15 Internet connections in occupied private dwellings (a)(b) by local government area, Moreton Bay Regional LGA, 2011
No internetconnection
With internet connection Totaldwellings (d)Local government area Broadband Dial-up Total (c)
number % — number — number % number
Moreton Bay (R) 22,177 16.7 97,363 3,871 106,218 80.1 132,606
Queensland 281,467 18.2 1,103,036 45,088 1,211,884 78.3 1,547,301
Moreton Bay (R) LGA as % of Queensland 7.9 . . 8.8 8.6 8.8 . . 8.6
. . = not applicable R = Regional
(a) Excludes visitors only and other not classifiable households.(b) Where a dwelling has more than one type of internet connection only one is recorded.(c) Includes other internet connection.(d) Includes internet connection not stated.
Note: Based on Australian Bureau of Statistics, Australian Statistical Geography Standard (ASGS), July 2011.Census data have 'introduced random error' to ensure no data are released which could risk identifying individuals. As such, cells containing very small counts should be treated with extreme caution.
Source: ABS, Census of Population and Housing, 2011, Basic Community Profile - B35

Queensland Regional Profile Page 24
EARLY CHILDHOOD EDUCATION AND CARE SERVICES
As at 28 February 2013, Moreton Bay Regional Local Government Area (LGA) had a total of 214 early childhoodeducation and care services, compared with 2,677 in Queensland. The most common early childhood education andcare services in the region were long day care services with 125 services, followed by school aged care services with60 services.
Table 16 Count of early childhood education and care services by type by local government area, Moreton Bay Regional LGA, 28 February 2013
Local government area
Familyday
care Kindergartens
Longday
care
Schoolagedcare
Limitedhourscare
Child care& familysupport
hubs
Total earlychildhood
education &care services
— number —
Moreton Bay (R) 4 25 125 60 0 0 214
Queensland 100 461 1,372 692 42 10 2,677
Moreton Bay (R) LGA as % of Queensland 4.0 5.4 9.1 8.7 0.0 0.0 8.0
. . = not applicable R = Regional
Note: Based on Australian Bureau of Statistics, Australian Statistical Geography Standard (ASGS), July 2011.
Data are updated twice yearly with an approximate delay of 1 month after the reporting period. It is anticipated the next update will be in September 2013.
Source: Office for Early Childhood Education and Care, Department of Education, Training and Employment

Queensland Regional Profile Page 25
HIGHEST LEVEL OF SCHOOLING
At the time of the 2011 Census, Moreton Bay Regional Local Government Area (LGA) had 149,545 persons aged 15years and over whose highest level of schooling was Year 11 or 12 (or equivalent) (52.9 per cent of all persons aged15 years and over). This corresponded with 55.3 per cent in Queensland.
Table 17 Number of persons by highest level of schooling completed by local government area (a), Moreton Bay Regional LGA, 2011
Local government area
Did not go toschool, or Year
8 or belowYear 9 or 10or equivalent
Year 11 or 12or equivalent Total (b)
number % number % number % number
Moreton Bay (R) 17,913 6.3 93,840 33.2 149,545 52.9 282,476
Queensland 219,102 6.6 977,116 29.4 1,836,995 55.3 3,320,761
Moreton Bay (R) LGA as % of Queensland 8.2 . . 9.6 . . 8.1 . . 8.5
. . = not applicable R = Regional
(a) Based on usual residents aged 15 years and over who are no longer attending primary or secondary school.(b) Includes highest year of schooling not stated.
Note: Based on Australian Bureau of Statistics, Australian Statistical Geography Standard (ASGS), July 2011.Census data have 'introduced random error' to ensure no data are released which could risk identifying individuals. As such, cells containing very small counts should be treated with extreme caution.Queensland figures include the 'Migratory - Offshore - Shipping' and 'No Usual Address' counts.
Source: ABS, Census of Population and Housing, 2011, Basic Community Profile - B16

Queensland Regional Profile Page 26
POST-SCHOOL QUALIFICATION
At the time of 2011 Census, Moreton Bay Regional Local Government Area (LGA) had 153,558 persons aged 15years and over with a qualification, or 52.0 per cent of the population in this age group. The proportion for Queenslandwas 54.2 per cent.
In the region there were 35,597 persons with a bachelor degree or higher, 23,532 persons with an advanced diplomaor diploma, and 65,424 persons with a certificate. Of persons aged 15 years and over with a qualification, 23.2 percent had a bachelor degree or higher (29.3 per cent in Queensland), 15.3 per cent had an advanced diploma ordiploma (13.9 per cent in Queensland), and 42.6 per cent had a certificate (36.6 per cent in Queensland).
Table 18 Post-school qualifications by level of education by local government area (a), Moreton Bay Regional LGA, 2011
Local government area
Level of education
Bachelordegree orhigher (b)
Advanceddiploma or
diplomaCertificate
(c)Persons with a qualification (d)
Totalpersons
— number — number % number
Moreton Bay (R) 35,597 23,532 65,424 153,558 52.0 295,081
Queensland 548,894 260,778 686,993 1,875,323 54.2 3,456,875
Moreton Bay (R) LGA as % of Queensland 6.5 9.0 9.5 8.2 . . 8.5
. . = not applicable R = Regional
(a) Based on usual residents aged 15 years and over.(b) Includes bachelor degree, graduate diploma, graduate certificate and postgraduate degree.(c) Includes Certificate, I, II, III and IV and Certificates not further defined responses.(d) Persons aged 15 years and over, includes 'inadequately described' and 'not stated' level of education responses.
Note: Based on Australian Bureau of Statistics, Australian Statistical Geography Standard (ASGS), July 2011.Census data have 'introduced random error' to ensure no data are released which could risk identifying individuals. As such, cells containing very small counts should be treated with extreme caution.Queensland figures include the 'Migratory - Offshore - Shipping' and 'No Usual Address' counts.
Source: Australian Bureau of Statistics, Census of Population and Housing, 2011, Basic Community Profile - B37 and B40

Queensland Regional Profile Page 27
VOCATIONAL EDUCATION AND TRAINING STUDENTS
In 2011 the Moreton Bay Regional Local Government Area (LGA) had a total of 24,357 vocational education andtraining (VET) students. This was made up of 16,247 students commencing a VET course and 8,091 studentscontinuing a VET course. In comparison, Queensland had a total of 304,800 VET students.
Table 19 VET student numbers by enrolment type by local government area (a), Moreton Bay Regional LGA, 2011
Local government area Commencing students Continuing students Total (b)
number % number % number
Moreton Bay (R) 16,247 66.7 8,091 33.2 24,357
Queensland 203,580 66.8 100,454 33.0 304,800
Moreton Bay (R) LGA as % of Queensland 8.0 . . 8.1 . . 8.0
. . = not applicable R = Regional
(a) Based on the location of the student and not the location of the educational institute.(b) Includes Subject only students - no qualification.
Note: Based on Australian Bureau of Statistics, Australian Statistical Geography Standard (ASGS), July 2011.
Data are updated annually with an approximate delay of 12 months after the reporting period. It is anticipated the next update will be in September 2013.
Source: National Centre for Vocational Education Research (NCVER)

Queensland Regional Profile Page 28
CORE ACTIVITY NEED FOR ASSISTANCE
At the time of the 2011 Census, Moreton Bay Regional Local Government Area (LGA) had 18,167 persons in need ofassistance with a core activity, representing 4.8 per cent of the total population. In comparison, Queensland had192,019 persons in need of assistance with a core activity, representing 4.4 per cent of the total population.
Table 20 Number of persons with core activity need for assistance by local government area (a)(b), Moreton Bay Regional LGA, 2011
Local government area Need for assistance No need for assistance Total (c)
number % number % number
Moreton Bay (R) 18,167 4.8 341,172 90.2 378,043
Queensland 192,019 4.4 3,880,396 89.6 4,332,738
Moreton Bay (R) LGA as % of Queensland 9.5 . . 8.8 . . 8.7
. . = not applicable R = Regional
(a) Based on place of usual residence.(b) Core activity need for assistance measures people with a profound disability or severe disability. People with a profound or severe disability are defined as needing help or assistance in one or more of the three core activity areas of self-care, mobility and communication because of a long term health condition (six months or more), a disability (lasting six months or more), or old age.(c) Includes core activity need of assistance not stated.
Note: Based on Australian Bureau of Statistics, Australian Statistical Geography Standard (ASGS), July 2011.Census data have 'introduced random error' to ensure no data are released which could risk identifying individuals. As such, cells containing very small counts should be treated with extreme caution.Queensland figures include the 'Migratory - Offshore - Shipping' and 'No Usual Address' counts.
Source: ABS, Census of Population and Housing, 2011, Basic Community Profile - B18

Queensland Regional Profile Page 29
VOLUNTEERS
At the time of the 2011 Census, Moreton Bay Regional Local Government Area (LGA) had 50,951 volunteers aged 15years and over. This represented 17.3 per cent of total persons aged 15 years and over in the region. In comparison,Queensland recorded 645,543 volunteers, 18.7 per cent of total persons aged 15 years and over.
Table 21 Volunteers by local government area (a), Moreton Bay Regional LGA, 2011
Local government area Volunteer Not a volunteer Total (b)
number % number % number
Moreton Bay (R) 50,951 17.3 222,952 75.6 295,081
Queensland 645,543 18.7 2,521,658 72.9 3,456,877
Moreton Bay (R) LGA as % of Queensland 7.9 . . 8.8 . . 8.5
. . = not applicable R = Regional
(a) Based on usual residents aged 15 years and over.(b) Includes voluntary work not stated.
Note: Based on Australian Bureau of Statistics, Australian Statistical Geography Standard (ASGS), July 2011.Census data have 'introduced random error' to ensure no data are released which could risk identifying individuals. As such, cells containing very small counts should be treated with extreme caution.Queensland figures include the 'Migratory - Offshore - Shipping' and 'No Usual Address' counts.
Source: ABS, Census of Population and Housing, 2011, Basic Community Profile - B19

Queensland Regional Profile Page 30
AGED CARE SERVICES
As at 30 June 2012, Moreton Bay Regional Local Government Area (LGA) had 59 aged care services with a total of3,317 operational places. In comparison, Queensland had 1,051 aged care services with a total of 46,060 operationalplaces. During 2011–12, the aged care services in the region received $140.1 million in Australian governmentrecurrent funding.
Table 22 Aged care services (a)(b) by local government area, Moreton Bay Regional LGA, 30 June 2012
Local government areaAged care
services
Number of places by care type
Australianfunding (f)
Community care (c)
Residentialaged care (d)
Transitioncare (e)
Totalplaces
number — number — $m
Moreton Bay (R) 59 635 2,682 0 3,317 140.1
Queensland 1,051 11,368 33,959 733 46,060 1,812.9
Moreton Bay (R) LGA as % of Queensland 5.6 5.6 7.9 0.0 7.2 7.7
. . = not applicable R = Regional
(a) Aged care services subsidised by the Australian Government under the Aged Care Act 1997.(b) Based on the location of the service, rather than the region in which the service is delivered. In some instances, aged care services may have provided the address information of their Approved Provider in place of the address information of the individual aged care service. Users should be aware of this limitation when using these data.(c) Community care services provide home-based care for older people wanting to remain living independently in their own home improving their quality of life and helping them to remain active and connected to their own communities. The figures here include Mainstream Packaged Care places provided by Community Aged Care Package (CACP), Extended Aged Care at Home (EACH), and Extended Aged Care at Home Dementia (EACHD) services, and Flexible Care places provided in a community setting by Multi-Purpose Services (MPS), Innovative Care, Consumer Directed Care (CDC), and National Aboriginal and Torres Strait Islander Aged Care (NATSI) Services.(d) Residential Aged Care provides a range of supported accommodation services for older people who are unable to continue living independently in their own homes. The figures here include Mainstream Residential Aged Care places provided by Residential Aged Care Services (RACS), and Flexible Care places provided in a Residential setting by Multi-Purpose Services (MPS), and National Aboriginal and Torres Strait Islander Aged Care (NATSI) Services.(e) Transition care program provides a package of services to enable older people after a hospital stay to return home rather than prematurely enter residential care. The program also gives older people and their families and carers time to consider long-term care arrangements.(f) Australian government recurrent funding for aged care services in 2011–12.
Note: Based on Australian Bureau of Statistics, Australian Statistical Geography Standard (ASGS), July 2011.
Data are updated annually with an approximate delay of 12 months after the reporting period. It is anticipated the next update will be in January 2014.
Source: Australian Government Department of Health and Ageing

Queensland Regional Profile Page 31
EMERGENCY SERVICES, SCHOOLS AND HOSPITALS
As at 30 June 2010, Moreton Bay Regional Local Government Area (LGA) had 10 police stations, 10 ambulancestations, 10 fire stations, 94 schools and 7 hospitals. In comparison, Queensland had 340 police stations, 262ambulance stations, 243 fire stations, 1,734 schools and 271 hospitals.
Table 23 Emergency services, schools and hospitals by local government area, Moreton Bay Regional LGA, 30 June 2010
Local government areaPolice
stations (a)Ambulance
stationsFire
stations (b) Schools (c) Hospitals (d)
— number —
Moreton Bay (R) 10 10 10 94 7
Queensland 340 262 243 1,734 271
Moreton Bay (R) LGA as % of Queensland 2.9 3.8 4.1 5.4 2.6
. . = not applicable R = Regional
(a) Does not include Police Beats.(b) Does not include Rural Fire Brigade.(c) Includes both private and public schools and counts the main campus only.(d) Includes both private and public hospitals. Excludes public dental and psychiatric facilities.
Note: Based on Australian Bureau of Statistics, Australian Statistical Geography Standard (ASGS), July 2011.
Data are updated every two years. It is anticipated the next update will be in October 2013.
Source: Queensland Police; Department of Community Safety; Department of Education, Training and Employment; Queensland Health
Queensland Regional Profile Page 32
SOCIO-ECONOMIC INDEX OF DISADVANTAGE
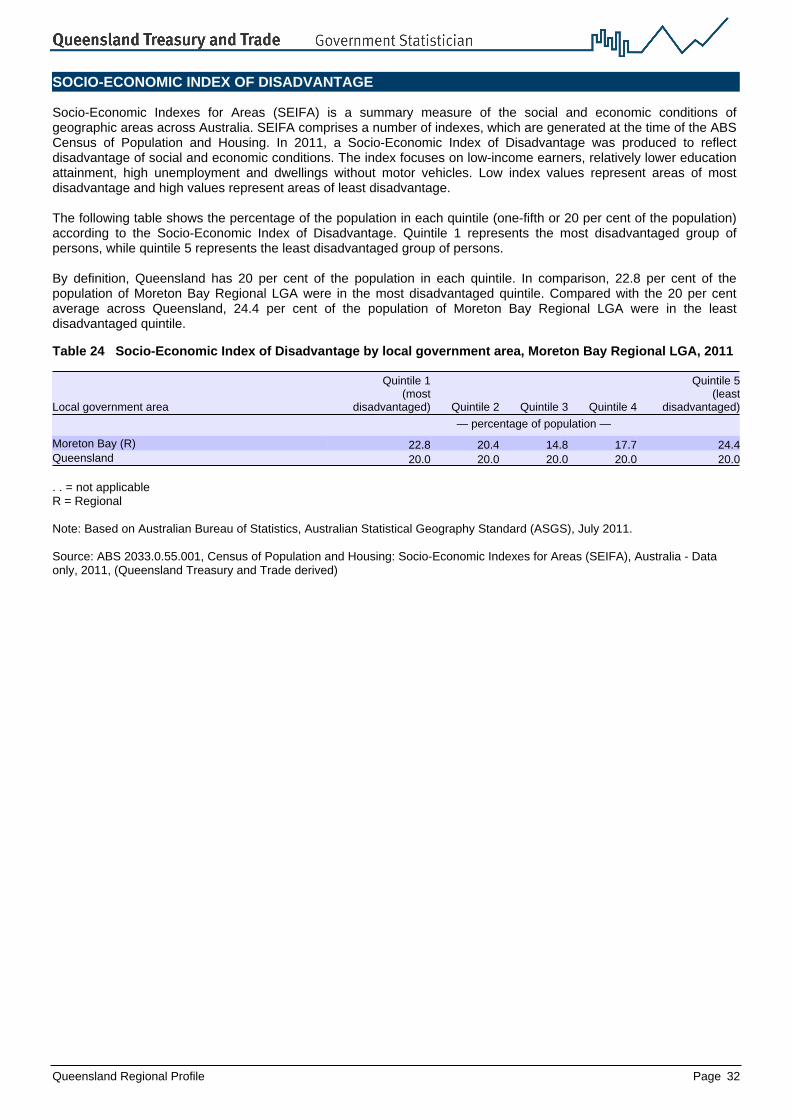
Socio-Economic Indexes for Areas (SEIFA) is a summary measure of the social and economic conditions ofgeographic areas across Australia. SEIFA comprises a number of indexes, which are generated at the time of the ABSCensus of Population and Housing. In 2011, a Socio-Economic Index of Disadvantage was produced to reflectdisadvantage of social and economic conditions. The index focuses on low-income earners, relatively lower educationattainment, high unemployment and dwellings without motor vehicles. Low index values represent areas of mostdisadvantage and high values represent areas of least disadvantage.
The following table shows the percentage of the population in each quintile (one-fifth or 20 per cent of the population)according to the Socio-Economic Index of Disadvantage. Quintile 1 represents the most disadvantaged group ofpersons, while quintile 5 represents the least disadvantaged group of persons.
By definition, Queensland has 20 per cent of the population in each quintile. In comparison, 22.8 per cent of thepopulation of Moreton Bay Regional LGA were in the most disadvantaged quintile. Compared with the 20 per centaverage across Queensland, 24.4 per cent of the population of Moreton Bay Regional LGA were in the leastdisadvantaged quintile.
Table 24 Socio-Economic Index of Disadvantage by local government area, Moreton Bay Regional LGA, 2011
Local government area
Quintile 1(most
disadvantaged) Quintile 2 Quintile 3 Quintile 4
Quintile 5(least
disadvantaged)
— percentage of population —
Moreton Bay (R) 22.8 20.4 14.8 17.7 24.4Queensland 20.0 20.0 20.0 20.0 20.0
. . = not applicable R = Regional
Note: Based on Australian Bureau of Statistics, Australian Statistical Geography Standard (ASGS), July 2011.
Source: ABS 2033.0.55.001, Census of Population and Housing: Socio-Economic Indexes for Areas (SEIFA), Australia - Data only, 2011, (Queensland Treasury and Trade derived)

Queensland Regional Profile Page 33
REMOTENESS
In this section, the measure of remoteness has been determined using the ARIA+ (Accessibility/Remoteness Index ofAustralia) classification. At the time of the 2011 Census, in Moreton Bay Regional Local Government Area (LGA), 90.5per cent of the population were in major cities and 0.0 per cent were in very remote Australia. In comparison, 61.6 percent of the population in Queensland were in major cities and 1.3 per cent were in very remote Australia.
Table 25 Population (a) in remoteness areas (b) by local government area, Moreton Bay Regional LGA, 2011
Local government area Major City
InnerRegionalAustralia
OuterRegionalAustralia
RemoteAustralia
VeryRemoteAustralia
population % population % population % population % population %
Moreton Bay (R) 342,208 90.5 35,837 9.5 0 0.0 0 0.0 0 0.0
Queensland 2,663,104 61.6 885,169 20.5 639,744 14.8 75,599 1.8 56,106 1.3
Moreton Bay (R) LGA as % of Queensland 12.9 . . 4.0 . . 0.0 . . 0.0 . . 0.0 . .
. . = not applicable R = Regional
(a) Population based on 2011 usual resident population.(b) Based on the Australian Bureau of Statistics Remoteness Area (RA) classification using ARIA+ mean scores.
Note: Based on Australian Bureau of Statistics, Australian Statistical Geography Standard (ASGS), July 2011.
Source: Australian Population and Migration Research Centre, University of Adelaide; ABS, Census of Population and Housing, 2011

Queensland Regional Profile Page 34
TOTAL PERSONAL INCOME
At the time of the 2011 Census, Moreton Bay Regional Local Government Area (LGA) had 103,875 persons aged 15years and over who stated that their total personal weekly income was less than $400 (35.2 per cent of all personsaged 15 years and over). This was higher than the 34.6 per cent recorded in Queensland.
Table 26 Number of persons by total personal weekly income by local government area (a), Moreton Bay Regional LGA, 2011
Local government area
Less than $400
per week$400 to $999
per week
$1,000 to $1,999
per week
$2,000 or more
per weekTotal
(b)
number % number % number % number % number
Moreton Bay (R) 103,875 35.2 97,258 33.0 60,183 20.4 12,850 4.4 295,081
Queensland 1,195,059 34.6 1,095,509 31.7 689,495 19.9 191,236 5.5 3,456,877
Moreton Bay (R) LGA as % of Queensland 8.7 . . 8.9 . . 8.7 . . 6.7 . . 8.5
. . = not applicable R = Regional
(a) Based on usual residents aged 15 years and over.(b) Includes personal income not stated.
Note: Based on Australian Bureau of Statistics, Australian Statistical Geography Standard (ASGS), July 2011.Census data have 'introduced random error' to ensure no data are released which could risk identifying individuals. As such, cells containing very small counts should be treated with extreme caution.Queensland figures include the 'Migratory - Offshore - Shipping' and 'No Usual Address' counts.
Source: ABS, Census of Population and Housing, 2011, Basic Community Profile - B17

Queensland Regional Profile Page 35
UNEMPLOYMENT AND LABOUR FORCE
The number of unemployed persons aged 15 years and over (based on a smoothed series) in Moreton Bay RegionalLocal Government Area (LGA) in December quarter 2012 was 10,878. This represented an unemployment rate of 5.8per cent. In comparison, Queensland had a smoothed unemployment rate of 5.8 per cent.
Table 27 Unemployment and labour force (a) by local government area, Moreton Bay Regional LGA, December quarter 2012
Local government area Unemployed Labour forceUnemployment
rate
— number — %
Moreton Bay (R) 10,878 187,226 5.8
Queensland 143,637 2,480,728 5.8
Moreton Bay (R) LGA as % of Queensland 7.6 7.5 . .
. . = not applicable R = Regional
(a) Based on a 4-quarter smoothed series.
Note: DEEWR Small Area Labour Market data are published at an ASGC 2006. These data are not yet available at ASGS 2011 geographies. Therefore, as an interim measure, DEEWR Small Area Labour Market data have been concorded to the new ASGS 2011 from Statistical Local Area (SLA) (ASGC 2011) using both an unemployment based concordance and a labour force based concordance. Concordances were derived from Census 2011 data. As such ASGS 2011 Small Area Labour Market data should be used with caution and regions with a small labour treated with extreme caution.Small Area Labour Force data have been generated from a Structure Preserving Estimation (SPREE) methodology using ABS and Centrelink data. As such these estimates can exhibit considerable variability and care should be taken when interpreting these values. For further information on these data, refer to the DEEWR website.In December 2012, the ABS revised their regional labour force figures which necessitated a revision of the Small Area Labour Markets data by DEEWR. The revisions to the ABS regional data mean that some of the previously published Small Area Labour Markets (SALM) figures will no longer match previous estimates contained within this, and future, Small Area Labour Markets data releases.
Note: Based on Australian Bureau of Statistics, Australian Statistical Geography Standard (ASGS), July 2011.Data for local government areas (2011) have been derived from the source data using a population-based concordance.
Data are updated quarterly with an approximate delay of 3 months after the reporting period. It is anticipated the next update will be in July 2013.
Source: DEEWR, Australian Government Department of Education, Employment and Workplace Relations, Small Area Labour Markets Australia, various editions

Queensland Regional Profile Page 36
The unemployment rate in Moreton Bay Regional Local Government Area (LGA) for the December quarter 2012 was5.8 per cent, compared with 5.8 per cent in Queensland. Between the March quarter 2011 and the December quarter2012, the unemployment rate in the region ranged between 4.6 per cent (June quarter 2011) and 5.8 per cent(December quarter 2012).
Figure 5 Unemployment rate (a), Moreton Bay Regional LGA and Queensland, March quarter 2011 to December quarter 2012
(a) Based on a 4-quarter smoothed series.
Note: DEEWR Small Area Labour Market data are published at an ASGC 2006. These data are not yet available at ASGS 2011 geographies. Therefore, as an interim measure, DEEWR Small Area Labour Market data have been concorded to the new ASGS 2011 from Statistical Local Area (SLA) (ASGC 2011) using both an unemployment based concordance and a labour force based concordance. Concordances were derived from Census 2011 data. As such ASGS 2011 Small Area Labour Market data should be used with caution and regions with a small labour treated with extreme caution.Small Area Labour Force data have been generated from a Structure Preserving Estimation (SPREE) methodology using ABS and Centrelink data. As such these estimates can exhibit considerable variability and care should be taken when interpreting these values. For further information on these data, refer to the DEEWR website.In December 2012, the ABS revised their regional labour force figures which necessitated a revision of the Small Area Labour Markets data by DEEWR. The revisions to the ABS regional data mean that some of the previously published Small Area Labour Markets (SALM) figures will no longer match previous estimates contained within this, and future, Small Area Labour Markets data releases.
Note: Based on Australian Bureau of Statistics, Australian Statistical Geography Standard (ASGS), July 2011.Data for local government areas (2011) have been derived from the source data using a population-based concordance.
Source: DEEWR, Australian Government Department of Education, Employment and Workplace Relations, Small Area Labour Markets Australia, various editions

Queensland Regional Profile Page 37
EMPLOYMENT BY INDUSTRY
At the time of the 2011 Census, Health Care and Social Assistance was the largest industry of employment forMoreton Bay Regional Local Government Area (LGA) usual residents, with 22,245 persons or 12.7 per cent of theemployed labour force. Other industries with relatively large numbers of employed persons included Retail Trade(20,073 persons or 11.5 per cent) and Construction (17,442 persons or 10.0 per cent).
A specialisation ratio measures the representation of an industry's share within the Moreton Bay Regional LGA,relative to Queensland's industry share. The highest specialisation ratios in the region occurred in the industries ofTransport, Postal and Warehousing (1.23), Manufacturing (1.17) and Electricity, Gas, Water and Waste Services(1.16).
Table 28 Employment by industry (a)(b), Moreton Bay Regional LGA, 2011
IndustryMoreton Bay Regional
LGA Queensland Specialisation ratio (c)
number % number % number
Agriculture, Forestry and Fishing 1,708 1.0 55,416 2.7 0.36Mining 1,896 1.1 52,955 2.6 0.42Manufacturing 17,236 9.9 171,669 8.4 1.17Electricity, Gas, Water and Waste Services 2,464 1.4 24,828 1.2 1.16Construction 17,442 10.0 183,780 9.0 1.11Wholesale Trade 6,760 3.9 74,288 3.6 1.06Retail Trade 20,073 11.5 217,610 10.7 1.08Accommodation and Food Services 9,830 5.6 141,855 7.0 0.81Transport, Postal and Warehousing 11,284 6.5 107,072 5.3 1.23Information Media and Telecommunications 2,092 1.2 25,358 1.2 0.96Financial and Insurance Services 4,893 2.8 54,153 2.7 1.06Rental, Hiring and Real Estate Services 3,008 1.7 37,007 1.8 0.95Professional, Scientific and Technical Services 9,986 5.7 132,754 6.5 0.88Administrative and Support Services 5,586 3.2 65,015 3.2 1.00Public Administration and Safety 12,741 7.3 136,818 6.7 1.09Education and Training 12,115 6.9 160,921 7.9 0.88Health Care and Social Assistance 22,245 12.7 242,559 11.9 1.07Arts and Recreation Services 2,041 1.2 28,444 1.4 0.84Other Services 7,235 4.1 78,713 3.9 1.07
Total (d) 174,488 100.0 2,039,275 100.0 1.00
. . = not applicable
(a) Employed persons aged 15 years and over.(b) Industry of employment was coded to the ABS 2006 Australian and New Zealand Standard Industrial Classification (ANZSIC). This has replaced the 1993 ANZSIC edition. (c) The ratio of the percentage for the Moreton Bay Regional LGA to the percentage for Queensland.(d) Includes inadequately described and not stated responses.
Note: Based on Australian Bureau of Statistics, Australian Statistical Geography Standard (ASGS), July 2011.Census data have 'introduced random error' to ensure no data are released which could risk identifying individuals. As such, cells containing very small counts should be treated with extreme caution.Queensland figures include the 'Migratory - Offshore - Shipping' and 'No Usual Address' counts.
Source: ABS, Census of Population and Housing, 2011, Basic Community Profile - B43

Queensland Regional Profile Page 38
The following figure highlights the differences in employment by industry groups between Moreton Bay Regional LGAand Queensland as at 2011
Figure 6 Proportion of employment by industry (a), Moreton Bay Regional LGA and Queensland, 2011
(a) Industry of employment was coded to the ABS 2006 Australian and New Zealand Standard Industrial Classification (ANZSIC). This has replaced the 1993 ANZSIC edition.
Note: Based on Australian Bureau of Statistics, Australian Statistical Geography Standard (ASGS), July 2011.
Source: ABS, Census of Population and Housing, 2011, Basic Community Profile - B43
Queensland Regional Profile Page 39
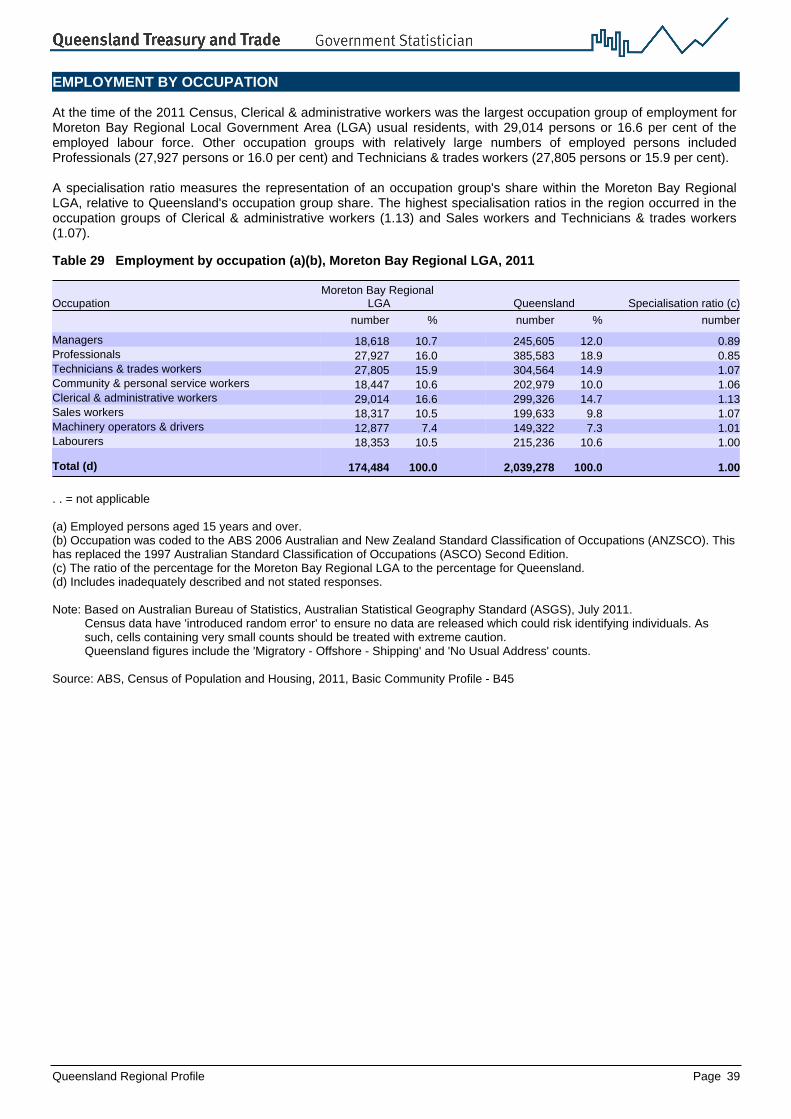
EMPLOYMENT BY OCCUPATION
At the time of the 2011 Census, Clerical & administrative workers was the largest occupation group of employment forMoreton Bay Regional Local Government Area (LGA) usual residents, with 29,014 persons or 16.6 per cent of theemployed labour force. Other occupation groups with relatively large numbers of employed persons includedProfessionals (27,927 persons or 16.0 per cent) and Technicians & trades workers (27,805 persons or 15.9 per cent).
A specialisation ratio measures the representation of an occupation group's share within the Moreton Bay RegionalLGA, relative to Queensland's occupation group share. The highest specialisation ratios in the region occurred in theoccupation groups of Clerical & administrative workers (1.13) and Sales workers and Technicians & trades workers(1.07).
Table 29 Employment by occupation (a)(b), Moreton Bay Regional LGA, 2011
OccupationMoreton Bay Regional
LGA Queensland Specialisation ratio (c)
number % number % number
Managers 18,618 10.7 245,605 12.0 0.89Professionals 27,927 16.0 385,583 18.9 0.85Technicians & trades workers 27,805 15.9 304,564 14.9 1.07Community & personal service workers 18,447 10.6 202,979 10.0 1.06Clerical & administrative workers 29,014 16.6 299,326 14.7 1.13Sales workers 18,317 10.5 199,633 9.8 1.07Machinery operators & drivers 12,877 7.4 149,322 7.3 1.01Labourers 18,353 10.5 215,236 10.6 1.00
Total (d) 174,484 100.0 2,039,278 100.0 1.00
. . = not applicable
(a) Employed persons aged 15 years and over.(b) Occupation was coded to the ABS 2006 Australian and New Zealand Standard Classification of Occupations (ANZSCO). This has replaced the 1997 Australian Standard Classification of Occupations (ASCO) Second Edition. (c) The ratio of the percentage for the Moreton Bay Regional LGA to the percentage for Queensland.(d) Includes inadequately described and not stated responses.
Note: Based on Australian Bureau of Statistics, Australian Statistical Geography Standard (ASGS), July 2011.Census data have 'introduced random error' to ensure no data are released which could risk identifying individuals. As such, cells containing very small counts should be treated with extreme caution.Queensland figures include the 'Migratory - Offshore - Shipping' and 'No Usual Address' counts.
Source: ABS, Census of Population and Housing, 2011, Basic Community Profile - B45

Queensland Regional Profile Page 40
The following figure highlights the differences in the proportion of employment by occupation between the MoretonBay Regional LGA and Queensland as at 2011
Figure 7 Proportion of employment by occupation (a), Moreton Bay Regional LGA and Queensland, 2011
(a) Occupation was coded to the ABS 2006 Australian and New Zealand Standard Classification of Occupations (ANZSCO). This has replaced the 1997 Australian Standard Classification of Occupations (ASCO) Second Edition.
Note: Based on Australian Bureau of Statistics, Australian Statistical Geography Standard (ASGS), July 2011.
Source: ABS, Census of Population and Housing, 2011, Basic Community Profile - B45

Queensland Regional Profile Page 41
PLACE OF WORK BY INDUSTRY OF EMPLOYMENT
Place of work data provides information on people who are employed in a particular geographic area. Persons arecounted based on place of employment as opposed to place of usual residence.
At the time of the 2011 Census, Retail Trade was the largest industry of employment for employed persons working inMoreton Bay Regional Local Government Area (LGA), with 14,056 persons or 15.7 per cent of the employed labourforce. Other industries with relatively large numbers of employed persons included Health Care and Social Assistance(12,957 persons or 14.5 per cent) and Education and Training (9,181 persons or 10.3 per cent).
A specialisation ratio measures the representation of an industry's share within the Moreton Bay Regional LGA,relative to Queensland's industry share. The highest specialisation ratios in the region occurred in the industries ofRetail Trade (1.46), Education and Training (1.28) and Manufacturing and Health Care and Social Assistance (1.20).
Table 30 Place of work (a) by industry of employment (b)(c), Moreton Bay Regional LGA, 2011
IndustryMoreton Bay Regional
LGA QueenslandSpecialisation
ratio (d)
number % number % number
Agriculture, Forestry and Fishing 1,420 1.6 54,563 2.7 0.58Mining 301 0.3 51,656 2.6 0.13Manufacturing 9,138 10.2 169,025 8.5 1.20Electricity, Gas, Water and Waste Services 921 1.0 24,764 1.2 0.83Construction 7,281 8.1 179,947 9.0 0.90Wholesale Trade 3,314 3.7 73,377 3.7 1.01Retail Trade 14,056 15.7 214,617 10.8 1.46Accommodation and Food Services 6,945 7.8 140,036 7.0 1.10Transport, Postal and Warehousing 3,105 3.5 104,924 5.3 0.66Information Media and Telecommunications 551 0.6 25,282 1.3 0.49Financial and Insurance Services 1,837 2.1 53,833 2.7 0.76Rental, Hiring and Real Estate Services 1,872 2.1 36,875 1.9 1.13Professional, Scientific and Technical Services 4,298 4.8 131,921 6.6 0.73Administrative and Support Services 2,270 2.5 64,185 3.2 0.79Public Administration and Safety 3,925 4.4 135,586 6.8 0.64Education and Training 9,181 10.3 160,241 8.0 1.28Health Care and Social Assistance 12,957 14.5 240,017 12.1 1.20Arts and Recreation Services 1,038 1.2 28,418 1.4 0.81Other Services 4,169 4.7 78,157 3.9 1.19
Total (e) 89,451 100.0 1,991,753 100.0 1.00
. . = not applicable
(a) Based on the location of the person's workplace in the week prior to the Census.(b) Employed persons aged 15 years and over.(c) Industry of employment was coded to the ABS 2006 Australian and New Zealand Standard Industrial Classification (ANZSIC). This has replaced the 1993 ANZSIC edition. (d) The ratio of the percentage for the Moreton Bay Regional LGA to the percentage for Queensland.(e) Includes inadequately described and not stated responses.
Note: Based on Australian Bureau of Statistics, Australian Statistical Geography Standard (ASGS), July 2011.Census data have 'introduced random error' to ensure no data are released which could risk identifying individuals. As such, cells containing very small counts should be treated with extreme caution.Queensland figures include the 'Greater Brisbane undefined', 'Queensland undefined', 'Migratory - Offshore - Shipping' and 'No Usual Address' counts.
Source: ABS, Census of Population and Housing, 2011, unpublished data

Queensland Regional Profile Page 42
PLACE OF WORK BY OCCUPATION OF EMPLOYMENT
Place of work data provides information on people who are employed in a particular geographic area. Persons arecounted based on place of employment as opposed to place of usual residence.
At the time of the 2011 Census, Professionals was the largest occupation group of employment for employed personsworking in Moreton Bay Regional Local Government Area (LGA), with 15,098 persons or 16.9 per cent of theemployed labour force. Other occupation groups with relatively large numbers of employed persons included Clerical& administrative workers (12,814 persons or 14.3 per cent) and Technicians & trades workers (12,690 persons or 14.2per cent).
A specialisation ratio measures the representation of an occupation group's share within the Moreton Bay RegionalLGA, relative to Queensland's occupation group share. The highest specialisation ratios in the region occurred in theoccupation groups of Sales workers (1.37) and Community & personal service workers (1.24).
Table 31 Place of work (a) by occupation of employment (b)(c), Moreton Bay Regional LGA, 2011
OccupationMoreton Bay Regional
LGA Queensland Specialisation ratio (d)
number % number % number
Managers 10,098 11.3 241,978 12.1 0.93Professionals 15,098 16.9 381,982 19.2 0.88Technicians & trades workers 12,690 14.2 297,822 15.0 0.95Community & personal service workers 11,079 12.4 199,647 10.0 1.24Clerical & administrative workers 12,814 14.3 296,176 14.9 0.96Sales workers 12,080 13.5 196,709 9.9 1.37Machinery operators & drivers 5,338 6.0 145,597 7.3 0.82Labourers 9,505 10.6 209,315 10.5 1.01
Total (e) 89,451 100.0 1,991,753 100.0 1.00
. . = not applicable
(a) Based on the location of the person's workplace in the week prior to the Census.(b) Employed persons aged 15 years and over.(c) Occupation was coded to the ABS 2006 Australian and New Zealand Standard Classification of Occupations (ANZSCO). This has replaced the 1997 Australian Standard Classification of Occupations (ASCO) Second Edition. (d) The ratio of the percentage for the Moreton Bay Regional LGA to the percentage for Queensland.(e) Includes inadequately described and not stated responses.
Note: Based on Australian Bureau of Statistics, Australian Statistical Geography Standard (ASGS), July 2011.Census data have 'introduced random error' to ensure no data are released which could risk identifying individuals. As such, cells containing very small counts should be treated with extreme caution.Queensland figures include the 'Greater Brisbane undefined', 'Queensland undefined', 'Migratory - Offshore - Shipping' and 'No Usual Address' counts.
Source: ABS, Census of Population and Housing, 2011, unpublished data

Queensland Regional Profile Page 43
RESIDENTIAL DWELLING SALES
In the 12 months ending 30 September 2012, there were a total of 7,282 residential dwelling sales in Moreton BayRegional Local Government Area (LGA), comprising 79.2 per cent detached residential dwellings and 20.8 per centattached residential dwellings. The total number of residential dwelling sales in Moreton Bay Regional LGA made up7.9 per cent of total residential dwelling sales in Queensland. Of the 7,282 residential dwelling sales in Moreton BayRegional LGA, the median sale price was $360,000.
Table 32 Residential dwelling sales (a) by local government area, Moreton Bay Regional LGA, 12 months ending 30 September 2012 (b)
Local government area
Number of sales Median sale price
Detached dwellings (c)
Attached dwellings (d)
Total dwellings
Detached dwellings (c)
Attached dwellings (d)
Total dwellings
— number — — $ —
Moreton Bay (R) 5,765 1,517 7,282 375,000 331,000 360,000
Queensland 64,684 27,244 91,928 392,000 346,000 380,000
Moreton Bay (R) LGA as % of Queensland 8.9 5.6 7.9 . . . . . .
. . = not applicable R = Regional
(a) Includes both new and established dwellings.(b) All reporting periods are based on the contract date and not the settlement date.(c) Single unit dwelling or a dwelling large house site.(d) Multi unit dwelling (flat), building units or group titles within planning zones.
Note: Based on Australian Bureau of Statistics, Australian Statistical Geography Standard (ASGS), July 2011.All figures are preliminary and are subject to further revision.
Data are updated quarterly with an approximate delay of 6 months after the reporting period. It is anticipated the next update will be in July 2013.
Source: Department of Natural Resources and Mines, Office of the Valuer-General, Property Sales

Queensland Regional Profile Page 44
The median value of residential dwelling sales in the Moreton Bay Regional Local Government Area (LGA) decreasedby 2.7 per cent to $360,000 from 12 months ending 30 September 2011 to 12 months ending 30 September 2012. Incomparison, the median value of residential dwelling sales in Queensland decreased by 2.1 per cent over the sameperiod.
Figure 8 Median value of residential dwelling sales (a), Moreton Bay Regional LGA and Queensland, 12 months ending 30 September 2003 to 12 months ending 30 September 2012 (b)
(a) Includes both new and established dwellings.(b) All reporting periods are based on the contract date and not the settlement date.
Note: Based on Australian Bureau of Statistics, Australian Statistical Geography Standard (ASGS), July 2011.All figures are preliminary and are subject to further revision.
Source: Department of Natural Resources and Mines, Office of the Valuer-General, Property Sales

Queensland Regional Profile Page 45
MOTOR VEHICLES PER DWELLING
At the time of the 2011 Census, Moreton Bay Regional Local Government Area (LGA) had 7,834 occupied privatedwellings with no motor vehicles, or 5.9 per cent of all occupied private dwellings in the region. In comparison, 7.2 percent of occupied private dwellings in Queensland had no motor vehicles.
Table 33 Number of motor vehicles per occupied private dwelling (a)(b) by local government area, Moreton Bay Regional LGA, 2011
Local government areaNo motor vehicles
1 motor vehicle
2 motor vehicles
3 or more motor vehicles
Totaldwellings
number % number % number % number % number
Moreton Bay (R) 7,834 5.9 44,465 33.5 51,502 38.8 25,257 19.0 132,605
Queensland 110,842 7.2 547,575 35.4 575,736 37.2 267,083 17.3 1,547,306
Moreton Bay (R) LGA as % of Queensland 7.1 . . 8.1 . . 8.9 . . 9.5 . . 8.6
. . = not applicable R = Regional
(a) Excludes visitors only and other not classifiable households.(b) Excludes motorbikes/scooters.
Note: Based on Australian Bureau of Statistics, Australian Statistical Geography Standard (ASGS), July 2011.Census data have 'introduced random error' to ensure no data are released which could risk identifying individuals. As such, cells containing very small counts should be treated with extreme caution.
Source: ABS, Census of Population and Housing, 2011, Basic Community Profile - B29
Queensland Regional Profile Page 46
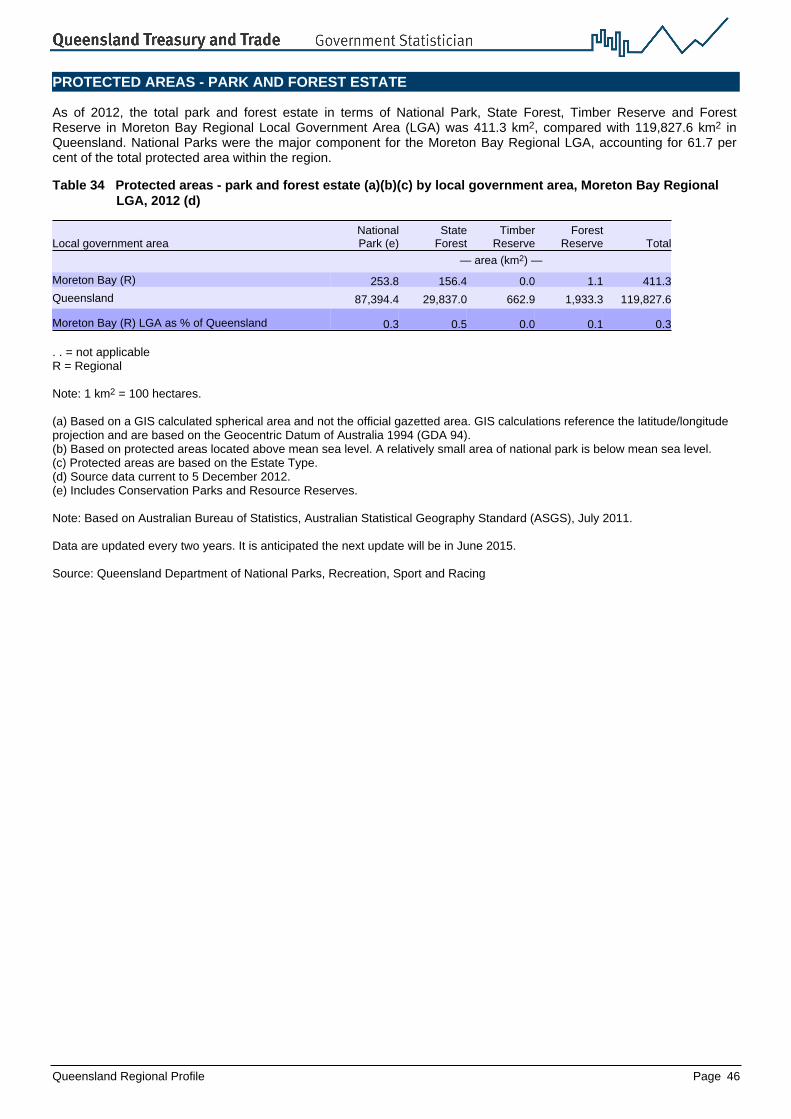
PROTECTED AREAS - PARK AND FOREST ESTATE
As of 2012, the total park and forest estate in terms of National Park, State Forest, Timber Reserve and ForestReserve in Moreton Bay Regional Local Government Area (LGA) was 411.3 km2, compared with 119,827.6 km2 inQueensland. National Parks were the major component for the Moreton Bay Regional LGA, accounting for 61.7 percent of the total protected area within the region.
Table 34 Protected areas - park and forest estate (a)(b)(c) by local government area, Moreton Bay Regional LGA, 2012 (d)
Local government areaNationalPark (e)
StateForest
TimberReserve
ForestReserve Total
— area (km2) —
Moreton Bay (R) 253.8 156.4 0.0 1.1 411.3
Queensland 87,394.4 29,837.0 662.9 1,933.3 119,827.6
Moreton Bay (R) LGA as % of Queensland 0.3 0.5 0.0 0.1 0.3
. . = not applicable R = Regional
Note: 1 km2 = 100 hectares.
(a) Based on a GIS calculated spherical area and not the official gazetted area. GIS calculations reference the latitude/longitude projection and are based on the Geocentric Datum of Australia 1994 (GDA 94).(b) Based on protected areas located above mean sea level. A relatively small area of national park is below mean sea level.(c) Protected areas are based on the Estate Type.(d) Source data current to 5 December 2012.(e) Includes Conservation Parks and Resource Reserves.
Note: Based on Australian Bureau of Statistics, Australian Statistical Geography Standard (ASGS), July 2011.
Data are updated every two years. It is anticipated the next update will be in June 2015.
Source: Queensland Department of National Parks, Recreation, Sport and Racing


