QUEUING MANAGEMENT PRACTICES AND CUSTOMER SATISFACTION AMONG MOBILE PHONE CUSTOMER CARE CENTERS IN NAIROBI ANN NYAGUTHII MAINA A RESEARCH PROJECT SUBMITTED IN PARTIAL FULFILLMENT OF THE REQUIREMENTS FOR THE AWARD OF THE DEGREE OF MASTER OF BUSINESS ADMINISTRATION, SCHOOL OF BUSINESS, UNIVERSITY OF NAIROBI NOVEMBER 2013
Transcript
QUEUING MANAGEMENT PRACTICES AND
CUSTOMER SATISFACTION AMONG MOBILE PHONE
CUSTOMER CARE CENTERS IN NAIROBI
ANN NYAGUTHII MAINA
A RESEARCH PROJECT SUBMITTED IN PARTIAL FULFILLMENT OF THE
REQUIREMENTS FOR THE AWARD OF THE DEGREE OF MASTER OF
BUSINESS ADMINISTRATION, SCHOOL OF BUSINESS, UNIVER SITY OF
NAIROBI
NOVEMBER 2013
ii
DECLARATION
I the undersigned, declare that this is my original work and has not been submitted to any
other college, institution or university other than the University of Nairobi for academic
credit.
Signed…………………………. Date………………………..
ANN NYAGUTHII MAINA
REG: D61/60077/2011
Approval
This project has been presented for examination with my approval as the appointed
supervisor.
Signed………………………….. Date………………
ERNEST O. AKELO Senior Lecturer, School of Business, University of Nairobi
iii
DEDICATION
To God, for His continued and amazing spiritual support.
To my parents: David Maina and Esther Waihuini and my siblings Elijah Mbogo, Dedan
Kago and James Mwangi for believing in me and for your encouragement and support.
iv
ACKNOWLEDGEMENT
My foremost gratitude goes to the almighty God for enabling and guiding me through my
academic life. To my supervisor Mr. Ernest O. Akelo for his guidance and invaluable
advice that came in quite handy in the preparation of this work. I also want to appreciate
Safaricom, Airtel, Orange and Yu mobile staffs who responded to the questionnaires for
taking their precious time when the company was quite busy. Above all, I owe a lot to my
classmates, my family members, workmates and friends for their immense moral and
spiritual support for this academic work.
v
ABSTRACT
The aim of this study was to determine the relationship between queuing management practices and customer satisfaction at the customer care centers for the mobile phone providers in Nairobi, and to establish the principles used to manage queues in these customer care centers. In order to satisfy the objectives, a survey was conducted in all the four mobile service providers in Nairobi. The research instrument used was Stata and descriptive statistics was used by way of percentages and frequency distributions to analyze data. The findings revealed that some mobile phone providers have implemented queuing management practices. However it was evident that others have not paid much attention to the queue management practices. It was also established that the major challenges to implementing these queue management practices were lack of knowledge and rigidity from prestige customers. The results indicated that the principles mostly used to manage queues in all the mobile service providers were floor management and the use of mobile staff. The study therefore recommends that all mobile service providers in Nairobi should endeavor to fully understand the queue management practices to be able to drive them to a more competitive edge. They should also ensure to be consistent to use the principles that will not only reduce the customers wait time but also increase the customer’s level of satisfaction.
vi
TABLE OF CONTENTS
DECLARATION ................................................................................................................ ii
DEDICATION................................................................................................................... iii
ACKNOWLEDGEMENT ................................................................................................. iv
ABSTRACT........................................................................................................................ v
LIST OF TABLES........................................................................................................... viii
LIST OF FIGURES ........................................................................................................... ix
ABBREVIATIONS ............................................................................................................ x
Figure 2.4: The Queuing System ...................................................................................... 19
x
ABBREVIATIONS
ATMs Automated Teller Machines
CBD Central Business District
CCK Communications Commission of Kenya
GP’s General Public
GSM Global System for Mobile
LCD Liquid Crystal Display
LIFO Last In First Out
LTD Limited
SMS Short Messaging Services
SWOT Strength Weakness Opportunity and Threats
1
CHAPTER ONE: INTRODUCTION
1.1 Background of the Study
Every organization which directly interacts with its customers confronts the issue of
queues. Whether we are in line at the grocery store checkout, the barbershop, in a bank,
hospital or in the supermarket, waiting our turn is part of our everyday life. In a
traditional non-queuing environment, customers can be left confused as to what line to
stand in or what counter to go to when called and distracted by noisy crowded
environment (Yechiali, 1995). In situations where facilities are limited and cannot satisfy
the demand made upon them, bottlenecks occur which manifest as queue but customers
are not interested in waiting in queues (Kelly, 2001). When customers wait in a queue,
there is the danger that waiting time will become excessive leading to the loss of some
customers to competitors (Kotler, 1999). But allowing them to serve themselves so easily
is a key factor in both keeping and attracting customers (Michael, 2001).
Operations management is the management of systems or processes that create goods and
/or provide services. Operations Management is the business function responsible for
planning, coordinating and controlling the resources needed to produce products and
services (William, 2009). Services are activities that provide some combination of time,
location, form and psychological value. The essence of the operations function is to add
value; the greater the value added the more effectiveness of these operations.
Understanding the nature of queues and learning how to manage them is one of the most
important areas in operations management. Queuing is a practical operations
management technique that is commonly used to determine staffing, scheduling and
inventory levels, and to improve customer satisfaction.
1.1.1 Queuing Theory and Practices
Queuing systems or waiting lines exist throughout society and their adequacy has strong
effect on quality of service and productivity. Queuing theory is concerned with
mathematical study of queues or (waiting lines), formulating mathematical models of
queues and measuring performance using these models. Queues ordinarily form
2
whenever the current demand for a service exceeds the current capacity to provide that
service. Because of difficulty in accurately predicting arrival pattern of customers for
service and/or how much time is required to provide service to each customer, accurate
decision regarding the capacity to be provided is made quite difficult. Excess service
capacity involves excessive costs due to under utilization and insufficient capacity to
meet peak loads, causes queues to become excessively long and customers may even quit
the waiting lines. The ultimate goal is to achieve an economic balance between the cost
of service (i.e. cost of idle facility and employee) and costs associated with waiting for
the service (i.e. social cost and cost of lost customers). Queuing theory does not directly
solve this problem, but tries to provide vital information required for taking decisions.
Queue management practices are measures that are put in place to ensure effectiveness
and efficiency of services. Some of these practices are; management of customers flow to
reduce actual wait time. This can be achieved by setting station lights to point customers
to open counters, audio cues to call customers to the right service points. Single line
queuing also inherently reduces the average waiting times. Assessing the psychological
impact of queuing to reduce perceived wait time is another practice. This can be done by
implementing distractions for example LCD screens to show promotions, reading
materials and display of merchandise. Thirdly, generating metrics for improving
productivity. This involves proactive monitoring of the queue. e.g. service time
monitoring and real time queue- analysts.
1.1.2 Customer Service and Satisfaction
Turban et al. (2002) refer customer service as a chain of activities intended to boost the
level of customer satisfaction. The importance of customer service varies by products,
industry and customer; defective or broken merchandise can be exchanged, often only
with a receipt and within a specified time frame. Retail stores often have a desk or
counter devoted to dealing with returns, exchanges and complaints, or will perform
related functions at the point of sale; the perceived success of such interactions being
dependent on employees “who can adjust themselves to the personality of the guest.
Some goals of customer service is to win new clients, exercise customer retention, entice
3
former clients back into the fold, and reduce the costs of marketing and to serve as many
customers as possible. Customer service effectiveness is the relationship between
customer service performance and market response which is measured with indicators
like performance levels, attributed importance ratings, customer satisfaction and attitude,
repurchase intention, increase in market share and turnover or margin (Maltz & Maltz,
1998).
For many customers, queuing for service is a negative experience (Scotland, 1991). Thus
the speed of service is increasingly becoming a very important attribute (Kart, Larson &
Larson 1991). Some people hate queuing so much that they would rather hire other
people to wait for them (Geist, 1984). For these reasons, the operations managers are
continuously seeking ways to speed up services, believing that waiting will affect service
evaluations negatively. Good service generates greater use from limitless pool of latent
demand. Satisfaction itself is adoptive in the sense a good service overstretched can cause
drop in satisfaction. Poor service retains some customers who are: persistent, rarely
satisfied, and have low expectations. But the rating further decreases as service improve
because of attracting more customers who are more critical and knowledgeable and want
even higher level of service.
Customer satisfaction should be number one priority in retail services. Though measuring
is difficult, customer satisfaction can be defined in simple terms as perception minus
expectation. Both expectation and perception of customer play crucial role in customer
satisfaction. The expectations are often derived from personal experience. Perceived
usefulness of service mainly measures the system's impact on individual’s effectiveness,
but it is not the only measure. It is often said in case of service organizations that the
perceived quality of service is realized at the moment of truth i.e., when the service
delivery personnel and customer come in contact for delivery and receipt of service and
thus emphasizing the importance of customer participation in service delivery process. In
other words, customer-service provider interaction plays vital role in determining the
level of customer satisfaction. Customer satisfaction has a linear relation with loyalty and
4
repeat use/purchase. We need to note the multiplying effects of happy and unhappy
customers. Often, a satisfied customer is the best advertisement for service organizations.
1.1.3 Mobile Service Provision
Mobile phones have become the primary form of telecommunication in both developed
and developing countries. The first billion mobile phones took around 20 years to sell
worldwide. Coverage has expanded and mobile phone subscriptions in developing
countries have increased by over 500% since 2000 (Wireless Intelligence 2007). The cell
phones can be the primary source to access information as Kennedy (2008) states.
Demand for cell phone in rural Kenya has exceeded expectations and as the urban market
becomes flooded, the rural costumers become the new target group indicates Fahamu
(2007). It is estimated from Shah (2007) that every month 100 000 new subscribers enters
the cell phone market in Kenya. The cell phones can be the primary source to access
information as Kennedy (2008) states. Demand for cell phone in rural Kenya has
exceeded expectations and as the urban market becomes flooded, the rural costumers
become the new target group indicates Fahamu (2007). It is estimated from Shah (2007)
that every month 100 000 new subscribers enters the cell phone market in Kenya.
Safaricom, Ltd is a leading mobile network operator in Kenya. It was formed in 1997 as a
fully owned subsidiary of Telkom Kenya. In May 2000, Vodafone group Plc of the
United Kingdom acquired a 40% stake and management responsibility for the company.
As of December 2012, Safaricom subscriber base was approximately 19.8 million. Its
main services and products include: Voice calling services, message services, mobile
banking services, internet services among others (www.safaricom.co.ke). Its main rival is
Airtel Kenya. Other rivals include Essar's YU and Orange Wireless (CCK, 2012).
Airtel Kenya ltd was launched in Kenya in 2000 as Kencell and rebranded to Zain in
2008 and finally Airtel in 2010. The company boasts of being Kenya's most innovative
mobile phone operator. The company offers a host of services which include; Airtel
Money, prepaid &postpaid plans, network connectivity, international roaming, and SMS
5
internet access (www.airtel.co.ke). Airtel Kenya has seen itself grow tremendously from
network connectivity and quality of services despite continuous rebranding. 2012. (CCK,
2012)
Telkom Kenya was established as a telecommunications operator under the Companies
Act in April 1999. The company provides integrated communications solutions in Kenya
with the widest range of voice and data services, fixed lines, mobile technology and
internet facilities for residential and business customers (Kiberen and Musiega and Juma,
2013). Telkom Kenya's partnership with France Telecom Group saw the launch of the
Orange brand in Kenya in 2008. Orange Telkom had a subscriber base of over 3.2 million
subscribers by December 2012 according to the (CCK, 2012) quarterly report.
Essar Telecom Kenya is Kenya’s fourth mobile cellular network under the brand “Yu
Mobile’’, launched in December, 2008. Yu Mobile grew its network coverage in Kenya
fast and boasts of this achievement within 10 months from the date of its launch. The
network had a subscriber base of over 2.4 million by December 2012 (CCK, 2012) .Yu
Mobile offers several innovative products and service offerings all target easier and more
convenient. The services include; Yu cash, internet services, SMS services, and voice call
services among others (www.yu.co.ke).
1.1.4 Customer Care Centers
Many telecommunication organizations have embraced relationship marketing with its
focus on maximizing customer lifetime value. In order to gain more profit share and to be
distinctive in the market place the service providers are taking different initiatives and
customer care center is one of the common and important initiative. And in the Customer
care center customer service has become an important component in this process. Hence,
managers are keenly interested in the effect of service changes on customer experience
and satisfaction. If customer’s experiences are not satisfactory, the relationship is likely
to be very short. Customer service is shaping in different ways in order to provide a better
service experience to the customer. Everybody has been offering gratuitous and blindly
obvious advice on how to improve the customer experience for years (Gilmore, 2001).
6
As the environment of Businesses is getting stiff day by day, companies are paying more
concentration on the customers. And to be more responsive to the customers, companies
have come out with the idea called “Customer Service” which has become the strength
for some of the companies. By the term Customer Care Center, it means the point of
contact for the customers of a particular company. Generally in Customer Care connects
customers with the right individual who responds to the various problems that the
customer is facing and also provide various information and help along with possible
solution to the problems. Moreover successful companies pay more concentration on the
Customer Care Center for the purpose of providing a better service experience to its
consumer (Bitner, & Zeithaml, 2003).
1.2 Research Problem
Queues occur both in everyday life and in business situations. Queues occur because
facilities are unable to meet the demand for the service which they have been set up to
provide. In other words, the facilities lack the capacity to deal with all the demand which
is put on them. Queues occur in GPs′ health centers; at box offices in theatres; at traffic
lights; at restaurants; and on airport runways. Indeed, the range and diversity of queues
are quite considerable (Proctor, 1994).
Management science has evolved techniques to help to deal with the problems created by
queues. Essentially, these methods aim to help to minimize the disturbance created by
queues. Assuming that it is possible to know in advance all the demands which will be
placed upon a service facility, the scheduling of the service facility in an efficient manner
is a relatively simple matter. Unfortunately, it is difficult to predict accurately when
demand will be placed on a facility and how much time will be required to provide the
needed service (Shioyama, 1991).
The usual purpose of applying queuing theory models or techniques is to facilitate the
identification of an adequate but not too liberal service facility. If the service provision is
too generous then the service facility will often be idle and incur unnecessary costs – e.g.
idle employees. On the other hand, where excessive waiting time exists because the
7
facility is inadequate, customer dissatisfaction can occur and a loss of important goodwill
ensue ((Proctor, 1994). Customers may not join a queue which is too long and even not
consider using such a facility at a later date. Therefore the queues need to be managed to
bring about equilibrium to both the firm production costs and the customers satisfaction.
Karen and Blaire (1989) conducted a study at a branch office of the bank of Boston. They
found out that increased distractions make the waiting experience more interesting and
tend to increase customer satisfaction. Also that expected time in queue tend to make
perceptions of waiting length more accurate but does not affect customer satisfaction.
The study also proved as perception of waiting time increased, customer satisfaction tend
to decrease. Gail and Scott (1995) did a study at a supermarket and found that customer
satisfaction/dissatisfaction is dependent not only on the perceived waiting time, but also
on the customer identification of the causes, as well as the stability and control of the
causes.
Maina (2010) found that customer satisfaction at Safaricom was rated good but not
excellent and revealed fairly inefficient customer service as the most likely cause for
dissatisfaction. On her SWOT analysis of Safaricom, one of the weaknesses noted were
the very long queues at the customer service offices leading to relatively low levels of
customer satisfaction. Davis and Heineke (1994) identified several factors which can
affect a customer’s perception on waiting and consequently his or her satisfaction with
the wait and suggested tactics for managing queues for each category of factors. Some of
these factors were, unfair versus fair waits, uncomfortable versus comfortable waits,
unexplained versus explained waits, unknown versus known waits, and initial versus
subsequent waits. Burns and Neisner (2006) found out that retailers whose customers
possess high expectations will need to place explicit attention on their customer’s
emotions. If a performance is deemed as negative, not only will the negative performance
affect level of satisfaction, but also the negative emotions associated with the poor
performance will also likely affect level of satisfaction.
Despite the availability of the social media channels which has become a major customer
service channel and the availability of the call center and email options, many customers
8
still prefer to use the retail services resulting in long queues. This study seeks to answer
the questions on whether queuing Practices can lead to improvement in customer service
delivery at the customer care centers for the mobile phone service providers in Kenya.
1.3 Research Objectives
The objectives of this study are;
i. To establish the principles used to manage queues in customer care centers for
mobile phone providers
ii. To determine the relationship between queuing management practices and
customer satisfaction at the customer care centers for the mobile phone providers
in Nairobi.
1.4 Value of the Study
Retail agents are the companies contact points and they actually represent the company in
general. Customers will rate the overall performance of the company depending on the
kind of service that they receive from the agents. Performance in terms of speed of
service, accuracy, courtesy and wait time.
The study will therefore help managers in various organizations understand how they can
manage queues to improve service quality and customer satisfaction, hence increasing
growth of the organization. The study will also highlight what is expected of the
company to succeed in use of queuing as an operation management technique.
The study will be quite enriching to researchers, academic institutions and scholars. This
is because it will add to their knowledge and enable them to be more informed when
considering the impacts of queuing to an organization.
The study will also be helpful to the customers as reduced waiting time will transform to
a more pleasant experience at the retail outlets. The study will also be helpful to the
mobile service providers and other players in the Telecommunications Industry in
improving customer service.
9
CHAPTER TWO: LITERATURE REVIEW
2.1 Introduction
This chapter presents a review of some of the related literature published on the queuing
system. The purpose of this article is to give the reader a general background into
queuing theory and queuing systems, its associated terminology, and how queuing theory
relates to customer satisfaction.
2.2 Basic Concepts of Queuing Theory and Practices
A queue is a waiting line, whether of people, signals or things (Ashley, 2000). Queuing
occur when demand exceeding the capacity of the delivery system (Houston, Bettencourt,
Wenger 1998). Queuing theory is the formal study of waiting in line and is an entire
discipline within the field of operations management.
Input source (or source of arrivals or calling population) refers to the population from
which arrivals to, waiting line come from. Size of input source is the total number of
distinct potential customers. It could be finite or infinite. Queue is characterized by the
maximum permissible number of customers that it can contain. This also could be finite
or infinite. In most of the practical situations, it is finite. Queue discipline refers to the
order in which members of the queue are selected for service. The order is usually first-
cum-first-served. However, priority-discipline models give priority to rush jobs and
important customers over others and follow random selection, priority selection or last in
first out (LIFO).
The service mechanism consists of one or more service facilities, each of which contains
one or more parallel service channels or stations called Servers. Service Time (or holding
time) is the time elapsed from the commencement of service to its completion for a
customer at a service facility. Interval time is the time between consecutive arrivals of
customers to the queue. State of system is number of customers in queuing system and
queue length refers to number of customers waiting for service. In other words, state of
the system minus number of customers being served will give queue length.
10
The transient condition of the system refers to initial stage when the operation begins.
The steady state condition is that condition when system becomes essentially independent
of the initial state after lapse of some time. The state dependent service rate and/or arrival
rate assumes that the (mean) service rate is always a constant. But it may not be true in
practice. Servers tend to work faster than they do when the backlog is small or
nonexistent. The increased service rate may be due to compromise in quality or external
assistance for certain phases of service.
The physical structure of waiting lines consists of: One or more input sources with
arrival distribution, none, one or more queue, one or more servers operating in series or
parallel, service discipline and maximum number of customers allowed . The controllable
aspects of queuing systems are: Arrival rate, number of servers, service time, maximum
length of waiting line and queue discipline or priority rules.
Important Assumptions of a queuing model are firstly each source has a well-defined
arrival pattern over time, i.e. inter-arrival or interval times are constant or randomly
spaced over time with a known inter-arrival time probability distribution (poison
distribution). Secondly the service times at each channel (server) may be constant or
random with a known service distribution (negative exponential distribution). Thirdly the
potential arrivals may balk if the length of waiting line becomes excessive and decide not
to join or arrivals may join the waiting line and subsequently renege, i.e. become
impatient and leave before being served. They are lost by the service system. Fourthly in
a steady state, the average rate of departure is equal to average rate of arrivals.
2.2.1 A Simple Queuing (Waiting Line) Model
The simplest waiting line model assumes that arrivals join a queue that is of unlimited
size, waiting in line until their turn for service comes on a first-cum-first-serve basis and
then enter a service facility consisting of a single channel. If, W = Average time spent in
queue (i.e., sum of the expected waiting time and expected service time) λ = Average rate
of units passing through the system per unit time L = Average number of units in the
system
11
Then, L= λ W
If µ = Average service rate
1/ λ = Expected inter arrival time
1/µ = Expected service time
Further, the utilization factor, ρ (i.e. the expected fraction of time the server is busy is
given by
ρ = λ / sµ. Where (s µ ) is the fraction of the system's service capacity that is being
utilized on the average by arriving customers Cλ). The root of the queuing theory is to
'achieve a tradeoff between excessive waiting by customers (i.e., too much demand) and
cost due to excessive idle time at the service facility (i.e. too little demand). Other models
are as shown in the figures below.
Single server- Single Queue model
Arrival Queue Service facility
Exit
Figure 2.1: Single Server- Single Queue Model
Exit
Arrival Queue
Service points
Figure 2.2: Single Queue- Parallel Server Single Queue Model
12
Arrival Queue Service stations Exit
Figure 2.3: Multiple Queues-Parallel Servers
2.2.2 Queuing Management Practices
Queue management practices are measures that are put in place to ensure effectiveness
and efficiency of services. Service environments deal with customers queues on a daily
basis. Customers arrive to avail different types of services, so management should works
to ensure that customers’ time is pleasing and hassle free. These practices are categorized
into three major groups, (Kuklin, 2013). Firstly practices that manage of customers flow
to reduce actual wait time. This can be achieved by setting station lights to point
customers to open counters, audio cues to call customers to the right service points.
Single line queuing also inherently reduces the average waiting times. Secondly,
assessing the psychological impact of queuing to reduce perceived wait time is another
practice. This can be done by implementing distractions for example LCD screens to
show promotions, reading materials and display of merchandise. Thirdly, generating
metrics for improving productivity. This involves proactive monitoring of the queue for
example, service time monitoring and real time queue- analysts.
2.2.3 The Service System
The service system is characterized by the number of waiting lines, the number of
servers, the arrangement of the servers, the arrival and service patterns, and the service
priority rules.
13
Waiting line systems can have single or multiple lines. Customers wait in line until an
agent is free and then proceed to that agent’s position. The advantage of using a single
line when multiple servers are available is the customer’s perception of fairness in terms
of equitable waits. That is, the customer is not penalized by picking the slow line but is
served in a true first-come, first-served fashion. The single-line approach eliminates
jockeying behavior. Finally, a single-line, multiple-server system has better performance
in terms of waiting times than the same system with a line for each server. The multiple-
line configuration is appropriate when servers specialized are used or when space
considerations make a single line inconvenient. For example, in a grocery store some
registers are express lanes for customers with a small number of items. Using express
lines reduces the waiting time for customers making smaller purchases.
System serving capacity is a function of the number of service facilities and server
proficiency. In waiting line systems, the terms server and channel are used
interchangeably. It is assumed that a server or channel can serve one customer at a time.
Waiting line systems are either single server (single channel) or multi server
(multichannel).
Services require a single activity or a series of activities and are identified by the term
phase. In a single-phase system, the service is completed all at once, such as with a bank
transaction or a grocery store checkout. In a multiphase system, the service is completed
in a series of steps, such as at a fast-food restaurant with ordering, pay, and pick-up
windows or in many manufacturing processes. In addition, some waiting line systems
have a finite size of the waiting line. Sometimes this happens in multiphase systems.
Finite size limitations can occur in single-phase systems and can be associated either with
the physical system (for example, a call center has only a finite number of incoming
phone lines) or with customer behavior (if a customer arrives when a certain number of
people are already waiting, the customer chooses to not join the line)
14
Modes of arrival at a service station can be bulk, arrival as a group, single arrival,
independent or conditional arrival. If the state of the system or the sequence receiving
arrivals does not affect subsequent arrivals, then the arrivals are independent, otherwise
conditional. Timing of arrival can be uniform or random.
Queuing discipline is the order in which customers are picked to receive service (David,
2005). First come first serve, order of service is order of arrival. Last come first serve,
customers are served in the reverse order of arrival. Service in random order, selection is
in a way that every customer in the queue is equally likely to be selected for the service.
Hence the time of arrival is of no consequence in this selection. Priority service, this is
when customers may be selected for services according to some identifiable character e.g.
emergency places.
The queue discipline can include balking (customers deciding not to join the queue if it is
too long), reneging (customers leave the queue if they have waited too long for service),
jockeying (customers switch between queues if they think they will get served faster by
so doing). (David 2005). There are two possible outcomes after a customer is served. The
customer is either satisfied or not satisfied and requires re-service.
2.2.4 The Psychology of Waiting
There are a couple basic psychological aspects of customers in waiting lines have to be
understood by a service organization, (William 2009). Firstly, unoccupied time of the
customer in the waiting line is always felt longer than the waiting lines and customer
satisfaction occupied time. If a customer in service waiting line is engaged with some
activity either by himself or by service personnel he will not feel waiting as longer. One
of the funny but practical suggestions is to provide for a big mirror where people have to
wait in standing for longer. This is nothing but the subjective element of the customer as
they are not occupied by any activity in the line.
Secondly, preprocess waits of the customer is always felt as longer by customer than in-
process waits. Obviously the customer does not take cognizance of longer time involved
15
in the service delivery process as long as he is actively participating in the process. Any
anxiety on the part of the customer make him to feel waiting time as subjectively longer.
Fourthly, it is very crucial from the angle of a customer in the waiting line that he should
be given to understand how long he has to wait to get his turn and receive the service. In
other words, uncertain waits appear longer to customers than known and finite waits.
Further, any open explanation about why one has to wait so long always relieves
commotion in the mind of customer. Hence, unexplained waits appear longer than the
explained waits. Sixthly, customers obviously expect either equitable treatment or a
special favorable treatment from service personnel. Hence, any unfair waits appear longer
to them than equitable waits. Any by-passing of a customer in the waiting line causes
dissatisfaction. It has been established through research that the perceived equality of
customers in a Service Centre has an important positive effect on customer satisfaction of
the service. Seventhly, the more valuable the service, the longer the customer is willing to
wait. Lastly, customers having solo waits feel it longer than those waiting in groups. It is
always better to allow customers in groups for waiting. All the above psychological
aspects of waiting lines have some lessons for service managers who have to design
service counters and operate them with customers in waiting lines.
2.3 Customer Satisfaction
Customer satisfaction can be defined in various ways. According to Kotler (1996),
satisfaction is the level of a person‘s felt state resulting from comparing a product‘s
perceived performance (or outcome) in relation to the person‘s expectations. As cited by
(Stahl, 1999) satisfaction level simply is a function of the difference between perceived
performance and expectations. Unlike the quality of goods, which may be tangible and
measured objectively by using indicators such as performance, features, reliability etc.,
service quality, however, is not tangible and is thus defined in terms of attitude,
interaction, and perception. Thus, service quality is judged by what a customer perceives
rather than what a provider offers. For decades, customer satisfaction is considered to be
the key success factors for every profit-oriented organization as it affects companies‘
market share and customer retention. In addition, satisfied customers tend to be less
influenced by competitors, less price sensitive, and stay loyal longer (Dimitriades, 2006).
16
Customer satisfaction is a measure of how your organization’s total product performs in
relation to a set of customers’ requirements, (Nigel & Jim, 2000). Satisfaction is
primarily an emotional customer-centered personal response/ reaction (Sridhar, 2001). As
a state experienced inside customer mind; it involves both intellectual and emotional
responses. Customer satisfaction (including expectation and perception of customer)
depend more on customer and his style (his overall post purchase evaluation) than
technology or system. The customer in turn depend on his perception, recent performance
and first impression.
Customer participation in service production and delivery process is a crucial element of
service management and high customer contact systems have to very carefully look into
theory and psychology of waiting lines to take advantage of customer participation and to
avoid negative effects of delays and other psychological factors on service quality and
customer satisfaction (Sridhar, 1998).
2.4 Relating Customer Satisfaction and Waiting Time
In 1985, Maister developed a framework for focusing on customer satisfaction with
waiting. This effort, although highly qualitative and subjective in nature, nevertheless did
identify many of those factors which can affect customer satisfaction with waiting. In his
article, Maister describes the relationship between customer satisfaction, customer
perception and customer expectation as satisfaction is perception minus expectation.
Perception, in turn, is dependent on both the customer’s interpretation of the service
encounter and the actual service performance. That means that satisfaction can also be
referred to as interpretation (performance) minus expectation.
Clearly, there are two direct approaches to increasing customer satisfaction with respect
to queues: First, decreasing actual waiting time (performance), and secondly, managing
the customer’s expectations of the wait. New and innovative approaches are continuously
being developed to reduce, and in some cases totally eliminate, customer waiting time:
banks provide 24-hour service with ATMs, hotels slide bills under guest room doors on
the last night of the stay so there is no need to queue to check out at the cashier desk in
17
the morning, and more and more restaurants are offering home delivery. When process
analysis demonstrates that there are opportunities to shorten waits without adding costs,
there is no question that in most situations shorter waits will improve satisfaction.
The relationship between customer satisfaction and waiting time can vary significantly
between firms within an industry as well as between customers within a firm. The factors
which affect this relationship can be classified as firstly factors which are primarily firm-
related, factors which are primarily customer-related and factors which are both
customer- and firm-related.
Service operations managers who can differentiate between these factors will be better
able to understand how these factors impact on their operations by distinguishing those
over which they have total or at least partial control from those over which they have no
control at all.
2.5 Summary Queues are formed when the demand exceeds the capacity of a facility. The basic
components of the queue process are, the input source also called the calling population,
the arrival process, the queue and the queue discipline, the service mechanism and the
output. The size of the calling population can be categorized according to source; the
source can be finite or infinite. In this case the population is finite since only Safaricom
customers are considered. The arrival rate can be constant or randomly spaced over time.
The mode of arrival can be bulk or single. Queue discipline is the order in which
customers are picked for service. Customers can be served in the order of arrival or in the
reverse order of arrival. Service can also be in random order and in some cases priority
service can be exercised. The service system is characterized by the number of waiting
lines, the number of servers, the arrangement of servers the arrival and service patterns
and the service priority rules.
Customer satisfaction can be defined as a state experienced in the customers mind and
involves emotional responses. This state can be determined by the customer’s perception,
recent performance and first impression. The relationship between customer satisfaction
and waiting time can be categorized into factors which can be firm related, customer
18
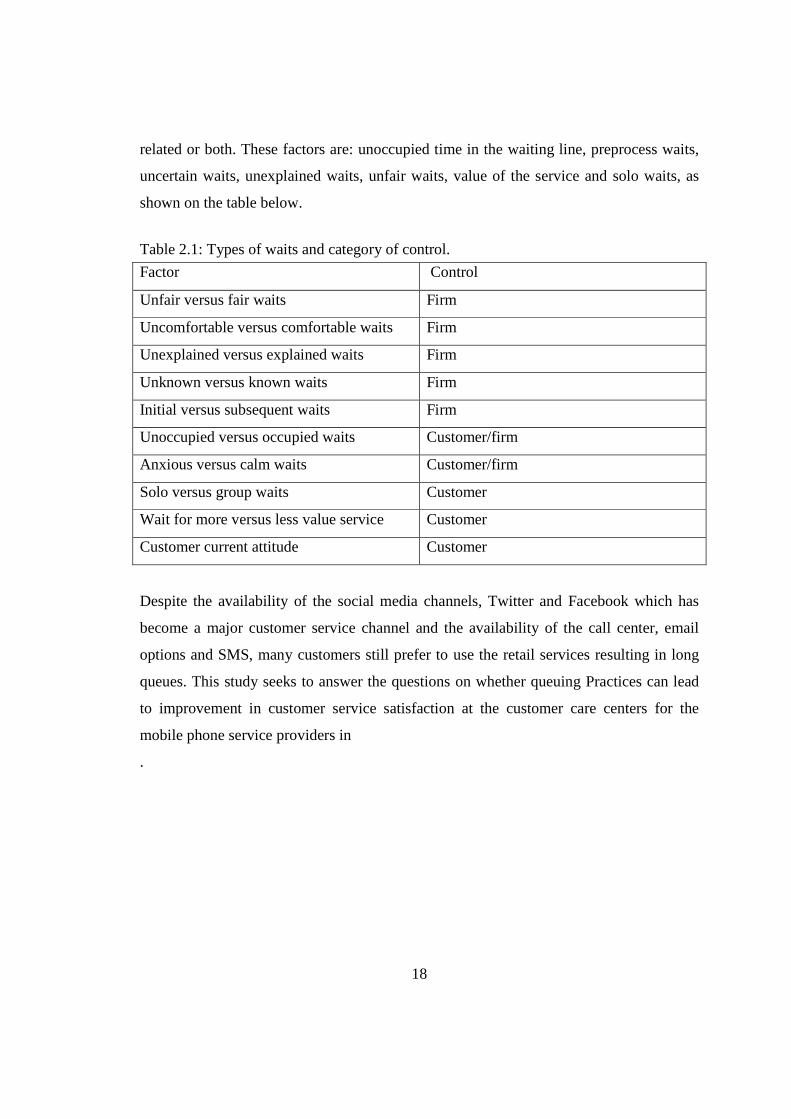
related or both. These factors are: unoccupied time in the waiting line, preprocess waits,
uncertain waits, unexplained waits, unfair waits, value of the service and solo waits, as
shown on the table below.
Table 2.1: Types of waits and category of control.
Factor Control
Unfair versus fair waits Firm
Uncomfortable versus comfortable waits Firm
Unexplained versus explained waits Firm
Unknown versus known waits Firm
Initial versus subsequent waits Firm
Unoccupied versus occupied waits Customer/firm
Anxious versus calm waits Customer/firm
Solo versus group waits Customer
Wait for more versus less value service Customer
Customer current attitude Customer
Despite the availability of the social media channels, Twitter and Facebook which has
become a major customer service channel and the availability of the call center, email
options and SMS, many customers still prefer to use the retail services resulting in long
queues. This study seeks to answer the questions on whether queuing Practices can lead
to improvement in customer service satisfaction at the customer care centers for the
mobile phone service providers in
.
19
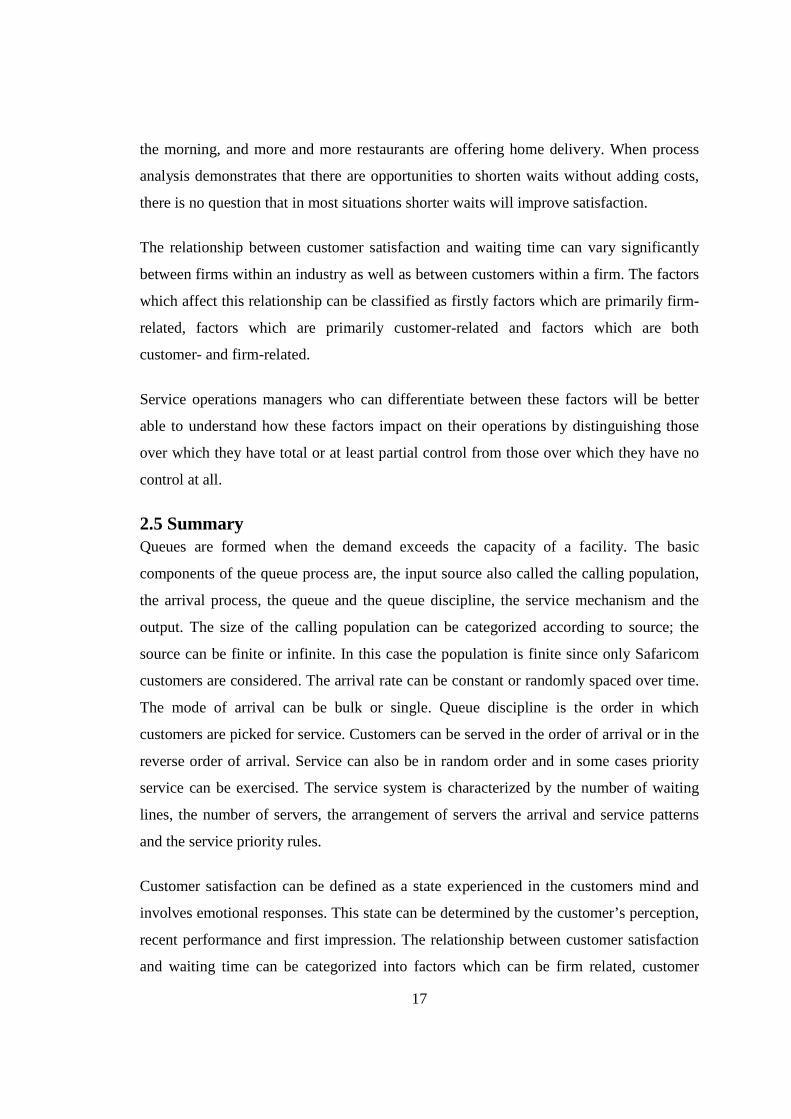
2.6 Conceptual Model and Framework
Upon arrival at the retail outlets, customers join the queue depending on the nature of
service required. The customer has to wait for an available agent to be served and after
service, the customer exits the system as shown in the figure below.
Arrival output
Queue Service
Figure 2.4: The Queuing System
Population: Mobile Service users
Arrival: Random arrival rates varying with Time
Queue: Several Parallel servers, several queues
Queue Discipline: First Come First Serve
Service: Service time, duration taken to attend to each customer
Output: Customer exits the system.
Population of Customers
20
Conceptual Framework
Independent Variable
Dependent Variable
Customer Satisfaction
Perceived waiting time
Waiting lines /queues
Queuing discipline
Queuing practices
Influences
21
CHAPTER THREE: RESEARCH METHODOLOGY
3.1 Introduction
This chapter describes the research design that was adopted, the population and how data
was collected and analyzed
3.2 Research Design
This study adopted a descriptive research design. Descriptive research entails collecting
data that describe events and then organizes analyses and describes the data collection
(Glass & Hopkins, 1984). Because the human mind cannot extract the full import of a
large mass of raw data, descriptive statistics are very important in reducing the data to
manageable form. When in-depth, narrative descriptions of small numbers of cases are
involved, the research uses description as a tool to organize data into patterns that emerge
during analysis. Those patterns aid the mind in comprehending a qualitative study and its
implications. Descriptive studies are aimed at finding out "what is," so observational and
survey methods are frequently used to collect descriptive data (Borg & Gall, 1989). This
research proposal adopted a survey method. This research method is considered
appropriate as it deals with many members in the population spread all over the country
where it is not possible to study all of them and hence calling for sampling in order to
come up with generalizations about the whole population. In addition, survey design is
less biased compared to other designs like in-depth case study (Gilbert & Gips, 2000).
3.3 Population
According to Tromp (2006), population is a group of individuals, objects or items from
which samples are taken for measurement or it is an entire group of persons, or elements
that have at least one thing in common. The population of the study that was under
consideration comprised of all mobile phone customers and managers within Nairobi
22
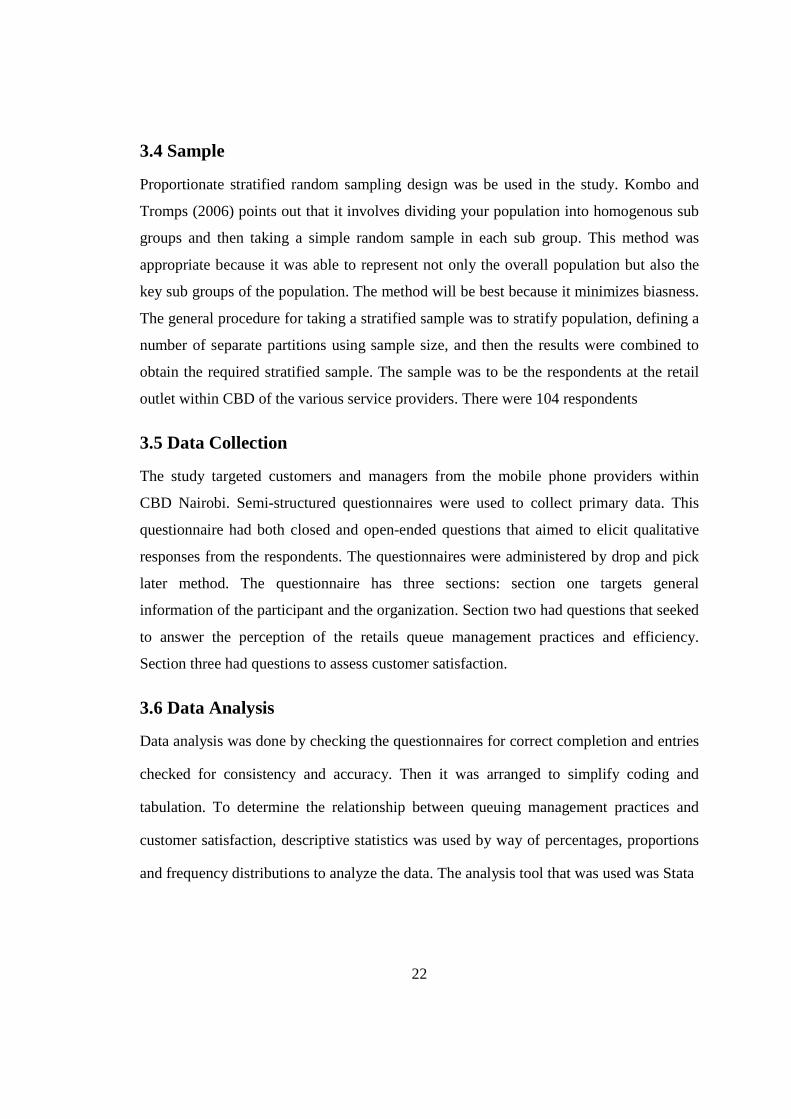
3.4 Sample
Proportionate stratified random sampling design was be used in the study. Kombo and
Tromps (2006) points out that it involves dividing your population into homogenous sub
groups and then taking a simple random sample in each sub group. This method was
appropriate because it was able to represent not only the overall population but also the
key sub groups of the population. The method will be best because it minimizes biasness.
The general procedure for taking a stratified sample was to stratify population, defining a
number of separate partitions using sample size, and then the results were combined to
obtain the required stratified sample. The sample was to be the respondents at the retail
outlet within CBD of the various service providers. There were 104 respondents
3.5 Data Collection
The study targeted customers and managers from the mobile phone providers within
CBD Nairobi. Semi-structured questionnaires were used to collect primary data. This
questionnaire had both closed and open-ended questions that aimed to elicit qualitative
responses from the respondents. The questionnaires were administered by drop and pick
later method. The questionnaire has three sections: section one targets general
information of the participant and the organization. Section two had questions that seeked
to answer the perception of the retails queue management practices and efficiency.
Section three had questions to assess customer satisfaction.
3.6 Data Analysis
Data analysis was done by checking the questionnaires for correct completion and entries
checked for consistency and accuracy. Then it was arranged to simplify coding and
tabulation. To determine the relationship between queuing management practices and
customer satisfaction, descriptive statistics was used by way of percentages, proportions
and frequency distributions to analyze the data. The analysis tool that was used was Stata
23
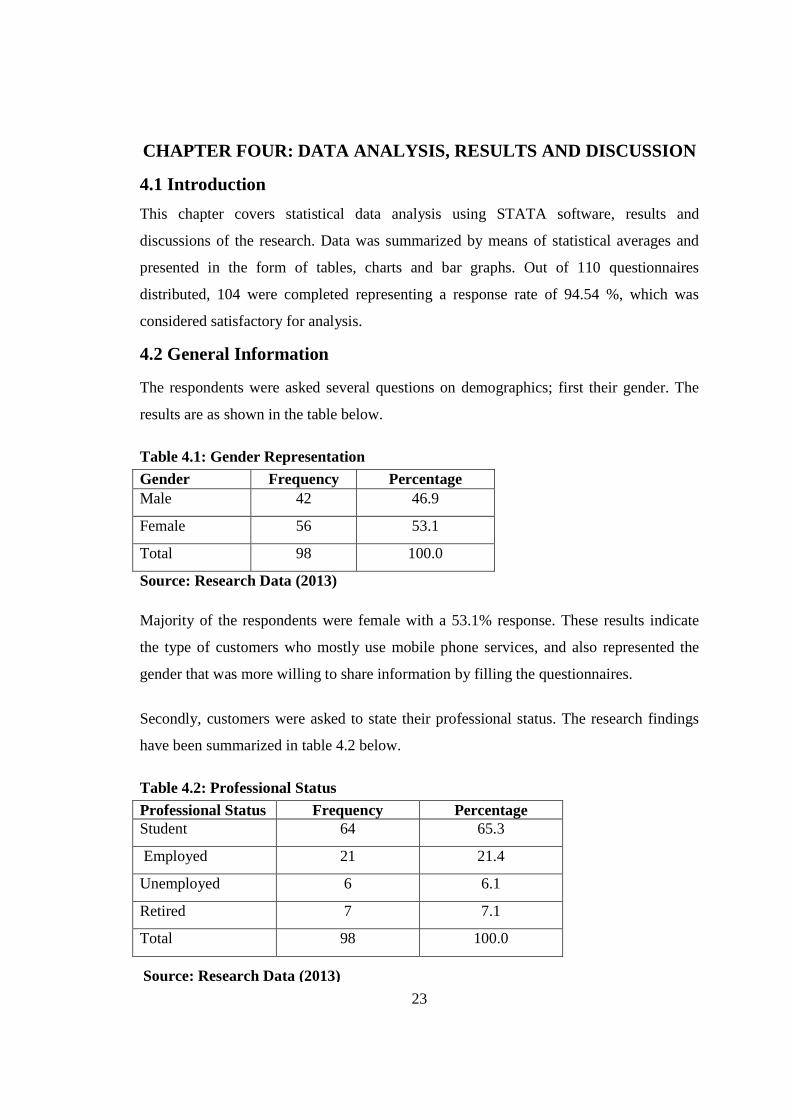
CHAPTER FOUR: DATA ANALYSIS, RESULTS AND DISCUSSION
4.1 Introduction
This chapter covers statistical data analysis using STATA software, results and
discussions of the research. Data was summarized by means of statistical averages and
presented in the form of tables, charts and bar graphs. Out of 110 questionnaires
distributed, 104 were completed representing a response rate of 94.54 %, which was
considered satisfactory for analysis.
4.2 General Information
The respondents were asked several questions on demographics; first their gender. The
results are as shown in the table below.
Table 4.1: Gender Representation Gender Frequency Percentage Male 42 46.9
Female 56 53.1
Total 98 100.0
Source: Research Data (2013)
Majority of the respondents were female with a 53.1% response. These results indicate
the type of customers who mostly use mobile phone services, and also represented the
gender that was more willing to share information by filling the questionnaires.
Secondly, customers were asked to state their professional status. The research findings
have been summarized in table 4.2 below.
Table 4.2: Professional Status Professional Status Frequency Percentage Student 64 65.3
Employed 21 21.4
Unemployed 6 6.1
Retired 7 7.1
Total 98 100.0
Source: Research Data (2013)
24
Majority of the customers were students with a response rate of 65.3%, followed by
employed customers with 21.4%. Retired and unemployed customers had a response rate
of 7.1% and 6.1% respectively. It was established that the students were more willing to
provide the researcher with information.
Thirdly, customers were asked to state their age bracket. The research findings have been
summarized in table 4.3 below.
Table 4.3: Age Bracket
Age Frequency Percentage
Below 13 years 4 4.1
14 – 23 years 62 63.3
24 – 35 years 20 20.4
36 – 50 years 6 6.1
Above 50 years 6 6.1
Total 98 100.0
Source: Research Data (2013)
Most of the customers were aged between 14-23 years, followed by customers who are
aged between 24-35 years. 6.1% of customers aged between 36 years and above, while
4.1% customers aged below 13 years. It was established that the youth dominated this
research sample.
The respondents were asked why they choose to continue with their current service
providers. This was to help find why customers are loyal to their providers of choice.
The findings are shown in the table 4.4 below.
25
Table 4.4: Reasons for staying with the service provider.
Reason Frequency Percentage
Friends and family 22 22.9
Network coverage 20 20.8
Good services 29 30.2
Loyalty 8 8.3
Cheap call rates 17 17.7
Total 96 100.0
Source: Research Data (2013) Majority of the respondents (30.2%) stayed because of good services .This was followed
by friends and family at 22.9%. Network coverage took 20.8%. Cheap call rates 17.7%
and lastly consumer loyalty 8.3%. These results showed that customers are interested in
receiving good services. Turban et al. (2002) believe that good customer service boosts
the level of customer satisfaction.
Respondents were asked to rate the efficiency of the service provider in serving
customers queuing and what they thought management could do to increase efficiency.
The findings are as shown in the table below.
Table 4.5: Increasing efficiency in serving waiting customers
Increasing Management Efficiency Frequency Percentage
Increase staff 28 31.1
Attend to subscribers fully 16 17.8
Low rates 11 12.2
Faster response to customers 15 16.7
Staff training 6 6.7
Improve call line services 7 7.8
Improve technology 5 5.6
Nothing, contented 2 2.2
Total 90 100.0
Source: Research Data (2013)
26
From the results above, it was established that most service providers were rated average
in their efficiency by 53.1% of respondents, 33.3% as good and least poor 13.5%. As per
the table 4.5 above customers found the most appropriate way of being more efficient is
by increasing agents in the customer care centers. It was shown by the highest percentage
31.1%. There were few customers who expressed full satisfaction from their service
provider .this was given by 2.2%. It was also established that satisfaction can be
improved by an addition of customer care agents to serve them, thus ensuring the queue
moves faster. There is indeed a big room for improvement of serving customers queuing.
Scotland (1991) argues that queuing for service is a negative experience, and therefore
operations managers should continually look for ways to speed up services as it has
become a very important attribute (Kart, Larson & Larson, 1991)
4.3 Queuing Management Practices and Customer Satisfaction.
Managers were asked to indicate whether there are queue management practices in the
customer care centers. The findings were as the table 4.6 below.
Table 4.6: Existence of Queue Management Practices
Presence of queue management practices Frequency Percentage
Yes 2 33.3
No 4 66.7
Total 6 100.0
Source: Research Data (2013)
As can be seen above, 66.7% response show there was absence of queue management
practices and 33.3% exhibit there was queue management practices. More than half of the
respondents indicated that there are no queue management practices among the mobile
phone customer care centers.
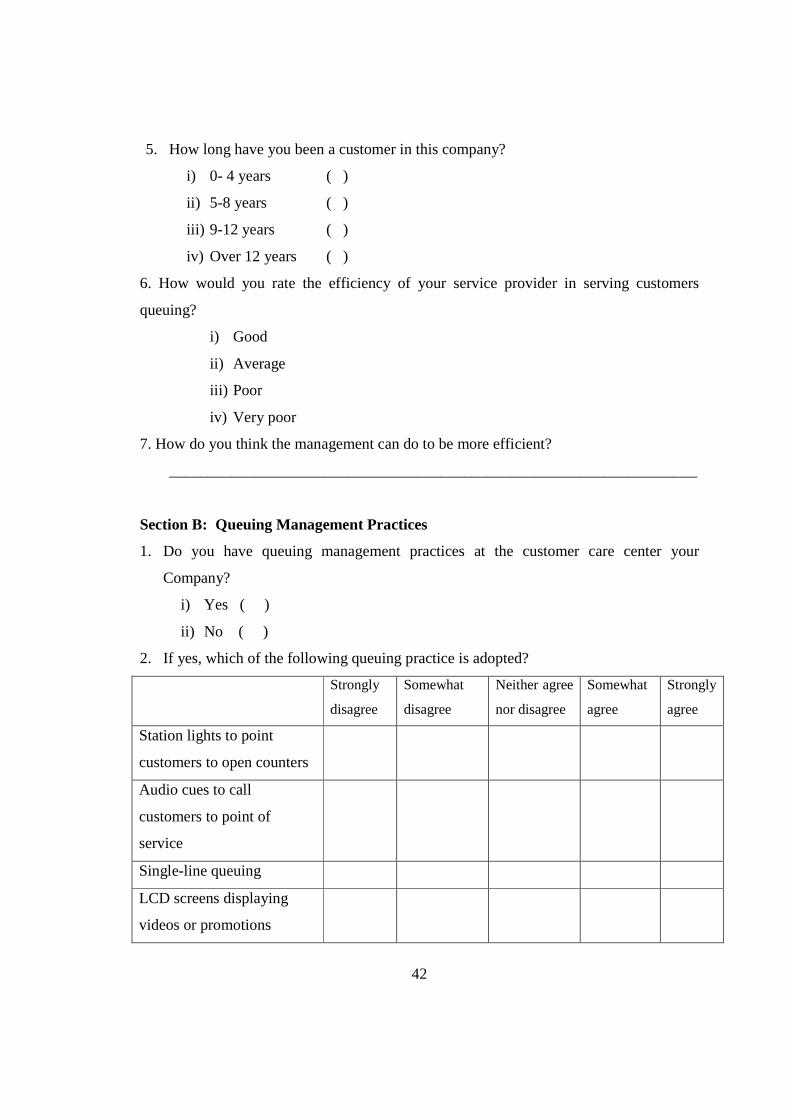
Respondents were also asked to indicate which queue management practices if any, have
been adopted at the customer care centers. The results are as shown in the table below.
27
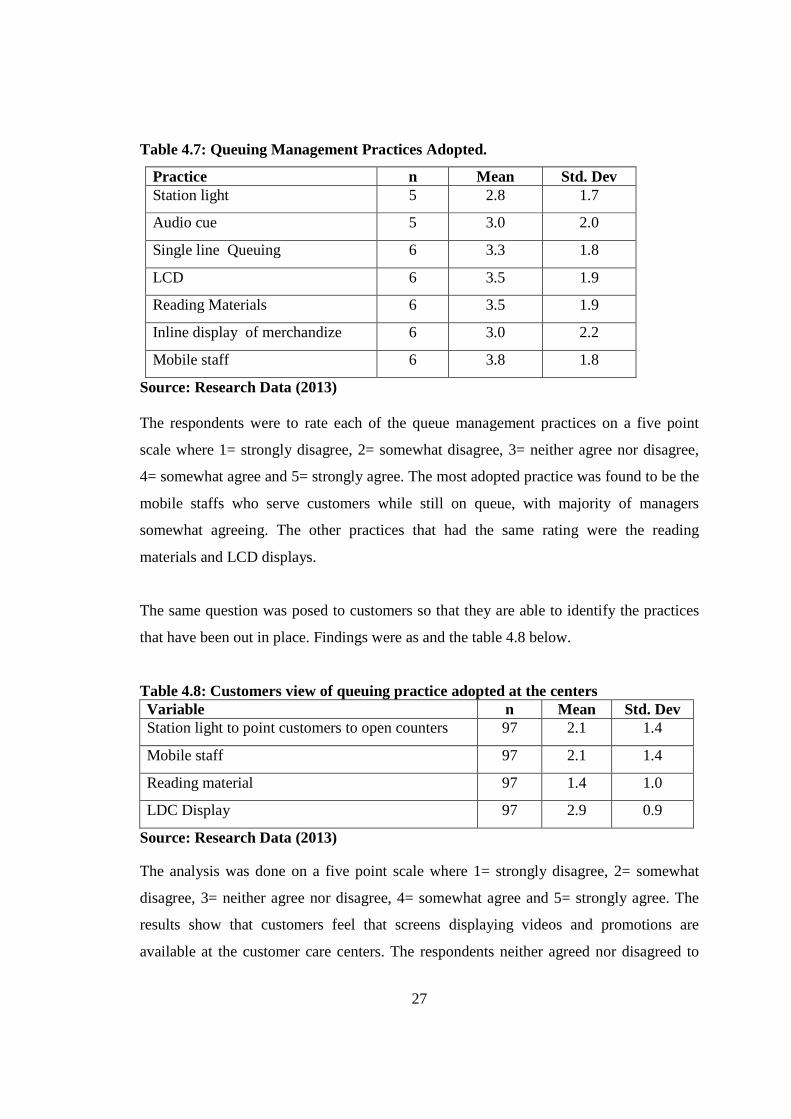
Table 4.7: Queuing Management Practices Adopted.
Practice n Mean Std. Dev Station light 5 2.8 1.7
Audio cue 5 3.0 2.0
Single line Queuing 6 3.3 1.8
LCD 6 3.5 1.9
Reading Materials 6 3.5 1.9
Inline display of merchandize 6 3.0 2.2
Mobile staff 6 3.8 1.8
Source: Research Data (2013) The respondents were to rate each of the queue management practices on a five point
scale where 1= strongly disagree, 2= somewhat disagree, 3= neither agree nor disagree,
4= somewhat agree and 5= strongly agree. The most adopted practice was found to be the
mobile staffs who serve customers while still on queue, with majority of managers
somewhat agreeing. The other practices that had the same rating were the reading
materials and LCD displays.
The same question was posed to customers so that they are able to identify the practices
that have been out in place. Findings were as and the table 4.8 below.
Table 4.8: Customers view of queuing practice adopted at the centers Variable n Mean Std. Dev Station light to point customers to open counters 97 2.1 1.4
Mobile staff 97 2.1 1.4
Reading material 97 1.4 1.0
LDC Display 97 2.9 0.9
Source: Research Data (2013)
The analysis was done on a five point scale where 1= strongly disagree, 2= somewhat
disagree, 3= neither agree nor disagree, 4= somewhat agree and 5= strongly agree. The
results show that customers feel that screens displaying videos and promotions are
available at the customer care centers. The respondents neither agreed nor disagreed to
28
the existence of this practice. They also disagreed to the existence of mobile staff and
station lights. They disagreed strongly on the existence of reading materials. This implies
that the effect of service from the mobile staff as management has suggested is not strong
in relation to the number of customers waiting in line. The LCD screens that occupy the
customers so that the actual waiting time seems less, are either not positioned
strategically to catch the customers attention, or have information that is appealing to the
customer to draw their attention from the waiting line as stated by William (2009).
Queuing management practices are measures that are put into place to ensure
effectiveness and efficiency of services as expressed by (Kuklin 2013). The practices
help reduce customers’ actual wait time, perceived wait time, and improve productivity.
The other ways of managing long queues at the customer care centers were found to be
floor management and also plans to open more customer care centers across the country
to cub the numbers. The challenges faced in implementing techniques to manage queues
in the customer care outlets came out strongly as lack of knowledge followed by both
prestige customer rigidity and huge customer flow.
4.4 Customer Satisfaction and Waiting Time
Respondents were asked to estimate the time taken for service. Results are as shown on
the table below.
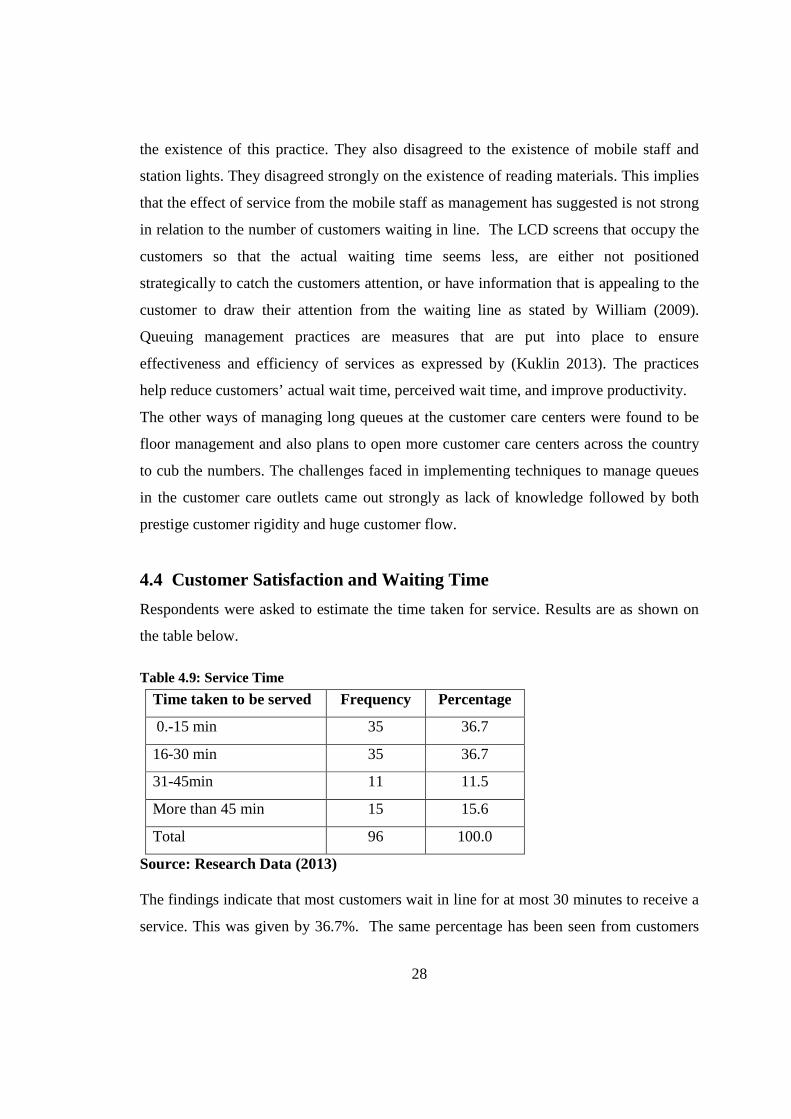
Table 4.9: Service Time
Time taken to be served Frequency Percentage
0.-15 min 35 36.7
16-30 min 35 36.7
31-45min 11 11.5
More than 45 min 15 15.6
Total 96 100.0
Source: Research Data (2013) The findings indicate that most customers wait in line for at most 30 minutes to receive a
service. This was given by 36.7%. The same percentage has been seen from customers
29
whose service time was at most 15 minutes. A good number indicated that service took
more than 45 minutes. Several customers reported that service time was between 30-45
minutes. Service time is the time elapsed from the beginning of service to its completion
for a customer at a service facility. According to Shioyama (1991), it is difficult to
predict accurately when demand will be placed in a facility and how much time will be
required to provide the needed service as observed in the findings above.
Respondents were asked to rate their satisfaction/dissatisfaction with the process of
getting their problem solved. The table 4.9 below shows the results.
Table 4.10 : Process of getting the problem solved.
Problem solving process evaluation Frequency Percentage
Very satisfactory 10 10.3
Satisfactory 48 49.5
Average 32 32.9
Unsatisfactory 7 7.2
Total 97 100.0
Source: Research Data (2013) Most customers expressed that they were satisfied with the process with a response rate
of 49.5%, 32.9 % of the customers rated the process as average, 10.3 were very satisfied
and 7.2 were unsatisfied. From the above findings it is apparent that many customers are
not satisfied by the general process of solving their problem, right from the moment they
get access of the customer care center. There are some psychological aspects of
customers in waiting lines that make their waiting seem lesser. This observation had been
identified by Heineke (1994). This implies that the mobile phone providers are not
critically looking into these aspects.
Respondents were asked to indicate their opinion on different statements that bring out
the relationship between customers satisfaction and waiting time, categorized into factors
which can be firm related, customer related or both. The findings are as shown on the
table 5.1 below.
30
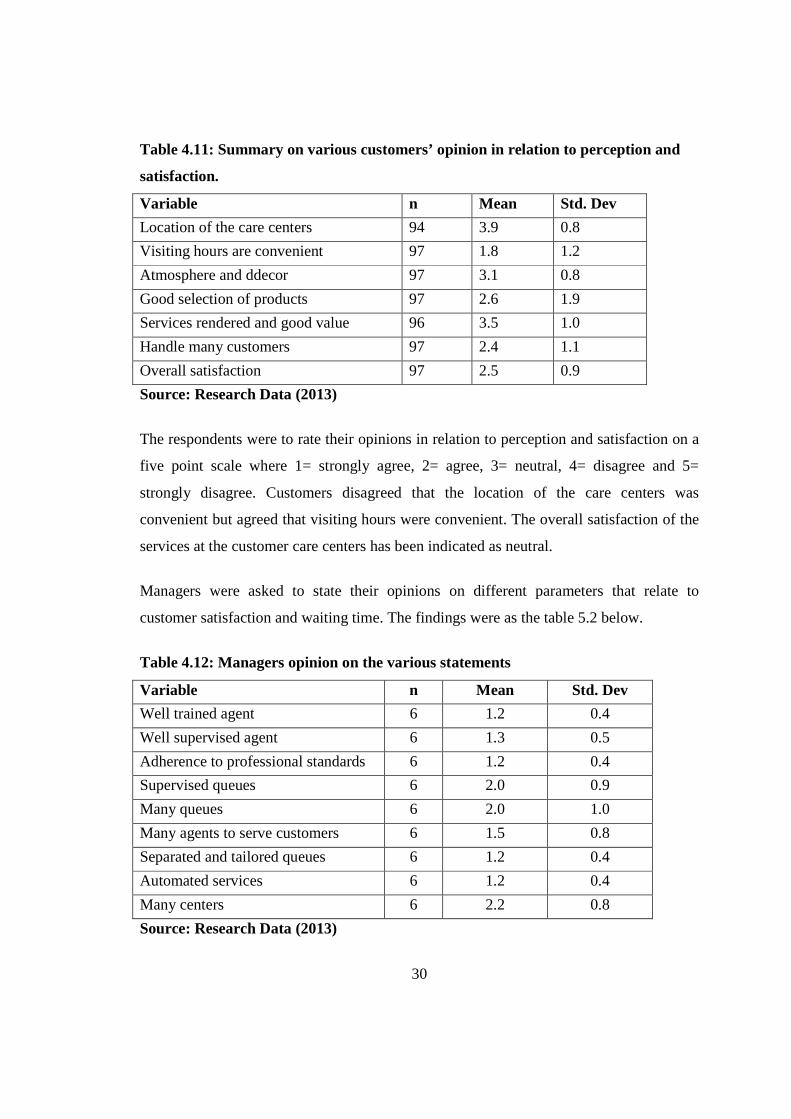
Table 4.11: Summary on various customers’ opinion in relation to perception and
satisfaction.
Variable n Mean Std. Dev
Location of the care centers 94 3.9 0.8
Visiting hours are convenient 97 1.8 1.2
Atmosphere and ddecor 97 3.1 0.8
Good selection of products 97 2.6 1.9
Services rendered and good value 96 3.5 1.0
Handle many customers 97 2.4 1.1
Overall satisfaction 97 2.5 0.9
Source: Research Data (2013)
The respondents were to rate their opinions in relation to perception and satisfaction on a
five point scale where 1= strongly agree, 2= agree, 3= neutral, 4= disagree and 5=
strongly disagree. Customers disagreed that the location of the care centers was
convenient but agreed that visiting hours were convenient. The overall satisfaction of the
services at the customer care centers has been indicated as neutral.
Managers were asked to state their opinions on different parameters that relate to
customer satisfaction and waiting time. The findings were as the table 5.2 below.
Table 4.12: Managers opinion on the various statements
Variable n Mean Std. Dev
Well trained agent 6 1.2 0.4
Well supervised agent 6 1.3 0.5
Adherence to professional standards 6 1.2 0.4
Supervised queues 6 2.0 0.9
Many queues 6 2.0 1.0
Many agents to serve customers 6 1.5 0.8
Separated and tailored queues 6 1.2 0.4
Automated services 6 1.2 0.4
Many centers 6 2.2 0.8
Source: Research Data (2013)
31
The analysis was done on a five point scale where 1= strongly agree, 2= agree, 3=
neutral, 4= disagree and 5= strongly disagree. The results show that managers strongly
agree to that the agents at the centers are well trained, supervised, adhere to set standards
of conduct, that queues are tailored based on customers’ needs and services are
automated to help reduce time wastage. As to whether there are many queues to serve
customers, many agents to offer service and centers, the respondents agreed. According
to the survey that was done by Maina (2010), one of the weaknesses noted was the very
long queues at the care centers. From the findings mobile phone service providers still
need to improve on the factors within the firms control to reduce waiting time.
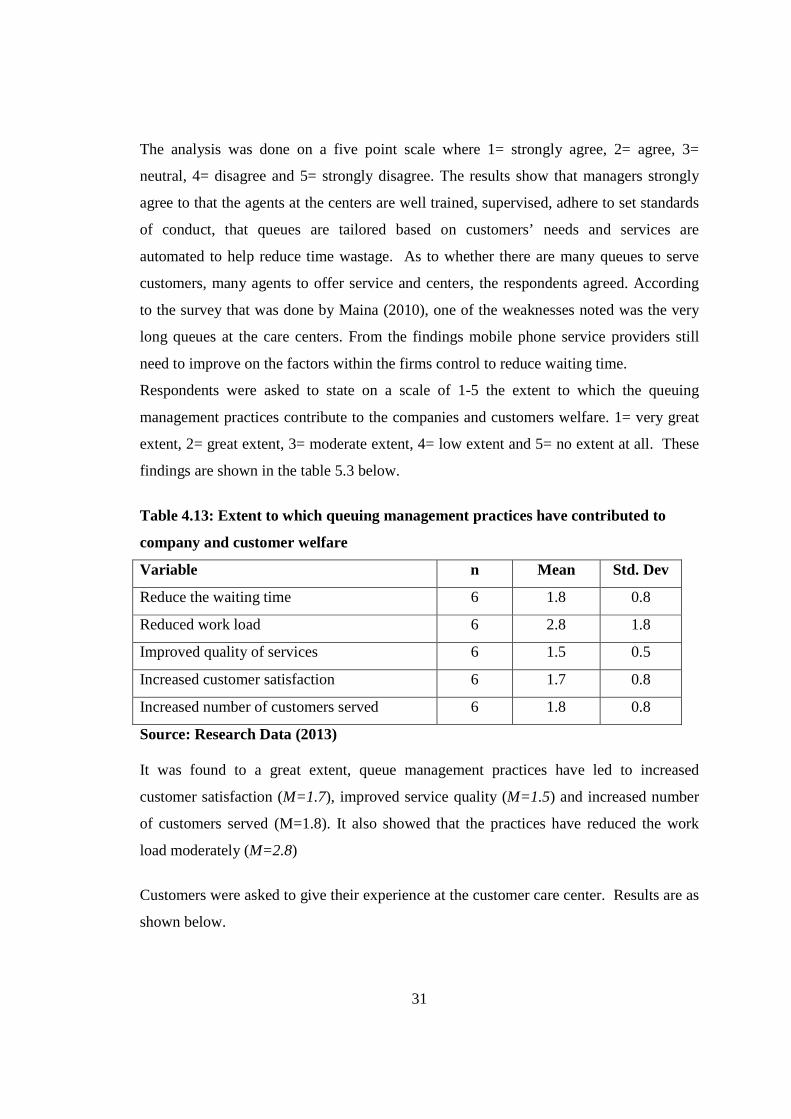
Respondents were asked to state on a scale of 1-5 the extent to which the queuing
management practices contribute to the companies and customers welfare. 1= very great
extent, 2= great extent, 3= moderate extent, 4= low extent and 5= no extent at all. These
findings are shown in the table 5.3 below.
Table 4.13: Extent to which queuing management practices have contributed to
company and customer welfare
Variable n Mean Std. Dev
Reduce the waiting time 6 1.8 0.8
Reduced work load 6 2.8 1.8
Improved quality of services 6 1.5 0.5
Increased customer satisfaction 6 1.7 0.8
Increased number of customers served 6 1.8 0.8
Source: Research Data (2013) It was found to a great extent, queue management practices have led to increased
customer satisfaction (M=1.7), improved service quality (M=1.5) and increased number
of customers served (M=1.8). It also showed that the practices have reduced the work
load moderately (M=2.8)
Customers were asked to give their experience at the customer care center. Results are as
shown below.
32
Table.4.14: Experience at Customer Care Center
Experience at the customer care Frequency Percentage
Kept waiting on line 37 38.1
Had to explain severally 19 19.6
Problem was well handled 36 37.1
Had to ask others 1 1.0
Spoke slowly 3 3.1
Other 1 1.0
Total 97 100.0
Source: Research Data (2013)
Majority of the respondents (38.1%) revealed their experience as to have been kept
waiting on line, 37.1 % indicated that their problem was well handled.
Respondents were asked to suggest how the queuing experience can be made a better
experience and the findings are as the table 4.15 below.
Table 4.15: How queue management can be more efficient
How queuing practice can be efficient Frequency Percentage
Increase customer care agents 26 29.2
Improve technology 13 14.6
Faster response 10 11.2
Train Staff 10 11.2
Increase Outlets/care centers 16 18.0
Improve hospitability services 5 5.6
Specialization in departments 7 7.9
Already satisfied 2 2.3
Total 89 100
Source: Research Data (2013)
33
Most of the customers (29.2%) felt that increasing customer care agents would go a long
way to increase efficiency. 18.0% respondents suggested that increasing outlets would be
ideal, 14.6 % proposed improving technology, 11.2 % of the respondents were for
training staff and faster response. 7.9 % suggested the specialization in departments and
2.3% were already happy with the queuing experience.
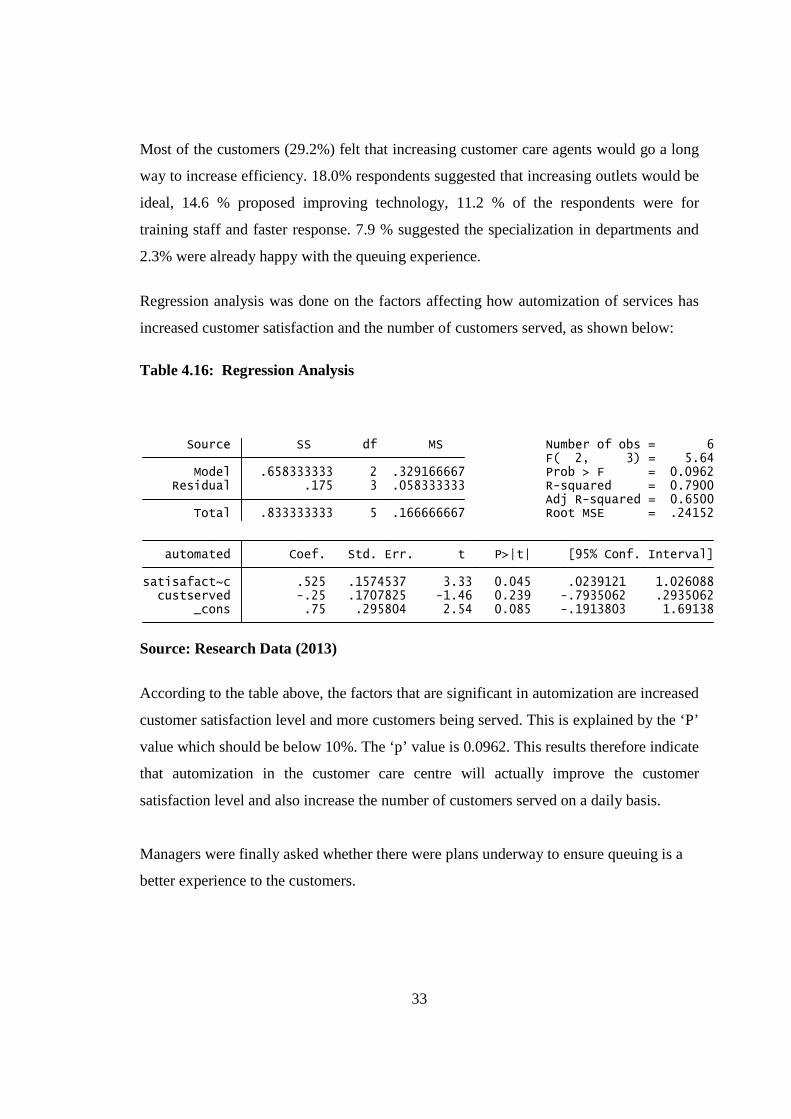
Regression analysis was done on the factors affecting how automization of services has
increased customer satisfaction and the number of customers served, as shown below:
Total .833333333 5 .166666667 Root MSE = .24152 Adj R-squared = 0.6500 Residual .175 3 .058333333 R-squared = 0.7900 Model .658333333 2 .329166667 Prob > F = 0.0962 F( 2, 3) = 5.64 Source SS df MS Number of obs = 6
Source: Research Data (2013)
According to the table above, the factors that are significant in automization are increased
customer satisfaction level and more customers being served. This is explained by the ‘P’
value which should be below 10%. The ‘p’ value is 0.0962. This results therefore indicate
that automization in the customer care centre will actually improve the customer
satisfaction level and also increase the number of customers served on a daily basis.
Managers were finally asked whether there were plans underway to ensure queuing is a
better experience to the customers.
34
Table 4.17: Plans to better queuing at care centers.
Plans to better queuing Frequency Percentage
Yes 6 100.00
Total 6 100.00
Source: Research Data (2013)
The findings showed that 100% of the managers’ response expressed there were plan to
better queuing at all customer care centers. This means that the managers are aware that
there is a danger that excessive waiting time can lead to loss of customers to competitors
as argued by Kotler (1999). Maister (1985) describes the relationship between customer
satisfaction, customer perception and customer expectation as; satisfaction is perception
minus expectation. Perception is dependent on both the customers’ interpretation of the
service encounter and the actual service performance. This implies that managers are
ready to deploy measures to improve customer satisfaction by having approaches and
practices that will decrease actual waiting time and manage customers’ expectations of
the wait.
35
CHAPTER FIVE: SUMMARY, CONCLUSIONS AND
RECOMMENDATIONS
5.1 Introduction
This chapter will discuss the aim of the research, Summary, Recommendations and
Conclusion of the findings of the research. Limitations of the research and suggestions
for further research have also been covered in this chapter.
5.2 Summary
This study was carried out to determine the relationship between queuing management
practices and customer satisfaction at the customer care centers for the mobile service
providers in Nairobi, and established the principles used to manage queues in the
customer care centers.
The study shows that the main reason a customer will be willing to stay with a particular
service provider was the service. Customers appreciate good services, and will remain
loyal if the service is exceptional. It also showed that the customers want the good service
with the least time possible; they would not want to be kept waiting in line. The study
also brought out the need to improve customers’ satisfaction levels. This was pointed as
to automate services/processes, increase the customer care centers and also increase the
customer care agents within the care centers.
The study also indicates that other than the customer care agents at the centers, other
principles used to manage queues are mobile staffs who meet the customers while they
are still on queue for service. But the mobile staffs have to be enough to meet the demand
of the waiting customers. Floor management is another way of reducing the wait line by
supervising staff and attending to customers complaints. Use of USSD (Unstructured
Supplementary Service Data). It is a global system for mobile communication
technology, which is used to send data between a phone and an application program in
the network.
36
5.3 Conclusion
According to the study, the queue management practices played a significant but small
role in customer satisfaction. The study also clearly shows that management should adopt
queuing management practices in all outlets as this has seen to reduce customers waiting
time, improve quality of service and subsequently increase customer satisfaction.
The findings suggested that in order to keep the customers happy, management and
decision makers should concentrate also on increasing the number of skilled staff or
agents. Also automating services, that is improve technology so as to respond faster to
customers and make queuing more efficient. Increasing outlets or the customer care
centers for easier accessibility of customers’ services was also an important decision to
be put into practice.
The study shows that the principals used to manage queues at the customer care centers
also are an added advantage to enhance customer satisfaction. The principals were found
to be floor management or supervision, use of mobile staff. These principles should be
deployed especially when the flow of customers is high.
5.4 Recommendations
This study recommends that all mobile service providers should embrace the
implementation of queuing management practices and systems within their customer care
centers in order to have more unmatched customer experience. Also automation of
process and systems should also be done to ensure that the customers wait time is
reduced.
Continuous training of customer care agents and management is also recommended to
ensure that at all times excellent service is offered to the customer, and to ensure faster
problem solving skills. Customer education is also an important recommendation.
Making sure customers are up to date with all kinds of improved technological trends on
mobile technology will improve their service experience.
37
5.5 Limitations
The Research was conducted successfully and the research objectives were met, however,
there were some limitations: First, the time dedicated to the project was not enough due
to job and school demands and deadlines. This made it hard to make visits to the
customer care centers as many times as it would have been ideal to collect enough data
especially from management. Secondly, access to information was not very easy as some
respondents were not willing to complete the questionnaires since they were suspicious of
the intentions of the study.
5.6 Suggestions for future Research
This research was specifically designed to study influence queuing management practices
and customer satisfaction among mobile phone customer care centers in Nairobi. It is
recommended that further research on queuing management practices and systems to be
carried out in the other cities in Kenya. The research can also be extended to other
hospitality industries in the Kenyan market e.g. Banks because they are also confronted
by the issue of queues. Follow up research within the mobile service providers can also
be done to enhance the body of knowledge.
38
REFERENCE
Agnès D.M. (1999) "Waiting for service: ten years of empirical research", International Journal of Service Industry Management, Vol. 10 Iss: 2, pp.171 – 194.
Ashley D.W. (2000). An introduction to queuing theory in an interactive text format.
Transactions on Education; 2(3):1-14. Bitner M.J. & Zeithaml V. A. (2003). Service marketing, third edition. New Delhi: Tata
McGraw Hill. Borg W.R. & Gall M.D. (1989) ´Educational Research: An Introduction”, Longman. Bunday B.D. (1996). “An Introduction to Queuing Theory”. Halsted Cooper D.R. & Schindler P.S (2003).Business Research Methods (8th ed). Irwin
/McGraw-Hill, Boston. Dimitriades A.S. (2006). Customer satisfaction, loyalty and commitment in service
organizations: some evidence from Greece. Management Research News, 29(12), 782-800.
Fahamu (2007). Available at: http://www.kiwanja.net/database/document/report
fahamu_mobile_activism.pdf Gail T. & Scott L, (1995) “Waiting time delays and customer satisfaction in
supermarkets”, Journal of service marketing, vol. 9 Iss:5, pp 20-29. Gilbert G. & Gips M. (2000). Supply-side contingency planning. Security Management,
44, (3): 70-74. Gilmore A. (2001) ‘Call Centre Management: is service quality a priority’, Managing
Service Quality, vol. 11, no. 3 pp. 153-159. Graf R.C (1984) Glass and Hopkins, “Statistical Methods in Education and Psychology,
Second Edition” Prentice-Hall. Houston M.B., Betthencourt L. A. & Wenger S. (1998) “The relationship between
Waiting in a service Queue and Evaluation of Service Quality: A Field Theory Perspective,”
Karen L. Katz & Blaire R. Martin (1989), Improving customer satisfaction through the
management of perceptions of waiting.
Katz K., Larson B. & Larson R. (1991), ``Prescriptions for the waiting in line blues:
entertain, enlighten and engage'', Sloan Management Review, Winter, pp. 44-53.
39
Kombo & Tromp (2006) Research Tools 3rd edition Jaico Publishing House, New Delhi. Kotler P. (1999) Marketing Management. The New Millennium Edition. Kotler P., Leong S. M., Ang, S. H. & Tan C. T. (1996), Marketing Management: An
Asian Perspective, Prentice-Hall, Singapore. Maina J. (2000) available at :http://publications.thesus.fi/bitstream/handle/10024/22222/
maina_janet.pdf?sequence=1
Maister D. (1985) “The Psychology of Waiting Lines”, in Czepiel, J.A., Solomon, M.R. and Surprenant, C. (Eds), The Service Encounter, Lexington Books, D.C. Heath and Co.,Lexington, MA.
Maltz A. & Maltz, E. (1998), Customer Service in the Distribution Channel empirical
findings, Journal of Business Logistics. Mark M.D. & Janelle H. (1994) "Understanding the Roles of the Customer and the
Operation for Better Queue Management", International Journal of Operations & Production Management, Vol. 14 Iss: 5, pp.21 – 34.
Market Africa Mid-East –“Cell phone update by Media contrast resources, Inc” (2007)”.
Available at: http://www.entrepreneur.com/tradejournals/article/160948521.html Michael K. (2001) “Service on Call” in Banking Technology News Service Network. http
/ www.fineos.com / documentation/ features/ bankreach.com. Nigel H. & Jim A. (2000) “Handbook of Customer Satisfaction and Loyalty
Measurement, Second edition”. Proctor R. A (1994) "Queues and the Power of Simulation: Helping with Business
Decisions and Problems", Management Decision, Vol. 32 Iss: 1, pp.50 – 55 Safaricom website, .. (n.d.). http://safaricom.co.ke. Shah A. (2007). The Yale Journal of Public Health. Available at:
http://www.cdc.gov/news/2007/03/images/mobiletech.pdf. Shioyama T. (1991), "Optimal control of queuing network system with two types of
customers", European Journal of Operational Research, Vol. 52 pp.367-72. Sridhar M. S. (1998) "Customer participation in service production and delivery system".
Library science with a slant to documentation and information studies. Vol .35(3); pI57-163.
40
Sridhar M. S. ( 2001) Waiting Lines and Customer Satisfaction. SRELS Journal of Information Management, 2001, vol. 38, n. 2, pp. 99-112. [Journal Article (Print/Paginated)]
Stahl M. J. (1999), Perspectives in Total Quality. Blackwell, Milwaukee, WI. Turban E. (2002). Electronic Commerce: A Managerial Perspective. Prentice Hall. William J. S. (2009) “Operations Management, Tenth Edition” McGraw-Hill, 2009 Yechiali U., Altmand, E. & Kofma, D. (1995) “Discrete Time Queues with Delayed
Information Vol. 19:361-376. Yin R.K. (1984). Design and Methods: Case study research. Newbury Park, CA: Sage
Yu Mobile Website. (n.d) http://www.yu.co.ke
41
APPENDICES
Appendix I: Questionnaire This questionnaire is for the purpose of collecting data for the purpose of academic
research. This questionnaire will benefit the researcher in accomplishing academic goals.
You are kindly requested to answer the questions genuinely and exhaustively. Please tick
within the boxes and fill the structured questionnaire with applicable answer to enable the
study to be successful.
Customers Questionnaire
Section A: General Information
1. Indicate your gender
Male ( ) Female ( )
2. Indicate your age
i) Below 13 years ( ) ii) 14-23 years ( ) iii) 24-35 years ( )
iv) 36-50 years ( ) v) Above 50 years ( )
3. What is your professional status?
i) Student ( )
ii) Employed ( )
iii) Unemployed ( )
iv) Retired ( )
4. a) Who is your mobile service provider?
i) Safaricom Limited ( )
ii) Airtel Kenya ( )
iii) Yu- Mobile ( )
iv) Orange Telkom ( )
v) Any other
b. What makes you stay with the service provider you have selected in (a) above?