Page 1
AWR Reports
Introduction Differences between AWR and Statspack Workload Repository Reports AWR Snapshots and Baselines Quick Summary on AWR Sections Reading the AWR Report
- Header Section:
- Cache Sizes
- Load Profile
- Instance Efficiency
- Shared Pool Statistics
- Top 5 Timed Foreground Events
- Common Waits Events *******
- Time Model Statistics
- Operating System Statistics
- Foreground Wait Class and Foreground Wait Events
- Foreground Wait Class
- Foreground Wait Events
- Background Wait Events
- Service Statistics
- SQL Information Section
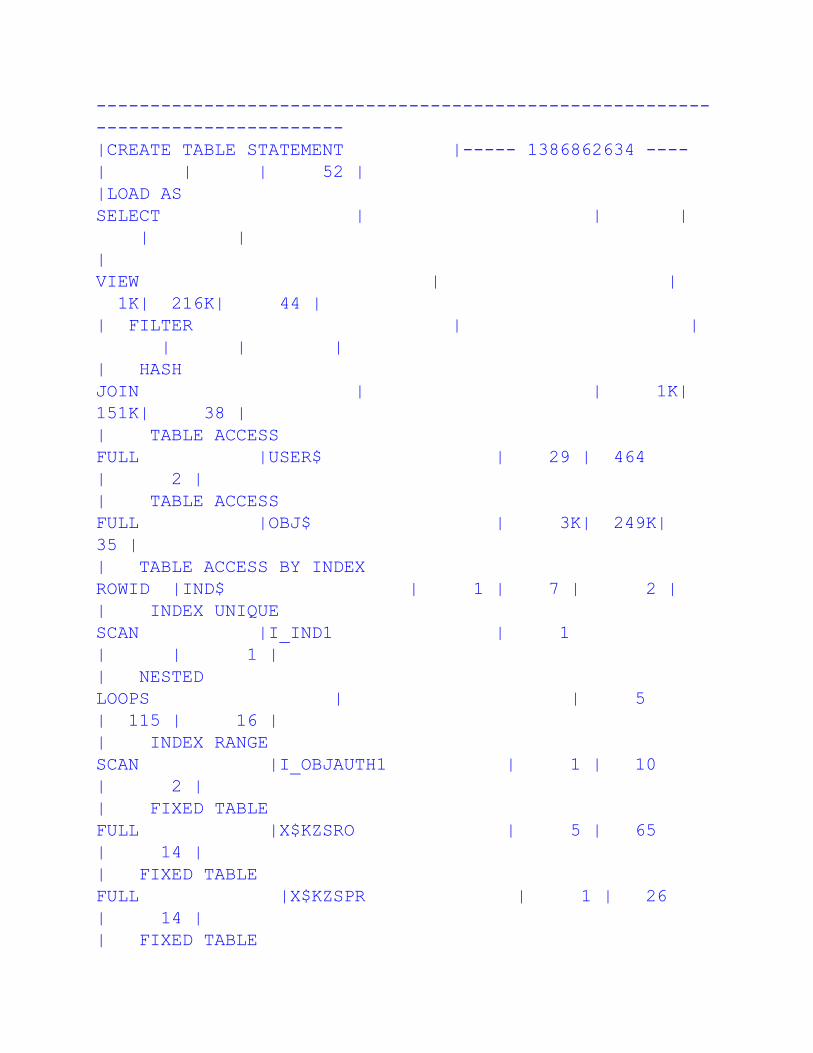
- Generate Execution Plan for given SQL statement
- Instance Activity Stats Section
- I/O Stats Section
- Tablespace IO Stats
- File IO Stats
- Buffer Pool Statistics Section
- Advisory Statistics Section
- Instance Recovery Stats
- Buffer Pool Advisory
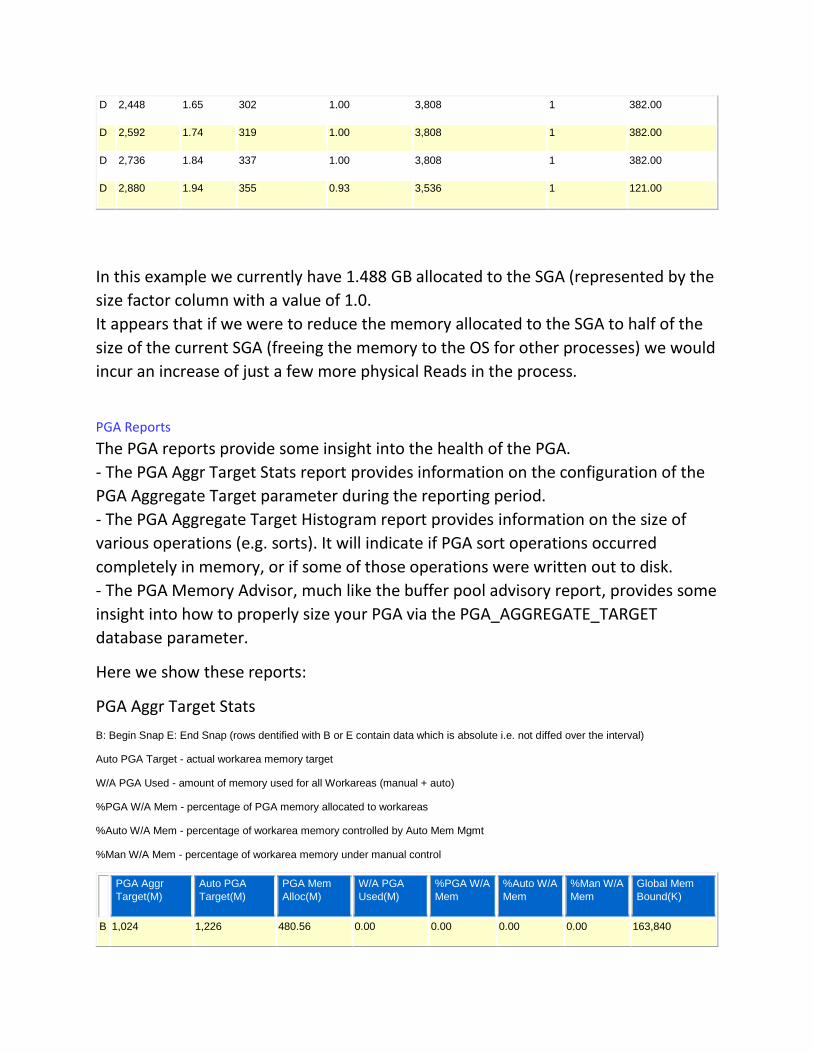
- PGA Reports
- PGA Aggr Target Stats
- PGA Aggr Target Histogram
- PGA Memory Advisory
Page 2
- Shared Pool Advisory
- SGA Target Advisory
- Buffer Waits Statistics
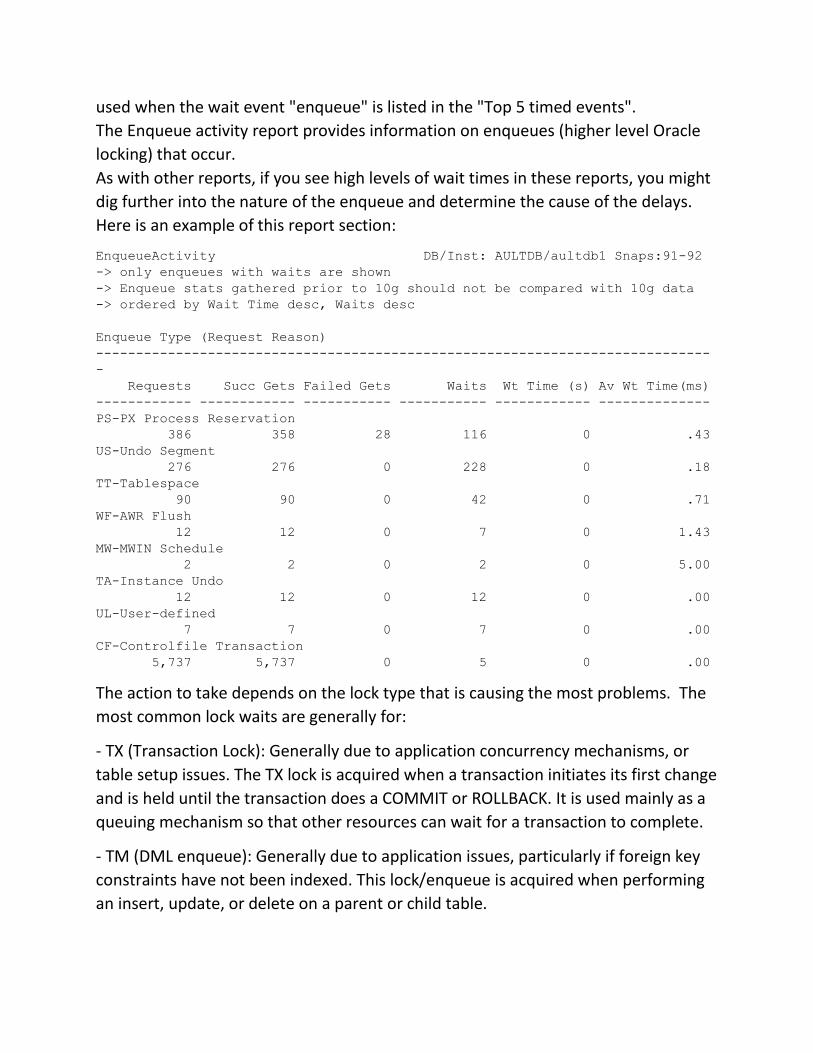
- Enqueue Statistics
- UNDO Statistics Section
- Latch Statistics
- Segments by Logical Reads and Segments by Physical Reads
- Segments by Logical Reads
- Segments by Physical Reads
- Segments by Physical Read Requests
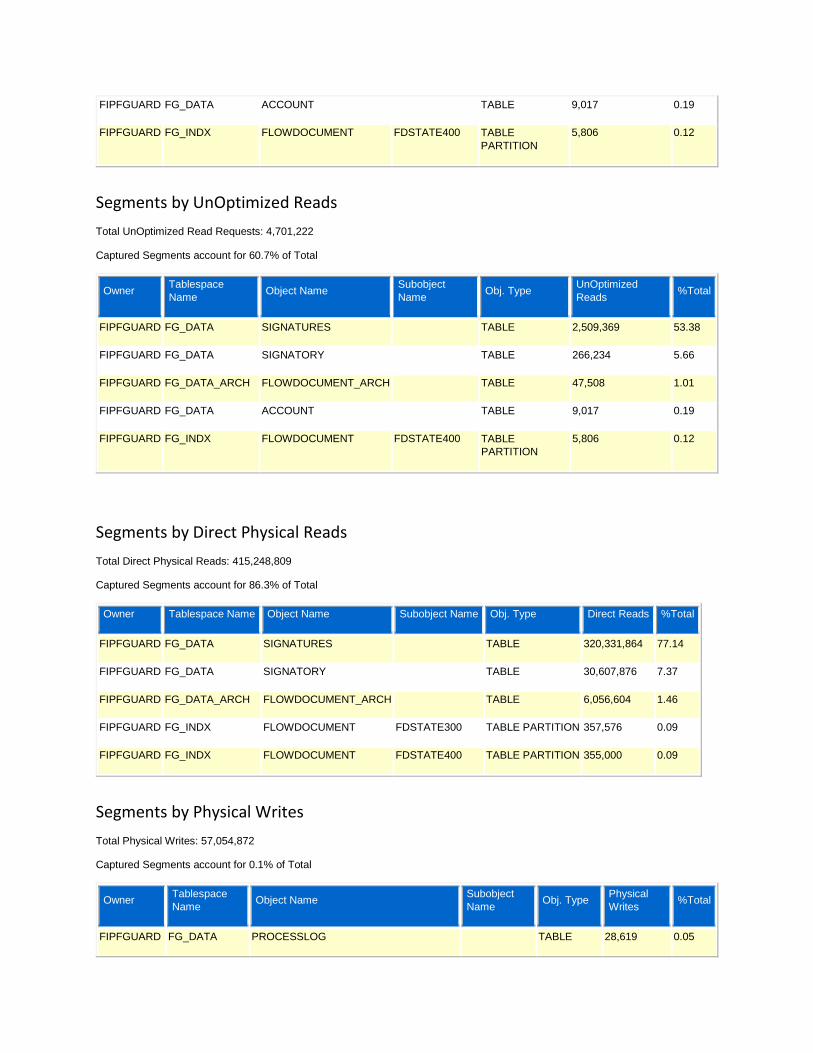
- Segments by UnOptimized Reads
- Segments by Direct Physical Reads
- Segments by Physical Writes
- Segments by Physical Write Requests
- Segments by Direct Physical Writes
- Segments by Table Scans
- Segments by DB Blocks Changes
- Segments by Row Lock Waits
- Segments by ITL Waits
- Segments by Buffer Busy Waits Retrieve SQL and Execution Plan from AWR Snapshots Get Data from ASH Moving AWR Information Links with AWR Analyzer
Introduction AWR periodically gathers and stores system activity and workload data which is then
analyzed by ADDM. Every layer of Oracle is equipped with instrumentation that
gathers information on workload which will then be used to make self-managing
decisions. AWR is the place where this data is stored. AWR looks periodically at the
system performance (by default every 60 minutes) and stores the information found
(by default up to 7 days). AWR runs by default and Oracle states that it does not add
a noticeable level of overhead. A new background server process (MMON) takes
snapshots of the in-memory database statistics (much like STATSPACK) and stores
this information in the repository. MMON also provides Oracle with a server initiated
alert feature, which notifies database administrators of potential problems (out of
Page 3
space, max extents reached, performance thresholds, etc.). The information is stored
in the SYSAUX tablespace. This information is the basis for all self-management
decisions.
To access Automatic Workload Repository through Oracle Enterprise
Manager Database Control:
On the Administration page, select the Workload Repository link under Workload.
From the Automatic Workload Repository page, you can manage snapshots or
modify AWR settings.
o To manage snapshots, click the link next to Snapshots or Preserved Snapshot
Sets. On the Snapshots or Preserved Snapshot Sets pages, you can:
+ View information about snapshots or preserved snapshot sets (baselines).
+ Perform a variety of tasks through the pull-down Actions menu, including
creating additional snapshots, preserved snapshot sets from an existing range of
snapshots, or an ADDM task to perform analysis on a range of snapshots or a set of
preserved snapshots.
o To modify AWR settings, click the Edit button. On the Edit Settings page, you
can set the Snapshot Retention period and Snapshot Collection interval.
Most informative sections of the report
I find the following sections most useful:
- Summary
- Top 5 timed events
- Top SQL (by elapsed time, by gets, sometimes by reads)
When viewing AWR report, always check corresponding ADDM report for actionable
recommendations. ADDM is a self diagnostic engine designed from the experience of
Oracle’s best tuning experts. Analyzes AWR data automatically after an AWR
snapshot. Makes specific performance recommendations.
Both the snapshot frequency and retention time can be modified by the user. To see
the present settings, you could use: select snap_interval, retention from dba_hist_wr_control;
SNAP_INTERVAL RETENTION
Page 4
------------------- -------------------
+00000 01:00:00.0 +00007 00:00:00.0
or
select dbms_stats.get_stats_history_availability from dual;
select dbms_stats.get_stats_history_retention from dual;
This SQL shows that the snapshots are taken every hour and the collections are
retained for 7 days
If you want to extend that retention period you can execute:
execute
dbms_workload_repository.modify_snapshot_settings(
interval => 60, -- In Minutes. Current value retained if NULL.
retention => 43200); -- In Minutes (= 30 Days). Current value retained if NULL
In this example the retention period is specified as 30 days (43200 min) and the
interval between each snapshot is 60 min.
Differences between AWR and STATSPACK
report 1)Statspack snapshot purges must be scheduled manually. When the Statspack
tablespace runs out of space, Statspack quits working. AWR snapshots are purged
automatically by MMON every night. MMON, by default, tries to keep one week's
worth of AWR snapshots available. If AWR detects that the SYSAUX tablespace is in
danger of running out of space, it will free space in SYSAUX by automatically deleting
the oldest set of snapshots. If this occurs, AWR will initiate a server-generated alert
to notify administrators of the out-of-space error condition.
2)The AWR repository holds all of the statistics available in STATSPACK as well as
some additional statistics which are not.
Page 5
3)STATSPACK does not store the Active Session History (ASH) statistics which are
available in the AWR dba_hist_active_sess_history view.
4)STATSPACK does not store history for new metric statistics introduced in Oracle.
The key AWR views
are: dba_hist_sysmetric_history and dba_hist_sysmetric_summary.
5)The AWR also contains views such
as dba_hist_service_stat , dba_hist_service_wait_class and dba_hist_service_name ,
which store history for performance cumulative statistics tracked for specific
services.
6)The latest version of STATSPACK included with Oracle contains a set of specific
tables, which track history of statistics that reflect the performance of the Oracle
Streams feature. These tables are stats$streams_capture , stats$streams_apply_sum
, stats$buffered_subscribers , stats$rule_set , stats$propagation_sender ,
stats$propagation_receiver and stats$buffered_queues . The AWR does not contain
the specific tables that reflect Oracle Streams activity; therefore, if a DBA relies
heavily on the Oracle Streams feature, it would be useful to monitor its performance
using STATSPACK utility.
7)Statspack snapshots must be run by an external scheduler (dbms_jobs, CRON,
etc.). AWR snapshots are scheduled every 60 minutes by default.
8)ADDM captures a much greater depth and breadth of statistics than Statspack
does. During snapshot processing, MMON transfers an in-memory version of the
statistics to the permanent statistics tables.
Workload Repository Reports Oracle provide two main scripts to produce workload repository reports. They are
similar in format to the statspack reports and give the option of HTML or plain text
formats. The two reports give essential the same output but the awrrpti.sql allows
you to select a single instance. The reports can be generated as follows:
Page 6
@$ORACLE_HOME/rdbms/admin/awrrpt.sql
@$ORACLE_HOME/rdbms/admin/awrrpti.sql
There are other scripts too, here is the full list:
REPORT NAME SQL Script
Automatic Workload Repository Report awrrpt.sql
Automatic Database Diagnostics Monitor Report addmrpt.sql
ASH Report ashrpt.sql
AWR Diff Periods Report awrddrpt.sql
AWR Single SQL Statement Report awrsqrpt.sql
AWR Global Report awrgrpt.sql
AWR Global Diff Report awrgdrpt.sql
The scripts prompt you to enter the report format (html or text), the start snapshot
id, the end snapshot id and the report filename. This script looks like Statspack; it
shows all the AWR snapshots available and asks for two specific ones as interval
boundaries.
AWR Snapshots and Baselines You can create a snapshot manually using: EXEC dbms_workload_repository.create_snapshot;
You can see what snapshots are currently in the AWR by using the
DBA_HIST_SNAPSHOT view as seen in this example:
SELECT snap_id, to_char(begin_interval_time,'dd/MON/yy hh24:mi')
Begin_Interval,
to_char(end_interval_time,'dd/MON/yy hh24:mi')
End_Interval
Page 7
FROM dba_hist_snapshot
ORDER BY 1;
SNAP_ID BEGIN_INTERVAL END_INTERVAL
---------- --------------- ---------------
954 30/NOV/05 03:01 30/NOV/05 04:00
955 30/NOV/05 04:00 30/NOV/05 05:00
956 30/NOV/05 05:00 30/NOV/05 06:00
957 30/NOV/05 06:00 30/NOV/05 07:00
958 30/NOV/05 07:00 30/NOV/05 08:00
959 30/NOV/05 08:00 30/NOV/05 09:00
Each snapshot is assigned a unique snapshot ID that is reflected in the SNAP_ID
column. The END_INTERVAL_TIME column displays the time that the actual snapshot
was taken.
Sometimes you might want to drop snapshots manually.
The dbms_workload_repository.drop_snapshot_range procedure can be used to
remove a range of snapshots from the AWR. This procedure takes two parameters,
low_snap_id and high_snap_id, as seen in this example:
EXEC
dbms_workload_repository.drop_snapshot_range(low_snap_id=>1107,
high_snap_id=>1108);
The following workload repository views are available:
* V$ACTIVE_SESSION_HISTORY - Displays the active session history (ASH) sampled
every second.
* V$METRIC - Displays metric information.
* V$METRICNAME - Displays the metrics associated with each metric group.
* V$METRIC_HISTORY - Displays historical metrics.
* V$METRICGROUP - Displays all metrics groups.
* DBA_HIST_ACTIVE_SESS_HISTORY - Displays the history contents of the active
session history.
* DBA_HIST_BASELINE - Displays baseline information.
* DBA_HIST_DATABASE_INSTANCE - Displays database environment information.
* DBA_HIST_SNAPSHOT - Displays snapshot information.
* DBA_HIST_SQL_PLAN - Displays SQL execution plans.
Page 8
* DBA_HIST_WR_CONTROL - Displays AWR settings.
Finally , you can use the following query to identify the occupants of the SYSAUX
Tablespace
select substr(occupant_name,1,40), space_usage_kbytes
from v$sysaux_occupants;
AWR Automated Snapshots
Oracle uses a scheduled job, GATHER_STATS_JOB, to collect AWR statistics. This job
is created, and enabled automatically, when you create a new Oracle database. To
see this job, use the DBA_SCHEDULER_JOBS view as seen in this example:
SELECT a.job_name, a.enabled, c.window_name,
c.schedule_name, c.start_date, c.repeat_interval
FROM dba_scheduler_jobs a, dba_scheduler_wingroup_members
b, dba_scheduler_windows c
WHERE job_name='GATHER_STATS_JOB'
And a.schedule_name=b.window_group_name
And b.window_name=c.window_name;
You can disable this job using the dbms_scheduler.disable procedure as seen in this
example: Exec dbms_scheduler.disable('GATHER_STATS_JOB');
And you can enable the job using the dbms_scheduler.enable procedure as seen in
this example: Exec dbms_scheduler.enable('GATHER_STATS_JOB');
AWR Baselines
It is frequently a good idea to create a baseline in the AWR. A baseline is defined as a
range of snapshots that can be used to compare to other pairs of snapshots. The
Oracle database server will exempt the snapshots assigned to a specific baseline
from the automated purge routine. Thus, the main purpose of a baseline is to
preserve typical runtime statistics in the AWR repository, allowing you to run the
Page 9
AWR snapshot reports on the preserved baseline snapshots at any time and compare
them to recent snapshots contained in the AWR. This allows you to compare current
performance (and configuration) to established baseline performance, which can
assist in determining database performance problems.
Creating baselines
You can use the create_baseline procedure contained in the
dbms_workload_repository stored PL/SQL package to create a baseline as seen in
this example: EXEC dbms_workload_repository.create_baseline
(start_snap_id=>1109, end_snap_id=>1111, baseline_name=>'EOM
Baseline');
Baselines can be seen using the DBA_HIST_BASELINE view as seen in the following
example: SELECT baseline_id, baseline_name, start_snap_id, end_snap_id
FROM dba_hist_baseline;
BASELINE_ID BASELINE_NAME START_SNAP_ID END_SNAP_ID
----------- --------------- ------------- -----------
1 EOM Baseline 1109 1111
In this case, the column BASELINE_ID identifies each individual baseline that has
been defined. The name assigned to the baseline is listed, as are the beginning and
ending snapshot IDs.
Removing baselines
The pair of snapshots associated with a baseline are retained until the baseline is
explicitly deleted. You can remove a baseline using the
dbms_workload_repository.drop_baseline procedure as seen in this example that
drops the “EOM Baseline” that we just created. EXEC dbms_workload_repository.drop_baseline (baseline_name=>'EOM
Baseline', Cascade=>FALSE);
Note that the cascade parameter will cause all associated snapshots to be removed if
it is set to TRUE; otherwise, the snapshots will be cleaned up automatically by the
AWR automated processes.
Page 10
Quick Summary on AWR Sections
This section contains detailed guidance for evaluating each section of an AWR
report.
Report Summary Section:
This gives an overall summary of the instance during the snapshot period, and it
contains important aggregate summary information.
- Cache Sizes: This shows the size of each SGA region after AMM has changed
them. This information can be compared to the original init.ora parameters at the
end of the AWR report.
- Load Profile: This section shows important rates expressed in units of per second
and transactions per second.
- Instance Efficiency Percentages: With a target of 100%, these are high-level ratios
for activity in the SGA.
- Shared Pool Statistics: This is a good summary of changes to the shared pool during
the snapshot period.
- Top 5 Timed Events: This is the most important section in the AWR report. It shows
the top wait events and can quickly show the overall database bottleneck.
Wait Events Statistics Section
This section shows a breakdown of the main wait events in the database including
foreground and background database wait events as well as time model, operating
system, service, and wait classes statistics.
- Time Model Statistics: Time mode statistics report how database-processing time is
spent. This section contains detailed timing information on particular components
participating in database processing.
- Wait Class:
- Wait Events: This AWR report section provides more detailed wait event
information for foreground user processes which includes Top 5 wait events and
many other wait events that occurred during the snapshot interval.
- Background Wait Events: This section is relevant to the background process wait
events.
- Operating System Statistics: The stress on the Oracle server is important, and this
Page 11
section shows the main external resources including I/O, CPU, memory, and network
usage.
- Service Statistics: The service statistics section gives information about how
particular services configured in the database are operating.
- Service Wait Class Stats:
SQL Statistics Section
This section displays top SQL, ordered by important SQL execution metrics.
- SQL Ordered by Elapsed Time: Includes SQL statements that took significant
execution time during processing.
- SQL Ordered by CPU Time: Includes SQL statements that consumed significant CPU
time during its processing.
- SQL Ordered by Gets: These SQLs performed a high number of logical reads while
retrieving data.
- SQL Ordered by Reads: These SQLs performed a high number of physical disk reads
while retrieving data.
- SQL Ordered by Executions:
- SQL Ordered by Parse Calls: These SQLs experienced a high number of reparsing
operations.
- SQL Ordered by Sharable Memory: Includes SQL statements cursors which
consumed a large amount of SGA shared pool memory.
- SQL Ordered by Version Count: These SQLs have a large number of versions in
shared pool for some reason.
- Complete List of SQL Text:
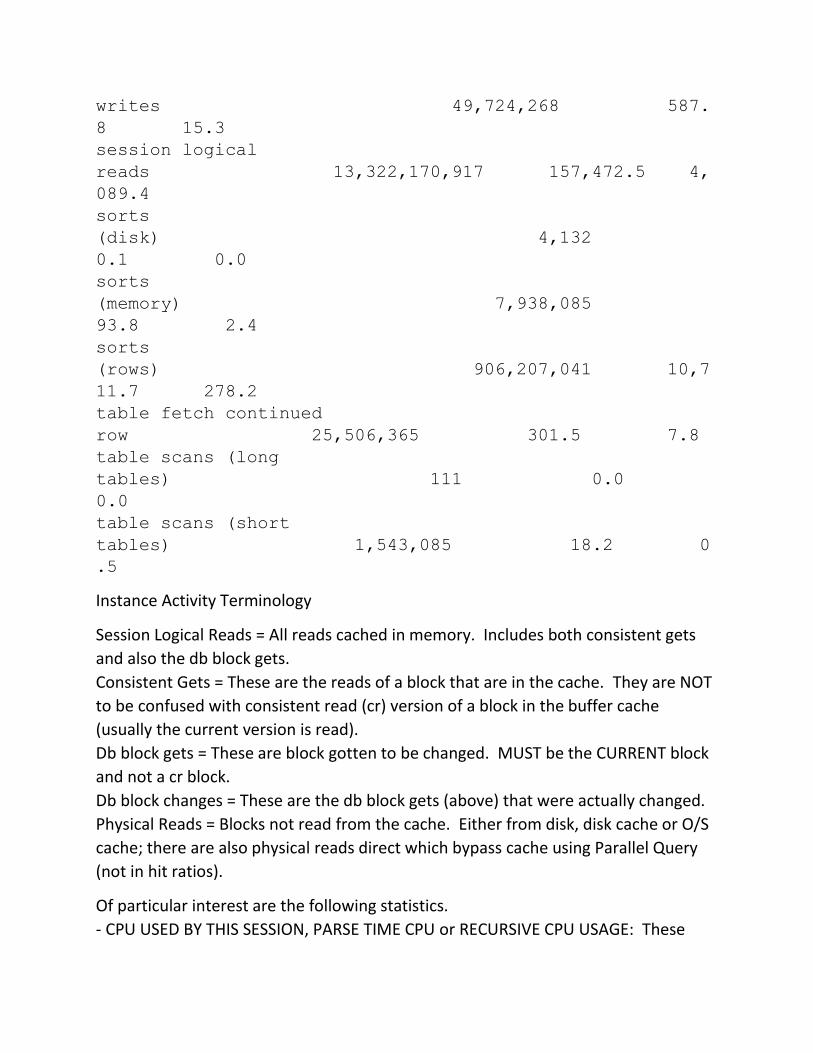
Instance Activity Stats
This section contains statistical information describing how the database operated
during the snapshot period.
- Instance Activity Stats - Absolute Values: This section contains statistics that have
absolute values not derived from end and start snapshots.
- Instance Activity Stats - Thread Activity: This report section reports a log switch
activity statistic.
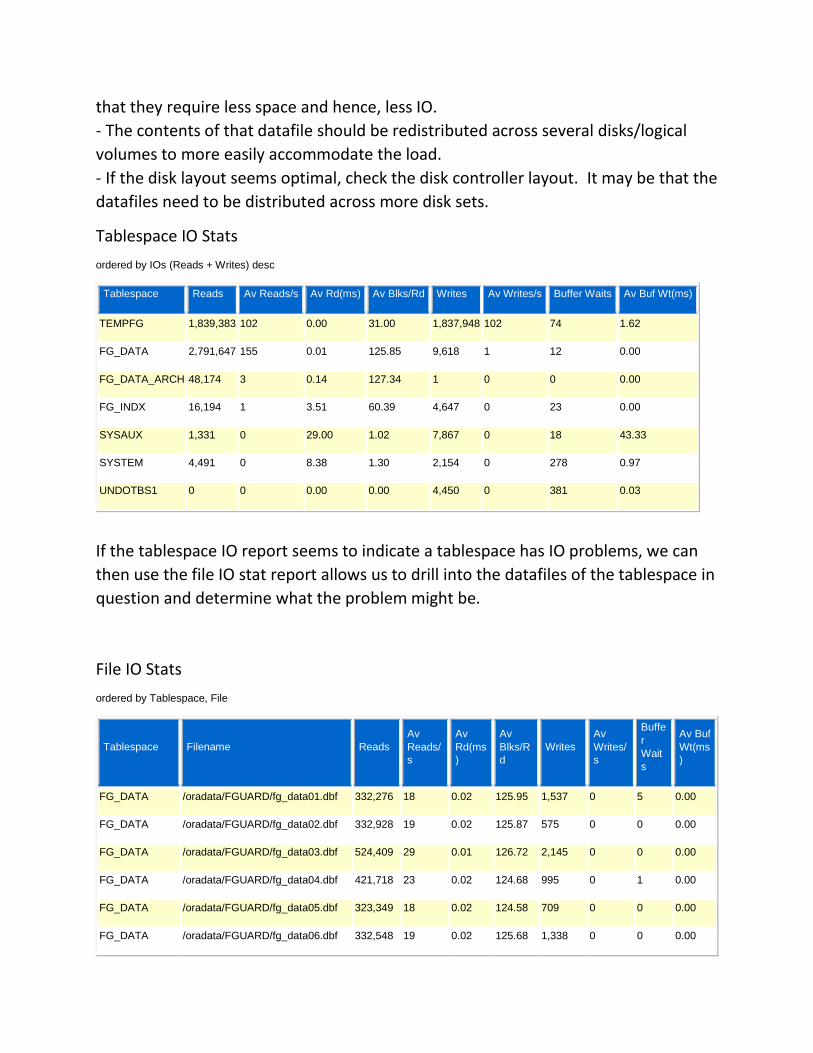
I/O Stats Section
This section shows the all important I/O activity for the instance and shows I/O
activity by tablespace, data file, and includes buffer pool statistics.
Page 12
- Tablespace IO Stats
- File IO Stats
Buffer Pool Statistics Section
Advisory Statistics Section
This section show details of the advisories for the buffer, shared pool, PGA and Java
pool.
- Instance Recovery Stats:
- Buffer Pool Advisory:
- PGA Aggr Summary: PGA Aggr Target Stats; PGA Aggr Target Histogram; and PGA
Memory Advisory.
- Shared Pool Advisory:
- SGA Target Advisory
- Stream Spool Advisory
- Java Pool Advisory
Wait Statistics Section
- Buffer Wait Statistics: This important section shows buffer cache waits statistics.
- Enqueue Activity: This important section shows how enqueue operates in the
database. Enqueues are special internal structures which provide concurrent access
to various database resources.
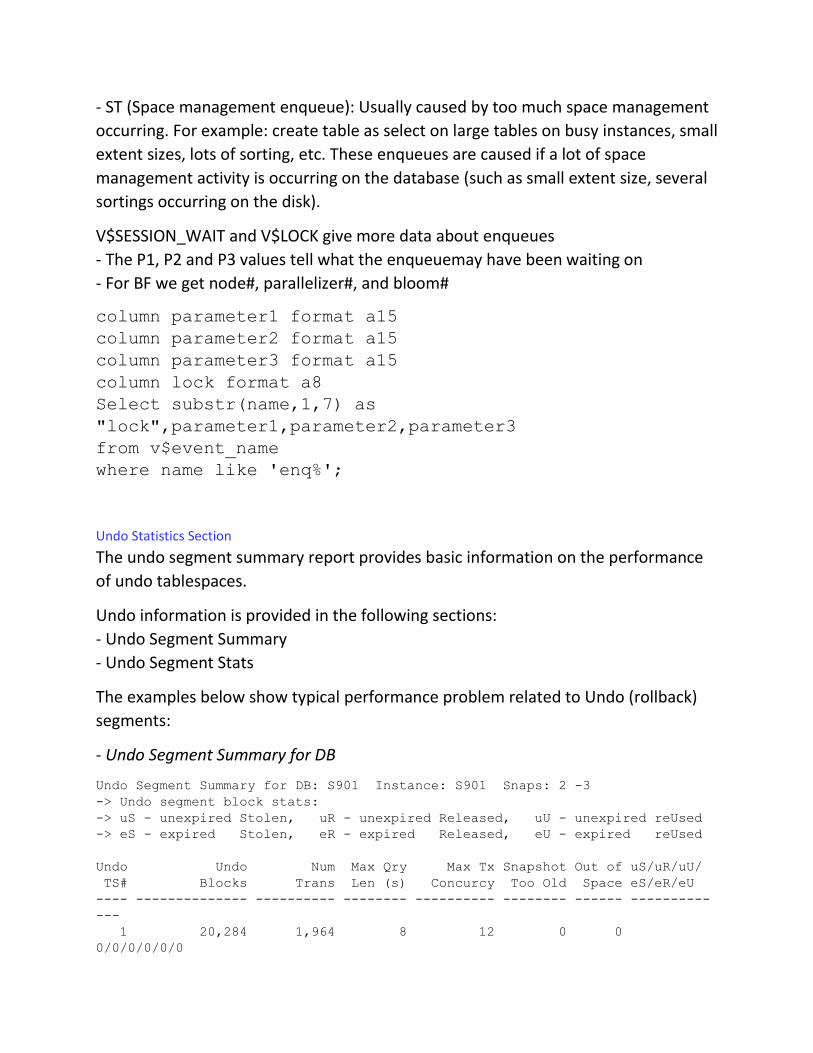
Undo Statistics Section
- Undo Segment Summary: This section gives a summary about how undo segments
are used by the database.
- Undo Segment Stats: This section shows detailed history information about undo
segment activity.
Latch Statistics Section:
This section shows details about latch statistics. Latches are a lightweight
serialization mechanism that is used to single-thread access to internal Oracle
structures.
- Latch Activity
- Latch Sleep Breakdown
- Latch Miss Sources
Page 13
- Parent Latch Statistics
- Child Latch Statistics
Segment Statistics Section:
This report section provides details about hot segments using the following criteria:
- Segments by Logical Reads: Includes top segments which experienced high number
of logical reads.
- Segments by Physical Reads: Includes top segments which experienced high
number of disk physical reads.
- Segments by Row Lock Waits: Includes segments that had a large number of row
locks on their data.
- Segments by ITL Waits: Includes segments that had a large contention for
Interested Transaction List (ITL). The contention for ITL can be reduced by increasing
INITRANS storage parameter of the table.
- Segments by Buffer Busy Waits: These segments have the largest number of buffer
waits caused by their data blocks.
Dictionary Cache Stats Section
This section exposes details about how the data dictionary cache is operating.
Library Cache Section
Includes library cache statistics describing how shared library objects are managed
by Oracle.
Memory Statistics Section
- Process Memory Summary
- SGA Memory Summary: This section provides summary information about various
SGA regions.
- SGA Breakdown difference:
Streams Statistics Section
- Streams CPU/IO Usage
- Streams Capture
- Streams Apply
- Buffered Queues
- Buffered Subscribers
Page 14
- Rule Set
Reading the AWR Report
The main sections in an AWR report include:
AWR Report Header:
This section shows basic information about the report like when the snapshot was
taken, for how long, Cache Sizes at the beginning and end of the Snapshot, etc.
WORKLOAD REPOSITORY report for
DB Name DB Id Instance Inst num Startup Time Release RAC
FGUARD 750434027 FGUARD 1 03-Jul-13 21:07 11.2.0.2.0 NO
Host Name Platform CPUs Cores Sockets Memory (GB)
atl-frauddb-04.fiservipo.com Linux x86 64-bit 16 8 2 11.72
Snap Id Snap Time Sessions Cursors/Session
Begin Snap: 20813 08-Jul-13 00:00:19 267 3.1
End Snap: 20854 09-Jul-13 15:54:14 278 3.6
Elapsed: 2,393.91 (mins)
DB Time: 4,689.46 (mins)
Cache Sizes
Begin End
Buffer Cache: 1,520M 1,344M Std Block Size: 8K
Shared Pool Size: 1,120M 1,296M Log Buffer: 8,632K
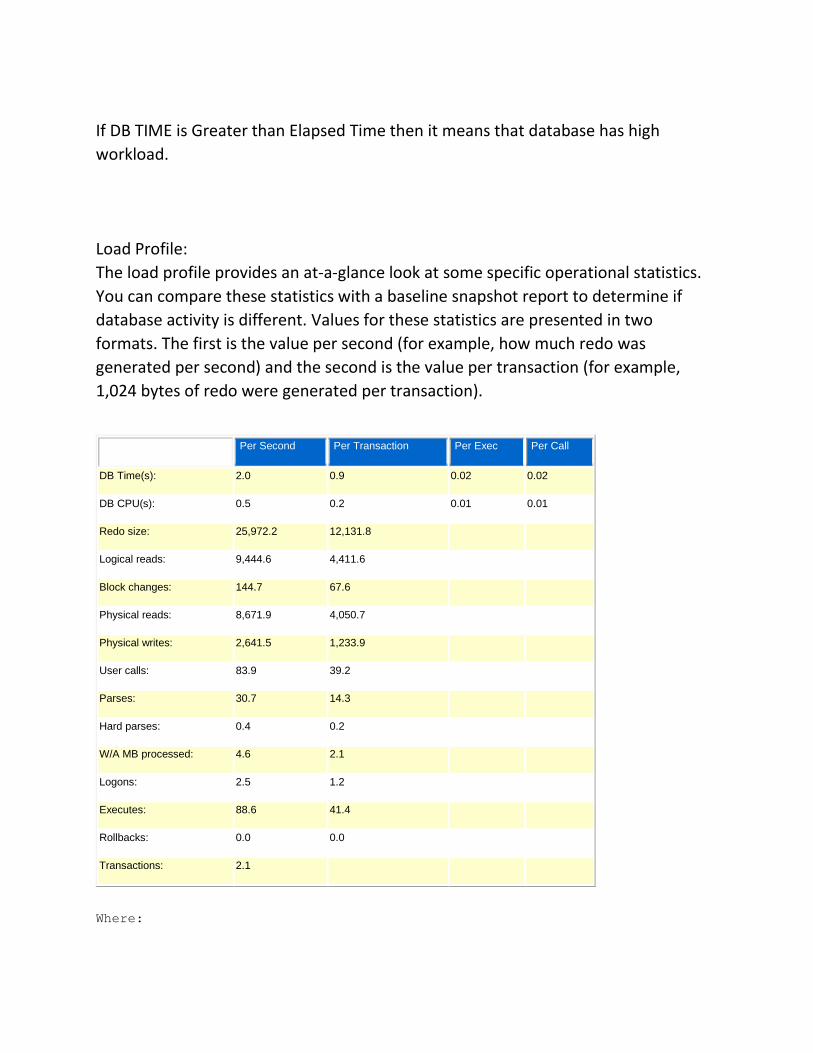
Elasped Time: It represents the snapshot window or the time between the two
snapshots.
DB TIME: Represents the activity on the database.
Page 15
If DB TIME is Greater than Elapsed Time then it means that database has high
workload.
Load Profile:
The load profile provides an at-a-glance look at some specific operational statistics.
You can compare these statistics with a baseline snapshot report to determine if
database activity is different. Values for these statistics are presented in two
formats. The first is the value per second (for example, how much redo was
generated per second) and the second is the value per transaction (for example,
1,024 bytes of redo were generated per transaction).
Per Second Per Transaction Per Exec Per Call
DB Time(s): 2.0 0.9 0.02 0.02
DB CPU(s): 0.5 0.2 0.01 0.01
Redo size: 25,972.2 12,131.8
Logical reads: 9,444.6 4,411.6
Block changes: 144.7 67.6
Physical reads: 8,671.9 4,050.7
Physical writes: 2,641.5 1,233.9
User calls: 83.9 39.2
Parses: 30.7 14.3
Hard parses: 0.4 0.2
W/A MB processed: 4.6 2.1
Logons: 2.5 1.2
Executes: 88.6 41.4
Rollbacks: 0.0 0.0
Transactions: 2.1
Where:
Page 16
DB time(s): It's the amount of time oracle has spent performing database user
calls. Note it does not include background processes.
DB CPU(s): It's the amount of CPU time spent on user calls. As DB time, it
does not include background process. The value is in microseconds
Redo size: This is the amount of DML happening in the DB. If you see an
increase here then more DML statements are taking place (meaning your users
are doing more INSERTs, UPDATEs, and DELETEs than before). For example, the
table below shows that an average transaction generates about 12,000 of redo
data along with around 26,000 redo per second.
Logical reads: This is calculated as Consistent Gets + DB Block Gets
= Logical Reads
Block Changes: The number of blocks modified during the sample interval. If
you see an increase here then more DML statements are taking place (meaning
your users are doing more INSERTs, UPDATEs, and DELETEs than before).
Physical reads: The number of requests for a block that caused a physical
I/O.
Physical writes: Number of physical writes performed
User calls: Indicates how many user calls have occurred during the snapshot
period. This value can give you some indication if usage has increased.
Parses: The total of all parses; both hard and soft.
Hard Parses: Those parses requiring a completely new parse of the SQL
statement. A ‘hard parse’ rate of greater than 100 per second indicates
there is a very high amount of hard parsing on the system. High hard parse
rates cause serious performance issues, and must be investigated. A high hard
parse rate is usually accompanied by latch contention on the shared pool and
library cache latches. Check whether waits for ‘latch free’ appear in the
top-5 wait events, and if so, examine the latching sections of the report. Of
course, we want a low number here. Possible reasons for excessive hard parses
may be a small shared pool or may be that bind variables are not being used.
Soft Parses: Not listed but derived by subtracting the hard parses from
parses. A soft parse reuses a previous hard parse and hence consumes far
fewer resources. A high soft parse rate could be anywhere in the rate of 300
or more per second. Unnecessary soft parses also limit application
scalability; optimally a SQL statement should be soft-parsed once per
session, and executed many times.
Sorts: Number of sorts occurring in the database
Logons: No of logons during the interval
Executes: how many statements we are executing per second / transaction
Transactions: How many transactions per second we process
The per-second statistics show you the changes in throughput (i.e. whether the
instance is performing more work per second). For example:
• a significant increase in ‘redo size’, ‘block changes’ and ‘pct of blocks changed per
read’ would indicate the instance is performing more inserts/updates/deletes.
• an increase in the ‘redo size’ without an increase in the number of ‘transactions
per second’ would indicate a changing transaction profile.
Similarly, looking at the per-transaction statistics allows you to identify changes in
the application characteristics by comparing these to the corresponding statistics
from the baseline report.
Page 17
Additionally, the load profile section provides the percentage of blocks that were
changed per read, the percentage of recursive calls that occurred, the percentage of
transactions that were rolled back and the number of rows sorted per sort
operation.
In this example
• Comparing the number of Physical reads per second to the number of Physical
writes per second shows the physical read to physical write ratio is very high. Typical
OLTP systems have a read-to-write ratio of 10:1 or 5:1
• This system is busy, with 84 User calls per second.
Instance Efficiency Percentages (Target 100%)
These statistics include several buffer related ratios including the buffer hit
percentage and the library hit percentage. Also, shared pool memory usage statistics
are included in this section.
Buffer Nowait %: 100.00 Redo NoWait %: 100.00
Buffer Hit %: 99.32 In-memory Sort %: 100.00
Library Hit %: 98.94 Soft Parse %: 97.25
Execute to Parse %: 75.00 Latch Hit %: 98.78
Parse CPU to Parse Elapsd %: 22.99 % Non-Parse CPU: 99.93
Buffer Nowait Ratio. This is the percentage of time that the instance made a call to
get a buffer (all buffer types are included here) and that buffer was made available
immediately (meaning it didn't have to wait for the buffer...hence "Buffer Nowait").
If the ratio is low, then could be a (hot) block(s) being contended for that should be
found in the Buffer Wait Section.. If the ratio is low, check the Buffer Wait Statistics
section of the report for more detail on which type of block is being contended for.
Buffer Hit Ratio. (also known as the buffer-cache hit ratio) Ideally more than 95
percent. It shows the % of times a particular block was found in buffer cache insted
of performing a physical I/O (reading from disk).
Although historically known as one of the most important statistics to evaluate, this
ratio can sometimes be misleading. A low buffer hit ratio does not necessarily mean
the cache is too small; it may be that potentially valid full-table scans are artificially
reducing what is otherwise a good ratio. Similarly, a high buffer hit ratio (say, 99
Page 18
percent) normally indicates that the cache is adequately sized, but this assumption
may not always be valid. For example, frequently executed SQL statements that
repeatedly refer to a small number of buffers via indexed lookups can create a
misleadingly high buffer hit ratio. When these buffers are read, they are placed at
the most recently used (MRU) end of the buffer cache; iterative access to these
buffers can artificially inflate the buffer hit ratio. This inflation makes tuning the
buffer cache a challenge. Sometimes you can identify a too-small buffer cache by the
appearance of the write complete waits event, which indicates that hot blocks (that
is, blocks that are still being modified) are aging out of the cache while they are still
needed; check the Wait Events list for evidence of this event. If the number is
negative, the BUFFER_CACHE is too small and the data is bein aged out before it can
be used.
Library Hit Ratio. This ratio, also known as the library-cache hit ratio, gives the
percentage of pin requests that result in pin hits. A pin hit occurs when the SQL or
PL/SQL code to be executed is already in the library cache and is valid to execute. If
the "Library Hit ratio" is low, it could be indicative of a shared pool that is too small
(SQL is prematurely pushed out of the shared pool), or just as likely, that the system
did not make correct use of bind variables in the application. If the soft parse ratio is
also low, check whether there's a parsing issue. A lower ratio could also indicate that
bind variables are not used or some other issue is causing SQL not to be reused (in
which case a smaller shared pool may only be a band-aid that will potentially fix a
library latch problem which may result).
Execute to Parse. If value is negative, it means that the number of parses is larger
than the number of executions. Another cause for a negative execute to parse ratio
is if the shared pool is too small and queries are aging out of the shared pool and
need to be reparsed. This is another form of thrashing which also degrades
performance tremendously. So, if you run some SQL and it has to be parsed every
time you execute it (because no plan exists for this statement) then your percentage
would be 0%. The more times that your SQL statement can reuse an existing plan the
higher your Execute to Parse ratio is. This is very BAD!! One way to increase your
parse ratio is to use bind variables.
Parse CPU to Parse Elapsd %: Generally, this is a measure of how available your CPU
cycles were for SQL parsing. If this is low, you may see "latch free" as one of your top
wait events.
Redo Nowait Ratio. This ratio indicates the amount of redo entries generated for
which there was space available in the redo log. The instance didn't have to wait to
Page 19
use the redo log if this is 100%
The redo-log space-request statistic is incremented when an Oracle process attempts
to write a redo-log entry but there is not sufficient space remaining in the online
redo log. Thus, a value close to 100 percent for the redo nowait ratio indicates
minimal time spent waiting for redo logs to become available, either because the
logs are not filling up very often or because the database is able to switch to a new
log quickly whenever the current log fills up.
If your alert log shows that you are switching logs frequently (that is, more than once
every 15 minutes), you may be able to reduce the amount of switching by increasing
the size of the online redo logs. If the log switches are not frequent, check the disks
on which the redo logs reside to see why the switches are not happening quickly. If
these disks are not overloaded, they may be slow, which means you could put the
files on faster disks.
In-Memory Sort Ratio. This ratio gives the percentage of sorts that were performed
in memory, rather than requiring a disk-sort segment to complete the sort.
Optimally, in an OLTP environment, this ratio should be high. Setting the
PGA_AGGREGATE_TARGET (or SORT_AREA_SIZE) initialization parameter effectively
will eliminate this problem, as a minimum you pretend to have this one in 95%
Soft Parse Ratio. This ratio gives the percentage of parses that were soft, as opposed
to hard. A soft parse occurs when a session attempts to execute a SQL statement and
a usable version of the statement is already in the shared pool. In other words, all
data (such as the optimizer execution plan) pertaining to the statement in the shared
pool is equally applicable to the statement currently being issued. A hard parse, on
the other hand, occurs when the current SQL statement is either not in the shared
pool or not there in a shareable form. An example of the latter case would be when
the SQL statement in the shared pool is textually identical to the current statement
but the tables referred to in the two statements resolve to physically different
tables.
Hard parsing is an expensive operation and should be kept to a minimum in an OLTP
environment. The aim is to parse once, execute many times.
Ideally, the soft parse ratio should be greater than 95 percent. When the soft parse
ratio falls much below 80 percent, investigate whether you can share SQL by using
bind variables or force cursor sharing by using
the init.ora parameter cursor_sharing.
Before you jump to any conclusions about your soft parse ratio, however, be sure to
compare it against the actual hard and soft parse rates shown in the Load Profile. If
Page 20
the rates are low (for example, 1 parse per second), parsing may not be a significant
issue in your system. Another useful standard of comparison is the proportion of
parse time that was not CPU-related, given by the following ratio: (parse time CPU) / (parse time elapsed)
A low value for this ratio could mean that the non-CPU-related parse time was spent
waiting for latches, which might indicate a parsing or latching problem. To
investigate further, look at the shared-pool and library-cache latches in the Latch
sections of the report for indications of contention on these latches.
Latch Hit Ratio. This is the ratio of the total number of latch misses to the number of
latch gets for all latches. A low value for this ratio indicates a latching problem,
whereas a high value is generally good. However, as the data is rolled up over all
latches, a high latch hit ratio can artificially mask a low get rate on a specific latch.
Cross-check this value with the Top 5 Wait Events to see if latch free is in the list, and
refer to the Latch sections of the report. Latch Hit % of less than 99 percent is usually
a big problem.
Also check the "Shared Pool Statistics", if the "End" value is in the high 95%-100%
range ,this is a indication that the shared pool needs to be increased (especially if the
"Begin" value is much smaller)
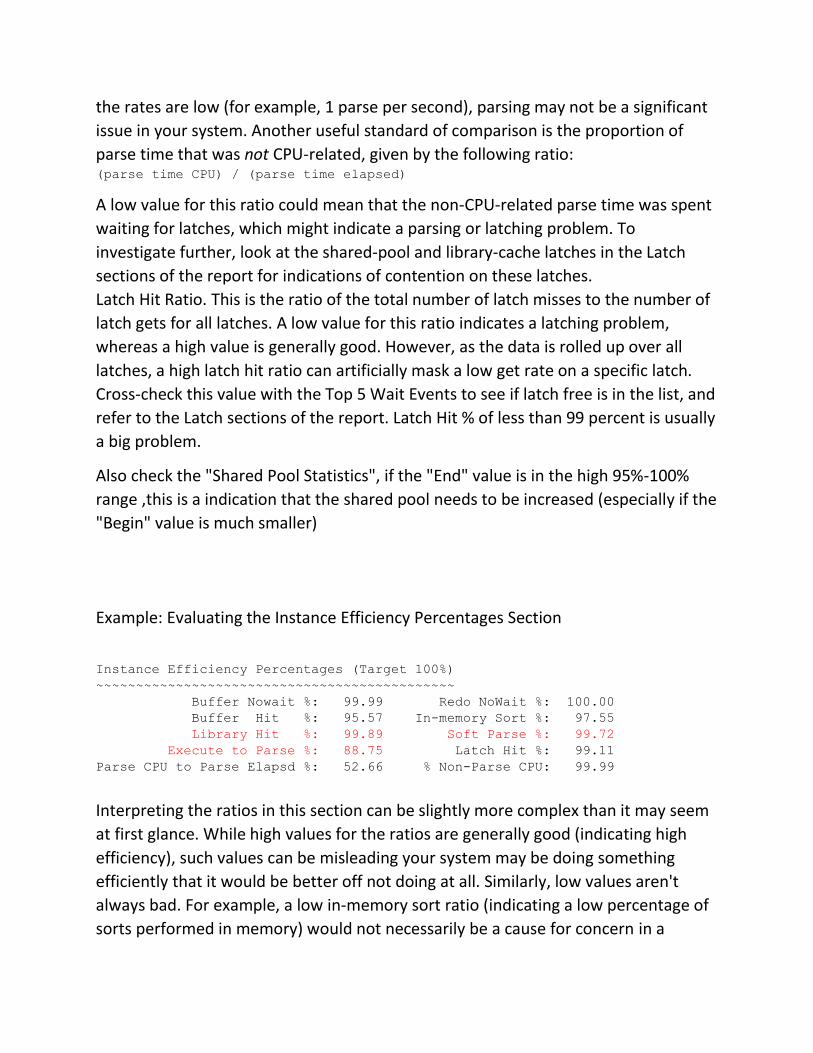
Example: Evaluating the Instance Efficiency Percentages Section
Instance Efficiency Percentages (Target 100%) ~~~~~~~~~~~~~~~~~~~~~~~~~~~~~~~~~~~~~~~~~~~~~ Buffer Nowait %: 99.99 Redo NoWait %: 100.00 Buffer Hit %: 95.57 In-memory Sort %: 97.55 Library Hit %: 99.89 Soft Parse %: 99.72 Execute to Parse %: 88.75 Latch Hit %: 99.11 Parse CPU to Parse Elapsd %: 52.66 % Non-Parse CPU: 99.99
Interpreting the ratios in this section can be slightly more complex than it may seem
at first glance. While high values for the ratios are generally good (indicating high
efficiency), such values can be misleading your system may be doing something
efficiently that it would be better off not doing at all. Similarly, low values aren't
always bad. For example, a low in-memory sort ratio (indicating a low percentage of
sorts performed in memory) would not necessarily be a cause for concern in a
Page 21
decision- support system (DSS) environment, where user response time is less critical
than in an online transaction processing (OLTP) environment.
Basically, you need to keep in mind the characteristics of your application - whether
it is query-intensive or update-intensive, whether it involves lots of sorting, and so
on - when you're evaluating the Instance Efficiency Percentages.
The following ratios should be above 90% in a database.
Buffer Nowait
Buffer Hit
Library Hit
Redo NoWait
In-memory Sort
Soft Parse
Latch Hit
Non-Parse CPU
The execute to parse ratio should be very high in a ideal database.
The execute to parse ratio is basically a measure between the number of times a sql
is executed versus the number of times it is parsed.
The ratio will move higher as the number of executes go up, while the number of
parses either go down or remain the same.
The ratio will be close to zero if the number of executes and parses are almost equal.
The ratio will be negative executes are lower but the parses are higher.
Another Sample Analysis Instance Efficiency Percentages (Target 100%) ~~~~~~~~~~~~~~~~~~~~~~~~~~~~~~~~~~~~~~~~~~~~~ Buffer Nowait %: 98.56 Redo NoWait %: 100.00 Buffer Hit %: 99.96 In-memory Sort %: 99.84 Library Hit %: 99.99 Soft Parse %: 100.00 (A) Execute to Parse %: 0.10 (A) Latch Hit %: 99.37 Parse CPU to Parse Elapsd %: 58.19 (A) % Non-Parse CPU: 99.84 Shared Pool Statistics Begin End ------ ------ Memory Usage %: 28.80 29.04 (B) % SQL with executions>1: 75.91 76.03 % Memory for SQL w/exec>1: 83.65 84.09
Page 22
Observations:
• The 100% soft parse ratio (A) indicates the system is not hard-parsing. However
the system is soft parsing a lot, rather than only re-binding and re-executing the
same cursors, as the Execute to Parse % is very low (A). Also, the CPU time used for
parsing (A) is only 58% of the total elapsed parse time (see Parse CPU to Parse
Elapsd). This may also imply some resource contention during parsing (possibly
related to the latch free event?).
• There seems to be a lot of unused memory in the shared pool (only 29% is
used) (B). If there is insufficient memory allocated to other areas of the database (or
OS), this memory could be redeployed
***Please see the following NOTES on shared pool issues
[NOTE:146599.1] Diagnosing and Resolving Error ORA-04031
[NOTE:62143.1] Understanding and Tuning the Shared Pool
[NOTE:105813.1] SCRIPT TO SUGGEST MINIMUM SHARED POOL SIZE
Shared Pool Statistics
Begin End
Memory Usage %: 73.86 75.42
% SQL with executions>1: 92.61 93.44
% Memory for SQL w/exec>1: 94.33 94.98
Shared Pool Statistics Begin End ------ ------ Memory Usage %: 42.07 43.53 % SQL with executions>1: 73.79 75.08 % Memory for SQL w/exec>1: 76.93 77.64
Memory Usage % = It's the shared pool usage. So here we have use 73.86 per cent of
our shared pool and out of that almost 94 percent is being re-used. If Memory Usage
% is too large like 90 % it could mean that your shared pool is tool small and if the
percent is in 50 for example then this could mean that you shared pool is too large
% SQL with executions>1 = Shows % of SQLs executed more than 1 time. The %
should be very near to value 100. If we get a low number here, then the DB is not
using shared SQL statements. May be because bind variables are not being used.
Page 23
% memory for SQL w/exec>1: From the memory space allocated to cursors, shows
which % has been used by cursors more than 1.
Top 5 Timed Foreground Events
This section provides insight into what events the Oracle database is spending most
of it's time on (see wait events). Each wait event is listed, along with the number of
waits, the time waited (in seconds), the average wait per event (in microseconds)
and the associated wait class. This is one of the most important sections of the
report.
Event Waits Time(s) Avg wait (ms) % DB time Wait Class
direct path write temp 12,218,833 193,657 16 68.83 User I/O
DB CPU 70,609 25.09
log file sync 247,094 6,933 28 2.46 Commit
db file sequential read 221,301 5,813 26 2.07 User I/O
direct path read 6,773,719 4,442 1 1.58 User I/O
It's critical to look into this section. If you turn off the statistic parameter, then the
Time(s) wont appear. Wait analysis should be done with respect to Time(s) as there
could be million of waits but if that happens for a second or so then who cares.
Therefore, time is very important component.
When you are trying to eliminate bottlenecks on your system, your report's Top 5
Timed Events section is the first place to look and you should use the HIGHEST WAIT
TIMES to guide the investigation.
As you will see, you have several different types of waits, so let's discuss the most
common waits on the next section.
Common WAIT EVENTS
If you want a quick instance wide wait event status, showing which events are the
biggest contributors to total wait time, you can use the following query :
select event, total_waits,time_waited from V$system_event
where event NOT IN
Page 24
('pmon timer', 'smon timer', 'rdbms ipc reply',
'parallel deque wait',
'virtual circuit', '%SQL*Net%', 'client message', 'NULL
event')
order by time_waited desc;
EVENT TOTAL_WAITS TI
ME_WAITED
------------------------ ------------- ---
----------
db file sequential
read 35051309 15965640
latch
free 1373973 19133
57
db file scattered
read 2958367 1840810
enqueue 2837
370871
buffer busy
waits 444743 252664
log file parallel
write 146221 123435
1. DB File Scattered Read.
That generally happens during a full scan of a table or Fast Full Index Scans. As full
table scans are pulled into memory, they rarely fall into contiguous buffers but
instead are scattered throughout the buffer cache. A large number here indicates
that your table may have missing indexes, statistics are not updated or your indexes
are not used. Although it may be more efficient in your situation to perform a full
table scan than an index scan, check to ensure that full table scans are necessary
when you see these waits. Try to cache small tables to avoid reading them in over
and over again, since a full table scan is put at the cold end of the LRU (Least
Recently Used) list. You can use the report to help identify the query in question and
fix it.
The init.ora parameter db_file_multiblock_read_count specifies the maximum
Page 25
numbers of blocks read in that way. Typically, this parameter should have values of
4-16 independent of the size of the database but with higher values needed with
smaller Oracle block sizes. If you have a high wait time for this event, you either need
to reduce the cost of I/O, e.g. by getting faster disks or by distributing your I/O load
better, or you need to reduce the amount of full table scans by tuning SQL
statements. The appearance of the‘db file scattered read’ and ‘db file sequential
read’events may not necessarily indicate a problem, as IO is a normal activity on a
healthy instance. However, they can indicate problems if any of the following
circumstances are true:
• The data-access method is bad (that is, the SQL statements are poorly tuned),
resulting in unnecessary or inefficient IO operations
• The IO system is overloaded and performing poorly
• The IO system is under-configured for the load
• IO operations are taking too long
If this Wait Event is a significant portion of Wait Time then a number of approaches
are possible:
o Find which SQL statements perform Full Table or Fast Full Index scans and tune
them to make sure these scans are necessary and not the result of a suboptimal
plan.
- The view V$SQL_PLAN view can help:
For Full Table scans:
select sql_text from v$sqltext t, v$sql_plan p
where t.hash_value=p.hash_value
and p.operation='TABLE ACCESS'
and p.options='FULL'
order by p.hash_value, t.piece;
For Fast Full Index scans:
select sql_text from v$sqltext t, v$sql_plan p
where t.hash_value=p.hash_value
and p.operation='INDEX'
and p.options='FULL SCAN'
order by p.hash_value, t.piece;
o In cases where such multiblock scans occur from optimal execution plans it is
possible to tune the size of multiblock I/Os issued by Oracle by setting the instance
parameter DB_FILE_MULTIBLOCK_READ_COUNT so that:
Page 26
DB_BLOCK_SIZE x DB_FILE_MULTIBLOCK_READ_COUNT = max_io_size of system
Query tuning should be used to optimize online SQL to use indexes.
2. DB File Sequential Read.
Is the wait that comes from the physical side of the database. It related to memory
starvation and non selective index use. Sequential read is an index read followed by
table read because it is doing index lookups which tells exactly which block to go to.
This could indicate poor joining order of tables or un-selective indexes in your SQL
or waiting for writes to TEMP space (direct loads, Parallel DML (PDML) such as
parallel updates. It could mean that a lot of index reads/scans are going on.
Depending on the problem it may help to tune PGA_AGGREGATE_TARGET and/or
DB_CACHE_SIZE.
The sequential read event identifies Oracle reading blocks sequentially, i.e. one after
each other. It is normal for this number to be large for a high-transaction, well-tuned
system, but it can indicate problems in some circumstances. You should correlate
this wait statistic with other known issues within the report, such as inefficient SQL.
Check to ensure that index scans are necessary, and check join orders for multiple
table joins. The DB_CACHE_SIZE will also be a determining factor in how often these
waits show up. Problematic hash-area joins should show up in the PGA memory, but
they're also memory hogs that could cause high wait numbers for sequential reads.
They can also show up as direct path read/write waits. These circumstances are
usually interrelated. When they occur in conjunction with the appearance of the 'db
file scattered read' and 'db file sequential read' in the Top 5 Wait Events section, first
you should examine the SQL Ordered by Physical Reads section of the report, to see
if it might be helpful to tune the statements with the highest resource usage.
It could be because the indexes are fragmented. If that is the case, rebuilding the
index will compact it and will produce to visit less blocks.
Then, to determine whether there is a potential I/O bottleneck, examine the OS I/O
statistics for corresponding symptoms. Also look at the average time per read in the
Tablespace and File I/O sections of the report. If many I/O-related events appear
high in the Wait Events list, re-examine the host hardware for disk bottlenecks and
check the host-hardware statistics for indications that a disk reconfiguration may be
of benefit.
Block reads are fairly inevitable so the aim should be to minimize unnecessary I/O.
I/O for sequential reads can be reduced by tuning SQL calls that result in full table
scans and using the partitioning option for large tables.
Page 27
3. Free Buffer Waits.
When a session needs a free buffer and cannot find one, it will post the database
writer process asking it to flush dirty blocks (No place to put a new block). Waits in
this category may indicate that you need to increase the DB_BUFFER_CACHE, if all
your SQL is tuned. Free buffer waits could also indicate that unselective SQL is
causing data to flood the buffer cache with index blocks, leaving none for this
particular statement that is waiting for the system to process. This normally indicates
that there is a substantial amount of DML (insert/update/delete) being done and
that the Database Writer (DBWR) is not writing quickly enough; the buffer cache
could be full of multiple versions of the same buffer, causing great inefficiency. To
address this, you may want to consider accelerating incremental checkpointing,
using more DBWR processes, or increasing the number of physical disks. To
investigate if this is an I/O problem, look at the report I/O Statistics. Increase the
DB_CACHE_SIZE; shorten the checkpoint; tune the code to get less dirty blocks,
faster I/O, use multiple DBWR’s.
4. Buffer Busy Waits. A buffer busy wait happens when multiple processes
concurrently want to modify the same block in the buffer cache. This typically
happens during massive parallel inserts if your tables do not have free lists and it can
happen if you have too few rollback segments. Buffer busy waits should not be
greater than 1 percent. Check the Buffer Wait Statistics section (or V$WAITSTAT) to
find out if the wait is on a segment header. If this is the case, increase the freelist
groups or increase the pctused to pctfree gap. If the wait is on an undo header, you
can address this by adding rollback segments; if it's on an undo block, you need to
reduce the data density on the table driving this consistent read or increase the
DB_CACHE_SIZE. If the wait is on a data block, you can move data to another block to
avoid this hot block, increase the freelists on the table, or use Locally Managed
Tablespaces (LMTs). If it's on an index block, you should rebuild the index, partition
the index, or use a reverse key index. To prevent buffer busy waits related to data
blocks, you can also use a smaller block size: fewer records fall within a single block
in this case, so it's not as "hot." When a DML (insert/update/ delete) occurs, Oracle
writes information into the block, including all users who are "interested" in the
state of the block (Interested Transaction List, ITL). To decrease waits in this area,
you can increase the initrans, which will create the space in the block to allow
multiple ITL slots. You can also increase the pctfree on the table where this block
exists (this writes the ITL information up to the number specified by maxtrans, when
there are not enough slots built with the initrans that is specified). Buffer busy waits
Page 28
can be reduced by using reverse-key indexes for busy indexes and by partitioning
busy tables.
Buffer Busy Wait on Segment Header – Add freelists (if inserts) or freelist groups
(esp. RAC). Use ASSM.
Buffer Busy Wait on Data Block – Separate ‘hot’ data; potentially use reverse key
indexes; fix queries to reduce the blocks popularity, use smaller blocks, I/O, Increase
initrans and/or maxtrans (this one’s debatable). Reduce records per block
Buffer Busy Wait on Undo Header – Add rollback segments or increase size of
segment area (auto undo)
Buffer Busy Wait on Undo block – Commit more (not too much) Larger rollback
segments/area. Try to fix the SQL.
5. Latch Free. Latches are low-level queuing mechanisms (they're accurately referred
to as mutual exclusion mechanisms) used to protect shared memory structures in
the system global area (SGA). Latches are like locks on memory that are very quickly
obtained and released. Latches are used to prevent concurrent access to a shared
memory structure. If the latch is not available, a latch free miss is recorded. Most
latch problems are related to the failure to use bind variables (library cache latch),
redo generation issues (redo allocation latch), buffer cache contention issues (cache
buffers LRU chain), and hot blocks in the buffer cache (cache buffers chain). There
are also latch waits related to bugs; check MetaLink for bug reports if you suspect
this is the case. When latch miss ratios are greater than 0.5 percent, you should
investigate the issue. If latch free waits are in the Top 5 Wait Events or high in the
complete Wait Events list, look at the latch-specific sections of the report to see
which latches are contended for.
6. Enqueue. An enqueue is a lock that protects a shared resource. Locks protect
shared resources, such as data in a record, to prevent two people from updating the
same data at the same time application, e.g. when a select for update is executed..
An enqueue includes a queuing mechanism, which is FIFO (first in, first out). Note
that Oracle's latching mechanism is not FIFO. Enqueue waits usually point to the ST
enqueue, the HW enqueue, the TX4 enqueue, and the TM enqueue. The ST enqueue
is used for space management and allocation for dictionary-managed tablespaces.
Use LMTs, or try to preallocate extents or at least make the next extent larger for
problematic dictionary-managed tablespaces. HW enqueues are used with the high-
water mark of a segment; manually allocating the extents can circumvent this wait.
Page 29
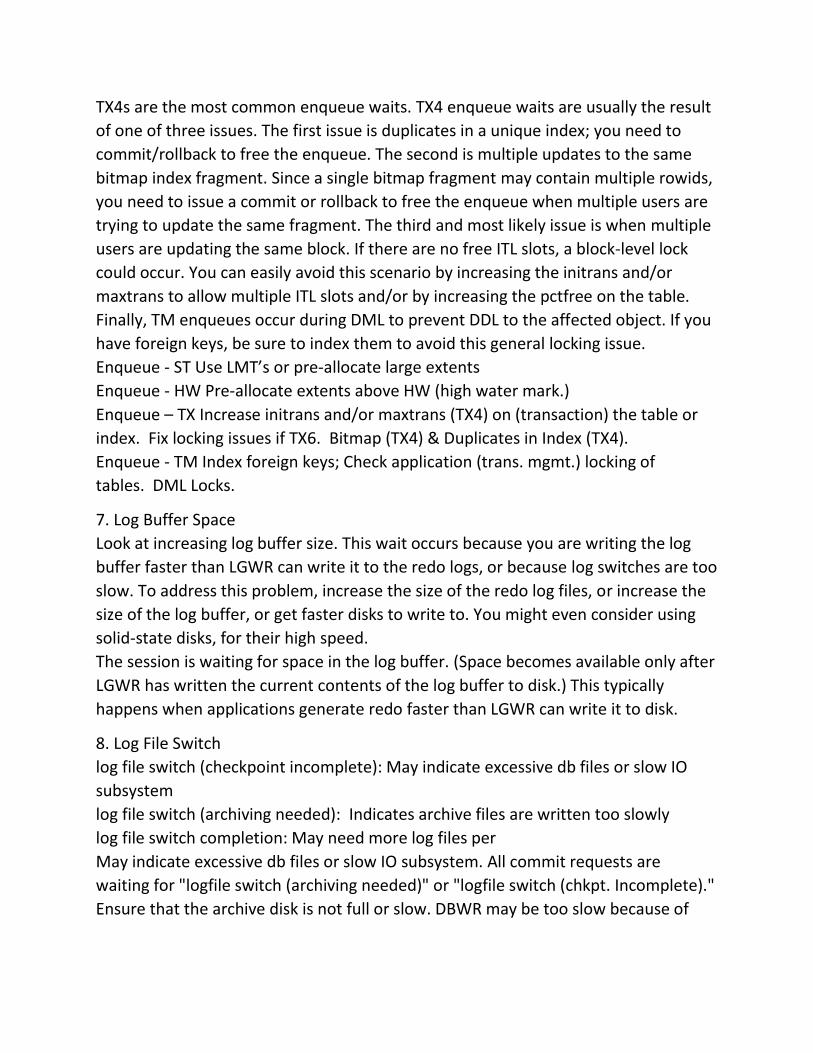
TX4s are the most common enqueue waits. TX4 enqueue waits are usually the result
of one of three issues. The first issue is duplicates in a unique index; you need to
commit/rollback to free the enqueue. The second is multiple updates to the same
bitmap index fragment. Since a single bitmap fragment may contain multiple rowids,
you need to issue a commit or rollback to free the enqueue when multiple users are
trying to update the same fragment. The third and most likely issue is when multiple
users are updating the same block. If there are no free ITL slots, a block-level lock
could occur. You can easily avoid this scenario by increasing the initrans and/or
maxtrans to allow multiple ITL slots and/or by increasing the pctfree on the table.
Finally, TM enqueues occur during DML to prevent DDL to the affected object. If you
have foreign keys, be sure to index them to avoid this general locking issue.
Enqueue - ST Use LMT’s or pre-allocate large extents
Enqueue - HW Pre-allocate extents above HW (high water mark.)
Enqueue – TX Increase initrans and/or maxtrans (TX4) on (transaction) the table or
index. Fix locking issues if TX6. Bitmap (TX4) & Duplicates in Index (TX4).
Enqueue - TM Index foreign keys; Check application (trans. mgmt.) locking of
tables. DML Locks.
7. Log Buffer Space
Look at increasing log buffer size. This wait occurs because you are writing the log
buffer faster than LGWR can write it to the redo logs, or because log switches are too
slow. To address this problem, increase the size of the redo log files, or increase the
size of the log buffer, or get faster disks to write to. You might even consider using
solid-state disks, for their high speed.
The session is waiting for space in the log buffer. (Space becomes available only after
LGWR has written the current contents of the log buffer to disk.) This typically
happens when applications generate redo faster than LGWR can write it to disk.
8. Log File Switch
log file switch (checkpoint incomplete): May indicate excessive db files or slow IO
subsystem
log file switch (archiving needed): Indicates archive files are written too slowly
log file switch completion: May need more log files per
May indicate excessive db files or slow IO subsystem. All commit requests are
waiting for "logfile switch (archiving needed)" or "logfile switch (chkpt. Incomplete)."
Ensure that the archive disk is not full or slow. DBWR may be too slow because of
Page 30
I/O. You may need to add more or larger redo logs, and you may potentially need to
add database writers if the DBWR is the problem.
9. Log File Sync
Could indicate excessive commits. A Log File Sync happens each time a commit (or
rollback) takes place. If there are a lot of waits in this area then you may want to
examine your application to see if you are committing too frequently (or at least
more than you need to). When a user commits or rolls back data, the LGWR flushes
the session's redo from the log buffer to the redo logs. The log file sync process must
wait for this to successfully complete. To reduce wait events here, try to commit
more records (try to commit a batch of 50 instead of one at a time, use BULKS, , for
example). Put redo logs on a faster disk, or alternate redo logs on different physical
disks (with no other DB Files, ASM, etc) to reduce the archiving effect on LGWR.
Don't use RAID 5, since it is very slow for applications that write a lot; potentially
consider using file system direct I/O or raw devices, which are very fast at writing
information. The associated event, ‘log buffer parallel write’ is used by the redo log
writer process, and it will indicate if your actual problem is with the log file I/O. Large
wait times for this event can also be caused by having too few CPU resources
available for the redolog writer process.
10. Idle Event. There are several idle wait events listed after the output; you can
ignore them. Idle events are generally listed at the bottom of each section and
include such things as SQL*Net message to/from client and other background-
related timings. Idle events are listed in the stats$idle_event table.
11. global cache cr request: (OPS) This wait event shows the amount of time that an
instance has waited for a requested data block for a consistent read and the
transferred block has not yet arrived at the requesting instance. See Note 157766.1
'Sessions Wait Forever for 'global cache cr request' Wait Event in OPS or RAC'. In
some cases the 'global cache cr request' wait event may be perfectly normal if large
buffer caches are used and the same data is being accessed concurrently on multiple
instances. In a perfectly tuned, non-OPS/RAC database, I/O wait events would be
the top wait events but since we are avoiding I/O's with RAC and OPS the 'global
cache cr request' wait event often takes the place of I/O wait events.
12. library cache pin: Library cache latch contention may be caused by not using bind
variables. It is due to excessive parsing of SQL statement.
The session wants to pin an object in memory in the library cache for examination,
Page 31
ensuring no other processes can update the object at the same time. This happens
when you are compiling or parsing a PL/SQL object or a view.
13. CPU time
This is not really a wait event (hence, the new name), but rather the sum of the CPU
used by this session, or the amount of CPU time used during the snapshot window.
In a heavily loaded system, if the CPU time event is the biggest event, that could
point to some CPU-intensive processing (for example, forcing the use of an index
when a full scan should have been used), which could be the cause of the bottleneck.
When CPU Other is a significant component of total Response Time the next step is
to find the SQL statements that access the most blocks. Block accesses are also
known as Buffer Gets and Logical I/Os. The report lists such SQL statements in
section SQL ordered by Gets.
14. DB File Parallel Read If you are doing a lot of partition activity then expect to see
that wait even. it could be a table or index partition. This Wait Event is used when
Oracle performs in parallel reads from multiple datafiles to non-contiguous buffers in
memory (PGA or Buffer Cache). This is done during recovery operations or when
buffer prefetching is being used as an optimization i.e. instead of performing
multiple single-block reads. If this wait is an important component of Wait Time,
follow the same guidelines as 'db file sequential read'.
This may occur during recovery or during regular activity when a session batches
many single block I/O requests together and issues them in parallel.
15. PX qref latch Can often mean that the Producers are producing data quicker than
the Consumers can consume it. Maybe we could increase
parallel_execution_message_size to try to eliminate some of these waits or we might
decrease the degree of parallelism. If the system workload is high consider to
decrease the degree of parallelism. If you have DEFAULT parallelism on your
object you can decrease the value of PARALLEL_THREADS_PER_CPU. Have in
mind DEFAULT degree = PARALLEL_THREADS_PER_CPU * #CPU's
16. Log File Parallel Write. It occurs when waiting for writes of REDO records to the
REDO log files to complete. The wait occurs in log writer (LGWR) as part of normal
activity of copying records from the REDO log buffer to the current online log. The
actual wait time is the time taken for all the outstanding I/O requests to complete.
Even though the writes may be issued in parallel, LGWR needs to wait for the last I/O
to be on disk before the parallel write is considered complete. Hence the wait time
Page 32
depends on the time it takes the OS to complete all requests.
Log file parallel write waits can be reduced by moving log files to the faster disks
and/or separate disks where there will be less contention.
17. SQL*Net more data to client
This means the instance is sending a lot of data to the client. You can decrease this
time by having the client bring back less data. Maybe the application doesn't need to
bring back as much data as it is.
18. SQL*Net message to client
The “SQL*Net message to client” Oracle metric indicates the server (foreground
process) is sending a message to the client, and it can be used to identify throughput
issues over a network, especially distributed databases with slow database links. The
SQL*Net more data to client event happens when Oracle writes multiple data buffers
(sized per SDU) in a single logical network call.
19. enq: TX - row lock contention:
Oracle keeps data consistency with the help of locking mechanism. When a particular
row is being modified by the process, either through Update/ Delete or Insert
operation, oracle tries to acquire lock on that row. Only when the process has
acquired lock the process can modify the row otherwise the process waits for the
lock. This wait situation triggers this event. The lock is released whenever a COMMIT
is issued by the process which has acquired lock for the row. Once the lock is
released, processes waiting on this event can acquire lock on the row and perform
DML operation
20. direct Path writes: You wont see them unless you are doing some appends or
data loads. The session has issued asynchronous I/O requests that bypass the buffer
cache and is waiting for them to complete. These wait events often involve
temporary segments, sorting activity, parallel query or hash joins.
21. direct Path reads / direct path writes: Could happen if you are doing a lot of
parallel query activity. The session has issued asynchronous I/O requests that bypass
the buffer cache and is waiting for them to complete. These wait events often
involve temporary segments, sorting activity, parallel query or hash joins. Usually
sorting to Temp. Can also be parallel query. Could also be insert append, etc Adjust
PGA_AGGREGATE_TARGET to fix it.
Page 33
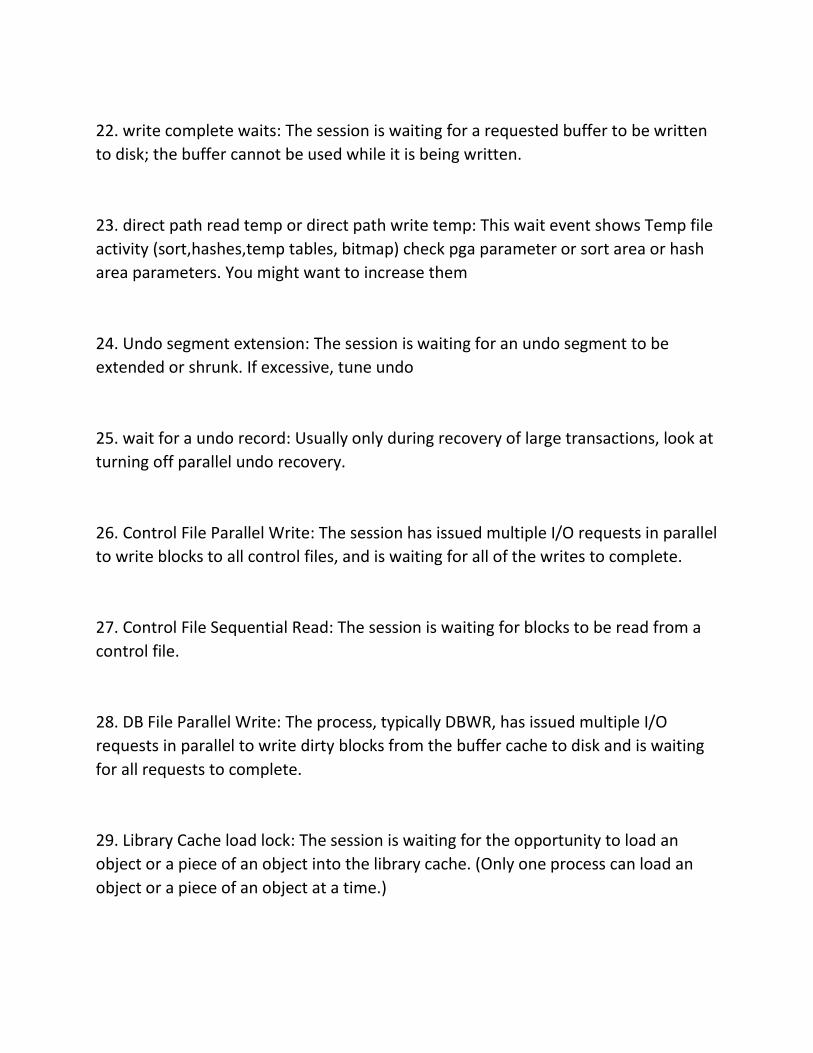
22. write complete waits: The session is waiting for a requested buffer to be written
to disk; the buffer cannot be used while it is being written.
23. direct path read temp or direct path write temp: This wait event shows Temp file
activity (sort,hashes,temp tables, bitmap) check pga parameter or sort area or hash
area parameters. You might want to increase them
24. Undo segment extension: The session is waiting for an undo segment to be
extended or shrunk. If excessive, tune undo
25. wait for a undo record: Usually only during recovery of large transactions, look at
turning off parallel undo recovery.
26. Control File Parallel Write: The session has issued multiple I/O requests in parallel
to write blocks to all control files, and is waiting for all of the writes to complete.
27. Control File Sequential Read: The session is waiting for blocks to be read from a
control file.
28. DB File Parallel Write: The process, typically DBWR, has issued multiple I/O
requests in parallel to write dirty blocks from the buffer cache to disk and is waiting
for all requests to complete.
29. Library Cache load lock: The session is waiting for the opportunity to load an
object or a piece of an object into the library cache. (Only one process can load an
object or a piece of an object at a time.)
Page 34
30. log file sequential read: The session is waiting for blocks to be read from the
online redo log into memory. This primarily occurs at instance startup and when the
ARCH process archives filled online redo logs.
Time Model Statistics
Oracle Database time model related statistics are presented next. The time model
allows you to see a summary of where the database is spending it's time. The report
will present the various time related statistic (such as DB CPU) and how much total
time was spent in the mode of operation represented by that statistic. Here is an
example of the time model statistic report:
Total time in database user-calls (DB Time): 20586.1s
Statistics including the word "background" measure background process time, and so do not contribute to the DB time statistic
Ordered by % or DB time desc, Statistic name
Statistic Name Time (s) % of DB Time
sql execute elapsed time 19,640.87 95.41
DB CPU 17,767.20 86.31
parse time elapsed 73.75 0.36
hard parse elapsed time 38.35 0.19
PL/SQL execution elapsed time 32.04 0.16
hard parse (sharing criteria) elapsed time 6.98 0.03
connection management call elapsed time 4.25 0.02
repeated bind elapsed time 3.43 0.02
PL/SQL compilation elapsed time 3.04 0.01
hard parse (bind mismatch) elapsed time 1.62 0.01
sequence load elapsed time 0.74 0.00
failed parse elapsed time 0.04 0.00
DB time 20,586.08
background elapsed time 859.22
Page 35
background cpu time 68.05
If parsing time is very high, or if hard parsing is significant, you must investigate it
further. You should not expect the % of DB Time to add up to 100% because there is
overlap among statistics.
Generally you want SQL processing time high, parsing and other stuff low. Time
related statistics presents the various operations which are consuming most of the
database time.
If SQL time>>DB CPU time then probably have IO issues.
If Hard parses or parsing time is very high then further investigation should be done
to resolve the problem. .
Example
Statistic Name Time (s) % of DB Time
sql execute elapsed time 12,416.14 86.45
DB CPU 9,223.70 64.22
parse time elapsed 935.61 6.51
hard parse elapsed time 884.73 6.16
failed parse elapsed time 821.39 5.72
PL/SQL execution elapsed time 153.51 1.07
hard parse (sharing criteria) elapsed time 25.96 0.18
connection management call elapsed time 14.00 0.10
hard parse (bind mismatch) elapsed time 4.74 0.03
PL/SQL compilation elapsed time 1.20 0.01
repeated bind elapsed time 0.22 0.00
sequence load elapsed time 0.11 0.00
DB time 14,362.96
background elapsed time 731.00
background cpu time 72.00
Page 36
In the above example, 9,223.70 seconds CPU time was used for all user sessions. This
was just under 65% of database resources.
In total there was 14363 seconds database time used.
The total wait event time can be calculated as 14363 – 9223.70 = 5139.3 seconds.
The lion share of database time (86.45%) was spent on executing sql which is a good
sign. The total parse time was 935.61 seconds of which 884.73 seconds was hard
parsing. The rest of statistics is tiny in this case
Operating System Statistics
This part of the report provides some basic insight into OS performance, and OS
configuration too. This report may vary depending on the OS platform that your
database is running on. Here is an example from a Linux system:
*TIME statistic values are diffed. All others display actual values. End Value is displayed if different
ordered by statistic type (CPU Use, Virtual Memory, Hardware Config), Name
Statistic Value End Value
BUSY_TIME 1,831,850
IDLE_TIME 26,901,106
IOWAIT_TIME 226,948
NICE_TIME 8
SYS_TIME 212,021
USER_TIME 1,596,003
LOAD 1 1
RSRC_MGR_CPU_WAIT_TIME 0
VM_IN_BYTES 1,560,961,024
VM_OUT_BYTES 475,336,945,664
PHYSICAL_MEMORY_BYTES 12,582,432,768
NUM_CPUS 16
NUM_CPU_CORES 8
Page 37
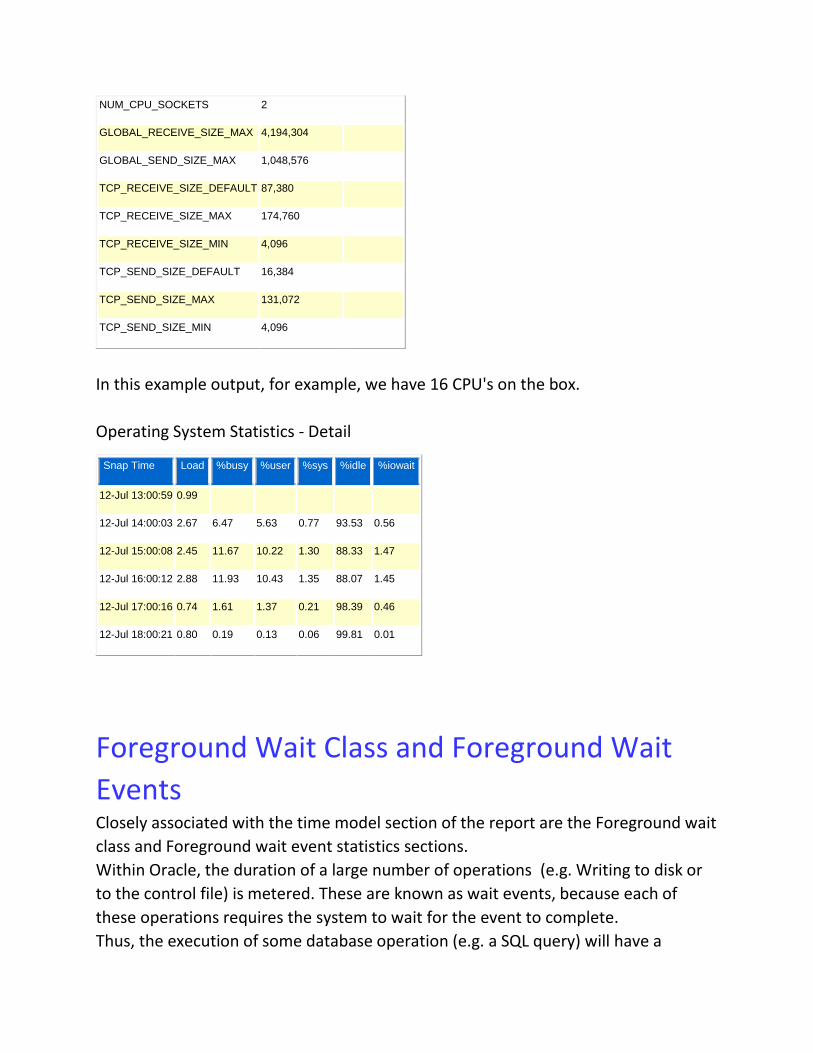
NUM_CPU_SOCKETS 2
GLOBAL_RECEIVE_SIZE_MAX 4,194,304
GLOBAL_SEND_SIZE_MAX 1,048,576
TCP_RECEIVE_SIZE_DEFAULT 87,380
TCP_RECEIVE_SIZE_MAX 174,760
TCP_RECEIVE_SIZE_MIN 4,096
TCP_SEND_SIZE_DEFAULT 16,384
TCP_SEND_SIZE_MAX 131,072
TCP_SEND_SIZE_MIN 4,096
In this example output, for example, we have 16 CPU's on the box.
Operating System Statistics - Detail
Snap Time Load %busy %user %sys %idle %iowait
12-Jul 13:00:59 0.99
12-Jul 14:00:03 2.67 6.47 5.63 0.77 93.53 0.56
12-Jul 15:00:08 2.45 11.67 10.22 1.30 88.33 1.47
12-Jul 16:00:12 2.88 11.93 10.43 1.35 88.07 1.45
12-Jul 17:00:16 0.74 1.61 1.37 0.21 98.39 0.46
12-Jul 18:00:21 0.80 0.19 0.13 0.06 99.81 0.01
Foreground Wait Class and Foreground Wait
Events
Closely associated with the time model section of the report are the Foreground wait
class and Foreground wait event statistics sections.
Within Oracle, the duration of a large number of operations (e.g. Writing to disk or
to the control file) is metered. These are known as wait events, because each of
these operations requires the system to wait for the event to complete.
Thus, the execution of some database operation (e.g. a SQL query) will have a
Page 38
number of wait events associated with it. We can try to determine which wait events
are causing us problems by looking at the wait classes and the wait event reports
generated from AWR.
Wait classes define "buckets" that allow for summation of various wait times. Each
wait event is assigned to one of these buckets (for example System I/O or User I/O).
These buckets allow one to quickly determine which subsystem is likely suspect in
performance problems (e.g. the network, or the cluster).
Foreground Wait Class
s - second, ms - millisecond - 1000th of a second
ordered by wait time desc, waits desc
%Timeouts: value of 0 indicates value was < .5%. Value of null is truly 0
Captured Time accounts for 107.5% of Total DB time 20,586.08 (s)
Total FG Wait Time: 4,367.43 (s) DB CPU time: 17,767.20 (s)
Wait Class Waits %Time -outs Total Wait Time (s) Avg wait (ms) %DB time
DB CPU 17,767 86.31
User I/O 6,536,576 0 3,500 1 17.00
Commit 169,635 0 666 4 3.24
Other 350,080 21 140 0 0.68
Concurrency 78,002 0 58 1 0.28
Network 1,755,547 0 2 0 0.01
Application 579 0 1 2 0.00
System I/O 584 0 0 0 0.00
Configuration 1 0 0 0 0.00
Here is an example of the wait class report section:
-----------------------------------------------
--------------
Foreground Wait Class DB/Inst: A109/a1092
Snaps: 2009-2010
-> s - second
Page 39
-> cs - centisecond - 100th of a second
-> ms - millisecond - 1000th of a second
-> us - microsecond - 1000000th of a second
-> ordered by wait time desc, waits desc
Avg
%Time Total Wait wait
Waits
Wait Class Waits -outs Time (s) (ms)
/txn
-------------------- ---------------- ------ ---------------- ------- -------
--
System I/O 8,142 .0 25 3
10.9
Other 439,596 99.6 3 0
589.3
User I/O 112 .0 0 3
0.2
Cluster 443 .0 0 0
0.6
Concurrency 216 .0 0 0
0.3
Commit 16 .0 0 2
0.0
Network 3,526 .0 0 0
4.7
Application 13 .0 0 0
0.0
-------------------------------------------------------------
In this report the system I/O wait class has the largest number of waits (total of 25
seconds) and an average wait of 3 milliseconds.
Foreground Wait Events
Wait events are normal occurrences, but if a particular sub-system is having a
problem performing (e.g. the disk sub-system) this fact will appear in the form of one
Page 40
or more wait events with an excessive duration.
The wait event report then provides some insight into the detailed wait events. Here
is an example of the wait event report (we have eliminated some of the bulk of this
report, because it can get quite long). Note that this section is sorted by wait time
(listed in microseconds).
s - second, ms - millisecond - 1000th of a second
Only events with Total Wait Time (s) >= .001 are shown
ordered by wait time desc, waits desc (idle events last)
%Timeouts: value of 0 indicates value was < .5%. Value of null is truly 0
Event Waits %Time -outs Total Wait Time (s) Avg wait (ms) Waits /txn % DB time
direct path write temp 1,837,854 0 2,267 1 10.53 11.01
direct path read 2,838,190 0 930 0 16.26 4.52
log file sync 169,635 0 666 4 0.97 3.24
db file sequential read 13,222 0 143 11 0.08 0.69
direct path read temp 1,837,007 0 131 0 10.53 0.64
PX Deq: Slave Session Stats 131,555 0 107 1 0.75 0.52
db file scattered read 8,448 0 26 3 0.05 0.13
kksfbc child completion 441 100 22 51 0.00 0.11
latch: shared pool 4,849 0 16 3 0.03 0.08
library cache: mutex X 67,703 0 14 0 0.39 0.07
library cache lock 346 0 12 35 0.00 0.06
cursor: pin S wait on X 582 0 9 16 0.00 0.05
latch free 9,647 0 7 1 0.06 0.03
os thread startup 116 0 4 32 0.00 0.02
SQL*Net message to client 1,739,132 0 2 0 9.97 0.01
cursor: mutex S 1,666 0 2 1 0.01 0.01
latch: row cache objects 1,658 0 1 1 0.01 0.01
read by other session 92 0 1 12 0.00 0.01
db file parallel read 344 0 1 3 0.00 0.00
PX Deq: Signal ACK EXT 65,787 0 1 0 0.38 0.00
Page 41
PX Deq: Signal ACK RSG 65,787 0 1 0 0.38 0.00
enq: PS - contention 758 0 1 1 0.00 0.00
enq: RO - fast object reuse 40 0 1 13 0.00 0.00
Disk file operations I/O 1,386 0 0 0 0.01 0.00
enq: KO - fast object checkpoint 539 0 0 1 0.00 0.00
PX qref latch 964 100 0 0 0.01 0.00
latch: parallel query alloc buffer 836 0 0 0 0.00 0.00
latch: cache buffers chains 174 0 0 1 0.00 0.00
SQL*Net more data to client 16,415 0 0 0 0.09 0.00
enq: TX - index contention 5 0 0 37 0.00 0.00
library cache load lock 1 0 0 139 0.00 0.00
asynch descriptor resize 71,974 100 0 0 0.41 0.00
PX Deq: Table Q Get Keys 486 0 0 0 0.00 0.00
reliable message 577 0 0 0 0.00 0.00
buffer busy waits 676 0 0 0 0.00 0.00
cursor: pin S 189 0 0 0 0.00 0.00
row cache lock 17 0 0 2 0.00 0.00
direct path sync 15 0 0 2 0.00 0.00
latch: cache buffer handles 1 0 0 29 0.00 0.00
utl_file I/O 18 0 0 1 0.00 0.00
PX Deq: Table Q qref 1,160 0 0 0 0.01 0.00
wait list latch free 13 0 0 1 0.00 0.00
latch: object queue header operation 32 0 0 0 0.00 0.00
control file sequential read 584 0 0 0 0.00 0.00
SQL*Net message from client 1,739,106 0 260,904 150 9.97
jobq slave wait 41,892 100 20,964 500 0.24
PX Deq: Execution Msg 746,687 0 1,612 2 4.28
PX Deq: Table Q Normal 1,057,627 0 387 0 6.06
PX Deq Credit: send blkd 128,373 0 266 2 0.74
PX Deq: Execute Reply 710,735 0 51 0 4.07
Page 42
PX Deq: Parse Reply 65,790 0 13 0 0.38
PX Deq: Join ACK 65,790 0 4 0 0.38
PX Deq Credit: need buffer 1,783 0 3 1 0.01
PX Deq: Table Q Sample 1,275 0 1 0 0.01
Example
Foreground Wait Events
Avg
%Time Total Wait wait
Waits
Event Waits -outs Time (s) (ms)
/txn
---------------------------- -------------- ------ ----------- ------- ------
---
control file parallel write 1,220 .0 18 15
1.6
control file sequential read 6,508 .0 6 1
8.7
CGS wait for IPC msg 422,253 100.0 1 0
566.0
change tracking file synchro 60 .0 1 13
0.1
db file parallel write 291 .0 0 1
0.4
db file sequential read 90 .0 0 4
0.1
reliable message 136 .0 0 1
0.2
log file parallel write 106 .0 0 2
0.1
lms flush message acks 1 .0 0 60
0.0
gc current block 2-way 200 .0 0 0
0.3
change tracking file synchro 59 .0 0 1
0.1
Page 43
In this example our control file parallel write waits (which occurs during writes to the
control file) are taking up 18 seconds total, with an average wait of 15 milliseconds
per wait.
Additionally we can see that we have 1.6 waits per transaction (or 15ms * 1.6 per
transaction = 24ms).
Background Wait Events
Background wait events are those not associated with a client process. They indicate
waits encountered by system and non-system processes. Examples of background
system processes are LGWR and DBWR. An example of a non-system background
process would be a parallel query slave. Note that it is possible for a wait event to
appear in both the foreground and background wait events statistics, for examples
the enqueue and latch free events. The idle wait events appear at the bottom of
both sections and can generally safely be ignored. Typically these type of events
keep record of the time while the client is connected to the database but not
requests are being made to the server. Usually not a big contributor.
ordered by wait time desc, waits desc (idle events last)
Only events with Total Wait Time (s) >= .001 are shown
%Timeouts: value of 0 indicates value was < .5%. Value of null is truly 0
Event Waits %Time -outs Total Wait Time (s) Avg wait (ms) Waits /txn % bg time
log file parallel write 189,549 0 615 3 1.09 71.53
db file async I/O submit 28,334 0 37 1 0.16 4.27
os thread startup 711 0 25 35 0.00 2.88
control file parallel write 32,030 0 16 1 0.18 1.88
db file sequential read 899 0 14 15 0.01 1.57
latch: shared pool 7,111 0 9 1 0.04 1.09
latch: call allocation 15,537 0 9 1 0.09 1.07
latch free 8,264 0 5 1 0.05 0.63
Page 44
ARCH wait on ATTACH 259 0 3 11 0.00 0.34
Log archive I/O 726 0 2 3 0.00 0.24
row cache lock 2 0 1 746 0.00 0.17
control file sequential read 83,303 0 1 0 0.48 0.12
db file parallel read 30 0 1 17 0.00 0.06
Disk file operations I/O 1,214 0 0 0 0.01 0.05
log file sequential read 838 0 0 0 0.00 0.05
direct path sync 5 0 0 31 0.00 0.02
ADR block file read 80 0 0 2 0.00 0.02
log file sync 11 0 0 11 0.00 0.01
enq: PR - contention 3 0 0 23 0.00 0.01
latch: cache buffers chains 1 0 0 46 0.00 0.01
db file single write 264 0 0 0 0.00 0.00
latch: parallel query alloc buffer 63 0 0 1 0.00 0.00
LGWR wait for redo copy 521 0 0 0 0.00 0.00
Data file init write 20 0 0 1 0.00 0.00
latch: row cache objects 1 0 0 15 0.00 0.00
latch: session allocation 27 0 0 1 0.00 0.00
db file scattered read 3 0 0 4 0.00 0.00
reliable message 50 0 0 0 0.00 0.00
direct path write 14 0 0 1 0.00 0.00
asynch descriptor resize 1,442 100 0 0 0.01 0.00
wait list latch free 10 0 0 1 0.00 0.00
rdbms ipc reply 57 0 0 0 0.00 0.00
log file single write 40 0 0 0 0.00 0.00
ADR block file write 25 0 0 0 0.00 0.00
ADR file lock 30 0 0 0 0.00 0.00
library cache: mutex X 2 0 0 1 0.00 0.00
SQL*Net message to client 587 0 0 0 0.00 0.00
rdbms ipc message 323,540 38 356,760 1103 1.85
Page 45
PX Idle Wait 65,885 0 115,165 1748 0.38
DIAG idle wait 35,863 100 35,900 1001 0.21
Space Manager: slave idle wait 5,626 97 27,710 4925 0.03
pmon timer 5,984 100 17,959 3001 0.03
Streams AQ: qmn slave idle wait 642 0 17,953 27964 0.00
Streams AQ: qmn coordinator idle wait 1,282 50 17,953 14004 0.01
shared server idle wait 598 100 17,946 30010 0.00
dispatcher timer 299 100 17,942 60007 0.00
smon timer 113 33 17,719 156808 0.00
SQL*Net message from client 795 0 1 1 0.00
class slave wait 83 0 0 0 0.00
Service Statistics
A service is a grouping of processes. Users may be grouped in SYS$USER. Application
logins (single user) may be grouped with that user name
ordered by DB Time
Service Name DB Time (s) DB CPU (s) Physical Reads (K) Logical Reads (K)
FGUARD.fiservipo.com 19,903 17,555 413,742 386,056
SYS$USERS 683 212 1,733 6,954
FGUARDXDB 0 0 0 0
SYS$BACKGROUND 0 0 3 134
SQL Information Section
Page 46
Next in the report we find several different reports that present SQL statements that
might be improved by tuning. Any SQL statement appears in the top 5 statements in
two or more areas below, then it is a prime candidate for tuning. The sections are:
SQL Ordered by Elapsed Time - IO waits
SQL Ordered by CPU Time - Sorting, hashing
SQL Ordered by Buffer Gets - High logical IO
SQL Ordered by Disk Reads - High physical IO
SQL Ordered by Executions - May indicate loop issues
SQL Ordered by Parse Calls - Memory issues
SQL Ordered by Sharable Memory - Informational
SQL Ordered by Version Count - May indicate unsafe bind variables
SQL Ordered by Cluster Wait Time - Indicates physical issues (RPB, block size)
Let try to see what these mean.
SQL Ordered by Elapsed Time
Total Elapsed Time = CPU Time + Wait Time. If a SQL statement appears in the total
elapsed time area of the report this means its CPU time plus any other wait times
made it pop to the top of the pile. Excessive Elapsed Time could be due to excessive
CPU usage or excessive wait times.
This is the area that you need to examine and probably the one that will be reported
by the users or application support. From a consumer perspective, the finer details
don’t matter. The application is slow. Full stop.
In conjunction with excessive Elapsed time check to see if this piece of SQL is also a
high consumer under Total CPU Time. It is normally the case. Otherwise check the
wait times and Total Disk Reads. They can either indicate issues with wait times (slow
disks, latch gets etc) or too much Physical IO associated with tables scans or sub-
optimal indexes. This section is a gate opener and often you will need to examine
other sections.
Page 47
SQL Ordered by CPU Time
When a statement appears in the Total CPU Time area this indicates it used excessive
CPU cycles during its processing. Excessive CPU processing time can be caused by
sorting, excessive function usage or long parse times. Indicators that you should be
looking at this section for SQL tuning candidates include high CPU percentages in the
service section for the service associated with this SQL (a hint, if the SQL is uppercase
it probably comes from a user or application; if it is lowercase it usually comes from
the internal or background processes). To reduce total CPU time, reduce sorting by
using composite indexes that can cover sorting and use bind variables to reduce
parse times.
SQL Ordered by Buffer Gets
Total buffer gets mean a SQL statement is reading a lot of data from the db block
buffers. Generally speaking buffer gets (AKA logical IO or LIO) are OK, except when
they become excessive. The old saying that you reduce the logical IO, because then
the physical IO (disk read) will take care of itself holds true. LIO may have incurred a
PIO in order to get the block into the buffer in the first place. Reducing buffer gets is
very important and should not be underestimated. To get a block from db block
buffers, we have to latch it (i.e. in order to prevent someone from modifying the
data structures we are currently reading from the buffer). Although latches are less
persistent than locks, a latch is still a serialization device. Serialization devices inhibit
scalability, the more you use them, the less concurrency you get. Therefore in most
cases optimal buffer gets can result in improved performance. Also note that by
lowering buffer gets you will require less CPU usage and less latching. |Thus to
reduce excessive buffer gets, optimize SQL to use appropriate indexes and reduce
full table scans. You can also look at improving the indexing strategy and consider
deploying partitioning (licensed).
SQL Ordered by Disk Reads
High total disk reads mean a SQL statement is reading a lot of data from disks rather
than being able to access that data from the db block buffers. High physical reads
after a server reboot are expected as the cache is cold and data is fetched from the
disk. However, disk reads (or physical reads) are undesirable in an OLTP system,
especially when they become excessive. Excessive disk reads do cause performance
issues. The usual norm is to increase the db buffer cache to allow more buffers and
reduce ageing . Total disk reads are typified by high physical reads, a low buffer
Page 48
cache hit ratio, with high IO wait times. Higher wait times for Disk IO can be
associated with a variety of reasons (busy or over saturated SAN, slower underlying
storage, low capacity in HBC and other hardware causes). Statistics on IO section in
AWR, plus the Operating System diagnostic tools as simple as iostatcan help in
identifying these issues. To reduce excessive disk reads, consider partitioning, use
indexes and look at optimizing SQL to avoid excessive full table scans.
SQL Ordered by Executions
High total executions need to be reviewed to see if they are genuine executions or
loops in SQL code. I have also seen situations where autosys jobs fire duplicate codes
erroneously. In general statements with high numbers of executions usually are
being properly reused. However, there is always a chance of unnecessary loop in
PL/SQL, Java or C#. Statements with high number of executions, high number of
logical and or physical reads are candidates for review to be sure they are not being
executed multiple times when a single execution would serve. If the database has
excessive physical and logical reads or excessive IO wait times, then look at the SQL
statements that show excessive executions and show high physical and logical reads.
Parse Calls
Whenever a statement is issued by a user or process, regardless of whether it is in
the SQL pool it undergoes a parse. As explained under Parsing, the parse can be a
hard parse or a soft parse. Excessive parse calls usually go with excessive executions.
If the statement is using what are known as unsafe bind variables then the statement
will be reparsed each time. If the header parse ratios are low look here and in the
version count areas.
SQL Ordered by Memory
Sharable Memory refers to Shared Pool memory area in SGA , hence this particular
section in AWR Report states about the SQL STATEMENT CURSORS which consumed
the maximum amount of the Shared Pool for their execution.
In general high values for Sharable Memory doesn’t necessary imply there is an issue
It simply means that:
- These SQL statements are big or complex and Oracle has to keep lots of
information about these statements OR
- big number of child cursors exist for those parent cursors
- combination of 1 & 2
Page 49
In case of point 2, it may be due to poor coding such as bind variables mismatch,
security mismatch or overly large SQL statements that join many tables. In a DSS
or DW environment large complex statements are normal. In an OLTP database
large or complex statements are usually the result of over-normalization of the
database design, attempts to use an OLTP system as a DW or simply poor coding
techniques. Usually large statements will result in excessive parsing, recursion, and
large CPU usage.
SQL Ordered by Version Count
High version counts are usually due to multiple identical-schema databases, unsafe
bind variables, or Oracle bugs.
The SQL that is stored in the shared pool SQL area (Library cache) is reported in this
section in different ways:
. SQL ordered by Buffer Gets
. SQL ordered by Physical Reads
. SQL ordered by Executions
. SQL ordered by Parse Calls
- SQL ordered by Gets:
This section reports the contents of the SQL area ordered by the number of buffer
gets and can be used to identify the most CPU Heavy SQL.
- Many DBAs feel that if the data is already contained within the buffer cache the
query should be efficient. This could not be further from the truth. Retrieving more
data than needed, even from the buffer cache, requires CPU cycles and interprocess
IO. Generally speaking, the cost of physical I/O is not 10,000 times more
expensive. It actually is in the neighborhood of 67 times and actually almost zero if
the data is stored in the UNIX buffer cache.
- The statements of interest are those with a large number of gets per execution
especially if the number of executions is high.
- High buffer gets generally correlates with heavy CPU usage
- SQL ordered by Reads:
This section reports the contents of the SQL area ordered by the number of reads
from the data files and can be used to identify SQL causing IO bottlenecks which
consume the following resources.
Page 50
- CPU time needed to fetch unnecessary data.
- File IO resources to fetch unnecessary data.
- Buffer resources to hold unnecessary data.
- Additional CPU time to process the query once the data is retrieved into the buffer.
- SQL ordered by Executions:
This section reports the contents of the SQL area ordered by the number of query
executions. It is primarily useful in identifying the most frequently used SQL within
the database so that they can be monitored for efficiency. Generally speaking, a
small performance increase on a frequently used query provides greater gains than a
moderate performance increase on an infrequently used query. Possible reasons for
high Reads per Exec are use of unselective indexes require large numbers of blocks
to be fetched where such blocks are not cached well in the buffer cache, index
fragmentation, large Clustering Factor in index etc.
- SQL ordered by Parse Calls:
This section shows the number of times a statement was parsed as compared to the
number of times it was executed. One to one parse/executions may indicate that:
- Bind variables are not being used.
The shared pool may be too small and the parse is not being retained long enough
for multiple executions.
- cursor_sharing is set to exact (this should NOT be changed without considerable
testing on the part of the client).
Generate Execution Plan for given SQL
statement
If you have identified one or more problematic SQL statement, you may want to
check the execution plan. Remember the "Old Hash Value" from the report above
(1279400914), then execute the scrip to generate the execution plan.
Page 51
sqlplus perfstat/perfstat
SQL> @?/rdbms/admin/sprepsql.sql
Enter the Hash Value, in this example: 1279400914
SQL Text
~~~~~~~~
create table test as select * from all_objects
Known Optimizer Plan(s) for this Old Hash Value
~~~~~~~~~~~~~~~~~~~~~~~~~~~~~~~~~~~~~~~~~~~~~~~~~~~
Shows all known Optimizer Plans for this database
instance, and the Snap Id's
they were first found in the shared pool. A Plan Hash
Value will appear
multiple times if the cost has changed
-> ordered by Snap Id
First First Plan
Snap Id Snap Time Hash Value Cost
--------- --------------- ------------ ----------
6 14 Nov 04 11:26 1386862634 52
Plans in shared pool between Begin and End Snap Ids
~~~~~~~~~~~~~~~~~~~~~~~~~~~~~~~~~~~~~~~~~~~~~~~~~~~
Shows the Execution Plans found in the shared pool
between the begin and end
snapshots specified. The values for Rows, Bytes and Cost
shown below are those
which existed at the time the first-ever snapshot
captured this plan - these
values often change over time, and so may not be
indicative of current values
-> Rows indicates Cardinality, PHV is Plan Hash Value
-> ordered by Plan Hash Value
---------------------------------------------------------
-----------------------
| Operation | PHV/Object
Name | Rows | Bytes| Cost |
Page 52
---------------------------------------------------------
-----------------------
|CREATE TABLE STATEMENT |----- 1386862634 ----
| | | 52 |
|LOAD AS
SELECT | | |
| |
|
VIEW | |
1K| 216K| 44 |
| FILTER | |
| | |
| HASH
JOIN | | 1K|
151K| 38 |
| TABLE ACCESS
FULL |USER$ | 29 | 464
| 2 |
| TABLE ACCESS
FULL |OBJ$ | 3K| 249K|
35 |
| TABLE ACCESS BY INDEX
ROWID |IND$ | 1 | 7 | 2 |
| INDEX UNIQUE
SCAN |I_IND1 | 1
| | 1 |
| NESTED
LOOPS | | 5
| 115 | 16 |
| INDEX RANGE
SCAN |I_OBJAUTH1 | 1 | 10
| 2 |
| FIXED TABLE
FULL |X$KZSRO | 5 | 65
| 14 |
| FIXED TABLE
FULL |X$KZSPR | 1 | 26
| 14 |
| FIXED TABLE
Page 53
FULL |X$KZSPR | 1 | 26
| 14 |
| FIXED TABLE
FULL |X$KZSPR | 1 | 26
| 14 |
| FIXED TABLE
FULL |X$KZSPR | 1 | 26
| 14 |
| FIXED TABLE
FULL |X$KZSPR | 1 | 26
| 14 |
| FIXED TABLE
FULL |X$KZSPR | 1 | 26
| 14 |
| FIXED TABLE
FULL |X$KZSPR | 1 | 26
| 14 |
| FIXED TABLE
FULL |X$KZSPR | 1 | 26
| 14 |
| FIXED TABLE
FULL |X$KZSPR | 1 | 26
| 14 |
| FIXED TABLE
FULL |X$KZSPR | 1 | 26
| 14 |
| FIXED TABLE
FULL |X$KZSPR | 1 | 26
| 14 |
| FIXED TABLE
FULL |X$KZSPR | 1 | 26
| 14 |
| FIXED TABLE
FULL |X$KZSPR | 1 | 26
| 14 |
| FIXED TABLE
FULL |X$KZSPR | 1 | 26
| 14 |
| FIXED TABLE
Page 54
FULL |X$KZSPR | 1 | 26
| 14 |
| FIXED TABLE
FULL |X$KZSPR | 1 | 26
| 14 |
| FIXED TABLE
FULL |X$KZSPR | 1 | 26
| 14 |
| FIXED TABLE
FULL |X$KZSPR | 1 | 26
| 14 |
| FIXED TABLE
FULL |X$KZSPR | 1 | 26
| 14 |
| FIXED TABLE
FULL |X$KZSPR | 1 | 26
| 14 |
| VIEW | |
1 | 13 | 2 |
| FAST
DUAL | | 1
| | 2 |
---------------------------------------------------------
-----------------------
Instance Activity Stats Section
This section provides us with a number of various statistics (such as, how many
DBWR Checkpoints occurred, or how many consistent gets occurred during the
snapshot). These are the statistics that the summary information is derived from. A
list of the statistics maintained by the RDBMS kernel can be found in Appendix C of
the Oracle Reference manual for the version being utilized.
Here is a partial example of the report:
Page 55
Instance Activity Stats for DB: PHS2 Instance: phs2 Snaps: 100 -104 Statistic Total per Second per Trans --------------------------------- ---------------- ------------ ------------ CPU used by this session 84,161 23.4 3,825.5 CPU used when call started 196,346 54.5 8,924.8 CR blocks created 709 0.2 32.2 DBWR buffers scanned 0 0.0 0.0 DBWR checkpoint buffers written 245 0.1 11.1 DBWR checkpoints 33 0.0 1.5 DBWR cross instance writes 93 0.0 4.2 DBWR free buffers found 0 0.0 0.0 ....
.... branch node
splits 7,162 0.1
0.0
consistent
gets 12,931,850,777 152,858.8
3,969.5
current blocks converted for
CR 75,709 0.9 0.0
db block
changes 343,632,442 4,061.
9 105.5
db block
gets 390,323,754 4,613.
8 119.8
hot buffers moved to head of
LRU 197,262,394 2,331.7 60.6
leaf node 90-10
splits 26,429 0.3
0.0
leaf node
splits 840,436 9.9
0.3
logons
cumulative 21,369
0.3 0.0
physical
reads 504,643,275 5,965.
1 154.9
physical
Page 56
writes 49,724,268 587.
8 15.3
session logical
reads 13,322,170,917 157,472.5 4,
089.4
sorts
(disk) 4,132
0.1 0.0
sorts
(memory) 7,938,085
93.8 2.4
sorts
(rows) 906,207,041 10,7
11.7 278.2
table fetch continued
row 25,506,365 301.5 7.8
table scans (long
tables) 111 0.0
0.0
table scans (short
tables) 1,543,085 18.2 0
.5
Instance Activity Terminology
Session Logical Reads = All reads cached in memory. Includes both consistent gets
and also the db block gets.
Consistent Gets = These are the reads of a block that are in the cache. They are NOT
to be confused with consistent read (cr) version of a block in the buffer cache
(usually the current version is read).
Db block gets = These are block gotten to be changed. MUST be the CURRENT block
and not a cr block.
Db block changes = These are the db block gets (above) that were actually changed.
Physical Reads = Blocks not read from the cache. Either from disk, disk cache or O/S
cache; there are also physical reads direct which bypass cache using Parallel Query
(not in hit ratios).
Of particular interest are the following statistics.
- CPU USED BY THIS SESSION, PARSE TIME CPU or RECURSIVE CPU USAGE: These
Page 57
numbers are useful to diagnose CPU saturation on the system (usually a query tuning
issue). The formula to calculate the CPU usage breakdown is:
Service (CPU) Time = other CPU + parse time CPU
Other CPU = "CPU used by this session" - parse time CPU
Some releases do not correctly store this data and can show huge numbers.
recursive cpu usage = This component can be high if large amounts of PL/SQL are
being processed. It is outside the scope of this document to go into detail with this,
but you will need to identify your complete set of PL/SQL, including stored
procedures, finding the ones with the highest CPU load and optimize these. If most
work done in PL/SQL is procedural processing (rather than executing SQL), a high
recursive cpu usage can actually indicate a potential tuning effort.
parse time cpu= Parsing SQL statements is a heavy operation, that should be avoided
by reusing SQL statements as much as possible. In precompiler programs,
unnecessary parting of implicit SQL statements can be avoided by increasing the
cursor cache (MAXOPENCURSORS parameter) and by reusing cursors. In programs
using Oracle Call Interface, you need to write the code, so that it re-executes (in
stead of reparse) cursors with frequently executed SQL statements. The v$sql view
contains PARSE_CALLS and EXECUTIONS columns, that can be used to identify SQL,
that is parsed often or is only executed once per parse.
other cpu= The source of other cpu is primarily handling of buffers in the buffer
cache. It can generally be assumed, that the CPU time spent by a SQL statement is
approximately proportional to the number of buffer gets for that SQL statements,
hence, you should identify and sort SQL statements by buffer gets in v$sql. In your
report, look at the part ‘SQL ordered by Gets for DB’. Start tuning SQL statements
from the top of this list. In Oracle, the v$sql view contain a column, CPU_TIME, which
directly shows the cpu time associated with executing the SQL statement.
- DBWR BUFFERS SCANNED: the number of buffers looked at when scanning the lru
portion of the buffer cache for dirty buffers to make clean. Divide by "dbwr lru
scans" to find the average number of buffers scanned. This count includes both dirty
and clean buffers. The average buffers scanned may be different from the average
scan depth due to write batches filling up before a scan is complete. Note that this
includes scans for reasons other than make free buffer requests.
- DBWR CHECKPOINTS: the number of checkpoints messages that were sent to
DBWR and not necessarily the total number of actual checkpoints that took
Page 58
place. During a checkpoint there is a slight decrease in performance since data
blocks are being written to disk and that causes I/O. If the number of checkpoints is
reduced, the performance of normal database operations improve but recovery after
instance failure is slower.
- DBWR TIMEOUTS: the number of timeouts when DBWR had been idle since the last
timeout. These are the times that DBWR looked for buffers to idle write.
- DIRTY BUFFERS INSPECTED: the number of times a foreground encountered a dirty
buffer which had aged out through the lru queue, when foreground is looking for a
buffer to reuse. This should be zero if DBWR is keeping up with foregrounds.
- FREE BUFFER INSPECTED: the number of buffers skipped over from the end of the
LRU queue in order to find a free buffer. The difference between this and "dirty
buffers inspected" is the number of buffers that could not be used because they
were busy or needed to be written after rapid aging out. They may have a user, a
waiter, or being read/written.
- RECURSIVE CALLS: Recursive calls occur because of cache misses and segment
extension. In general if recursive calls is greater than 30 per process, the data
dictionary cache should be optimized and segments should be rebuilt with storage
clauses that have few large extents. Segments include tables, indexes, rollback
segment, and temporary segments.
NOTE: PL/SQL can generate extra recursive calls which may be unavoidable.
- REDO BUFFER ALLOCATION RETRIES: total number of retries necessary to allocate
space in the redo buffer. Retries are needed because either the redo writer has
gotten behind, or because an event (such as log switch) is occurring
- REDO LOG SPACE REQUESTS: indicates how many times a user process waited for
space in the redo log buffer. Try increasing the init.ora parameter LOG_BUFFER so
that zero Redo Log Space Requests are made.
- REDO WASTAGE: Number of bytes "wasted" because redo blocks needed to be
written before they are completely full. Early writing may be needed to commit
transactions, to be able to write a database buffer, or to switch logs
- SUMMED DIRTY QUEUE LENGTH: the sum of the lruw queue length after every
write request completes. (divide by write requests to get average queue length after
write completion)
- TABLE FETCH BY ROWID: the number of rows that were accessed by a rowid. This
includes rows that were accessed using an index and rows that were accessed using
the statement where rowid = 'xxxxxxxx.xxxx.xxxx'.
- TABLE FETCH BY CONTINUED ROW: indicates the number of rows that are chained
Page 59
to another block. In some cases (i.e. tables with long columns) this is unavoidable,
but the ANALYZE table command should be used to further investigate the chaining,
and where possible, should be eliminated by rebuilding the table.
- Table Scans (long tables) is the total number of full table scans performed on tables
with more than 5 database blocks. If the number of full table scans is high the
application should be tuned to effectively use Oracle indexes. Indexes, if they exist,
should be used on long tables if less than 10-20% (depending on parameter settings
and CPU count) of the rows from the table are returned. If this is not the case, check
the db_file_multiblock_read_count parameter setting. It may be too high. You may
also need to tweak optimizer_index_caching and optimizer_index_cost_adj.
- Table Scans (short tables) is the number of full table scans performed on tables
with less than 5 database blocks. It is optimal to perform full table scans on short
tables rather than using indexes.
I/O Stats Section
The IO Stats stats report provides information on tablespace IO performance. From
this report you can determine if the tablespace or datafiles are suffering from sub-
standard performance in terms of IO response from the disk sub-system.
IO Activity Input/Output (IO) statistics for the instance are listed in the following
sections/formats:
- Tablespace I/O Stats for DB: Ordered by total IO per tablespace.
- File I/O Stats for DB: Ordered alphabetically by tablespace, filename.
If the statistic "Buffer Waits" for a tablespace is greater than 1000, you may want to
consider tablespace reorganization in order to spread tables within it across another
tablespaces.
Note that Oracle considers average read times of greater than 20 ms
unacceptable. If a datafile consistently has average read times of 20 ms or greater
then:
- The queries against the contents of the owning tablespace should be examined and
tuned so that less data is retrieved.
- If the tablespace contains indexes, another option is to compress the indexes so
Page 60
that they require less space and hence, less IO.
- The contents of that datafile should be redistributed across several disks/logical
volumes to more easily accommodate the load.
- If the disk layout seems optimal, check the disk controller layout. It may be that the
datafiles need to be distributed across more disk sets.
Tablespace IO Stats
ordered by IOs (Reads + Writes) desc
Tablespace Reads Av Reads/s Av Rd(ms) Av Blks/Rd Writes Av Writes/s Buffer Waits Av Buf Wt(ms)
TEMPFG 1,839,383 102 0.00 31.00 1,837,948 102 74 1.62
FG_DATA 2,791,647 155 0.01 125.85 9,618 1 12 0.00
FG_DATA_ARCH 48,174 3 0.14 127.34 1 0 0 0.00
FG_INDX 16,194 1 3.51 60.39 4,647 0 23 0.00
SYSAUX 1,331 0 29.00 1.02 7,867 0 18 43.33
SYSTEM 4,491 0 8.38 1.30 2,154 0 278 0.97
UNDOTBS1 0 0 0.00 0.00 4,450 0 381 0.03
If the tablespace IO report seems to indicate a tablespace has IO problems, we can
then use the file IO stat report allows us to drill into the datafiles of the tablespace in
question and determine what the problem might be.
File IO Stats
ordered by Tablespace, File
Tablespace Filename Reads
Av
Reads/
s
Av
Rd(ms
)
Av
Blks/R
d
Writes
Av
Writes/
s
Buffe
r
Wait
s
Av Buf
Wt(ms
)
FG_DATA /oradata/FGUARD/fg_data01.dbf 332,276 18 0.02 125.95 1,537 0 5 0.00
FG_DATA /oradata/FGUARD/fg_data02.dbf 332,928 19 0.02 125.87 575 0 0 0.00
FG_DATA /oradata/FGUARD/fg_data03.dbf 524,409 29 0.01 126.72 2,145 0 0 0.00
FG_DATA /oradata/FGUARD/fg_data04.dbf 421,718 23 0.02 124.68 995 0 1 0.00
FG_DATA /oradata/FGUARD/fg_data05.dbf 323,349 18 0.02 124.58 709 0 0 0.00
FG_DATA /oradata/FGUARD/fg_data06.dbf 332,548 19 0.02 125.68 1,338 0 0 0.00
Page 61
FG_DATA /oradata/FGUARD/fg_data07.dbf 331,332 18 0.01 126.07 1,027 0 3 0.00
FG_DATA /oradata/FGUARD/fg_data08.dbf 193,087 11 0.00 127.85 1,292 0 3 0.00
FG_DATA_ARC
H
/oradata/FGUARD/fg_data_arch01.
dbf
1,993 0 0.55 126.71 0 0 0 0.00
FG_DATA_ARC
H
/oradata/FGUARD/fg_data_arch02.
dbf
15,772 1 0.19 127.35 1 0 0 0.00
FG_DATA_ARC
H
/oradata/FGUARD/fg_data_arch03.
dbf
16,163 1 0.09 127.37 0 0 0 0.00
FG_DATA_ARC
H
/oradata/FGUARD/fg_data_arch04.
dbf
14,246 1 0.10 127.37 0 0 0 0.00
FG_INDX /oradata/FGUARD/fg_indx01.dbf 2,908 0 3.84 39.20 358 0 1 0.00
FG_INDX /oradata/FGUARD/fg_indx02.dbf 1,204 0 10.97 71.13 1,130 0 5 0.00
FG_INDX /oradata/FGUARD/fg_indx03.dbf 7,588 0 0.93 62.00 1,132 0 6 0.00
FG_INDX /oradata/FGUARD/fg_indx04.dbf 1,733 0 5.79 64.18 829 0 2 0.00
FG_INDX /oradata/FGUARD/fg_indx05.dbf 1,714 0 7.06 65.41 927 0 3 0.00
FG_INDX /oradata/FGUARD/fg_indx06.dbf 1,047 0 3.07 80.76 271 0 6 0.00
SYSAUX /oradata/FGUARD/sysaux01.dbf 382 0 30.63 1.05 5,087 0 8 0.00
SYSAUX /oradata/FGUARD/sysaux02.dbf 949 0 28.35 1.00 2,780 0 10 78.00
SYSTEM /oradata/FGUARD/system01.dbf 4,465 0 8.32 1.30 2,001 0 269 0.93
SYSTEM /oradata/FGUARD/system02.dbf 26 0 19.23 1.00 153 0 9 2.22
TEMPFG /oradata/FGUARD/TEMPFG01.dbf 1,839,38
3
102 0.00 31.00 1,837,94
8
102 74 1.62
UNDOTBS1 /oradata/FGUARD/undotbs01.dbf 0 0 4,450 0 381 0.03
Buffer Pool Statistics Section
The buffer pool statistics report follows. It provides a summary of the buffer pool
configuration and usage statistics.
The buffer statistics are comprised of two sections:
- Buffer Pool Statistics: This section can have multiple entries if multiple buffer pools
are allocated. A baseline of the database's buffer pool statistics should be available
Page 62
to compare with the current report buffer pool statistics. A change in that pattern
unaccounted for by a change in workload should be a cause for concern. Also check
the Buffer Pool Advisory to identify if increasing that parameter (db_cache_size)
would help to reduce Physical Reads.
Standard block size Pools D: default, K: keep, R: recycle
Default Pools for other block sizes: 2k, 4k, 8k, 16k, 32k
P Number of
Buffers
Pool
Hit%
Buffer
Gets
Physical
Reads
Physical
Writes
Free Buff
Wait
Writ Comp
Wait
Buffer Busy
Waits
D 183,303 99 34,022,316 230,167 85,445 0 0 786
- Checkpoint Activity:
Advisory Statistics Section
In this section, we receive several recommendations on changes that we can perform
and how that will affect the overall performance of the DB.
Instance Recovery Stats
The instance recovery stats report provides information related to instance recovery.
By analyzing this report, you can determine roughly how long your database would
have required to perform crash recovery during the reporting period. Here is an
example of this report:
B: Begin Snapshot, E: End Snapshot
Targt
MTTR
(s)
Estd
MTTR
(s)
Recovery
Estd IOs
Actual
RedoBlks
Target
RedoBlks
Log Sz
RedoBlks
Log Ckpt
Timeout
RedoBlks
Log Ckpt
Interval
RedoBlks
Opt
Log
Sz(M)
Estd
RAC
Avail
Time
B 0 17 3186 40426 88123 995328 88123
E 0 16 3068 34271 35669 995328 35669
Page 63
Buffer Pool Advisory
The buffer pool advisory report answers the question, how big should you make your
database buffer cache.
It provides an extrapolation of the benefit or detriment that would result if you
added or removed memory from the database buffer cache. These estimates are
based on the current size of the buffer cache and the number of logical and physical
IO's encountered during the reporting point. This report can be very helpful in
"rightsizing" your buffer cache.
Here is an example of the output of this report:
Only rows with estimated physical reads >0 are displayed
ordered by Block Size, Buffers For Estimate
P Size for
Est (M)
Size
Factor
Buffers
(thousands)
Est Phys Read
Factor
Estimated Phys Reads
(thousands)
Est Phys
Read Time
Est %DBtime
for Rds
D 144 0.10 18 1.15 4,378 1 1922.00
D 288 0.19 35 1.10 4,180 1 1388.00
D 432 0.29 53 1.04 3,976 1 835.00
D 576 0.39 71 1.03 3,917 1 676.00
D 720 0.48 89 1.02 3,886 1 593.00
D 864 0.58 106 1.01 3,864 1 534.00
D 1,008 0.68 124 1.01 3,850 1 495.00
D 1,152 0.77 142 1.01 3,841 1 470.00
D 1,296 0.87 160 1.00 3,829 1 439.00
D 1,440 0.97 177 1.00 3,818 1 409.00
D 1,488 1.00 183 1.00 3,815 1 401.00
D 1,584 1.06 195 1.00 3,813 1 395.00
D 1,728 1.16 213 1.00 3,812 1 393.00
D 1,872 1.26 231 1.00 3,811 1 390.00
D 2,016 1.35 248 1.00 3,810 1 387.00
D 2,160 1.45 266 1.00 3,808 1 383.00
D 2,304 1.55 284 1.00 3,808 1 382.00
Page 64
D 2,448 1.65 302 1.00 3,808 1 382.00
D 2,592 1.74 319 1.00 3,808 1 382.00
D 2,736 1.84 337 1.00 3,808 1 382.00
D 2,880 1.94 355 0.93 3,536 1 121.00
In this example we currently have 1.488 GB allocated to the SGA (represented by the
size factor column with a value of 1.0.
It appears that if we were to reduce the memory allocated to the SGA to half of the
size of the current SGA (freeing the memory to the OS for other processes) we would
incur an increase of just a few more physical Reads in the process.
PGA Reports The PGA reports provide some insight into the health of the PGA.
- The PGA Aggr Target Stats report provides information on the configuration of the
PGA Aggregate Target parameter during the reporting period.
- The PGA Aggregate Target Histogram report provides information on the size of
various operations (e.g. sorts). It will indicate if PGA sort operations occurred
completely in memory, or if some of those operations were written out to disk.
- The PGA Memory Advisor, much like the buffer pool advisory report, provides some
insight into how to properly size your PGA via the PGA_AGGREGATE_TARGET
database parameter.
Here we show these reports:
PGA Aggr Target Stats
B: Begin Snap E: End Snap (rows dentified with B or E contain data which is absolute i.e. not diffed over the interval)
Auto PGA Target - actual workarea memory target
W/A PGA Used - amount of memory used for all Workareas (manual + auto)
%PGA W/A Mem - percentage of PGA memory allocated to workareas
%Auto W/A Mem - percentage of workarea memory controlled by Auto Mem Mgmt
%Man W/A Mem - percentage of workarea memory under manual control
PGA Aggr
Target(M)
Auto PGA
Target(M)
PGA Mem
Alloc(M)
W/A PGA
Used(M)
%PGA W/A
Mem
%Auto W/A
Mem
%Man W/A
Mem
Global Mem
Bound(K)
B 1,024 1,226 480.56 0.00 0.00 0.00 0.00 163,840
Page 65
E 1,024 1,199 422.10 0.62 0.15 100.00 0.00 163,840
PGA Aggr Target Histogram
Optimal Executions are purely in-memory operations
Low Optimal High Optimal Total Execs Optimal Execs 1-Pass Execs M-Pass Execs
2K 4K 132,478 132,478 0 0
64K 128K 690 690 0 0
128K 256K 422 422 0 0
256K 512K 713 713 0 0
512K 1024K 4,128 4,128 0 0
1M 2M 796 796 0 0
2M 4M 172 172 0 0
4M 8M 98 98 0 0
8M 16M 56 56 0 0
64M 128M 1,507 0 1,507 0
PGA Memory Advisory
When using Auto Memory Mgmt, minimally choose a pga_aggregate_target value where Estd PGA Overalloc Count is 0
PGA Target
Est (MB)
Size
Factr
W/A MB
Processed
Estd Extra W/A MB Read/
Written to Disk
Estd PGA
Cache Hit %
Estd PGA
Overalloc Count
Estd
Time
200 0.13 201,044.50 717,452.25 22.00 1,912 57,991,729
400 0.25 201,044.50 208,684.37 49.00 0 25,869,319
800 0.50 201,044.50 181,379.82 53.00 0 24,145,374
1,200 0.75 201,044.50 181,379.82 53.00 0 24,145,374
1,600 1.00 201,044.50 181,379.82 53.00 0 24,145,374
1,920 1.20 201,044.50 0.00 100.00 0 12,693,478
2,240 1.40 201,044.50 0.00 100.00 0 12,693,478
2,560 1.60 201,044.50 0.00 100.00 0 12,693,478
Page 66
2,880 1.80 201,044.50 0.00 100.00 0 12,693,478
3,200 2.00 201,044.50 0.00 100.00 0 12,693,478
4,800 3.00 201,044.50 0.00 100.00 0 12,693,478
6,400 4.00 201,044.50 0.00 100.00 0 12,693,478
9,600 6.00 201,044.50 0.00 100.00 0 12,693,478
12,800 8.00 201,044.50 0.00 100.00 0 12,693,478
Shared Pool Advisory
Use this section to evaluate your shared pool size parameter.
The shared pool advisory report provides assistance in right sizing the Oracle shared
pool.
Much like the PGA Memory Advisor or the Buffer Pool advisory report, it provides
some insight into what would happen should you add or remove memory from the
shared pool. This can help you reclaim much needed memory if you have over
allocated the shared pool, and can significantly improve performance if you have not
allocated enough memory to the shared pool.
Other Advisories here
- SGA Target Advisory = Helps for SGA_TARGET settings
- Streams Pool Advisory = Only if streams are used, if you are getting spills, indicates
pool is too small
- Java Pool Advisory = Only if you are using internal Java, similar to the PL/SQL area in
the library caches
Here is an example of the shared pool advisory report:
Est LC Est LC Est LC Est LC
Shared SP Est LC Time Time Load Load Est
LC
Pool Size Size Est
LC Saved Saved Time Time Mem
Size(M) Factr (M) Mem Obj (s) Factr (s) Factr Obj
Hits
Page 67
---------- ----- -------- ------------ ------- ------ ------- ------ --------
---
192 .4 54 3,044 ####### .8
####### 382.1 22,444,274
240 .5 92 5,495 ####### .9
####### 223.7 22,502,102
288 .6 139 8,122
####### .9 53,711 102.5 22,541,782
336 .7 186 12,988
####### 1.0 17,597 33.6 22,562,084
384 .8 233 17,422
####### 1.0 7,368 14.1 22,569,402
432 .9 280 23,906
####### 1.0 3,553 6.8 22,571,902
480 1.0 327 28,605
####### 1.0 524 1.0 22,573,396
528 1.1 374 35,282
####### 1.0 1 .0 22,574,164
576 1.2 421 40,835
####### 1.0 1 .0 22,574,675
624 1.3 468 46,682
####### 1.0 1 .0 22,575,055
672 1.4 515 52,252
####### 1.0 1 .0 22,575,256
720 1.5 562 58,181
####### 1.0 1 .0 22,575,422
768 1.6 609 64,380
####### 1.0 1 .0 22,575,545
816 1.7 656 69,832
####### 1.0 1 .0 22,575,620
864 1.8 703 75,168
####### 1.0 1 .0 22,575,668
912 1.9 750 78,993
####### 1.0 1 .0 22,575,695
960 2.0 797 82,209
####### 1.0 1 .0 22,575,719
-------------------------------------------------------------
SGA target advisory
The SGA target advisory report is somewhat of a summation of all the advisory
reports previously presented in the AWR report. It helps you determine the impact
of changing the settings of the SGA target size in terms of overall database
performance. The report uses a value called DB Time as a measure of the increase or
decrease in performance relative to the memory change made. Also the report will
summarize an estimate of physical reads associated with the listed setting for the
SGA. Here is an example of the SGA target advisory report:
Page 68
SGA Target SGA Size Est DB Est Physical
Size (M) Factor Time (s) Reads
---------- ---------- ------------ ----------------
528 0.5 25,595 769,539
792 0.8 20,053 443,095
1,056 1.0 18,443 165,649
1,320 1.3 18,354 150,476
1,584 1.5 18,345 148,819
1,848 1.8 18,345 148,819
2,112 2.0 18,345 148,819
In this example, our SGA Target size is currently set at 1056MB. We can see from this
report that if we increased the SGA target size to 2112MB, we would see almost no
performance improvement (about a 98 second improvement overall). In this case,
we may determine that adding so much memory to the database is not cost
effective, and that the memory can be better used elsewhere.
Buffer Wait Statistics
The buffer wait statistics report helps you drill down on specific buffer wait events,
and where the waits are occurring. In the following report we find that the 13 buffer
busy waits we saw in the buffer pool statistics report earlier are attributed to data
block waits. We might then want to pursue tuning remedies to these waits if the
waits are significant enough. Here is an example
of the buffer wait statistics report:
Buffer Wait Statistics DB/Inst: AULTDB/aultdb1Snaps: 91-92
-> ordered by wait time desc, waits desc
Class Waits Total Wait Time (s) Avg Time (ms)
------------------ ----------- ------------------- --------------
data block 13 0 1 undo header 1 0 10
Enqueue Statistics
An enqueue is simply a locking mechanism. This section is very useful and must be
Page 69
used when the wait event "enqueue" is listed in the "Top 5 timed events".
The Enqueue activity report provides information on enqueues (higher level Oracle
locking) that occur.
As with other reports, if you see high levels of wait times in these reports, you might
dig further into the nature of the enqueue and determine the cause of the delays.
Here is an example of this report section:
EnqueueActivity DB/Inst: AULTDB/aultdb1 Snaps:91-92
-> only enqueues with waits are shown
-> Enqueue stats gathered prior to 10g should not be compared with 10g data
-> ordered by Wait Time desc, Waits desc
Enqueue Type (Request Reason)
-----------------------------------------------------------------------------
-
Requests Succ Gets Failed Gets Waits Wt Time (s) Av Wt Time(ms)
------------ ------------ ----------- ----------- ------------ --------------
PS-PX Process Reservation
386 358 28 116 0 .43
US-Undo Segment
276 276 0 228 0 .18
TT-Tablespace
90 90 0 42 0 .71
WF-AWR Flush
12 12 0 7 0 1.43
MW-MWIN Schedule
2 2 0 2 0 5.00
TA-Instance Undo
12 12 0 12 0 .00
UL-User-defined
7 7 0 7 0 .00
CF-Controlfile Transaction
5,737 5,737 0 5 0 .00
The action to take depends on the lock type that is causing the most problems. The
most common lock waits are generally for:
- TX (Transaction Lock): Generally due to application concurrency mechanisms, or
table setup issues. The TX lock is acquired when a transaction initiates its first change
and is held until the transaction does a COMMIT or ROLLBACK. It is used mainly as a
queuing mechanism so that other resources can wait for a transaction to complete.
- TM (DML enqueue): Generally due to application issues, particularly if foreign key
constraints have not been indexed. This lock/enqueue is acquired when performing
an insert, update, or delete on a parent or child table.
Page 70
- ST (Space management enqueue): Usually caused by too much space management
occurring. For example: create table as select on large tables on busy instances, small
extent sizes, lots of sorting, etc. These enqueues are caused if a lot of space
management activity is occurring on the database (such as small extent size, several
sortings occurring on the disk).
V$SESSION_WAIT and V$LOCK give more data about enqueues
- The P1, P2 and P3 values tell what the enqueuemay have been waiting on
- For BF we get node#, parallelizer#, and bloom#
column parameter1 format a15
column parameter2 format a15
column parameter3 format a15
column lock format a8
Select substr(name,1,7) as
"lock",parameter1,parameter2,parameter3
from v$event_name
where name like 'enq%';
Undo Statistics Section The undo segment summary report provides basic information on the performance
of undo tablespaces.
Undo information is provided in the following sections:
- Undo Segment Summary
- Undo Segment Stats
The examples below show typical performance problem related to Undo (rollback)
segments:
- Undo Segment Summary for DB
Undo Segment Summary for DB: S901 Instance: S901 Snaps: 2 -3
-> Undo segment block stats:
-> uS - unexpired Stolen, uR - unexpired Released, uU - unexpired reUsed
-> eS - expired Stolen, eR - expired Released, eU - expired reUsed
Undo Undo Num Max Qry Max Tx Snapshot Out of uS/uR/uU/
TS# Blocks Trans Len (s) Concurcy Too Old Space eS/eR/eU
---- -------------- ---------- -------- ---------- -------- ------ ----------
---
1 20,284 1,964 8 12 0 0
0/0/0/0/0/0
Page 71
The description of the view V$UNDOSTAT in the Oracle Database Reference guide
provides some insight as to the columns definitions. Should the client encounter
SMU problems, monitoring this view every few minutes would provide more useful
information.
- Undo Segment Stats for DB
Undo Segment Stats for DB: S901 Instance: S901 Snaps: 2 -3
-> ordered by Time desc
Undo Num Max Qry Max Tx Snap Out of uS/uR/uU/
End Time Blocks Trans Len (s) Concy Too Old Space eS/eR/eU
------------ ------------ -------- ------- -------- ------- ------ ----------
---
12-Mar 16:11 18,723 1,756 8 12 0 0
0/0/0/0/0/0
12-Mar 16:01 1,561 208 3 12 0 0
0/0/0/0/0/0
This section provides a more detailed look at the statistics in the previous section by
listing the information as it appears in each snapshot.
Use of UNDO_RETENTION can potentially increase the size of the undo segment for a
given period of time, so the retention period should not be arbitrarily set too high.
The UNDO tablespace still must be sized appropriately. The following calculation can
be used to determine how much space a given undo segment will consume given a
set value of UNDO_RETENTION.
Undo Segment Space Required = (undo_retention_time * undo_blocks_per_seconds)
As an example, an UNDO_RETENTION of 5 minutes (default) with 50 undo
blocks/second (8k blocksize) will generate:
Undo Segment Space Required = (300 seconds * 50 blocks/ seconds * 8K/block) =
120 M
The retention information (transaction commit time) is stored in every transaction
table block and each extent map block. When the retention period has expired,
SMON will be signaled to perform undo reclaims, done by scanning each transaction
table for undo timestamps and deleting the information from the undo segment
extent map. Only during extreme space constraint issues will retention period not be
obeyed.
Page 72
Latch Statistics Section
The latch activity report provides information on Oracle's low level locking
mechanism called a latch. From this report you can determine if Oracle is suffering
from latching problems, and if so, which latches are causing the greatest amount of
contention on the system.
Latch information is provided in the following three sections:
. Latch Activity
. Latch Sleep breakdown
. Latch Miss Sources
This information should be checked whenever the "latch free" wait event or other
latch wait events experience long waits. This section is particularly useful for
determining latch contention on an instance. Latch contention generally indicates
resource contention and supports indications of it in other sections. Latch contention
is indicated by a Pct Miss of greater than 1.0% or a relatively high value in Avg
Sleeps/Miss. While each latch can indicate contention on some resource, the more
common latches to watch are:
cache buffer chain= The cache buffer chain latch protects the hash chain of cache
buffers, and is used for each access to cache buffers. Contention for this latch can
often only be reduced by reducing the amount of access to cache buffers. Using the
X$BH fixed table can identify if some hash chains have many buffers associated with
them. Often, a single hot block, such as an index root block, can cause contention for
this latch. Contention on this latch confirms a hot block issue.
shared pool= The shared pool latch is heavily used during parsing, in particular during
hard parse. If your application is written so that it generally uses literals in stead of
bind variables, you will have high contention on this latch. Contention on this latch in
conjunction with reloads in the SQL Area of the library cache section indicates that
the shared pool is too small. You can set the cursor_sharing parameter in init.ora to
the value ‘force’ to reduce the hard parsing and reduce some of the contention for
the shared pool latch. Applications that are coded to only parse once per cursor and
execute multiple times will almost completely avoid contention for the shared pool
latch.
Literal SQL is being used. See Note 62143.1 'Understanding and Tuning the Shared
Pool for an excellent discussion of this topic.
Page 73
The parameter session_cached_cursors might need to be set. See enhancement bug
1589185 for details.
library cache= The library cache latch is heavily used during both hard and soft
parsing. If you have high contention for this latch, your application should be
modified to avoid parsing if at all possible. Setting the cursor_sharing parameter in
init.ora to the value ‘force’ provides some reduction in the library cache latch needs
for hard parses, and setting the session_cached_cursors sufficiently high provides
some reduction in the library cache latch needs for repeated soft parsing within a
single session. There is minor contention for this latch involved in executing SQL
statements, which can be reduced further by setting cursor_space_for_time=true, if
the application is properly written to parse statements once and execute multiple
times.
row cache= The row cache latch protects the data dictionary information, such as
information about tables and columns. During hard parsing, this latch is used
extensively. The cursor_sharing parameter can be used to completely avoid the row
cache latch lookup during parsing.
cache buffer lru chain= The buffer cache has a set of chains of LRU block, each
protected by one of these latches. Contention for this latch can often be reduced by
increasing the db_block_lru_latches parameter or by reducing the amount of access
to cachebuffers.
Here is a partial example of the latch activity report (it is quite long):
Pct Avg Wait
Pct
Get Get Slps Time NoWait
NoWait
Latch
Name Requests Miss /Miss (s) Requests Miss
------------------------ -------------- ------ ------ ------ ------------ ---
---
ASM
allocation 122 0.0 N/A 0 0 N/A
ASM map
headers 60 0.0 N/A 0 0 N/A
ASM map load waiting
lis 11 0.0 N/A 0 0 N/A
ASM map operation
freeli 30 0.0 N/A 0 0 N/A
ASM map operation hash
Page 74
t 45,056 0.0 N/A 0 0 N/A
ASM network background
l 1,653 0.0 N/A 0 0 N/A
AWR Alerted Metric
Eleme 14,330 0.0 N/A 0 0 N/A
Consistent
RBA 107 0.0 N/A 0 0 N/A
FAL request
queue 75 0.0 N/A 0 0 N/A
FAL subheap
alocation 75 0.0 N/A 0 0 N/A
FIB s.o chain
latch 14 0.0 N/A 0 0 N/A
FOB s.o list
latch 93 0.0 N/A 0 0 N/A
JS broadcast add buf
lat 826 0.0 N/A 0 0 N/A
JS broadcast drop buf
la 826 0.0 N/A 0 0 N/A
In this example our database does not seem to be experiencing any major latch
problems, as the wait times on the latches are 0, and our get miss pct (Pct Get Miss)
is 0 also.
There is also a latch sleep breakdown report which provides some additional detail if
a latch is being constantly moved into the sleep cycle, which can cause additional
performance issues.
The latch miss sources report provides a list of latches that encountered sleep
conditions. This report can be of further assistance when trying to analyze which
latches are causing problems with your database.
Segments Statistics Sections
This is a series of reports that let you identify objects that are heavily used. It
contains several sub-sections like:
Segments by Logical Reads
Segments by Physical Reads
Segments by Physical Read Requests
Segments by UnOptimized Reads
Segments by Optimized Reads
Page 75
Segments by Direct Physical Reads
Segments by Physical Writes
Segments by Physical Write Requests
Segments by Direct Physical Writes
Segments by Table Scans
Segments by DB Blocks Changes
Segments by Row Lock Waits
Segments by ITL Waits
Segments by Buffer Busy Waits
Segments by Logical Reads and Segments by Physical Reads
The "segments by logical reads" and "segments by physical reads" reports provide
information on the database segments (tables, indexes) that are receiving the largest
number of logical or physical reads. These reports can help you find objects that are
"hot" objects in the database. You may want to review the objects and determine
why they are hot, and if there are any tuning opportunities available on those
objects (e.g. partitioning), or on SQL accessing those objects.
For example, if an object is showing up on the physical reads report, it may be that
an index is needed on that object. Here is an example of the segments by logical
reads report:
Segments by Logical Reads
Total Logical Reads: 393,142,567
Captured Segments account for 99.4% of Total
Owner Tablespace Name Object Name Subobject Name Obj. Type Logical Reads %Total
FIPFGUARD FG_DATA SIGNATURES TABLE 320,674,176 81.57
FIPFGUARD FG_DATA SIGNATORY TABLE 30,730,688 7.82
FIPFGUARD FG_DATA DIBATCH TABLE 6,246,576 1.59
FIPFGUARD FG_DATA_ARCH FLOWDOCUMENT_ARCH TABLE 6,202,256 1.58
FIPFGUARD FG_INDX FLOWDOCUMENT FDSTATE300 TABLE PARTITION 6,134,336 1.56
Page 76
Segments by Physical Reads
Queries using these segments should be analyzed to check whether any FTS is
happening on these segments. In case FTS is happening then proper indexes should
be created to eliminate FTS.
Most of these SQLs can be found under section SQL Statistics -> SQL ordered by
Reads.
Total Physical Reads: 415,478,983
Captured Segments account for 86.3% of Total
Owner Tablespace Name Object Name Subobject Name Obj. Type Physical Reads %Total
FIPFGUARD FG_DATA SIGNATURES TABLE 320,331,032 77.10
FIPFGUARD FG_DATA SIGNATORY TABLE 30,610,210 7.37
FIPFGUARD FG_DATA_ARCH FLOWDOCUMENT_ARCH TABLE 6,056,604 1.46
FIPFGUARD FG_INDX FLOWDOCUMENT FDSTATE300 TABLE PARTITION 360,346 0.09
FIPFGUARD FG_INDX FLOWDOCUMENT FDSTATE400 TABLE PARTITION 355,648 0.09
Several segment related reports appear providing information on:
•Segments with ITL waits
•Segments with Row lock waits
•Segments with buffer busy waits
•Segments with global cache buffer waits
•Segments with CR Blocks received
•Segments with current blocks received
Segments by Physical Read Requests
Total Physical Read Requests: 4,701,222
Captured Segments account for 60.7% of Total
Owner Tablespace
Name Object Name
Subobject
Name Obj. Type
Phys Read
Requests %Total
FIPFGUARD FG_DATA SIGNATURES TABLE 2,509,369 53.38
FIPFGUARD FG_DATA SIGNATORY TABLE 266,234 5.66
FIPFGUARD FG_DATA_ARCH FLOWDOCUMENT_ARCH TABLE 47,508 1.01
Page 77
FIPFGUARD FG_DATA ACCOUNT TABLE 9,017 0.19
FIPFGUARD FG_INDX FLOWDOCUMENT FDSTATE400 TABLE
PARTITION
5,806 0.12
Segments by UnOptimized Reads
Total UnOptimized Read Requests: 4,701,222
Captured Segments account for 60.7% of Total
Owner Tablespace
Name Object Name
Subobject
Name Obj. Type
UnOptimized
Reads %Total
FIPFGUARD FG_DATA SIGNATURES TABLE 2,509,369 53.38
FIPFGUARD FG_DATA SIGNATORY TABLE 266,234 5.66
FIPFGUARD FG_DATA_ARCH FLOWDOCUMENT_ARCH TABLE 47,508 1.01
FIPFGUARD FG_DATA ACCOUNT TABLE 9,017 0.19
FIPFGUARD FG_INDX FLOWDOCUMENT FDSTATE400 TABLE
PARTITION
5,806 0.12
Segments by Direct Physical Reads
Total Direct Physical Reads: 415,248,809
Captured Segments account for 86.3% of Total
Owner Tablespace Name Object Name Subobject Name Obj. Type Direct Reads %Total
FIPFGUARD FG_DATA SIGNATURES TABLE 320,331,864 77.14
FIPFGUARD FG_DATA SIGNATORY TABLE 30,607,876 7.37
FIPFGUARD FG_DATA_ARCH FLOWDOCUMENT_ARCH TABLE 6,056,604 1.46
FIPFGUARD FG_INDX FLOWDOCUMENT FDSTATE300 TABLE PARTITION 357,576 0.09
FIPFGUARD FG_INDX FLOWDOCUMENT FDSTATE400 TABLE PARTITION 355,000 0.09
Segments by Physical Writes
Total Physical Writes: 57,054,872
Captured Segments account for 0.1% of Total
Owner Tablespace
Name Object Name
Subobject
Name Obj. Type
Physical
Writes %Total
FIPFGUARD FG_DATA PROCESSLOG TABLE 28,619 0.05
Page 78
FIPFGUARD FG_DATA UN_FD_ACCTSERIALROUTSEQNUMBER INDEX 5,428 0.01
** MISSING
**
TEMPFG ** MISSING: 501101/4223360 ** MISSING ** UNDEFINED 2,070 0.00
** MISSING
**
TEMPFG ** MISSING: 501102/4265728 ** MISSING ** UNDEFINED 1,988 0.00
SYS SYSAUX I_WRI$_OPTSTAT_H_OBJ#_ICOL#_ST INDEX 1,482 0.00
Segments by Physical Write Requests
Total Physical Write Requestss: 1,866,713
Captured Segments account for 0.9% of Total
Owner Tablespace
Name Object Name
Subobject
Name
Obj.
Type
Phys Write
Requests %Total
FIPFGUARD FG_DATA UN_FD_ACCTSERIALROUTSEQNUMBER INDEX 3,776 0.20
FIPFGUARD FG_DATA PROCESSLOG TABLE 2,619 0.14
SYS SYSAUX I_WRI$_OPTSTAT_H_OBJ#_ICOL#_ST INDEX 1,121 0.06
FIPFGUARD FG_DATA SIGNATURES TABLE 796 0.04
SYS SYSTEM HISTGRM$ TABLE 741 0.04
Segments by Direct Physical Writes
Total Direct Physical Writes: 56,969,427
Captured Segments account for 0.0% of Total
Owner Tablespac
e Name Object Name Subobject Name Obj. Type
Direct
Write
s
%Tota
l
**
MISSIN
G **
TEMPFG ** MISSING: 501101/4223360 ** MISSING ** UNDEFINE
D
2,070 0.00
**
MISSIN
G **
TEMPFG ** MISSING: 501102/4265728 ** MISSING ** UNDEFINE
D
1,988 0.00
SYS SYSAUX WRH$_ACTIVE_SESSION_HISTOR
Y
WRH$_ACTIVE_750434027_2074
3
TABLE
PARTITION
98 0.00
SYS SYSAUX SYS_LOB0000006306C00038$$ LOB 7 0.00
Segments by Table Scans
Total Table Scans: 18,527
Page 79
Captured Segments account for 95.6% of Total
Owner Tablespace Name Object Name Subobject Name Obj. Type Table Scans %Total
FIPFGUARD FG_INDX FLOWDOCUMENT FDSTATE400 TABLE PARTITION 6,597 35.61
FIPFGUARD FG_INDX FLOWDOCUMENT FDSTATE300 TABLE PARTITION 6,187 33.39
FIPFGUARD FG_DATA SIGNATORY TABLE 1,508 8.14
FIPFGUARD FG_DATA SIGNATURES TABLE 1,508 8.14
FIPFGUARD FG_INDX FLOWDOCUMENT FDSTATE200 TABLE PARTITION 501 2.70
Segments by DB Blocks Changes
% of Capture shows % of DB Block Changes for each top segment compared
with total DB Block Changes for all segments captured by the Snapshot
Owner Tablespace
Name Object Name
Subobject
Name
Obj.
Type
DB Block
Changes
% of
Capture
FIPFGUARD FG_DATA PROCESSLOG TABLE 175,280 18.63
FIPFGUARD FG_INDX PK_PROCESSLOG INDEX 109,200 11.61
SYS SYSTEM I_H_OBJ#_COL# INDEX 107,232 11.40
SYS SYSTEM HISTGRM$ TABLE 104,688 11.13
FIPFGUARD FG_INDX FK_PROCESSLOG_PROCESSID INDEX 104,016 11.06
Segments by Row Lock Waits
Owner Tablespace
Name Object Name Subobject
Name Obj.
Type Row Lock
Waits % of
Capture
RRA_OWNER RRA_DATA RRA_SRF_IX_04 INDEX 6,907 20.18 RRA_OWNER RRA_INDEX RRA_PROCSTATUS_IX_03 INDEX 3,918 11.45 RRA_OWNER RRA_INDEX RRA_REPTRN_PK INDEX 3,118 9.11 RRA_OWNER RRA_DATA TRRA_BALANCE_STATUS TABLE 1,750 5.11 RRA_OWNER RRA_INDEX RRA_PROCSTATUS_IX_02 INDEX 1,178 3.44
The statistic displays segment details based on total “Row lock waits” which
happened during snapshot period. Data displayed is sorted on “Row Lock Waits”
Page 80
column in descending order. It provides information about segments for which more
database locking is happening.
DML statements using these segments should be analysed further to check the
possibility of reducing concurrency due to row locking.
Segments by ITL Waits
Owner Tablespace
Name Object Name Subobject
Name Obj. Type ITL Waits % of Capture
RRA_OWNER RRA_INDEX RRA_MSGBLOBS_IX_01 INDEX 23 27.06 RRA_OWNER RRA_INDEX RRA_TRN_IX_08 INDEX 15 17.65 RRA_OWNER RRA_INDEX RRA_INT_CLOB_IX_01 INDEX 10 11.76 RRA_OWNER RRA_INDEX RRA_TRN_IX_05 INDEX 10 11.76 RRA_OWNER RRA_INDEX RRA_TRN_IX_10 INDEX 8 9.41
Whenver a transaction modifies segment block, it first add transaction id in the
Internal Transaction List table of the block. Size of this table is a block level
configurable parameter. Based on the value of this parameter those many ITL slots
are created in each block.
ITL wait happens in case total trasactions trying to update same block at the same
time are greater than the ITL parameter value.
Total waits happening in the example are very less, 23 is the Max one. Hence it is not
recommended to increase the ITL parameter value.
Segments by Buffer Busy Waits
Owner Tablespace
Name Object Name Subobject Name Obj.
Type Buffer
Busy
Waits % of
Capture
RRA_OWNER RRA_INDEX RRA_REPTRN_PK INDEX 4,577 26.69 RRA_OWNER RRA_INDEX RRA_REPBAL_IX_03 INDEX 1,824 10.64 RRA_OWNER RRA_INDEX RRA_PROCSTATUS_IX_03 INDEX 1,715 10.00 RRA_OWNER RRA_INDEX RRA_MSGINB_PK INDEX 827 4.82 RRA_OWNER RRA_INDEX RRA_PROCSTATUS_PK INDEX 696 4.06
Page 81
Buffer busy waits happen when more than one transaction tries to access same block
at the same time. In this scenario, the first transaction which acquires lock on the
block will able to proceed further whereas other transaction waits for the first
transaction to finish.
If there are more than one instances of a process continuously polling database by
executing same SQL (to check if there are any records available for processing), same
block is read concurrently by all the instances of a process and this result in Buffer
Busy wait event.
Retrieve SQL and Execution Plan from AWR
Snapshots
This is a simple script that can help you to collect SQL statements executed since
yesterday (configurable) that contains a specific value in its sentence.
col parsed format a6
col sql_text format a40
set lines 200
set pages 300
select sql_text, parsing_schema_name as parsed,
elapsed_time_delta/1000/1000 as elapsed_sec, stat.snap_id,
to_char(snap.end_interval_time,'dd.mm hh24:mi:ss') as
snaptime, txt.sql_id
from dba_hist_sqlstat stat, dba_hist_sqltext txt,
dba_hist_snapshot snap
where stat.sql_id=txt.sql_id
and stat.snap_id=snap.snap_id
and snap.begin_interval_time >= sysdate-1
and lower(sql_text) like '%&sql_test%'
and parsing_schema_name not in
('SYS','SYSMAN','MDSYS','WKSYS')
order by elapsed_time_delta asc;
This will show something like: Enter value for sql_test: delete
old 7: and lower(sql_text) like '%&sql_test%'
new 7: and lower(sql_text) like '%delete%'
Page 82
SQL_TEXT PARSED
ELAPSED_SEC SNAP_ID SNAPTIME
SQL_ID
---------------------------------------- ------ ----------- ----
------ ---------
----- -------------
DELETE FROM WWV_FLOW_FILE_OBJECTS$ WHERE
APEX_0 .484942 688 23.08 16:
00:54 8rpn8jtjnuu73
SECURITY_GROUP_ID = 0 30200
Then with that sql_id, we can retrieve the execution plan from the snapshots: select plan_table_output from table
(dbms_xplan.display_awr('&sqlid'));
Enter value for sqlid: 8rpn8jtjnuu73
old 1: select plan_table_output from table
(dbms_xplan.display_awr('&sqlid'))
new 1: select plan_table_output from table
(dbms_xplan.display_awr('8rpn8jtjnuu73'))
PLAN_TABLE_OUTPUT
----------------------------------------------------------------
----------------
SQL_ID 8rpn8jtjnuu73
--------------------
DELETE FROM WWV_FLOW_FILE_OBJECTS$ WHERE SECURITY_GROUP_ID = 0
Plan hash value: 358826532
----------------------------------------------------------------
---------------------
| Id | Operation | Name | Rows |
Bytes | Cost (%CPU)|
----------------------------------------------------------------
---------------------
| 0 | DELETE
STATEMENT | | | | 1
(100)|
| 1 | DELETE |
WWV_FLOW_FILE_OBJECTS$ | | | |
| 2 | INDEX RANGE SCAN| WWV_FLOW_FILES_SGID_FK_IDX | 1
| 202 | 0 (0)|
Page 83
----------------------------------------------------------------
---------------------
Get Data from ASH
If you need to quickly check a performance problem on your DB, ASH is great here
We sample the Wait-Events of active sessions every second into the ASH-Buffer.
It is accessed most comfortable with the Enterprise Manager GUI from the
Performance Page (Button ASH Report there).
Or with little effort from the command line like this:
-----------------------------------------
-- Top 10 CPU consumers in last 5 minutes
-----------------------------------------
select *
from (select session_id, session_serial#, count(*)
from v$active_session_history
where session_state= 'ON CPU'
and sample_time > sysdate - interval '5' minute
group by session_id, session_serial#
order by count(*) desc
)
where rownum <= 10;
--------------------------------------------
-- Top 10 waiting sessions in last 5 minutes
--------------------------------------------
select *
from (select session_id, session_serial#,count(*)
from v$active_session_history
where session_state='WAITING'
and sample_time > sysdate - interval '5' minute
group by session_id, session_serial#
order by count(*) desc
)
where rownum <= 10;
Page 84
-- These 2 queries should spot the most incriminating sessions
of the last 5 minutes.
-- But who is that and what SQL was running?
--------------------
-- Who is that SID?
--------------------
set lines 200
col username for a10
col osuser for a10
col machine for a10
col program for a10
col resource_consumer_group for a10
col client_info for a10
select serial#, username, osuser, machine, program,
resource_consumer_group, client_info
from v$session
where sid = &sid;
-------------------------
-- What did that SID do?
-------------------------
select distinct sql_id, session_serial#
from v$active_session_history
where sample_time > sysdate - interval '5' minute
and session_id = &sid;
----------------------------------------------
-- Retrieve the SQL from the Library Cache:
----------------------------------------------
col sql_text for a80
select sql_text from v$sql where sql_id='&sqlid';
Moving AWR information Enterprise Manager allows administrators to transfer Automatic Workload
Page 85
Repository snapshots to other workload repositories for offline analysis. This is
accomplished by the administrator specifying a snapshot range and extracting the
AWR data to a flat file. The flat file is then loaded into a user-specified staging
schema in the target repository. To complete the transfer, the data is copied from
the staging schema into the target repository's SYS schema. The data in the SYS
schema is then used as the source for the ADDM analysis.
If the snapshot range already exists in the SYS or staging schemas, the data being
imported is ignored. All data in snapshot ranges that does not conflict with existing
data is loaded. Oracle contains a new package DBMS_SWRF_INTERNAL to provide
AWR snapshot export and import functionality.
The example below exports a snapshot range starting with 100 and ending at 105 to
the output dump file 'awr_wmprod1_101_105' in the directory
'/opt/oracle/admin/awrdump/wmprod1': BEGIN
DBMS_SWR_INTERNAL.AWR_EXTRACT(
DMPFILE =>'awr_export_wmprod1_101_105',
DMPDIR => '/opt/oracle/admin/awrdump/wmprod1',
BID => 101,
EID => 105)
We then use the AWR_LOAD procedure to load the data into our target repository
staging schema: BEGIN
DBMS_SWR_INTERNAL.AWR_LOAD(
SCHNAME => 'foot',
DMPFILE =>'awr_export_wmprod1_101_105',
DMPDIR => '/opt/oracle/admin/awrdump/wmprod1')
The last step is to transfer the data from our staging schema (FOOT) to the SYS
schema for analysis: BEGIN
DBMS_SWR_INTERNAL.MOVE_TO_AWR(SCHNAME => 'foot',)
Links with AWR Analyzer Excel Performance Analyzer (Perfsheet v2.0)
http://www.oraperf.com http://www.txmemsys.com/statspack-reg.htm (Statspack Analyzer)
Page 86
http://www.dbapool.com/dbanalyzer.php (Analyze your AWR or Statspack) http://www.softpedia.com/get/Internet/Servers/Database-Utils/spReporter.shtml (Download
Tool to Analyze AWR or Statspack Reports) http://www.ondatafine.com/ (web based application. It processes plain-text statspack or AWR) http://www.spviewer.com/index.html (STATSPACK and AWR Viewer software)
Scripts: http://www.evdbt.com/tools.htm