41
Quinpario Acquisition Corp. Investor Presentation Investor Presentation Acquisition of Jason Incorporated May 8, 2014

Quinpario Acquisition Corp.Investor PresentationInvestor Presentation
Acquisition of Jason Incorporated
May 8, 2014

Forward Looking Statements
This presentation includes “forward looking statements” within the meaning of the “safe harbor” provisions of the United States Private Securities Litigation Reform Act of 1995. Forward-lookingstatements may be identified by the use of words such as “anticipate,” “believe,” “expect,” “estimate,” “plan,” “outlook,” and “project” and other similar expressions that predict or indicate futureevents or trends or that are not statements of historical matters. Such forward looking statements include projected financial information. Such forward looking statements with respect to revenues,earnings, performance, strategies, prospects and other aspects of the businesses of Quinpario Acquisition Corp. (“QPAC”), Jason Partners Holdings Inc. (“Jason”) and the combined company aftercompletion of the proposed business combination are based on current expectations that are subject to risks and uncertainties. A number of factors could cause actual results or outcomes to differmaterially from those indicated by such forward looking statements. These factors include, but are not limited to: (1) the occurrence of any event, change or other circumstances that could give riseto the termination of the Stock Purchase Agreement for the business combination (the “Purchase Agreement”); (2) the outcome of any legal proceedings that may be instituted against Jason or QPACfollowing announcement of the proposed business combination and transactions contemplated thereby; (3) the inability to complete the transactions contemplated by the proposed businesscombination due to the failure to obtain approval of the stockholders of QPAC, or other conditions to closing in the Purchase Agreement; (4) the ability to obtain or maintain the listing of the post-combination company’s common stock on NASDAQ following the business combination; (5) the risk that the proposed business combination disrupts current plans and operations as a result of theannouncement and consummation of the transactions described herein; (6) the ability to recognize the anticipated benefits of the business combination, which may be affected by, among otherthings, competition, the ability to integrate the Jason and QPAC businesses, and the ability of the combined business to grow and manage growth profitably; (7) costs related to the businesscombination; (8) changes in applicable laws or regulations; (9) the possibility that Jason or QPAC may be adversely affected by other economic, business, and/or competitive factors; and (10) otherrisks and uncertainties indicated from time to time in the proxy statement, including those under “Risk Factors” therein, and other filings with the Securities and Exchange Commission (“SEC”) byQPAC. You are cautioned not to place undue reliance upon any forward-looking statements, which speak only as of the date made. QPAC and Jason undertake no obligation to update or revise theforward-looking statements, whether as a result of new information, future events or otherwise.
Financial Presentations
This presentation includes non-GAAP financial measures, including EBIT, EBITDA, Proforma EBITDA, EBIT Margin and EBITDA Margin. EBITDA is calculated as earnings before interest and taxes(“EBIT”) plus depreciation and amortization (“EBITDA”). In addition, Proforma EBITDA is calculated as EBITDA adjusted to give pro forma effect to (i) the proposed business combination withQPAC, (ii) the business combination’s related changes to the post-combination company’s capitalization structure and (iii) the estimated increase expenses of operating as a public company. EBITMargin is defined as EBIT divided by total revenues. EBITDA Margin is defined as EBITDA divided by total revenues.
Non-GAAP and Other Company Information
Disclaimer
Non-GAAP and Other Company Information
Jason believes that these non-GAAP measures of financial results provide useful information to management and investors regarding certain financial and business trends relating to Jason’s financialcondition and results of operations. Jason’s management uses these non-GAAP measures to compare Jason’s performance to that of prior periods for trend analyses, for purposes of determiningmanagement incentive compensation, and for budgeting and planning purposes. These measures are used in monthly financial reports prepared for management and Jason’s board of directors.Jason believes that the use of these non-GAAP financial measures provides an additional tool for investors to use in evaluating ongoing operating results and trends and in comparing Jason’sfinancial measures with other companies in the finishing, seating, acoustics or components business, many of which present similar non-GAAP financial measures to investors. Management of Jasondoes not consider these non-GAAP measures in isolation or as an alternative to financial measures determined in accordance with GAAP. We have not reconciled the non-GAAP forward lookinginformation to their corresponding GAAP measures because we do not provide guidance for the various reconciling items such as stock-based compensation, provision for income taxes,depreciation and amortization, costs related to acquisitions, and foreign currency remeasurements and transactions gains and losses, as certain items that impact these measures are out of ourcontrol or cannot be reasonably predicted. You should review Jason’s audited financial statements, which will be presented in QPAC’s proxy statement to be filed with the SEC and delivered toQPAC’s stockholders, and not rely on any single financial measure to evaluate Jason’s business.
Other companies may calculate EBITDA, Adjusted EBITDA and other non-GAAP measures differently, and therefore our EBITDA, Adjusted EBITDA and other non-GAAP measures and that ofJason may not be directly comparable to similarly titled measures of other companies.
Additional Information
QPAC has filed with the SEC a preliminary proxy statement in connection with the proposed business combination and other matters and will mail a definitive proxy statement and other relevantdocuments to its stockholders when they become available. QPAC’s stockholders and other interested persons are advised to read the preliminary proxy statement and any amendments theretoand, once available, the definitive proxy statement in connection with the Company’s solicitation of proxies for its stockholders’ meeting to be held to approve, among other things, the proposedbusiness combination because the proxy statement will contain important information about QPAC, Jason and the business combination. Stockholders may obtain a free copy of the proxy statement,as well as other filings containing information about QPAC, without charge, at the SEC’s Internet site (www.sec.gov). You may also be able to obtain these documents, free of charge, by accessingQPAC’s website (www.quinpario.com). Copies of the proxy statement and the filings with the SEC that are incorporated by reference in the proxy statement can also be obtained, without charge, bydirecting a request to Paul J. Berra III, Vice President, General Counsel and Secretary, 12935 N. Forty Drive, St. Louis, Missouri 63141.
Participants in the Solicitation
QPAC and its directors and executive officers and other persons may be deemed to be participants in the solicitations of proxies from QPAC’s stockholders in respect of the proposed businesscombination. Information regarding QPAC’s directors and executive officers and a description of their direct and indirect interests, by security holdings or otherwise, is contained in QPAC’spreliminary proxy statement for the business combination, which has been filed with the SEC.
2
Agenda
• Summary
• Jason Overview
• Growth Opportunities
• Financial Overview

Transaction Overview
Transaction
• Quinpario Acquisition Corp. (“QPAC”), through its newly formed acquisition sub, JPHI Holdings Inc., will acquire 100% of Jason Partners Holdings Inc., the indirect parent company of Jason Incorporated (“Jason”)
• Jason is a global diversified manufacturer of critical industrial components and manufacturing solutions across a wide range of end markets, industries and geographies
• Transaction expected to close midyear 2014
• Entity to be listed on NASDAQ post business combination
JPHI Holdings Inc.
4
• Entity to be listed on NASDAQ post business combination
Consideration
• Transaction value of $538.65 million
– 6.75x 2013 Actual Proforma EBITDA of $79.8 million
• Total estimated Transaction capital requirement of approximately $700 million
– Includes cash for working capital, payment of transaction expenses, and assumes 50% of warrants repurchased at $0.75 per warrant pursuant to a tender offer commenced May 6, 2014 by QPAC
Management & Board
• Existing Jason management to continue to run the business. David Westgate, Chief Executive Officer of Jason, to remain CEO and serve on the board of directors
• Jeffry Quinn, founder of Quinpario, to serve as the chairman of the board of directors
• Remaining board will be comprised of existing Quinpario directors James Heffernan, Edgar Hotardand Dr. John Rutledge, existing Jason director Vincent Martin and three newly appointed directors, Robert Jenkins, James Sullivan and James Stern
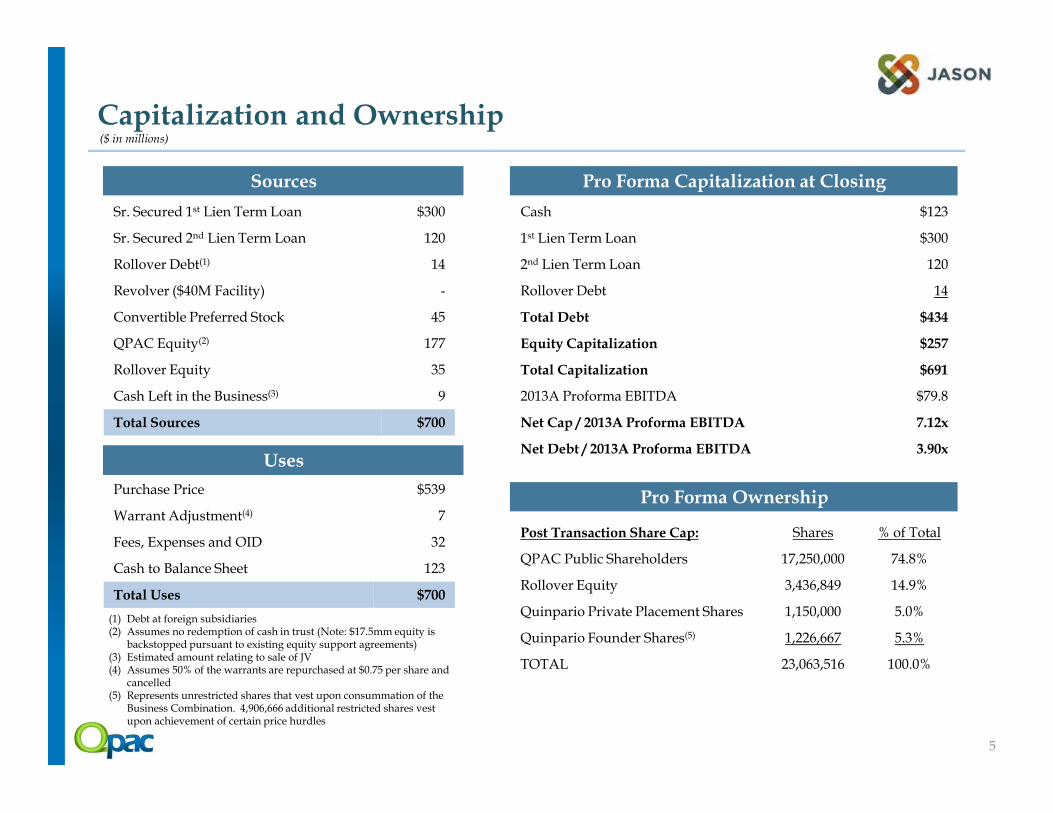
Capitalization and Ownership
Sr. Secured 1st Lien Term Loan $300
Sr. Secured 2nd Lien Term Loan 120
Rollover Debt(1) 14
Revolver ($40M Facility) -
Convertible Preferred Stock 45
QPAC Equity(2) 177
Rollover Equity 35
Cash Left in the Business(3) 9
Pro Forma Capitalization at Closing
Cash $123
1st Lien Term Loan $300
2nd Lien Term Loan 120
Rollover Debt 14
Total Debt $434
Equity Capitalization $257
Total Capitalization $691
2013A Proforma EBITDA $79.8
Sources
($ in millions)
(1) Debt at foreign subsidiaries(2) Assumes no redemption of cash in trust (Note: $17.5mm equity is
backstopped pursuant to existing equity support agreements)(3) Estimated amount relating to sale of JV(4) Assumes 50% of the warrants are repurchased at $0.75 per share and
cancelled(5) Represents unrestricted shares that vest upon consummation of the
Business Combination. 4,906,666 additional restricted shares vest upon achievement of certain price hurdles
5
Total Sources $700
Purchase Price $539
Warrant Adjustment(4) 7
Fees, Expenses and OID 32
Cash to Balance Sheet 123
Total Uses $700
Net Cap / 2013A Proforma EBITDA 7.12x
Net Debt / 2013A Proforma EBITDA 3.90xUses
Post Transaction Share Cap: Shares % of Total
QPAC Public Shareholders 17,250,000 74.8%
Rollover Equity 3,436,849 14.9%
Quinpario Private Placement Shares 1,150,000 5.0%
Quinpario Founder Shares(5) 1,226,667 5.3%
TOTAL 23,063,516 100.0%
Pro Forma Ownership
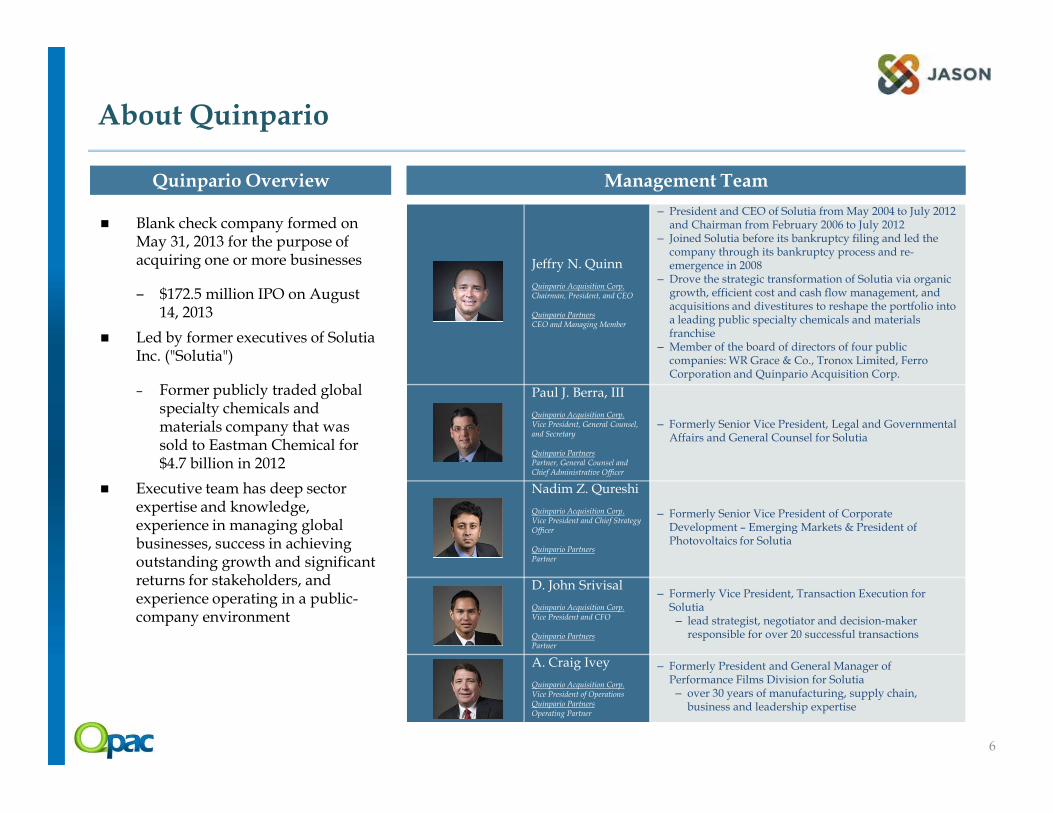
About Quinpario
Blank check company formed on May 31, 2013 for the purpose of acquiring one or more businesses
– $172.5 million IPO on August 14, 2013
Led by former executives of Solutia Inc. ("Solutia")
– Former publicly traded global specialty chemicals and
Quinpario Overview Management Team
Jeffry N. Quinn
Quinpario Acquisition Corp.Chairman, President, and CEO
Quinpario PartnersCEO and Managing Member
‒ President and CEO of Solutia from May 2004 to July 2012 and Chairman from February 2006 to July 2012
‒ Joined Solutia before its bankruptcy filing and led the company through its bankruptcy process and re-emergence in 2008
‒ Drove the strategic transformation of Solutia via organic growth, efficient cost and cash flow management, and acquisitions and divestitures to reshape the portfolio into a leading public specialty chemicals and materials franchise
‒ Member of the board of directors of four public companies: WR Grace & Co., Tronox Limited, Ferro Corporation and Quinpario Acquisition Corp.
Paul J. Berra, III
6
specialty chemicals and materials company that was sold to Eastman Chemical for $4.7 billion in 2012
Executive team has deep sector expertise and knowledge, experience in managing global businesses, success in achieving outstanding growth and significant returns for stakeholders, and experience operating in a public-company environment
Quinpario Acquisition Corp.Vice President, General Counsel, and Secretary
Quinpario PartnersPartner, General Counsel and Chief Administrative Officer
‒ Formerly Senior Vice President, Legal and Governmental Affairs and General Counsel for Solutia
Nadim Z. Qureshi
Quinpario Acquisition Corp.Vice President and Chief Strategy Officer
Quinpario PartnersPartner
‒ Formerly Senior Vice President of Corporate Development – Emerging Markets & President of Photovoltaics for Solutia
D. John Srivisal
Quinpario Acquisition Corp.Vice President and CFO
Quinpario PartnersPartner
‒ Formerly Vice President, Transaction Execution for Solutia
‒ lead strategist, negotiator and decision-maker responsible for over 20 successful transactions
A. Craig Ivey
Quinpario Acquisition Corp.Vice President of OperationsQuinpario PartnersOperating Partner
‒ Formerly President and General Manager of Performance Films Division for Solutia‒ over 30 years of manufacturing, supply chain,
business and leadership expertise

Jason Investment Highlights
Strong fundamental business…
Leader in target markets with twice the scale of the next direct competitor in many product lines
Highly diversified business exposure
Global manufacturing footprint serving longstanding customer base
Strong free cash flow generation and high revenue / EBITDA visibility
Experienced management team with a track record of success
7
Experienced management team with a track record of success
…positioned for growth
Pricing and operational improvement opportunities leading to margin expansion and earnings growth
Scalable and highly effective Jason Business System (“JBS”) platform
Strategic initiatives positioned for growth
Growth opportunities in attractive end markets
Strong organic growth platform with a renewed focus on M&A

Quinpario’s Capabilities will Strengthen Jason
• Capture operational synergies across businesses
• Improve operating efficiency by instilling demand-driven lean processes
• Leverage global sourcing spend to scale up performance and margins
• Develop robust strategic planning process
• Strengthen market & customer driven approach
• Develop shareholder driven mentality based on long term success of the business
Process Excellence
Strategy
Deep Analytics
Business Operations
Quinpario’s Capabilities Quinpario’s Support to Jason
8
• Engage in synergistic bolt-on acquisitions to strengthen core business, with initial focus on Jason’s Finishing and Seating segments
• Seek new platform acquisition opportunities that will generate excess returns for shareholders
• Grow Jason’s business segments globally with a focus on new market access & increased market penetration, especially in Asia and Latin America
• Further differentiate Jason’s key brands through insight-driven channel / product development
performance and margins
M&A
GlobalGrowth
CorporateGovernance
Quinpario Partners
Legal and Governance
M&A
Strategic Planning
Shareholder Mindset
• World-class public company board to assist growth and development of Jason
• Align management incentives with shareholder value creation

Jason Board of Directors
Proposed Board of Directors
Jeffry N. QuinnChairman
Founder of Quinpario
Former President, CEO & Chairman of Solutia
Current board positions: W.R. Grace & Co. (NYSE: GRA), Tronox Limited (NYSE: TROX) and Ferro Corporation (NYSE: FOE)
David C. WestgateChief Executive Officer
Jason’s President and CEO since 2004
Former President and CEO of Rieter Automotive
Current board position: Netshape Technologies
James P. HeffernanCurrent QPAC Director
Current board positions: United Natural Foods, Inc. (NASDAQ: UNFI), Command Security Corp. (AMEX: MOC)
Former Solutia board member
The Jason Board of Directors will be comprised of incumbent QPAC board members, incumbent Jason board members and three new directors who collectively bring a wealth of industry experience and expertise
9
Edgar G. HotardCurrent QPAC Director
Former President & COO of Praxair (NYSE: PX)
Current board positions: Baosteel Metals, SIAD Macchine Impianti S.p.A.
Former Solutia board member
Over 45 years of international operating experience
Robert H. JenkinsProposed Director
Former Chairman and CEO of Sundstrand Corporation
Current board positions: AK Steel Holding Corporation (NYSE: AKS), Acco Brands Corporation (NYSE: ACCO), and Clarcor, Inc. (NYSE: CLC)
Vincent L. MartinCurrent Jason Director
Co-Founded Jason in 1985
Served as Chairman of Jason until 2004 and as CEO until 1999
Current board positions: Jason and Husco International
Dr. John RutledgeCurrent QPAC Director
Chief Investment Strategist for Safanad SA
Senior Research Professor, Claremont Graduate University
Former advisor to the Reagan and Bush administrations on economics/tax policy
James F. SternProposed Director
Executive VP of A. O. Smith Corporation (NYSE: AOS)
Former partner at Foley & Lardner LLP, concentrating on mergers and acquisitions for public and private companies
James SullivanProposed Director
Executive VP and CFO of Joy Global, Inc. (NYSE: JOY)
Former CFO of Solutia
• Summary
• Jason Overview
• Growth Opportunities• Growth Opportunities
• Financial Overview

Experienced and Proven Management Team
Name TitleYears with
JasonYears in Industry Prior Experience
David WestgateChairman, President & CEO
10 34 President & CEO - Rieter Automotive
President - Inergy Automotive Systems
CFO - Rexnord Gear Products
Jason’s senior leadership team averages 25 years of experience, providing the Company with a deep base of expertise and representing a distinct competitive advantage
Proven experience managing through severe economic cycles; strategically removed $26 million of costs during 2009 downturn, of which $22 million were permanent
Successfully integrated 9 acquisitions since 2004
Significant management equity ownership stake
11
Steve Cripe, CPA CFO 7 33
CFO - Rexnord Gear Products
VP Finance & Group Controller - Manitowoc
Crane Group
David CataldiPresident of Acoustics &
Components Segments 9 29
VP - Sanmina-SCI
VP - Kautex Textron North America
Srivas PrasadPresident of Seating
Segment8 24 Variety of leadership roles at Textron
Dr. Florestan von
Boxberg
President of Finishing
Segment 8 23 President - Osborn Unipol International
John Hengel, CPA VP of Finance 15 32 Director - PricewaterhouseCoopers
William Schultz General Counsel 7 14 Business Law Attorney - Reinhart Boerner Van
Deuren s.c.

Jason Business Overview
Employees: ~4,000
Headquarters: Milwaukee, WI
2013 Revenue: $680.8 million
2013 EBITDA: $79.8 million
Founded: 1985
Manufacturing: 33 Sites in 12 Countries
Square Feet of Manufacturing Space: ~2.9 million
Management:
Key Company Facts Geographic Footprint
Components
Finishing
Seating
Management:
David Westgate, Chairman, President and CEO
Steve Cripe, Chief Financial Officer
Financial ProfileBusiness Mix (a)
Acoustics
Components
Components20%
Acoustics30%
Finishing26%
Seating 24%
US 72%
EU19%
Mexico7%
ROW2%
9.9%9.7%
10.8% 11.7%
0%
5%
10%
15%
$0
$200
$400
$600
$800
2010 2011 2012 2013
Revenue EBITDA Margin (%)
_____________________(a) 2013 mix
12
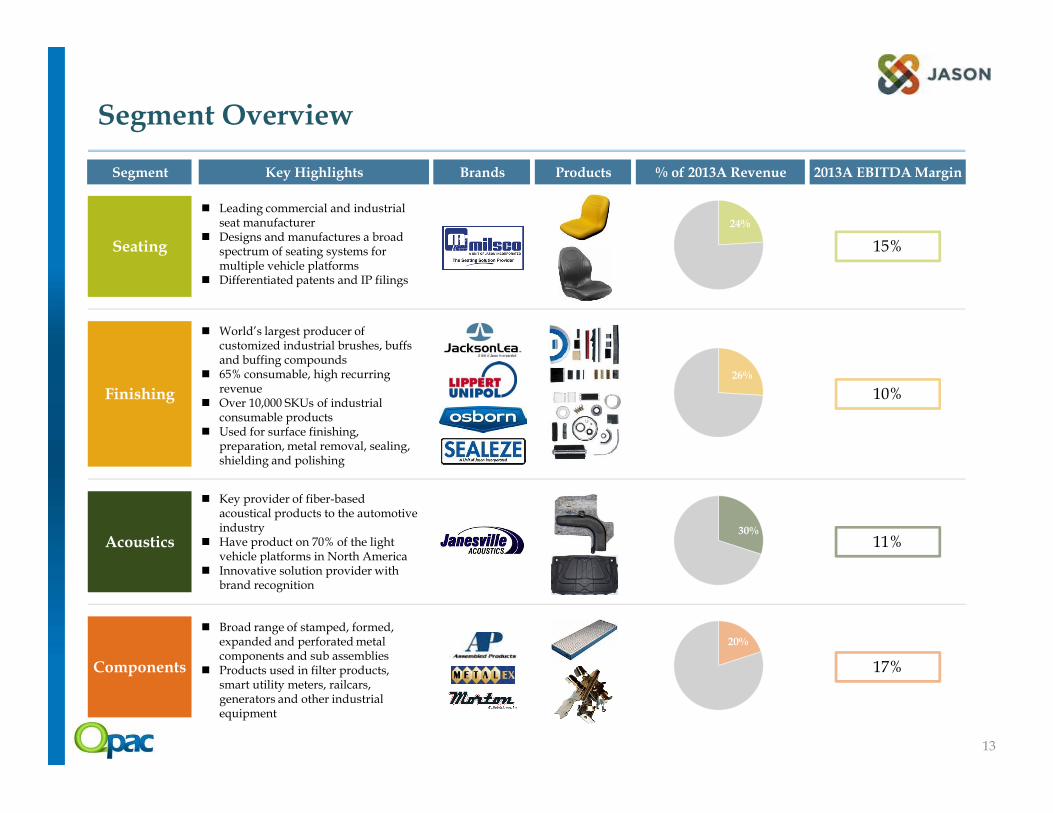
Segment Overview
26%
24%
Segment
Leading commercial and industrial seat manufacturer
Designs and manufactures a broad spectrum of seating systems for multiple vehicle platforms
Differentiated patents and IP filings
Key Highlights Brands Products % of 2013A Revenue 2013A EBITDA Margin
World’s largest producer of customized industrial brushes, buffs and buffing compounds
65% consumable, high recurring revenue
Over 10,000 SKUs of industrial
Seating
Finishing
15%
10%
13
30%
20%
Over 10,000 SKUs of industrial consumable products
Used for surface finishing, preparation, metal removal, sealing, shielding and polishing
Key provider of fiber-based acoustical products to the automotive industry
Have product on 70% of the light vehicle platforms in North America
Innovative solution provider with brand recognition
Broad range of stamped, formed, expanded and perforated metal components and sub assemblies
Products used in filter products, smart utility meters, railcars, generators and other industrial equipment
Acoustics
Components
11%
17%

Long-Term Relationships with Blue Chip Customers
Customer Since 193480 Years
Customer Since 192886 Years
Customer Since 196846 Years
Customer Since 196747 Years
Customer Since 197539 Years
Customer Since 197242 Years
Customer Since 197539 Years
Customer Since 197835 Years
14
Customer Since 199024 years
Customer Since 198826 Years
Customer Since 199123 Years
A subsidiary of
Customer Since 199024 years
Customer Since 20112 Years
Customer Since 20112 Years
Customer Since 199321 Years
Customer Since 200211 Years
Customer Since 20085 Years
Customer Since 20094 Years
Customer Since 198430 Years
Customer Since 198727 Years
Customer Since 198628 Years
Customer Since 197835 Years

Scalable and Highly Effective Jason Business System Platform
Unifying
Scalable
Consistent
The Jason Business System (“JBS”) links the Company’s business segments through a consistent strategy and focus.
Operational Excellence Share expertise and best practices across businesses Focus resources on key priorities through policy
deployment Prioritize enterprise-wide “Lean Culture”
Revenue GrowthStreamline innovation and proactively address
RE
VE
NU
E G
RO
WT
H
OP
ER
AT
ION
AL
EX
CE
LL
EN
CE
15
Results-driven
Rewards
Streamline innovation and proactively address customer needs
Grow organically through cross-selling and new product development
Leverage acquisition opportunities that add synergies and open new paths to growth
People Be ethical – do the right thing, the right way Deliver on commitments, consistently exceed customer
expectations Use company scale to attract top talent; reward well
and fairly across all segments
RE
VE
NU
E G
RO
WT
H
PE
OP
LE
OP
ER
AT
ION
AL
EX
CE
LL
EN
CE

• Summary
• Jason Overview
• Growth Opportunities• Growth Opportunities
• Financial Overview

End-market Diversification and Geographic GrowthE
nd
-Mar
ket
Mix
Consumer Goods
Marine
Motorcycle
Automotive
General Industrial
2013 2018
37%
23%
15%
8%
16% 1%
25%
18%
16%
5%
35%
2%
• Jason’s key growth markets include Energy/Oil and Gas, Construction, Agriculture, Commercial Vehicles, Mass Transit, Aerospace
Jason Key Growth Markets
17
Geo
gra
ph
ic M
ix
79%
19%
1% 1%
NorthAmerica
78%
69%
22%
7% 2%
Rest of World
Asia
Europe
North America
• Jason’s key growth markets include Energy/Oil and Gas, Construction, Agriculture, Commercial Vehicles, Mass Transit, Aerospace and Power Generation
• Key growth drivers for Seating segment are demand for modern styling, ergonomic design and advanced functionality in agricultural and construction markets
• Growth in Finishing segment driven by growing demand for higher quality and performance products in early manufacturing stages
• Upside from increased demand for finishing products in North America O&G exploration, drilling and pipeline activity (welding, cleaning, maintenance etc.)
• Exposure to Automotive expected to reduce as penetration into attractive end-markets increases
_____________________Source: Management estimates

Attractive Geographic Expansion Opportunities
Jason has identified attractive geographies to further expand its global footprint
18
Mexico
Seeking strategic partnerships in the Mexican region to leverage overhead
Brazil
Looking for opportunities to expand Seating
business in Brazil to capitalize on
attractive end-market trends
Eastern Europe
Executing a strategy to expand Seating
operations into Eastern Europe in support of
growth in heavy industry
Southeast Asia
Recently opened a sales office in Singapore to capitalize on strong
finishing market in SE Asia
India
Substantially expanding capacity for
both Seating and Finishing operations to support growth with
key customers
33%
9%
5%4%
2%
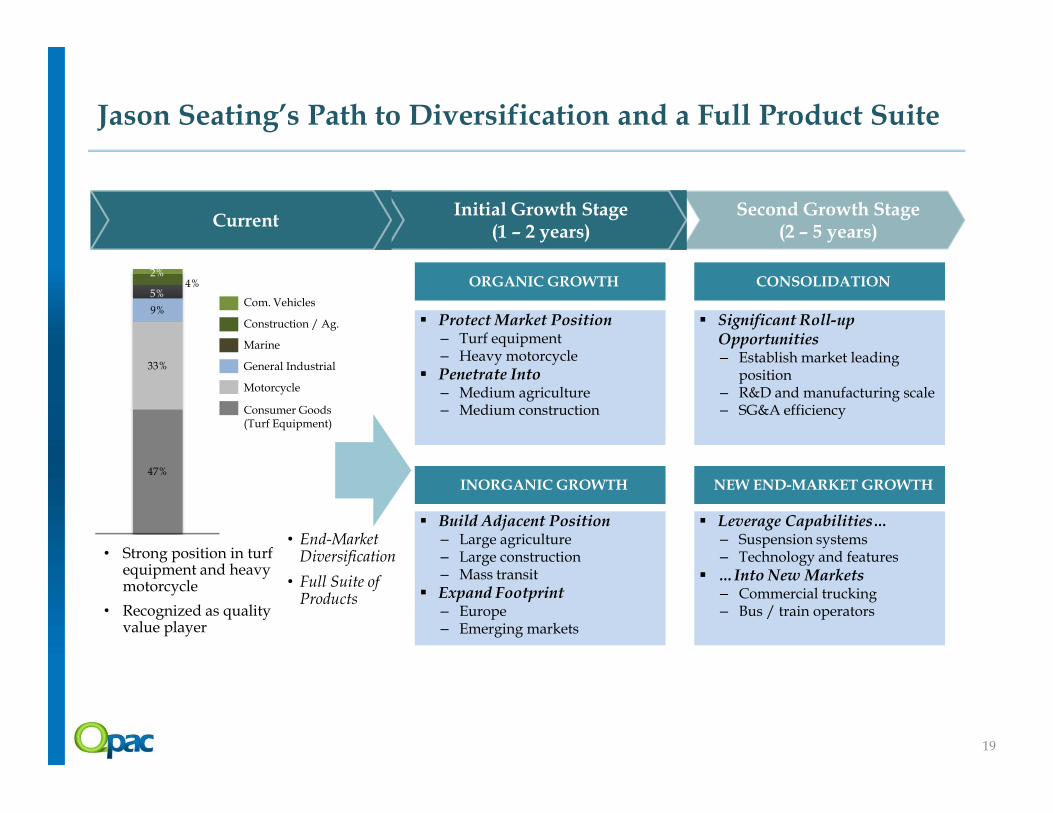
Jason Seating’s Path to Diversification and a Full Product Suite
Second Growth Stage(2 – 5 years)
Initial Growth Stage(1 – 2 years)
Current
Protect Market Position– Turf equipment– Heavy motorcycle
Penetrate Into– Medium agriculture– Medium construction
Significant Roll-up Opportunities– Establish market leading
position– R&D and manufacturing scale– SG&A efficiency
CONSOLIDATIONORGANIC GROWTH
Marine
General Industrial
Com. Vehicles
Construction / Ag.
Motorcycle
Consumer Goods
47%
19
– Medium construction
Build Adjacent Position– Large agriculture– Large construction– Mass transit
Expand Footprint– Europe– Emerging markets
– SG&A efficiency
Leverage Capabilities… – Suspension systems– Technology and features
…Into New Markets– Commercial trucking– Bus / train operators
• Strong position in turf equipment and heavy motorcycle
• Recognized as quality value player
NEW END-MARKET GROWTHINORGANIC GROWTH
• End-Market Diversification
• Full Suite of Products
Consumer Goods(Turf Equipment)

32%
5% 1%
5%1%
5%5% 1%
Jason Finishing will Target Segments that are High Growth and Demand “Premiums”
Protect Market Position– Industrial power brushes– Polishing
Increase Penetration In– Specially formulated polishing
compounds
Expand Product Lines into Differentiated Niches– Diamond abrasive products– 3-Dimensional abrasives
PRODUCT LINE EXPANSIONORGANIC GROWTH
Second Growth Stage(2 – 5 years)
Initial Growth Stage(1 – 2 years)
Current
Com. Vehicles
Agriculture
Aerospace
Energy/ O&G
Power Generation
30%
15%
20
compounds
Build Adjacent Position– Related abrasive products– Oil pipeline pigging
Expand Footprint in Emerging Markets
Grow in Under Penetrated End-Markets– E.g., Low shedding staple set
brushes for health, pharmaceuticals, food & beverage industries
END-MARKET DIVERSIFICATION
INORGANIC GROWTH
Focus on:
• High Growth End-Markets
• Margin Expansion
Com. Vehicles
General Industrial
Mass Transit
Automotive
Consumer Goods
Construction
• Large portion of sales go through distribution channels
• Strong position in automotive
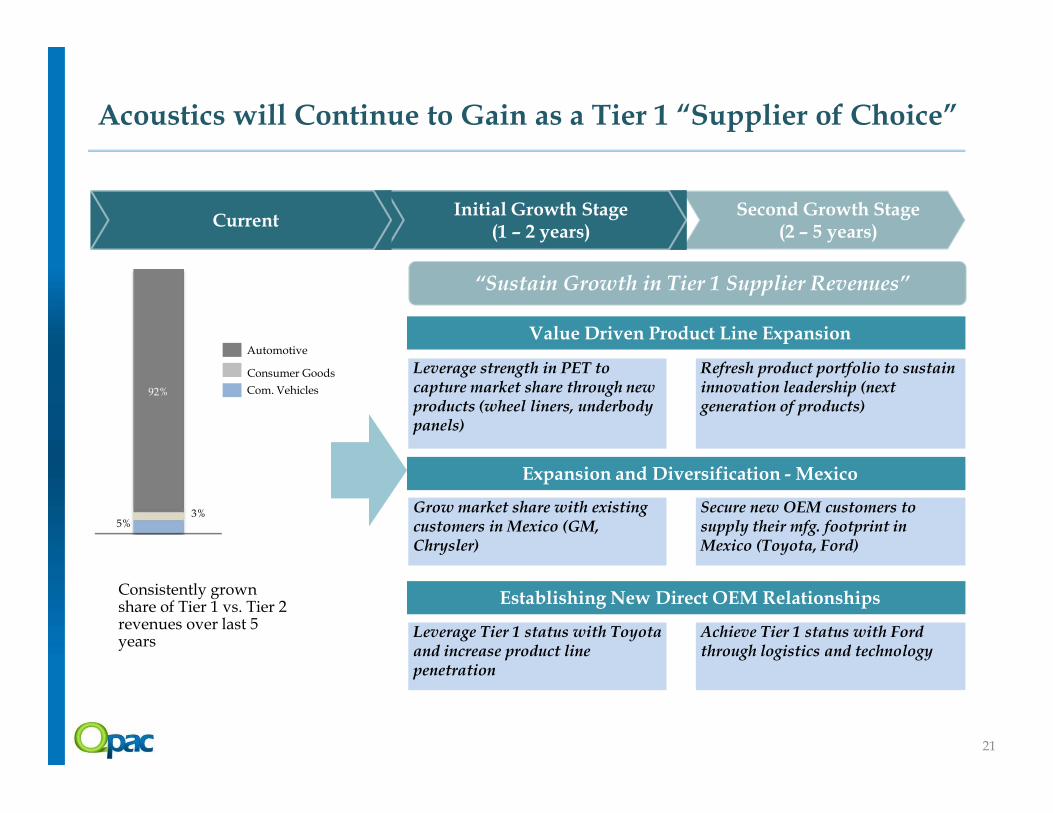
Acoustics will Continue to Gain as a Tier 1 “Supplier of Choice”
Leverage strength in PET to capture market share through new products (wheel liners, underbody
Value Driven Product Line Expansion
Refresh product portfolio to sustain innovation leadership (next generation of products)
“Sustain Growth in Tier 1 Supplier Revenues”
Second Growth Stage(2 – 5 years)
Initial Growth Stage(1 – 2 years)
Current
92% Com. Vehicles
Consumer Goods
Automotive
21
products (wheel liners, underbody panels)
Grow market share with existing customers in Mexico (GM, Chrysler)
Leverage Tier 1 status with Toyota and increase product line penetration
Expansion and Diversification - Mexico
Establishing New Direct OEM Relationships
generation of products)
Secure new OEM customers to supply their mfg. footprint in Mexico (Toyota, Ford)
Achieve Tier 1 status with Ford through logistics and technology
Consistently grown share of Tier 1 vs. Tier 2 revenues over last 5 years
5%3%
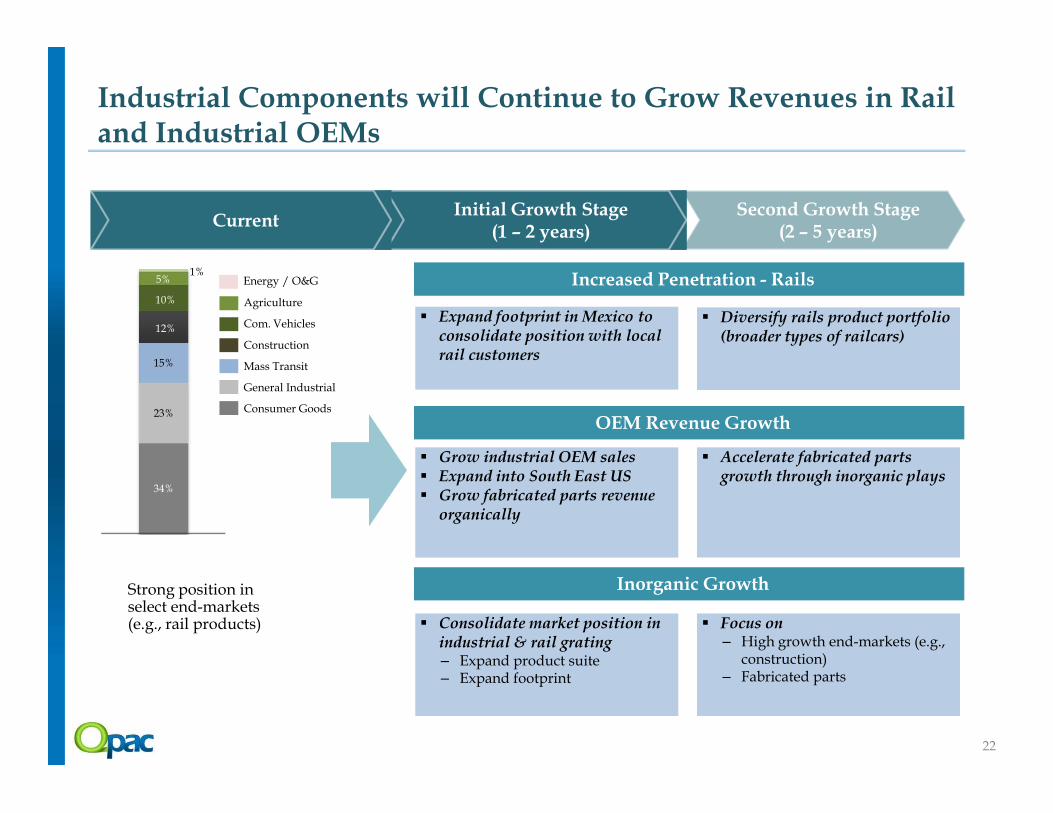
Industrial Components will Continue to Grow Revenues in Rail and Industrial OEMs
Increased Penetration - Rails
Second Growth Stage(2 – 5 years)
Initial Growth Stage(1 – 2 years)
Current
15%
12%
10%
5%1%
Construction
Mass Transit
Agriculture
Com. Vehicles
General Industrial
Consumer Goods
Energy / O&G
Expand footprint in Mexico to consolidate position with local rail customers
Diversify rails product portfolio (broader types of railcars)
22
OEM Revenue Growth
Inorganic GrowthStrong position in select end-markets (e.g., rail products)
34%
23% Consumer Goods
Grow industrial OEM sales Expand into South East US Grow fabricated parts revenue
organically
Accelerate fabricated parts growth through inorganic plays
Consolidate market position in industrial & rail grating– Expand product suite– Expand footprint
Focus on – High growth end-markets (e.g.,
construction)– Fabricated parts

Future M&A Activity to Drive Significant Shareholder Returns
• $250M-$500M of potential revenue
• Target businesses that
NEW PLATFORM
BOLT-ON
NEW PLATFORM
• $25M-$250M of potential
BOLT-ON
23
• Target businesses that will leverage Jason’s core competencies
• Focus on generating above market returns
of potential revenue
• Strengthen core businesses

A Renewed Focus on M&A
Since formation, Jason has acquired and integrated 38 businesses
Successfully integrating acquisitions has $100
$200
$300
$400
$500
$600
$700
Significant Growth Potential from M&A
Cumulative Revenue (1) # Number of Acquisitions
1 1 2
23 2
11 2 2
2 34 2 1 1 2
2 2 11
($ in millions)
After several years of internal focus, Jason is now poised to turn on the acquisition machine
acquisitions has been key to Jason’s Strategy
$0
$100
'86 '87 '88 '89 '90 '91 '92 '93 '94 '95 '96 '97 '98 '99 '00 '01 '02 '03 '04 '05 '06 '07 '08 '09 '10 '11 '12
45 Targets identified with over $1 Billion+ Revenue
1 1
24
Average Multiple Reduction of ~1.0x
5.5x
3.8x4.2x
3.5x3.8x
2.5x
3.7x
2.6x
0.0x
1.0x
2.0x
3.0x
4.0x
5.0x
6.0x
Morton Michigan Seat Lippert-Unipol Arcor
EBITDA Multiple at Acquisition
EBITDA Multiple Post Integration
Current Pipeline
Segment RationaleEstimated Revenue ($m)
SeatingMarket Expansion, Product Line Expansion
$50-$250
FinishingProduct Line Expansion, Synergistic
$85-$200
Components Market Expansion $35-$100
_____________________(1) Excludes organic growth of acquired businesses

Jason’s Growth to $1.0B+: Leveraging High-growth Markets
• Maintain strength in core markets
• Build resiliency through expansion into adjacent markets
• Expansion into emerging markets and new
Jason’s Path to $1.0B+ in Revenue
Jason 5-Year Revenue Build-up
$1,000+
Com. Vehicles
Power Generation
Agriculture
Energy/ O&G
Construction
Aerospace
($ in millions)
25
markets and new geographies
• Organic growth at ~5% CAGR across all business segments
• Seek acquisitions for the Seating and Finishing segments with a focus on shareholder returns
Jason Core Markets
Jason Key Growth Markets
InorganicOrganic2013
$681
2018
Automotive
Mass Transit
Marine
General Industrial
Consumer Goods
Construction
Motorcycle
• Summary
• Jason Overview
• Growth Opportunities• Growth Opportunities
• Financial Overview
Financial Snapshot
Revenue($ in millions)
Adjusted EBITDA($ in millions)
$601 $655 $681 $698
$741 $786
$823 $868
$58
$71 $80 $83
$92 $101
$108 $118
9.7%10.8% 11.7% 11.9% 12.4% 12.8% 13.1% 13.6%
27
2011 2012 2013 2014P 2015P 2016P 2017P 2018P
Actual Projected
2011 2012 2013 2014P 2015P 2016P 2017P 2018P
Actual Projected % Margin
Capex($ in millions)
$16 $18
$19
$23 $24 $25 $27
$29
2.7% 2.7% 2.8%3.3% 3.2% 3.2% 3.3% 3.3%
2011 2012 2013 2014P 2015P 2016P 2017P 2018P
Actual Projected % Margin

Appendix

Turf
Equipment38%Motorcycle
Aftermarket12%
Lifts
10%
Utility
Vehicles5%
Marine
3%
Seating Overview
Milsco brand maintains the #1 position in the global static seating market
Primary product segments include Heavyweight Motorcycles, Turf Care, Heavy Industry and Powersports
Next generation seating product development focus on turf care and industrial equipment seating products
Seating’s high quality products and superior design capabilities have positioned it as the #1 provider of seats across a majority of its target end-markets
Mexico
12%
Europe
5%
UnitedStates
83%
Overview
Addressable Market (1)
Revenue by Geography Revenue by End Product
$153 $165 $163 $165
15% 15%
14%
15%
12%
13%
13%
14%
14%
15%
15%
16%
16%
17%
$-
$50
$100
$150
$200
2010 2011 2012 2013
Revenue Adj. EBITDA Margin
Financial Overview
($ in millions)
Motorcycle
OEM18%
Constr. &
Ag.14%
83%
United States82%
_____________________(1) Management estimates
Representative Products and Applications
Addressable Market (1)
___________________________Note: Based on 2013 revenue
Market Size
North America $450M
Global $2.5B
29
Finishing Overview
Manufacturing, distribution and sales facilities in 14 countries
65% of revenue from consumables
#1 manufacturer of industrial and maintenance brushes, buffs and compounds in the world
More than 30,000 customers world-wide; only business supplying global marketplace
Finishing’s well-recognized brands maintain exceptional world-wide reputations for quality
Industrial Buffs and
Compounds25%
Other15%
Overview
Addressable Market (1)
Revenue by Geography Revenue by End Product
Europe50%
North America
38%
South America
5%
Mexico5%
Asia2%
$164
$191 $184 $180
6%
8%
10% 10%
0%
2%
4%
6%
8%
10%
12%
14%
$-
$50
$100
$150
$200
2010 2011 2012 2013
Revenue Adj.EBITDAMargin
Europe55%
Industrial Brushes
60%
_____________________(1) Management estimates
Representative Products and Applications
Addressable Market (1)
_____________________Note: Based on 2013 revenueMarket Size
North America $510M
Global $7B
Financial Overview
($ in millions)
30

Europe16%
NorthAmerica
84%
Acoustics Overview
Die Cut Insulation
25%
IP Panels10%
Carpet Systems
10%
Other9%
Engine3%
Wheel Liners
2%
Products are used in approximately 70% of light vehicles in North America today, including the majority of top platforms
Acoustic products also sold to a wide range of other vehicles, including sport utility vehicles and light trucks
Jason’s Acoustics segment product content per vehicle increased by 45% between 2010-2013
Growth opportunity in Asia and Latin America
Acoustics has developed extensive design and manufacturing expertise that allows it to provide custom acoustical solutions for each vehicle platform it serves
Overview
Addressable Market (1)
Revenue by Geography Revenue by End Product
$124$145
$172
$205
7%6%
7%
11%
0%
5%
10%
15%
$-
$50
$100
$150
$200
2010 2011 2012 2013
Revenue Adj.EBITDAMargin
_____________________Note: Based on 2013 revenue
Molded Insulation
24%Trunk
Systems17%
LuggageCompartment
Door Panels Dash InsulatorsInterior - Exterior
Under Bonnet / Hoodliners
Floor – CarpetUnderlayment
Hush Panels
Wheelhouse / Cowl
Package TraySubstrate
_____________________(1) Management estimates
Representative Products and Applications
Addressable Market (1)
Market Size
North America $1.9B
Global $10B
Financial Overview
($ in millions)
31
Components Overview
Leading manufacturer of individual engineered solutions and expanded / perforated metal components
#1 independent manufacturer of electric meter bases, rail safety products (anti-slip surface) and expanded metal products in North America
Product categories are united by a common culture of maintaining industry leading engineering capabilities
Jason Components has great long term customer partnerships due to its innovative design and manufacturing capabilities
Electric Meters
34%
Rail
Industrial13%
Small Engines
9%
Other6%
North America100%
Overview
Addressable Market (1)
Revenue by Geography Revenue by End Product
$116
$134 $136 $133
20% 19% 18% 17%
0%
5%
10%
15%
20%
25%
30%
35%
40%
$-
$20
$40
$60
$80
$100
$120
$140
2010 2011 2012 2013
Revenue Adj.EBITDAMargin
United States100%
Filtration25%
Rail13%
_________________________________________________________________________(1) Management estimatesNote: 2011 revenue and EBITDA margin is pro forma for acquisition of Morton Manufacturing
Representative Products and Applications
Addressable Market (1)
_____________________Note: Based on 2013 revenue
Market Size
North America $800M
Global $2B
Financial Overview
($ in millions)
32

Jason Adjusted EBITDA Reconciliation
2011 2012 2013($ in millions)
Net Income $9.3 $14.7 $24.1
Tax provision 4.1 4.8 18.2 Interest expense 17.0 18.6 20.7 Depreciation and amortization 20.2 24.2 27.0 Loss on disposals of fixed assets - net 0.1 0.5 -EBITDA 50.7 62.8 90.0
33
Adjustments:Impairment of long-lived assets 1.3 0.5 -Restructuring 0.7 1.6 4.0
Advisory, legal, professional fees and special bonuses 0.9 1.0 6.0 Newcomerstown net fire costs (income) and related items 3.0 (1.3) (18.8)Adjustment for non-discrete fire costs - 1.4 (1.4)Multiemployer pension plan withdrawal expense (gain) - 3.4 (0.7)Purchase accounting impact of inventory write-up 0.4 - -Gain on claim settlement - - (0.4)Sponsor fees 1.0 1.1 1.1
Total adjustments 7.3 7.7 (10.2)
Adjusted EBITDA $58.0 $70.5 $79.8
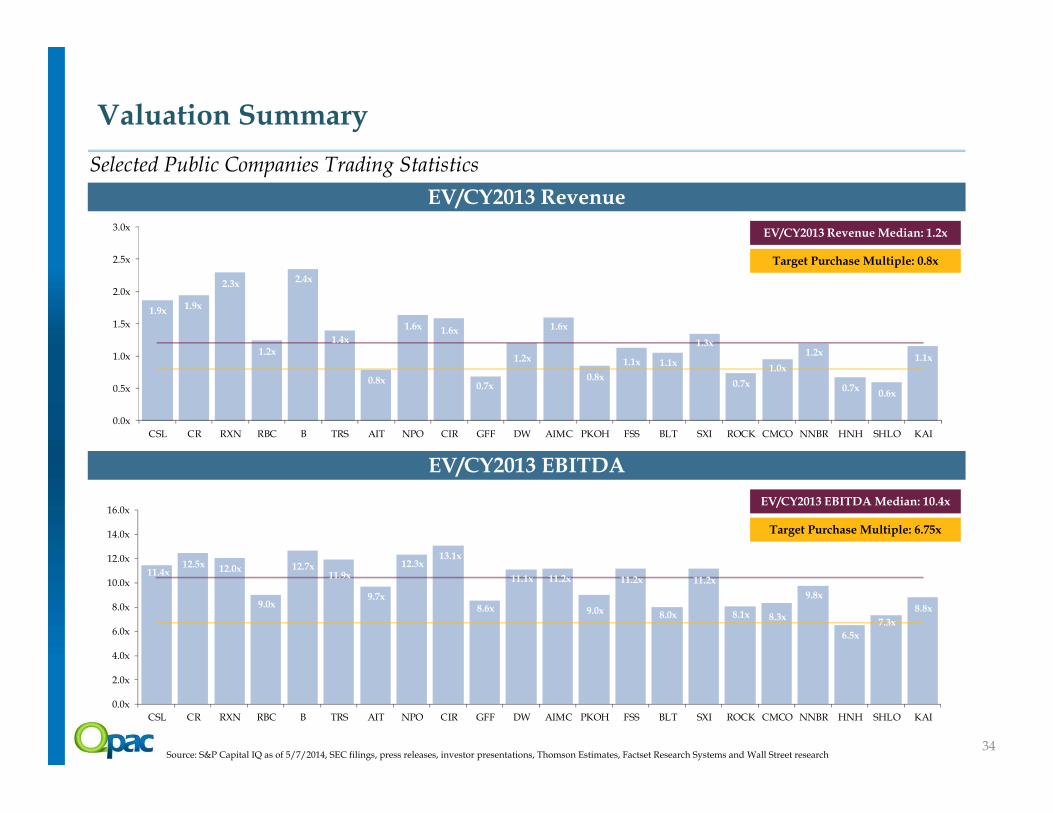
Valuation Summary
Selected Public Companies Trading Statistics
EV/CY2013 Revenue
EV/CY2013 Revenue Median: 1.2x
Target Purchase Multiple: 0.8x
1.9x1.9x
2.3x
1.2x
2.4x
1.4x
0.8x
1.6x 1.6x
0.7x
1.2x
1.6x
0.8x
1.1x 1.1x
1.3x
0.7x
1.0x
1.2x
0.7x0.6x
1.1x
0.5x
1.0x
1.5x
2.0x
2.5x
3.0x
34
EV/CY2013 EBITDA
EV/CY2013 EBITDA Median: 10.4x
Target Purchase Multiple: 6.75x
Source: S&P Capital IQ as of 5/7/2014, SEC filings, press releases, investor presentations, Thomson Estimates, Factset Research Systems and Wall Street research
0.0x
CSL CR RXN RBC B TRS AIT NPO CIR GFF DW AIMC PKOH FSS BLT SXI ROCK CMCO NNBR HNH SHLO KAI
11.4x12.5x 12.0x
9.0x
12.7x11.9x
9.7x
12.3x13.1x
8.6x
11.1x 11.2x
9.0x
11.2x
8.0x
11.2x
8.1x 8.3x
9.8x
6.5x
7.3x
8.8x
0.0x
2.0x
4.0x
6.0x
8.0x
10.0x
12.0x
14.0x
16.0x
CSL CR RXN RBC B TRS AIT NPO CIR GFF DW AIMC PKOH FSS BLT SXI ROCK CMCO NNBR HNH SHLO KAI

Valuation Summary
Selected Public Companies Trading Statistics (Detail) ($ in millions, except per share data)
Stock Price Market Value Valuation Multiples Growth Data
% Off Equity Enterprise EV / Rev EV / EBITDA P/E Growth PEG
5/7/14 LTM High Value Value (1) CY13 CY14 CY15 CY13 CY14 CY15 CY13 CY14 CY15 Rate CY14 CY15
Carlisle Companies $83.77 0% $5,503 $5,475 1.9x 1.7x 1.6x 11.4x 10.3x 9.3x 23.2x 20.5x 17.7x 12% 1.7x 1.5x
Crane Co. 73.25 0% 4,384 5,026 1.9x 1.7x 1.6x 12.5x 10.0x 9.1x 19.6x 15.6x 14.1x 10% 1.6x 1.5x
Rexnord Corporation 27.38 12% 2,931 4,717 2.3x 2.1x 2.0x 12.0x 10.5x 9.4x N.M. 16.9x 14.5x 22% 0.8x 0.7x
Regal Beloit Corporation 75.76 6% 3,448 3,856 1.2x 1.2x 1.1x 9.0x 8.5x 7.7x 28.7x 16.5x 14.3x 11% 1.5x 1.3x
Barnes Group 37.64 8% 2,066 2,566 2.4x 2.0x 2.1x 12.7x 9.6x 8.8x 28.7x 16.6x 14.9x 10% 1.7x 1.5x
TriMas Corporation 34.72 18% 1,579 1,946 1.4x 1.3x 1.2x 11.9x 8.9x 7.9x 19.2x 15.5x 13.3x 14% 1.1x 0.9x
Applied Industrial Technologies 46.43 13% 1,959 1,919 0.8x 0.7x 0.7x 9.7x 8.5x 7.5x 17.3x 16.1x 13.4x 12% 1.3x 1.1x
EnPro Industries 67.81 15% 1,489 1,875 1.6x 1.6x 1.5x 12.3x 11.7x 10.3x N.M. 43.4x 27.7x 16% 2.8x 1.8x
CIRCOR International 80.43 4% 1,431 1,365 1.6x 1.5x 1.4x 13.1x 11.9x 10.3x 30.1x 21.1x 18.0x 21% 1.0x 0.9x
Griffon Corporation 11.18 22% 571 1,288 0.7x 0.7x N.A. 8.6x 8.0x N.A. N.M. 29.4x N.A. 11% 2.7x N.A.
35Source: S&P Capital IQ as of 5/7/2014, SEC filings, press releases, investor presentations, Thomson Estimates, Factset Research Systems and Wall Street research.(1) Enterprise value = market cap + net debt (including minority interest) + redeemable convertible preferred
Drew Industries Incorporated 50.34 9% 1,214 1,218 1.2x 1.1x 1.0x 11.1x 9.3x 8.1x 23.9x 18.2x 14.7x 17% 1.1x 0.9x
Altra Holdings 35.06 11% 949 1,155 1.6x 1.4x 1.3x 11.2x 9.2x 8.2x 23.4x 17.8x 14.9x 19% 0.9x 0.8x
Park-Ohio Holdings 54.56 11% 684 1,016 0.8x 0.7x 0.7x 9.0x 7.5x 6.9x 16.5x 11.9x 10.5x 13% 0.9x 0.8x
Federal Signal Corp 13.90 13% 885 957 1.1x 1.1x 1.0x 11.2x 9.9x 8.8x 5.5x 16.7x 14.1x 15% 1.1x 0.9x
Blount International 11.15 24% 552 950 1.1x 1.0x 1.0x 8.0x 6.9x 6.4x N.M. 13.6x 11.5x 13% 1.0x 0.9x
Standex International Corporation 74.88 0% 957 945 1.3x 1.3x 1.2x 11.2x 10.1x N.A. 22.1x 17.7x 15.6x 15% 1.2x 1.0x
Gibraltar Industries 15.25 21% 470 606 0.7x 0.7x 0.7x 8.1x N.A. N.A. N.M. 18.6x 15.4x 8% 2.3x 1.9x
Columbus McKinnon Corporation 25.87 9% 512 540 1.0x 0.9x 0.8x 8.3x 7.0x 6.1x 7.1x 14.4x 12.0x 14% 1.0x 0.8x
NN Inc. 21.84 1% 401 447 1.2x 1.1x 1.0x 9.8x 8.6x 7.5x 21.8x 16.1x 13.5x 16% 1.0x 0.9x
Handy & Harman 20.98 17% 275 442 0.7x N.A. N.A. 6.5x N.A. N.A. 9.9x N.A. N.A. N.A. N.A. N.A.
Shiloh Industries 18.87 26% 325 442 0.6x 0.5x N.A. 7.3x 6.1x N.A. 13.4x 11.5x N.A. 19% 0.6x N.A.
Kadant Inc. 36.09 14% 409 395 1.1x 1.0x 0.9x 8.8x 6.9x 6.6x 17.4x 12.7x 11.8x 20% 0.6x 0.6x
3rd Quartile 1.6x 1.6x 1.5x 11.9x 10.1x 9.2x 23.6x 18.4x 15.4x 18% 1.6x 1.5x
Mean 1.3x 1.2x 1.2x 10.2x 9.0x 8.2x 19.3x 18.1x 14.8x 15% 1.3x 1.1x
Median 1.2x 1.1x 1.1x 10.4x 9.1x 8.1x 19.6x 16.6x 14.3x 14% 1.1x 0.9x
1st Quartile 0.8x 0.8x 0.9x 8.5x 7.6x 7.2x 15.0x 15.0x 13.3x 12% 1.0x 0.8x

Valuation Summary
Selected Public Companies Operating Statistics (Detail) ($ in millions, except per share data)
Revenue Revenue Growth Margin Analysis
Gross Margin EBITDA Net Income
CY13 CY14 CY15 CY13 CY14 CY15 CY13 CY14 CY15 CY13 CY14 CY15 CY13 CY14 CY15
Regal Beloit Corporation $3,096 $3,260 $3,406 (2%) 5% 5% 25% 25% 26% 14% 14% 15% 4% 6% 7%
Carlisle Companies 2,943 3,158 3,391 3% 7% 7% 25% 26% 27% 16% 17% 17% 7% 8% 9%
Crane Co. 2,595 3,039 3,213 1% 17% 6% 34% 34% 34% 16% 16% 17% 8% 9% 9%
Applied Industrial Technologies 2,449 2,578 2,768 1% 5% 7% 28% N.A. N.A. 8% 9% 9% 5% 5% 5%
Rexnord Corporation 2,053 2,210 2,372 2% 8% 7% 37% 37% 37% 19% 20% 21% 1% 8% 8%
Griffon Corporation 1,901 1,949 N.A. 4% 3% N.A. 22% 23% N.A. 8% 8% N.A. 0% 1% N.A.
TriMas Corporation 1,395 1,497 1,592 10% 7% 6% 26% 28% 28% 12% 15% 16% 5% 7% 7%
Park-Ohio Holdings 1,203 1,368 1,445 7% 14% 6% 18% 18% 18% 9% 10% 10% 4% 4% 5%
EnPro Industries 1,144 1,188 1,236 (3%) 4% 4% 33% 34% 34% 13% 14% 15% 2% 4% 5%
Barnes Group 1,092 1,263 1,219 18% 16% (3%) 32% 34% 35% 19% 21% 24% 25% 10% 12%
36Source: S&P Capital IQ as of 5/7/2014, SEC filings, press releases, investor presentations, Thomson Estimates, Factset Research Systems and Wall Street research.
Drew Industries Incorporated 1,016 1,139 1,251 13% 12% 10% 21% 21% 22% 11% 12% 12% 5% 6% 6%
Blount International 901 939 979 (3%) 4% 4% 27% 29% 29% 13% 15% 15% 1% 4% 5%
CIRCOR International 858 892 941 1% 4% 6% 31% 32% 32% 12% 13% 14% 5% 8% 8%
Federal Signal Corp 851 905 951 6% 6% 5% 24% 24% 25% 10% 11% 11% 19% 6% 6%
Gibraltar Industries 828 865 908 5% 5% 5% 19% N.A. N.A. 9% N.A. N.A. (1%) 3% 3%
Shiloh Industries 738 850 N.A. 23% 15% N.A. 11% 11% N.A. 8% 8% N.A. 3% 3% N.A.
Altra Holdings 722 828 867 (1%) 15% 5% 30% 31% 31% 14% 15% 16% 6% 6% 8%
Standex International Corporation 705 748 818 5% 6% 9% 33% 33% 33% 12% 13% N.A. 6% 7% N.A.
Handy & Harman 655 N.A. N.A. 13% N.A. N.A. 28% N.A. N.A. 10% N.A. N.A. 6% N.A. N.A.
Columbus McKinnon Corporation 567 595 638 (7%) 5% 7% 31% 32% N.A. 11% 13% 14% 13% 6% 7%
NN Inc. 373 411 441 1% 10% 8% 21% 19% N.A. 12% 13% 13% 5% 6% N.A.
Kadant Inc. 344 415 448 4% 20% 8% 46% 45% 45% 13% 14% 13% 7% 7% 7%
3rd Quartile 7% 14% 7% 32% 34% 34% 14% 15% 17% 7% 7% 8%
Mean 4% 9% 6% 27% 27% 28% 12% 13% 15% 6% 6% 7%
Median 3% 7% 6% 28% 28% 29% 12% 13% 15% 5% 6% 7%
1st Quartile 0% 5% 5% 22% 23% 26% 10% 11% 13% 3% 4% 5%
Jason Incorporated $681 $698 $741 4% 2% 6% 22% 24% 24% 12% 12% 12% 1% 2% 3%
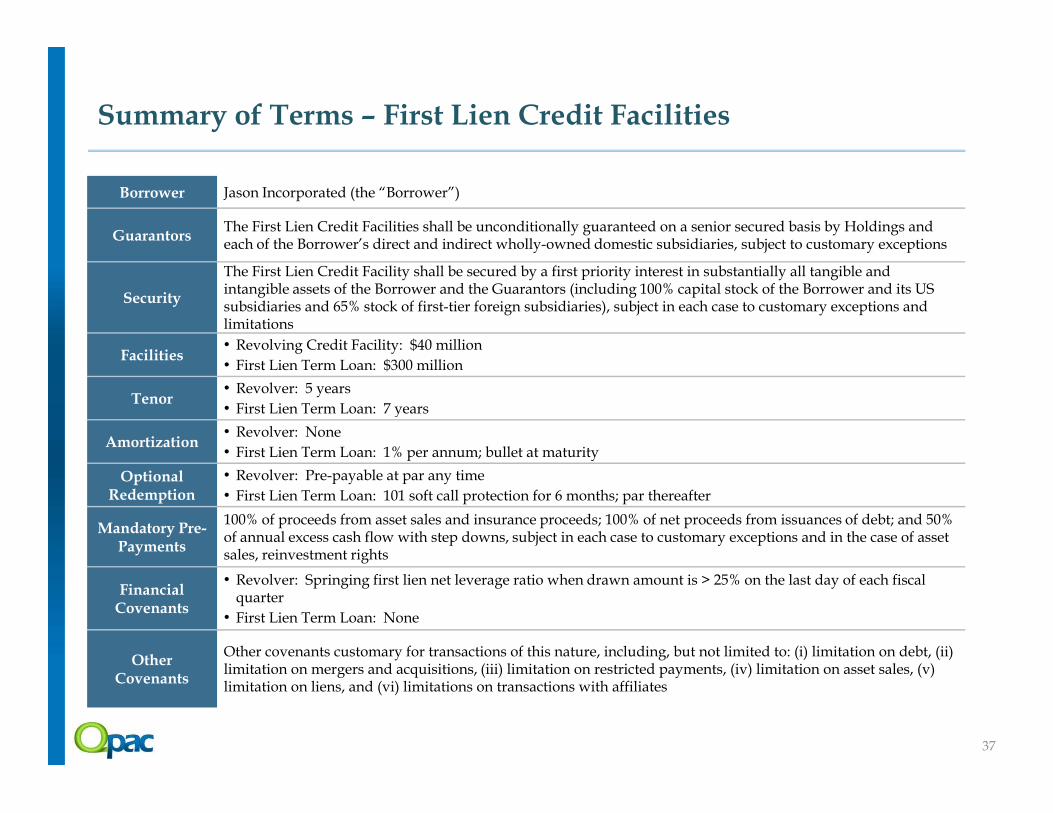
Summary of Terms – First Lien Credit Facilities
Borrower Jason Incorporated (the “Borrower”)
GuarantorsThe First Lien Credit Facilities shall be unconditionally guaranteed on a senior secured basis by Holdings and each of the Borrower’s direct and indirect wholly-owned domestic subsidiaries, subject to customary exceptions
Security
The First Lien Credit Facility shall be secured by a first priority interest in substantially all tangible and intangible assets of the Borrower and the Guarantors (including 100% capital stock of the Borrower and its US subsidiaries and 65% stock of first-tier foreign subsidiaries), subject in each case to customary exceptions and limitations
Facilities• Revolving Credit Facility: $40 million
• First Lien Term Loan: $300 million
Tenor• Revolver: 5 years
• First Lien Term Loan: 7 years
37
Tenor• First Lien Term Loan: 7 years
Amortization• Revolver: None
• First Lien Term Loan: 1% per annum; bullet at maturity
Optional Redemption
• Revolver: Pre-payable at par any time
• First Lien Term Loan: 101 soft call protection for 6 months; par thereafter
Mandatory Pre-Payments
100% of proceeds from asset sales and insurance proceeds; 100% of net proceeds from issuances of debt; and 50% of annual excess cash flow with step downs, subject in each case to customary exceptions and in the case of asset sales, reinvestment rights
Financial Covenants
• Revolver: Springing first lien net leverage ratio when drawn amount is > 25% on the last day of each fiscal quarter
• First Lien Term Loan: None
Other Covenants
Other covenants customary for transactions of this nature, including, but not limited to: (i) limitation on debt, (ii) limitation on mergers and acquisitions, (iii) limitation on restricted payments, (iv) limitation on asset sales, (v) limitation on liens, and (vi) limitations on transactions with affiliates

Summary of Terms – Second Lien Term Loan
Borrower Jason Incorporated (the “Borrower”)
GuarantorsThe Second Lien Term Loan shall be unconditionally guaranteed on a senior secured basis by Holdings and each of the Borrower’s direct and indirect wholly-owned domestic subsidiaries, subject to customary exceptions
Security
The Second Lien Term Loan shall be secured by a second priority interest in substantially all tangible and intangible assets of the Borrower and the Guarantors (including 100% capital stock of the Borrower and its US subsidiaries and 65% stock of first-tier foreign subsidiaries), subject in each case to customary exceptions and limitations
Facility $120 million Second Lien Term Loan
Tenor 8 years
38
Tenor 8 years
Amortization None
Call Protection 102 in year 1, 101 in year 2, par thereafter
Mandatory Pre-Payments
Same as First Lien Term Loan but required only after First Lien Term Loan has been repaid in full, subject to a customary exception for “declined proceeds”
Financial Covenants
None
Other Covenants
Substantially similar to the First Lien Credit Facilities set at a 25% cushion
Seating Consolidated 2 Jackson, MI facilities into 1
Consolidated Milwaukee, WI production into Redgranite, WI facility
Acoustics Divested Colne, UK facility
Plant 70 (Norwalk, OH) production moved to Plant 60 (Norwalk, OH)
Consolidated Conover, NC facility into
$10
$7
$9 $26
$10
$15
$20
$25
$30
Strategic Initiatives Positioned for Growth
Facilities Rationalization and Low Cost Manufacturing
Cost Take-Out
Finishing
Consolidated Conover, NC facility into Richmond, IN facility
Epfenbach, Germany warehouse operations and certain production moved to Burgwald, Germany, Portugal and Romania
Reduced Sweden facility to a workshop
Closed Denmark facility
Downsized Spain facility
Santa Fe Springs, CA production moved toHamilton, OH
Sold its interest in the China JV, but will continue to be supplied with product through terms of a 3-year supply agreement
Components Consolidated Addison, IL facility with
Buffalo Grove, IL facility and exited wire forms business
1. Footprint Rationalization
Closed 9 plants on time and on budget
All plant closures were overhead only, kept capacity
2. SG&A Savings
Reduced headcount by 83 employees
3. Manufacturing / Productivity Improvements
Implemented flexing
– Direct: 100%
– Indirect: 70%
– Fixed: 50%
$0
$5
1 2 3 Total
39_____________________Note: Time period of approximately one year

Representative Finishing End Markets Representative Seating End Markets
0
2
4
6
8
10
12
20
02
20
03
20
04
20
05
20
06
20
07
20
08
20
09
20
10
20
11
20
12
20
13
E
20
14
E
20
15
EPow
er, l
awn
an
d g
ard
en r
even
ue
(US
D b
illi
ons)
CAGR: 4.0%
$0
$2,000
$4,000
$6,000
$8,000
2004
2005
2006
2007
2008
2009
2010
2011
2012
2013E
2014E
2015E
2016E
2017E
2018E
Buffing&abrasives
Revenue(USDmm)
CAGR:2.7%
0
50
100
150
200
250
300
350
400
0
1,000
2,000
3,000
4,000
5,000
6,000
7,000
20
05
20
06
20
07
20
08
20
09
20
10
20
11
20
12
20
13
20
14
E
20
15
E
Sh
ipm
ents ('0
00
s)
Rev
enu
e (U
SD
mm
)Motorcycle revenue Shipments
CAGR: 10.6%
Favorable End Market Dynamics
Representative Components End MarketsRepresentative Acoustics End Markets
0
10
20
30
40
50
60
U.S
. pow
er d
istr
ibu
tion
mar
ket
(US
D b
illi
ons)
CAGR: 5.3%
0
20,000
40,000
60,000
80,000
2012 2013 2014 2015 2016 2017
Fre
igh
t ca
r p
rod
uct
ion
(u
nit
s)
CAGR: 3.2%
0
50,000
100,000
150,000
Lig
ht
veh
icle
sal
es (
'00
0s)
North America Latin America Asia - Pacific
Western Europe Eastern Europe RoW
CAGR: 5.2%
2013E
2014E
2015E
2016E
2017E
2018E
Source: IBISWorld Source: Wall Street Research Source: Freedonia
Source: LMC Automotive Source: Frost & Sullivan Source: RETAC
Motorcycle revenue Shipments
40

Jason’s Acoustics business unit was awarded a significant North American car platform
From the date of the initial award in 1Q13 to today, Jason has successfully improved margins through a series of Value Engineering (VE) and manufacturing process improvements
Further margin expansion proposals are in review and are expected to increase profit by another $2.0 /
Margin Expansion Through Improved Value Proposition
Company-wide initiative over the last 3 years to educate sales force and business segment leaders of the value Jason brings to the marketplace with its premium products and brands
Changed pricing, customer perception and revenue goals which has had a significant impact on gross margins
‒ Acoustic gross margins have benefitted
Case Study – Acoustics Margin ExpansionOverview
Pricing strategy recently implemented to maximize revenue and profit across a diverse customer base
and are expected to increase profit by another $2.0 / car set
‒ Acoustic gross margins have benefitted substantially
Acoustic Gross Margin Enhancement
$2.5
$14.9
$19.9
$23.7
$36.5
0.0%
5.0%
10.0%
15.0%
20.0%
$0
$10
$20
$30
$40
'09 '10 '11 '12 '13
Gro
ss Ma
rginG
ross
Pro
fit
Gross Profit Gross Margin
Case Study Result – Improved C1 Profit / Car Set
$49.3$50.4
$0.9
$1.1 ($0.9)
C1 Profit
Q1-13
Truck
Trim
Inner
Dash
Acoustic
Parts
C1 Profit
Current
($ in millions) ($ in millions)
41


