+ All Categories
Home > Documents > ,QWHUQDWLRQDO 5HYLVLRQ GDWH (3' EDVHG LQ 3&5 ... - asbp…

,QWHUQDWLRQDO 5HYLVLRQ GDWH (3' EDVHG LQ 3&5 ... - asbp…

Date post: 23-Dec-2021
Category:
Upload: others
View: 3 times
Download: 0 times
Share this document with a friend
33
Registration number EPD ® : S-P-01050 Release date: 2017/06/21 Valid date: 2022/05/31 EPD® Validity: International Revision date: 2017/12/01 EPD® based in PCR 2012:01 Code UN CPC 3511 Construction products and construction services v 2.2
Transcript

Registration number EPD®: S-P-01050 Release date: 2017/06/21 Valid date: 2022/05/31 EPD® Validity: International Revision date: 2017/12/01 EPD® based in PCR 2012:01 Code UN CPC 3511 Construction products and construction services v 2.2

2

Index

ENVIRONMENTAL PRODUCT DECLARATION ............................................................................. 3

ECOSPHERE PREMIUM .............................................................................................................. 3

1. Programme related information........................................................................................... 3

2. Product related information ................................................................................................. 3

3. Environmental performance-related information ............................................................. 144

4. Results interpretation ...................................................................................................... 199

5. Differences versus previous versions of the EPD® ....................................................... 2020

6. Verification .................................................................................................................... 2020

7. References ................................................................................................................... 2121

ANNEX I. Environmental performance of other Graphenstone’s coating ........................... 222

A1. Stuki Premium ............................................................................................................. 222

A2. Kratzputz Premium ...................................................................................................... 266

A3. Füllmasse Premium ...................................................................................................... 30

3

ENVIRONMENTAL PRODUCT DECLARATION

ECOSPHERE PREMIUM

1. Programme related information

Name of the programme and Operator’s programme name

The international EPD® System, operated by EPD® International AB

Reference PCR document PCR based on ISO 14025:2010 and EN 15804. Construction products and construction services. 2012:01. version 2.01

EPD® register number S-P-01050

Publication date 2017/06/21

Revision date 2017/12/01

EPD® valid until 5 years (2022/05/31)

Geographical scope of EPD® International

For more information www.environdec.com

2. Product related information

2.1. Specification of manufacturing company

2.1.1. Company related information

Company responsible of EPD® publication

INDUSTRIA ESPAÑOLA PARA EL DESARROLLO E INVESTIGACIÓN 2100, S.A. (IEdiSA) Polígono industrial Poliviso. c/ Carpinteros, 25 41520 El Viso del Alcor, Sevilla - SPAIN

Contact Laura García +34 955 292 068 [email protected] www.graphenstone.com

2.1.2. Company description

IEdiSA is a company located in El Viso del Alcor (Sevilla). It is the world's leading manufacturer

of eco-friendly products such as paints, coatings, mortars, adhesives and insulation with graphene

technology under brand Graphenstone®. Its formulations improve in properties exponentially,

mainly in the saving of the material consumption, since it is worked at nanoscales, achieving

hardness, resistance and elasticity superior to any common coating.

4

2.1.3. Environmental management systems information

IEdiSA, as a result of its constant concern for the continuous environmental improvement, has the

next certifications: ISO 9001 Quality management systems from 2013 (register nº: ES-0610/2013),

ISO 14001 Environmental systems management from 2014 (register nº: ES-2013/0248), ISO

50001 Energy management systems (register nº: GE-2014/0040) and Cradle to Gate GOLD

certification received in 2016 (certification nº: 2788).

2.1.4. Environmental policy of the Company

IEdiSA believes that personal and business honesty is a core value of its internal relationships,

with its suppliers, its customers, and the environment, so it is committed to complying with the

laws, regulations and normative that competes both for quality and environment and with other

internal commitments subscribed by the company itself.

IEdiSA manufactures products respecting the declared specifications and minimizing the

environmental impacts associated to their activities, reducing waste, reusing water as a raw

material, and manufacturing lime through an artisanal system, among other measures.

IEdiSA particularly considers suppliers and subcontractors to achieve Quality and Environment

objectives, encouraging them to develop best environmental practice by creating a mutually

cooperative relationship.

IEdiSA is committed to the continuous improvement of the productivity of its facilities through the

rational use of natural resources and energy, reducing, whenever possible, waste generated in all

operations and facilitating their recycling.

IEdiSA consumes in its installations electricity 100% renewable certified.

2.1.5. Comany’s logotype

IEdiSA is defined under two logos, the own one of the company and a second that represents the

range of products Graphenstone®.

5

2.2. Product specification

2.2.1. CPC code

UN CPC 3511

2.2.2. Trade name

The current EPD® represents Graphenstone® Ecosphere Premium product and it is also

representative for the following products1: Biosphere Premium, AmbientPro+ Premium/Comex

Pro Aire, Filler F10 Premium, Filler F20 Premium, GCS Interior Premium and GCS Exterior

Premium. In Annex I the results of the next products are presented: Stuki Premium, Kratzputz

Premium and Füllmasse Premium.

1 Products with a variation in their impacts lower than 10% compared with Ecosphere Premium

6

2.2.3. Product and productive process description

Graphenstone® Ecosphere Premium is a natural interior paint, it contains graphene and is

available in a white matte or eggshell finish. It is characterized by its high resistance and flexibility,

being a mineral paint and free of emissions of volatile organic compounds (VOCs). Creates

healthier spaces inside your home, guaranteeing the breathability and health of the building.

The production process for obtaining these products is a "batch" process and consists of a tank

where the mixture is made, a pump and two mechanical filters, these parts are common for all the

mentioned products. In addition, for colour paints a dosing machine is used for adding pigments.

Finally, the products go to the packaging area. All described parts of the production process are

illustrated in Figure 1.

Figure 1. Manufacturing process.

2.2.4. Content declaration

Filter I Filter II

Packaging conveyor belt

Pump

P-1 P-2 P-3

Mixing tank

P-5

P-6

Lime and otheradditives

Water

Doising pump

P-7

7

During the life cycle of the product, hazardous substances listed in "Candidate List of Substances

of Very High Concern (SVHC) for authorization” is not used in excess of 0.1% of the product

weight.

The verifier and the operator of the program do not make any affirmation nor present any legality

about the product.

The product has the next composition:

Raw material Percentage

Calcium hydroxide [40-70] %

Water [10-30] %

Calcium carbonate [5-20] %

Additives [1-5] % Table 1. Raw material.

2.2.5. Data quality and assignment of loads

Specific data have been taken on the quantities of materials and energy used during the product

life cycle. These data have been supplied by IEdiSA for the year 2015 and come from factory

direct data. The results presented in this document are valid for the EPD® until there are no

substantial modifications that affect the impact produced. Substantial modifications are

considered to be the increase of more than 10% in environmental impact per functional unit.

Generic data have been taken for the impact per unit of matter or energy. These data have been

obtained from the Life Cycle Assessment database Ecoinvent version 3.2, of recognized

international prestige. This database has been selected as a reference database due to its

coincidence with the flows of matter and energy on the following aspects:

Geographic representativeness: the data come from areas with the same legislative

framework and electric mix (see 2.4 for details of electric mix)

Technological equivalence: the data derive from the same physical and chemical

processes, or at least the same technological coverage.

Limits to nature: the data contains all the quantitative information needed for EPD®

Limits towards technical systems: the stages considered in the life cycle are equivalent.

8

2.3. Declared unit

Extraction of raw materials, transportation, manufacturing, transport to the customer, installation, use,

transportation to the distributor and end of life of the quantity of product needed to cover 1 m2 of

surface. This amount corresponds to 0.186 kg of paint, with two layers. The Reference Service Life

of the paint once applied on the wall is 10 years.

2.4. Differences versus previous versions of the EPD®

The CO2 fixation due to carbonatation of Calcium hydroxide during the use phase has been

introduced. Also, in the LCA model an Ecoinvent process better representing the use of additives has

been chosen.

2.5. Methodology and hypothesis

Life Cycle Analysis study of the product has been conducted, including all stages of the life cycle

(from cradle to gate with options). This EPD® has been performed following the indications marked

by the Product Category Rules (PCR): Construction products and construction services. 2012:01,

version 2.2. The impact method CML 4.1, EDIP 2003 (for the calculation of waste production) and

USEtox 1.4 (for human toxicity and ecotoxicity) has been used. In reference to the assignment of

charges, the polluter pays principle has been followed. At the same time, in those processes where it

has been necessary to make an allocation of charges has followed a criterion mass.

Specific data (also called site-specific data) have been used for all raw material and auxiliary material

usage data, energy consumption, waste production and emissions to air, water and soil (non-existent).

These data correspond to the year 2015. The impact of the additives has not been taken into account

because data is not available on Ecoinvent database and its use represents less than 5% of the

materials used.

The electricity consumed is 100% renewable certified. In order to represent the electricity production

mix it has been used the Swiss consumption mix of certified renewable energy, adapting it to the type

of renewable energy produced in Spain, respecting the type of renewable energy used in Spain and

its percentages of use (12% hydraulics and 18% wind), data collected by Red Eléctrica Española2

(see Figure 2). The consumption of 1 MJ of electricity represents the emission of 9 g of CO2-eq.

2 The Spanish electricity system 2015.

9

To determine the emissions per kg of material, energy KWh or transported Tnkm, the Ecoinvent v

database was used. 3.2, database of Life Cycle Analysis of internationally recognized prestige.

Distance of transport of the waste from the factory to the manager, and from the site to the manager:

50 km.

Figure 2. Electricity production mix consumed in the factory.

2.6. Process description and system boundaries

The presented EPD® is structured by the stages of the life cycle established according to the reference

standard PCR: Construction products and construction services, based on EN 15804 standard. This

EPD® is a cradle to gate with options EPD®.

SYSTEM BOUNDARIES

Figure 3. System boundaries and description of main processes.

Wind60%

Hydraulics40%

10

2.6.1. Product stage A1-A3

The product stage is composed by the stages of supply of raw materials (A1), transport of raw

materials (A2) and manufacturing (A3). As allowed by UNE-EN 15804, the results of steps A1-A3

have been grouped into a single product step (A).

A1- RAW MATERIAL SUPPLY

This module takes into account the extraction and processing of the raw materials and energy

that is produced prior to the manufacturing process under study.

As we can observe in figure 4 Calcium hydroxide production generates CO2 in the step where

CaCO3 becomes Calcium oxide. The same released emitted to the atmosphere by decarbonation

is then fixed when Calcium hydroxide is formed during the use phase of the product. As a

consequence, the only CO2 released during the process has its origin in the production of

electricity and heat (low CO2 emissions due to the use of biomass).

Figure 4 Cycle of Calcium carbonate-Calcium oxide-Calcium hydroxide.

A2- TRANSPORTATION OF RAW MATERIALS

This module includes the transportation of the different raw materials from the manufacturer to the

factory. Same kind of lorry has been used for all raw materials transportation but with the specific

transport distance for each raw material.

A3-MANUFACTURING

11

This module includes the consumption of energy, additives and packaging materials used during

the manufacturing process. At the same time, it analyses the non-originated emissions from the

combustion of fossil fuels (nonexistent) as well as the transportation and management of factory-

originated waste.

2.6.2. Construction Process Stage A4-A5

The Construction Process stage comprises the A4 Transport modules and A5 Construction-

Installation Process.

A4-TRANSPORT

The A4 Transport module includes the transport of the finished product from the factory door to

the distributor site. The main parameters that affect the result of this stage are described below.

Type

Parameter Unit (expressed by functional unit)

Lorry Type and fuel consumption of vehicle, type of vehicles used for transport

>32 Ton lorry. Gasoil consumption 31,1 L/100 Km

Distance 1000 km lorry 9.000 km freight ship

Capacity utilization (including returning empty) % assumed in Ecoinvent

Packaging 8,3 g (polypropylene + steel) 1,37 ± 0,05 g/cm3

Table 2. Transport specifications.

A5- CONSTRUCTION – INSTALLATION PROCESS

Module A5 Construction and installation process includes all materials and energy used for

installation. At the same time, the transport and management of the waste produced is taken into

account. The most common scenario for the analysed product is the application by brush or roller,

so that, it does not require construction or installation prior to use.

12

Parameter Value/Description

Auxiliary materials for installation None

Water use 28 ml

Other resources use No other resource use

Quantitative description of energy type (regional mix) and consumption during the installation process

No energy consumption

Direct emissions to ambient air, soil and water None

Waste of materials at place, before the processing of waste, generated during the installation of the product

(specified by type)

Product waste/losses: 2%

Output flow of materials (specified by type) resulting from the processing of waste at the site, i.e. during collection

for recycling, recovery (recovery) or discharge (specifying the route)

The waste from the packaging of the product is 100% collected and transformed into recovered material.

Table 3. Parameters, value and description.

2.6.3. Use Stage B1-B7

B1-USE

It includes environmental aspects and impacts in the normal use of the product, not including

water and energy consumption. The impact of the product at this stage is negative since no

material is consumed or there is no emission to environment during its lifetime. In addition, as

indicated in section A1, the products fixes CO2 due to the own Calcium oxide cycle. It is not

required neither adding solvents nor curing the product for its use.

B2-MAINTENANCE

The product does not require any type of maintenance during the 10 years of life of the product.

B3- REPAIR

The product does not require any type of repair during the 10 years of life of the product.

B4-REPLACEMENT

The product does not require any replacement during the 10 years of the product's life.

B5- REHABILITATION

The product does not require any rehabilitation during the 10 year life of the product.

B6- OPERATIONAL ENERGY USE

13

The product does not require any energy consumption during the 10-year product life.

B7- OPERATIONAL WATER USE

The product does not require any water consumption during the 10-year product life.

2.6.4. End-of-life Stage C1-C4

This stage includes the transportation and management of waste produced after the study

reference time has elapsed. The end-of-life stage is composed by modules C1 Deconstruction,

C2 Transport, C3 Waste treatment and C4 Waste disposal. Landfill has been assumed as end of

life scenario. The impact of building demolition has been considered negligible compared to other

impacts of a building's life cycle.

Product Graphenstone® Ecosphere Premium

Collection process specified by type 0,186 kg (mixed with the rest of building waste)

Recovery system specified by type No reuse, recycling or energy recovery

Disposal specified by type 0,186 kg to landfill

Assumptions for the development of the scenario (e.g. transportation)

Truck with trailer with an average load of 16-32 Tn and diesel consumption of 25 litres per 100 km 50 km of average distance to the landfill

Table 4. Specifications for End-of-life stage.

2.6.5. Supplementary information

BENEFITS AND LOADS BEYOND THE SYSTEM BOUNDARY:

The potential benefits of the recycling of factory waste and the recycling of the product after the

end of its useful life have not been taken into account.

Based on the system boundaries indicated in the reference standard PCR Construction products

and construction services the following processes have not been taken into account:

Manufacturing of the production of capital goods with an expected lifetime of over three

years, buildings and other capital goods.

The maintenance activities of the production plant.

Transport carried out by workers on the home-factory-home journey.

14

2.7. Comparations between EPD within this product category

“EPD of construction products may not be comparable if they do not comply with EN 15804”

“Environmental product declarations within the same product category from different programs may

not be comparable”

2.8. EPD® validity

The EPD® presented here is valid for five years from the date of its publication. In case of changes

that lead to a deterioration in any of the environmental impact indicators of the product life cycle of

more than 10% over the current declaration, the EPD® must be updated.

3. Environmental performance-related information

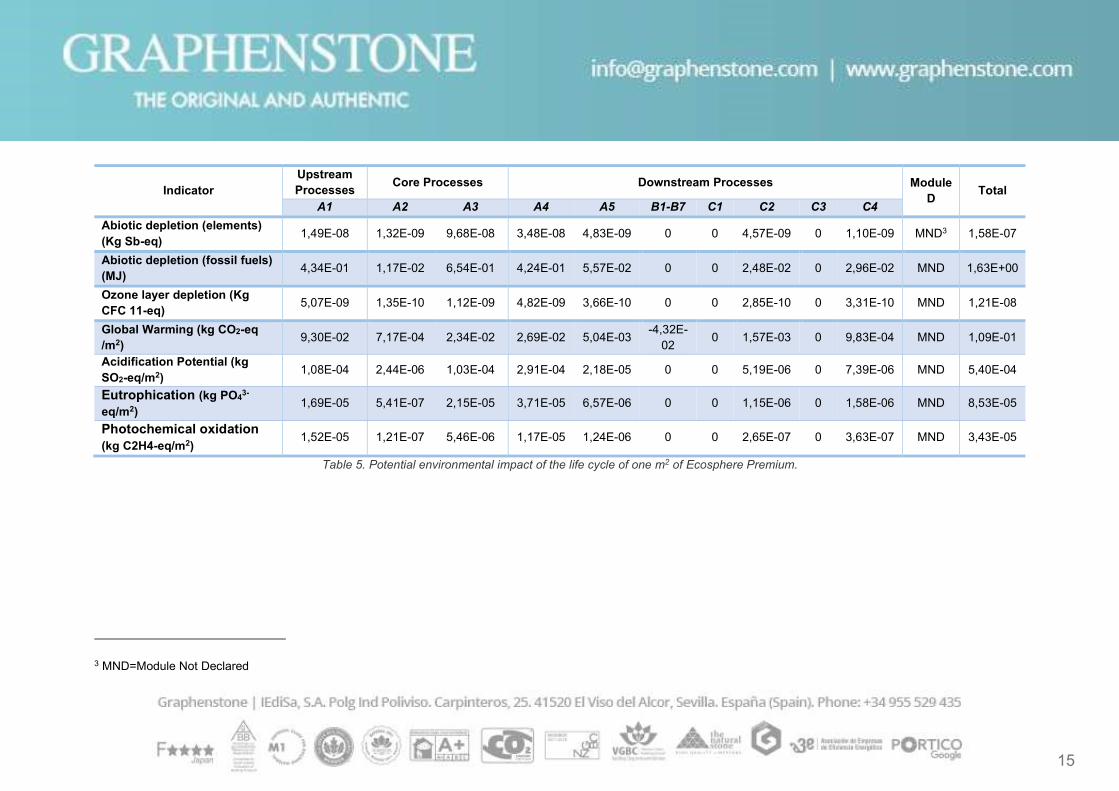
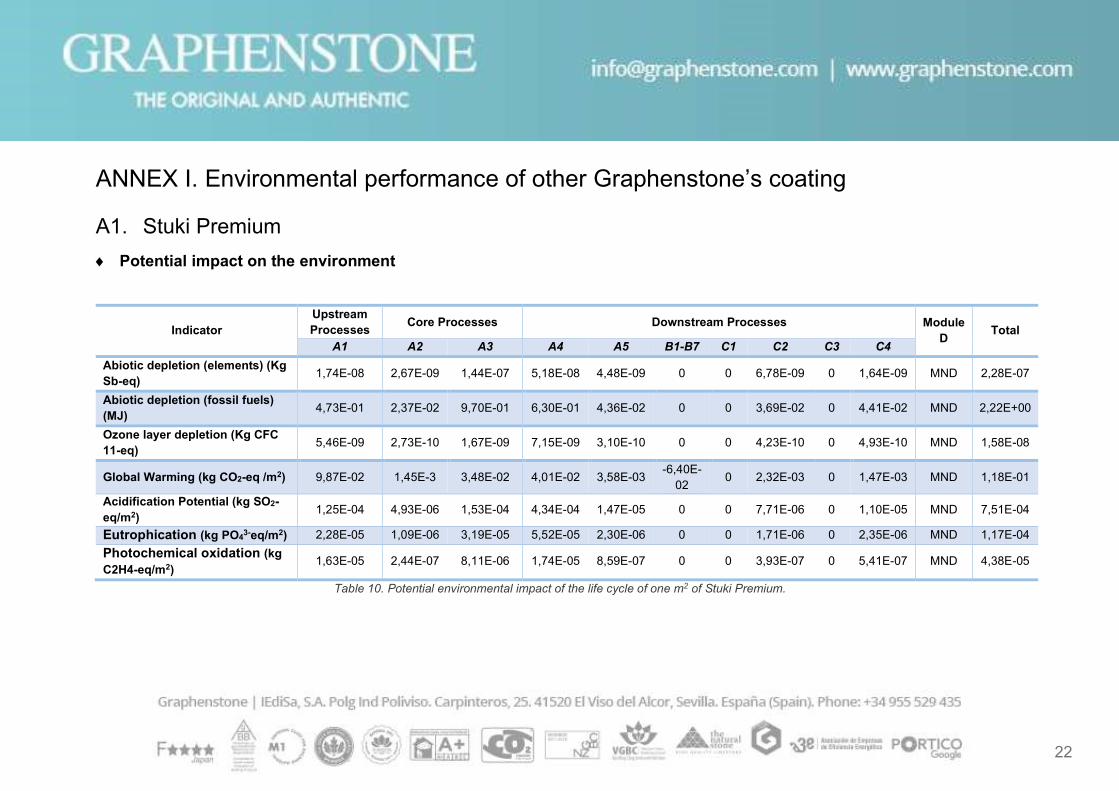
3.1. Potential impact on the environment

This section indicates the potential impact on the environment of the life cycle based on what is

indicated in the PCR: Construction products and construction services.

15

Indicator Upstream Processes

Core Processes Downstream Processes Module D

Total A1 A2 A3 A4 A5 B1-B7 C1 C2 C3 C4

Abiotic depletion (elements) (Kg Sb-eq)

1,49E-08 1,32E-09 9,68E-08 3,48E-08 4,83E-09 0 0 4,57E-09 0 1,10E-09 MND3 1,58E-07

Abiotic depletion (fossil fuels) (MJ)

4,34E-01 1,17E-02 6,54E-01 4,24E-01 5,57E-02 0 0 2,48E-02 0 2,96E-02 MND 1,63E+00

Ozone layer depletion (Kg CFC 11-eq)

5,07E-09 1,35E-10 1,12E-09 4,82E-09 3,66E-10 0 0 2,85E-10 0 3,31E-10 MND 1,21E-08

Global Warming (kg CO2-eq /m2)

9,30E-02 7,17E-04 2,34E-02 2,69E-02 5,04E-03 -4,32E-

02 0 1,57E-03 0 9,83E-04 MND 1,09E-01

Acidification Potential (kg SO2-eq/m2)

1,08E-04 2,44E-06 1,03E-04 2,91E-04 2,18E-05 0 0 5,19E-06 0 7,39E-06 MND 5,40E-04

Eutrophication (kg PO43-

eq/m2) 1,69E-05 5,41E-07 2,15E-05 3,71E-05 6,57E-06 0 0 1,15E-06 0 1,58E-06 MND 8,53E-05

Photochemical oxidation (kg C2H4-eq/m2)

1,52E-05 1,21E-07 5,46E-06 1,17E-05 1,24E-06 0 0 2,65E-07 0 3,63E-07 MND 3,43E-05

Table 5. Potential environmental impact of the life cycle of one m2 of Ecosphere Premium.

3 MND=Module Not Declared

16

3.2. Resources use

Indicator

Upstream Processes

Core Processes Downstream Processes Module D Total

A1 A2 A3 A4 A5 B1-B7 C1 C2 C3 C4

Non- renewable resources (MJ)

Material resources

0 0 0 0 0 0 0 0 0 0 MND 0

Energy resources 4,34E-01 1,17E-02 6,54E-01 4,24E-01 5,57E-02 0 0 2,48E-02 0 2,96E-02 MND 1,63E+00

Total 4,34E-01 1,17E-02 6,54E-01 4,24E-01 5,57E-02 0 0 2,48E-02 0 2,96E-02 MND 1,63E+00

Renewable resources (MJ)

Material resources

0 0 0 0 0 0 0 0 0 0 MND 0

Energy resources 3,28E-02 1,62E-04 4,61E-02 7,64E-03 2,20E-03 0 0 3,00E-04 0 7,06E-04 MND 8,99E-02

Total 3,28E-02 1,62E-04 4,61E-02 7,64E-03 2,20E-03 0 0 3,00E-04 0 7,06E-04 MND 8,99E-02

Secondary resources (MJ)

Material resources

0 0 0 0 0 0 0 0 0 0 MND 0

Energy resources (renewable and non-renewable)

0 0 0 0 0 0 0 0 0 0 MND 0

Recovered energy (MJ) 0 0 0 0 0 0 0 0 0 0 MND 0

Total amount of water (water footprint) (m3)

1,95E-04 2,70E-06 6,26E-05 8,57E-05 1,65E-05 0 0 4,55E-06 0 3,08E-05 MND 3,98E-04

Amount of water used in core process (m3)

0 0 4,65E-05 0 0 0 0 0 0 0 MND 4,65E-05

Table 6. Use of resources, renewable and non-renewable of the life-cycle of one m2 of Ecosphere Premium.

17

3.3. Waste production

Indicator

Upstream Processes

Core Processes Downstream Processes Module D

Total

A1 A2 A3 A4 A5 B1-B7 C1 C2 C3 C4

Hazardous waste (kg) 3,13E-07 6,40E-09 1,86E-07 2,39E-07 2,91E-08 0 0 1,44E-08 0 1,94E-08 MND 8,07E-07

Radioactive waste (kg) 2,91E-06 7,70E-08 6,22E-07 2,78E-06 2,03E-07 0 0 1,62E-07 0 1,88E-07 MND 6,95E-06

Non-hazardous waste (kg)

2,58E-03 9,51E-04 4,45E-03 2,28E-02 5,46E-03 0 0 1,10E-03 0 1,85E-01 MND 2,22E-01

Table 7. Waste production of the life-cycle of one m2 of Ecosphere Premium.

18

3.4. Other environmental indicators

Indicator

Upstream Processes

Core Processes Downstream Processes Módulo D

Total

A1 A2 A3 A4 A5 B1-B7 C1 C2 C3 C4

Em

iss

ion

to

air

CO2 (fossil) (kg) 9,22E-02 6,89E-04 2,07E-02 2,59E-02 4,75E-03 -4,32E-02 0 1,51E-03 0 9,27E-04 MND 1,03E-01

SO2 (kg) 6,08E-05 1,09E-06 4,81E-05 1,93E-04 1,33E-05 0 0 2,34E-06 0 2,75E-06 MND 3,21E-04

CH4 (fossil) (kg) 1,91E-05 6,74E-07 1,04E-04 2,71E-05 7,88E-06 0 0 1,45E-06 0 1,80E-06 MND 1,62E-04

NOX (kg) 6,68E-05 2,25E-06 9,02E-05 1,16E-04 1,14E-05 0 0 4,72E-06 0 8,10E-06 MND 3,00E-04

VOC (kg) 5,21E-16 0 0 0 6,64E-18 0 0 0 0 0 MND 5,27E-16

NMVOC (kg) 1,51E-05 7,05E-07 3,79E-05 2,23E-05 2,21E-06 0 0 1,13E-06 0 1,50E-06 MND 8,08E-05

Materials for recycling (kg) 0 0 0 0 8,30E-03 0 0 0 0 0 0 8,30E-03

Human toxicity, cancer (CTUh)4

3,26E-10 1,81E-11 1,13E-09 7,09E-10 3,64E-10 0 0 4,47E-11 0 3,47E-11 MND 2,63E-09

Human toxicity, non-cancer (CTUh)

2,12E-09 1,51E-10 2,15E-09 4,38E-09 8,00E-10 0 0 4,62E-10 0 1,15E-10 MND 1,02E-08

Ecotoxicity (CTUe) 4,87E-02 4,74E-03 9,77E-02 1,33E-01 2,94E-02 0 0 9,72E-03 0 3,05E-03 MND 3,27E-01

Table 8. Other environmental indicators of Ecosphere Premium.

4 CTUh: increase of morbidity cases in the total human population. Morbidity: proportion of people that gets sick in a determinated place and time.

19

4. Results interpretation

As we can see in figure 4 and table 9, the impact of the life cycle of Ecosphere Premium paint for

covering 1 m2 surface it is mainly due to Product stage (A1-A3) and A4 Transport to customer, for all

the impact indicators under study. Hence, excepting for Global warming the Product stage represents

between 71,5% (Abiotic depletion, elements) and 39,5% (Acidification) of the life cycle impact. A4

Transport stage represents between 53,9% (Acidification) and 22,0% (Abiotic depletion, elements) of

the life cycle impact. Installation stage (A5) contributes at most 7,7% (Eutrophication) of the total life

cycle impact for all impact indicators. The transport to end-of-life manager (C2) as well as Waste

treatment (C4) represents at most 2,9% of the whole impact.

Impact category A1/A2/A3 A4

Transport A5

Installation

B Use

C2 Transport

C4 Waste

treatment

Abiotic depletion (elements) 71,5% 22,0% 3,1% 0% 2,9% 0,7%

Abiotic depletion (fossil fuels) 67,5% 26,0% 3,4% 0% 1,5% 1,8%

Ozone layer depletion 52,3% 39,8% 3,0% 0% 2,4% 2,7%

Global Warming 107,4% 24,7% 4,6% -39,6% 1,4% 0,9%

Acidification 39,5% 53,9% 4,0% 0% 1,0% 1,4%

Eutrophication 45,7% 43,5% 7,7% 0% 1,3% 1,9%

Photochemical oxidation 60,6% 34,1% 3,6% 0% 0,8% 1,1%

Table 9. Potential environmental impact of each life cycle phase for Ecosphere Premium.

20

Figure 4. Potential environmental impact of each life cycle phase for Ecosphere Premium.

5. Differences versus previous versions of the EPD®

See point 2.4.

6. Verification

CEN standard EN 15804 served as the core PCR

Product Category Rule 2012:01. Construction products and construction services v 2.2

Product Category Rule (CPR) has been verified by

The Technical Committee of the International EPD® System. Chair: Massimo Marino. Contact through [email protected]

Independent verification of EPD® and data according to ISO 14025: 2010

External verification of EPD®

Third part verifier Marcel Gómez Ferrer Marcel Gómez Consultoria Ambiental Tlf 0034630643593 Email: [email protected]

Accredited or approved by: The International EPD® System®, Operated by EPD® International AB www.environdec.com Sweden

-40%

-20%

0%

20%

40%

60%

80%

100%

120%

140%

Global Warming Acidification Eutrophication Photochemical oxidation

A1-A3 A4 A5 B C2 C4

21

7. References

The bibliographical references consulted for this EPD® have been the following:

GENERAL PROGRAMME INSTRUCTIONS for Environmental Product Declarations, EPD®.

Version 2.01 updated at 2013-09-18

ISO 14025: Environmental labels and declarations-Type III Environmental Declarations-

Principles and procedures (2006)

ISO 14040: Environmental management-Life Cycle Assessment-Principles and framework

(2006)

ISO 14044: Environmental management-Life Cycle Assessment-Requirements and

guidelines (2006)

PCR: Construction products and construction services. 2012:01. v 2.2

Requirements for Environmental Product Declarations. MSR 1992:2 Rev 2009). Swedish

Environmental Management Council

UNE-EN 15804: Sostenibilidad en la construcción. Declaraciones Ambientales de Producto

(2012).

22

ANNEX I. Environmental performance of other Graphenstone’s coating

A1. Stuki Premium

Potential impact on the environment

Indicator Upstream Processes

Core Processes Downstream Processes Module D

Total A1 A2 A3 A4 A5 B1-B7 C1 C2 C3 C4

Abiotic depletion (elements) (Kg Sb-eq)

1,74E-08 2,67E-09 1,44E-07 5,18E-08 4,48E-09 0 0 6,78E-09 0 1,64E-09 MND 2,28E-07

Abiotic depletion (fossil fuels) (MJ)

4,73E-01 2,37E-02 9,70E-01 6,30E-01 4,36E-02 0 0 3,69E-02 0 4,41E-02 MND 2,22E+00

Ozone layer depletion (Kg CFC 11-eq)

5,46E-09 2,73E-10 1,67E-09 7,15E-09 3,10E-10 0 0 4,23E-10 0 4,93E-10 MND 1,58E-08

Global Warming (kg CO2-eq /m2) 9,87E-02 1,45E-3 3,48E-02 4,01E-02 3,58E-03 -6,40E-

02 0 2,32E-03 0 1,47E-03 MND 1,18E-01

Acidification Potential (kg SO2-eq/m2)

1,25E-04 4,93E-06 1,53E-04 4,34E-04 1,47E-05 0 0 7,71E-06 0 1,10E-05 MND 7,51E-04

Eutrophication (kg PO43-eq/m2) 2,28E-05 1,09E-06 3,19E-05 5,52E-05 2,30E-06 0 0 1,71E-06 0 2,35E-06 MND 1,17E-04

Photochemical oxidation (kg C2H4-eq/m2)

1,63E-05 2,44E-07 8,11E-06 1,74E-05 8,59E-07 0 0 3,93E-07 0 5,41E-07 MND 4,38E-05

Table 10. Potential environmental impact of the life cycle of one m2 of Stuki Premium.

23

Resources use

Indicator

Upstream Processes

Core Processes Downstream Processes Module D Total

A1 A2 A3 A4 A5 B1-B7 C1 C2 C3 C4

Non- renewable resources (MJ)

Material resources

0 0 0 0 0 0 0 0 0 0 MND 0

Energy resources

4,73E-01 2,37E-02 9,70E-01 6,30E-01 4,36E-02 0 0 3,69E-02 0 4,41E-02 MND 2,22E+00

Total 4,73E-01 2,37E-02 9,70E-01 6,30E-01 4,36E-02 0 0 3,69E-02 0 4,41E-02 MND 2,22E+00

Renewable resources (MJ)

Material resources

0 0 0 0 0 0 0 0 0 0 MND 0

Energy resources

3,99E-02 3,27E-04 6,83E-02 1,14E-02 2,43E-03 0 0 4,46E-04 0 1,05E-03 MND 1,24E-01

Total 3,99E-02 3,27E-04 6,83E-02 1,14E-02 2,43E-03 0 0 4,46E-04 0 1,05E-03 MND 1,24E-01

Secondary resources (MJ)

Material resources

0 0 0 0 0 0 0 0 0 0 MND 0

Energy resources

(renewable and non-renewable)

0 0 0 0 0 0 0 0 0 0 MND 0

Recovered energy (MJ) 0 0 0 0 0 0 0 0 0 0 MND 0

Total amount of water (water footprint) (m3)

2,14E-04 5,46E-06 9,29E-05 1,27E-04 9,85E-06 0 0 6,76E-06 0 4,60E-05 MND 5,02E-04

Amount of water used in core process (m3)

4,83E-05 0 0 0 0 0 0 0 0 0 MND 4,83E-05

Table 11. Use of resources, renewable and non-renewable of the life-cycle of one m2 of Stuki Premium.

24

Waste production

Indicator

Upstream Processes

Core Processes Downstream Processes Module D

Total

A1 A2 A3 A4 A5 B1-B7 C1 C2 C3 C4

Hazardous waste (kg) 3,61E-07 1,29E-08 2,76-07 3,56E-07 2,11E-08 0 0 2,14E-08 0 2,89E-08 MND 1,08E-06

Radioactive waste (kg) 3,22E-06 1,55E-07 9,26E-07 4,14E-06 1,79-07 0 0 2,40E-07 0 2,80E-07 MND 9,14E-06

Non-hazardous waste (kg)

2,75E-03 1,92E-03 6,65E-03 3,38E-02 6,45E-03 0 0 1,64E-03 0 2,76E-01 MND 3,29E-01

Table 12. Waste production of the life-cycle of one m2 of Stuki Premium.

25

Other environmental indicator

Indicator

Upstream Processes

Core Processes Downstream Processes Módulo D

Total

A1 A2 A3 A4 A5 B1-B7 C1 C2 C3 C4

Em

iss

ion

to

air

CO2 (fossil) (kg) 9,76E-02 1,39E-03 3,07E-02 3,86E-02 3,44E-03 -6,40E-02 0 2,23E-03 0 1,38E-03 MND 1,11E-01

SO2 (kg) 7,01E-05 2,20E-06 7,15E-05 2,87E-04 8,77E-06 0 0 3,47E-06 0 4,11E-06 MND 4,47E-04

CH4 (fossil) (kg) 2,47E-05 1,36E-06 1,55E-04 4,03E-05 4,52E-06 0 0 2,15E-06 0 2,69E-06 MND 2,31E-04

NOX (kg) 7,65E-05 4,54E-06 1,34E-04 1,73E-04 8,14E-06 0 0 7,01E-06 0 1,21E-05 MND 4,15E-04

VOC (kg) 5,41E-16 0 0 0 1,08E-17 0 0 0 0 0 MND 5,52E-16

NMVOC (kg) 1,66E-05 1,42E-06 5,63E-05 3,32E-05 2,23E-06 0 0 1,67E-06 0 2,24E-06 MND 1,14E-04

Materials for recycling (kg) 0 0 0 0 1,23E-01 0 0 0 0 0 MND 8,30E-02

Human toxicity, cancer (CTUh)5

4,88E-10 3,65E-11 1,68E-09 1,05E-09 6,76E-11 0 0 6,63E-11 0 5,18E-11 MND 3,45E-09

Human toxicity, non-cancer (CTUh)

2,74E-09 3,06E-10 3,19E-09 6,51E-09 2,72E-10 0 0 6,86E-10 0 1,72E-10 MND 1,39E-08

Ecotoxicity (CTUe) 6,62E-02 9,57E-03 1,45E-01 1,98E-01 8,76E-03 0 0 1,44E-02 0 4,55E-03 MND 4,47E-01

Table 13. Other environmental indicators of Stuki Premium.

5 CTUh: increase of morbidity cases in the total human population. Morbidity: proportion of people that gets sick in a determined place and time.

26

A2. Kratzputz Premium

Potential impact on the environment

Indicador Upstream Processes

Core Processes Downstream Processes Module D

Total A1 A2 A3 A4 A5 B1-B7 C1 C2 C3 C4

Abiotic depletion (elements) (Kg Sb-eq)

1,87E-07 5,86E-08 2,60E-06 9,15E-07 7,83E-08 0 0 1,23E-07 0 2,97E-08 MND 3,99E-06

Abiotic depletion (fossil fuels) (MJ)

7,23E+00 5,22E-01 1,76E+01 1,14E+01 7,64E-01 0 0 6,68E-01 0 8,00E-01 MND 3,90E+01

Ozone layer depletion (Kg CFC 11-eq)

7,10E-08 6,00E-09 3,03E-08 1,30E-07 5,07E-09 0 0 7,67E-09 0 8,94E-09 MND 2,59E-07

Global Warming (kg CO2-eq /m2)

1,27E+00 3,18E-02 6,30E-01 7,26E-01 5,45E-02 -9,14E-

01 0 4,21E-02 0 2,66E-02 MND 1,86E+00

Acidification Potential (kg SO2-eq/m2)

1,44E-03 1,08E-04 2,78E-03 7,86E-03 2,50E-04 0 0 1,40E-04 0 2,00E-04 MND 1,28E-02

Eutrophication (kg PO43-

eq/m2) 2,34E-04 2,40E-05 5,77E-04 1,00E-03 3,82E-05 0 0 3,10E-05 0 4,26E-05 MND 1,95E-03

Photochemical oxidation (kg C2H4-eq/m2)

7,77E-04 5,11E-06 1,47E-04 3,15E-04 2,55E-05 0 0 7,12E-06 0 9,80E-06 MND 1,29E-03

Table 14. Potential environmental impact of the life cycle of one m2 of Kratzputz Premium.

27

Resources use

Indicator

Upstream Processes

Core Processes Downstream Processes Module D Total

A1 A2 A3 A4 A5 B1-B7 C1 C2 C3 C4

Non- renewable resources (MJ)

Material resources

0 0 0 0 0 0 0 0 0 0 MND 0

Energy resources

7,23E+00 5,22E-01 1,76E+01 1,14E+01 7,64E-01 0 0 6,68E-01 0 8,00E-01 MND 3,90E+01

Total 7,23E+00 5,22E-01 1,76E+01 1,14E+01 7,64E-01 0 0 6,68E-01 0 8,00E-01 MND 3,90E+01

Renewable resources (MJ)

Material resources

0 0 0 0 0 0 0 0 0 0 MND 0

Energy resources

4,09E-01 7,19E-03 1,24E+00 1,96E-01 3,76E-02 0 0 8,07E-03 0 1,91E-02 MND 1,92E+00

Total 4,09E-01 7,19E-03 1,24E+00 1,96E-01 3,76E-02 0 0 8,07E-03 0 1,91E-02 MND 1,92E+00

Secondary resources (MJ)

Material resources

0 0 0 0 0 0 0 0 0 0 MND 0

Energy resources

(renewable and non-renewable)

0 0 0 0 0 0 0 0 0 0 MND 0

Recovered energy (MJ) 0 0 0 0 0 0 0 0 0 0 MND 0

Total amount of water (water footprint) (m3)

2,44E-03 1,20E-04 1,68E-03 2,29E-03 1,50E-04 0 0 1,22E-04 0 8,33E-04 MND 7,63E-03

Amount of water used in core process (m3)

5,80E-04 0 0 0 0 0 0 0 0 0 MND 5,80E-04

Table 15. Use of resources, renewable and non-renewable of the life-cycle of one m2 of Kratzputz Premium.

28

Waste production

Indicator

Upstream Processes

Core Processes Downstream Processes Module D

Total

A1 A2 A3 A4 A5 B1-B7 C1 C2 C3 C4

Hazardous waste (kg) 4,37E-06 2,84E-07 5,00E-06 6,44E-06 3,40E-07 0 0 3,88E-07 0 5,24E-07 MND 1,73E-05

Radioactive waste (kg) 3,63E-05 3,42E-06 1,68E-05 7,50E-05 2,82E-06 0 0 4,35E-06 0 5,08E-06 MND 1,44E-04

Non-hazardous waste (kg)

3,22E-02 4,22E-02 1,20E-01 6,13E-01 1,17E-01 0 0 2,97E-02 0 5,00E+00 MND 5,95E+00

Table 16. Waste production of the life-cycle of one m2 of Kratzputz Premium.

29

Other environmental indicator

Indicator

Upstream Processes

Core Processes Downstream Processes Module D

Total

A1 A2 A3 A4 A5 B1-B7 C1 C2 C3 C4

Em

iss

ion

to

air

CO2 (fossil) (kg) 1,25E+00 3,06E-02 5,57E-01 6,99E-01 5,21E-02 -9,14E-01 0 4,05E-02 0 2,51E-02 MND 1,74E+00

SO2 (kg) 7,59E-04 4,82E-05 1,29E-03 5,20E-03 1,49E-04 0 0 6,28E-05 0 7,45E-05 MND 7,59E-03

CH4 (fossil) (kg) 2,39E-04 2,99E-05 2,81E-03 7,34E-04 7,79E-05 0 0 3,89E-05 0 4,87E-05 MND 3,97E-03

NOX (kg) 8,33E-04 9,98E-05 2,43E-03 3,13E-03 1,37E-04 0 0 1,27E-04 0 2,19E-04 MND 6,98E-03

VOC (kg) 8,15E-14 0 0 0 1,63E-15 0 0 0 0 0 MND 8,32E-14

NMVOC (kg) 1,88E-04 3,13E-05 1,02E-03 6,04E-04 3,83E-05 0 0 3,03E-05 0 4,06E-05 MND 1,95E-03

Materials for recycling (kg) 0 0 0 0 2,23E+00 0 0 0 0 0 MND 2,23E+00

Human toxicity, cancer (CTUh)6

4,08E-09 8,02E-10 3,04E-08 1,91E-08 1,13E-09 0 0 1,20E-09 0 9,39E-10 MND 5,77E-08

Human toxicity, non-cancer (CTUh)

3,11E-08 6,72E-09 5,79E-08 1,18E-07 4,58E-09 0 0 1,24E-08 0 3,11E-09 MND 2,33E-07

Ecotoxicity (CTUe) 6,20E-01 2,10E-01 2,63E+00 3,58E+00 1,48E-01 0 0 2,62E-01 0 8,24E-02 MND 7,53E+00

Table 17. Other environmental indicators of Kratzputz Premium.

6 CTUh: increase of morbidity cases in the total human population. Morbidity: proportion of people that gets sick in a determined place and time.

30

A3. Füllmasse Premium

Potential impact on the environment

Indicator Upstream Processes

Core Processes Downstream Processes Module D

Total A1 A2 A3 A4 A5 B1-B7 C1 C2 C3 C4

Abiotic depletion (elements) (Kg Sb-eq)

3,02E-07 5,82E-08 2,60E-06 9,38E-07 8,65E-08 0 0 1,23E-07 0 2,97E-08 MND 4,14E-06

Abiotic depletion (fossil fuels) (MJ)

8,07E+00 5,18E-01 1,76E+01 1,14E+01 8,11E-01 0 0 6,68E-01 0 8,00E-01 MND 3,99E+01

Ozone layer depletion (Kg CFC 11-eq)

9,26E-078 5,97E-09 3,03E-08 1,30E-07 5,85E-09 0 0 7,67E-09 0 8,94E-09 MND 2,81E-07

Global Warming (kg CO2-eq /m2)

1,67E+00 3,16E-02 6,30E-01 7,26E-01 6,44E-02 -

1,07E+00 0 4,21E-02 0 2,66E-02 MND 2,12E+00

Acidification Potential (kg SO2-eq/m2)

2,16E-03 1,08E-04 2,78E-03 7,86E-03 2,71E-04 0 0 1,40E-04 0 2,00E-04 MND 1,35E-02

Eutrophication (kg PO43-

eq/m2) 4,07E-04 2,38E-05 5,77E-04 1,00E-03 4,30E-05 0 0 3,10E-05 0 4,26E-05 MND 2,13E-03

Photochemical oxidation (kg C2H4-eq/m2)

2,76E-04 5,32E-06 1,47E-04 3,15E-04 1,55E-05 0 0 7,12E-06 0 9,80E-06 MND 7,76E-04

Table 18. Potential environmental impact of the life cycle of one m2 of Füllmasse Premium.

31

Resources use

Indicator

Upstream Processes

Core Processes Downstream Processes Module D Total

A1 A2 A3 A4 A5 B1-B7 C1 C2 C3 C4

Non- renewable resources (MJ)

Material resources

0 0 0 0 0 0 0 0 0 0 MND 0

Energy resources

8,07E+00 5,18E-01 1,76E+01 1,14E+01 8,11E-01 0 0 6,68E-01 0 8,00E-01 MND 3,99E+01

Total 8,07E+00 5,18E-01 1,76E+01 1,14E+01 8,11E-01 0 0 6,68E-01 0 8,00E-01 MND 3,99E+01

Renewable resources (MJ)

Material resources

0 0 0 0 0 0 0 0 0 0 MND 0

Energy resources

6,97E-01 7,15E-03 1,24E+00 2,06E-01 4,39E-02 0 0 8,07E-03 0 1,91E-02 MND 2,22E+00

Total 6,97E-01 7,15E-03 1,24E+00 2,06E-01 4,39E-02 0 0 8,07E-03 0 1,91E-02 MND 2,22E+00

Secondary resources (MJ)

Material resources

0 0 0 0 0 0 0 0 0 0 MND 0

Energy resources

(renewable and non-renewable)

0 0 0 0 0 0 0 0 0 0 MND 0

Recovered energy (MJ) 0 0 0 0 0 0 0 0 0 0 MND 0

Total amount of water (water footprint) (m3)

3,65E-03 1,19E-04 1,68E-03 2,31E-03 1,80E-04 0 0 1,22E-04 0 8,33E-04 MND 8,90E-03

Amount of water used in core process (m3)

8,13E-04 0 0 0 0 0 0 0 0 0 MND 8,13E-04

Table 19. Use of resources, renewable and non-renewable of the life-cycle of one m2 of Füllmasse Premium.

32

Waste production

Indicator

Upstream Processes

Core Processes Downstream Processes Module D

Total

A1 A2 A3 A4 A5 B1-B7 C1 C2 C3 C4

Hazardous waste 6,23E-06 2,83E-07 5,00E-06 6,45E-06 3,95E-07 0 0 3,88E-07 0 5,24E-07 MND 1,93E-05

Radioactive waste 5,50E-05 3,40E-06 1,68E-05 7,50E-05 3,39E-06 0 0 4,35E-06 0 5,08E-06 MND 1,63E-04

Non-hazardous waste (kg)

4,66E-02 4,19E-02 1,20E-01 6,13E-01 1,18E-01 0 0 2,97E-02 0 5,00E+00 MND 5,97E+00

Table 20. Waste production of the life-cycle of one m2 of Füllmasse Premium.

33

Other environmental indicator

Indicator

Upstream Processes

Core Processes Downstream Processes Module D

Total

A1 A2 A3 A4 A5 B1-B7 C1 C2 C3 C4

Em

iss

ion

to

air

CO2 (fossil) (kg) 1,65E+00 3,04E-02 5,57E-01 6,98E-01 6,18E-02 -1,07E+00 0 4,05E-02 0 2,51E-02 MND 2,00E+00

SO2 (kg) 1,21E-03 4,79E-05 1,29E-03 5,20E-03 1,61E-04 0 0 6,28E-05 0 7,45E-05 MND 8,05E-03

CH4 (fossil) (kg) 4,37E-04 2,97E-05 2,81E-03 7,30E-04 8,36E-05 0 0 3,89E-05 0 4,87E-05 MND 4,17E-03

NOX (kg) 1,32E-03 9,92E-05 2,43E-03 3,14E-03 1,52E-04 0 0 1,27E-04 0 2,19E-04 MND 7,48E-03

VOC (kg) 9,10E-15 0 0 0 1,82E-16 0 0 0 0 0 MND 9,28E-15

NMVOC (kg) 2,82E-04 3,11E-05 1,02E-03 6,01E-04 4,14E-05 0 0 3,03E-05 0 4,06E-05 MND 2,05E-03

Materials for recycling (kg) 0 0 0 0 2,23E+00 0 0 0 0 0 MND 2,23E+00

Human toxicity, cancer (CTUh)7

8,87E-09 7,97E-10 3,04E-08 1,91E-08 1,28E-09 0 0 1,20E-09 0 9,39E-10 MND 6,26E-08

Human toxicity, non-cancer (CTUh)

4,84E-08 6,68E-09 5,79E-08 1,18E-07 5,48E-09 0 0 1,24E-08 0 3,11E-09 MND 2,52E-07

Ecotoxicity (CTUe) 1,18E+00 2,09E-01 2,63E+00 3,59E+00 1,71E-01 0 0 2,62E-01 0 8,24E-02 MND 8,13E+00

Table 21. Other environmental indicators of Füllmasse Premium.

7 CTUh: increase of morbidity cases in the total human population. Morbidity: proportion of people that gets sick in a determined place and time.


Recommended