EVALUATION OF RESPONSE REDUCTION FACTOR FOR INDUSTRIAL BUILDING HAVING STEEL TRUSSES ON RC COLUMNS PREPARED BY: Avi A. Patel (MS007) GUIDED BY: PROF. D.G. Panchal DEPARTMENT OF CIVIL ENGINEERING DHARMSINH DESAI UNIVERSITY NADIAD – 387001 APRIL - 2016
Transcript
EVALUATION OF RESPONSE REDUCTION FACTOR FOR INDUSTRIAL BUILDING HAVING STEEL TRUSSES ON RC
COLUMNS
PREPARED BY:Avi A. Patel (MS007)
GUIDED BY:PROF. D.G. Panchal
DEPARTMENT OF CIVIL ENGINEERINGDHARMSINH DESAI UNIVERSITY
NADIAD – 387001APRIL - 2016
2CONTENTS
INTRODUCTION AIM AND SCOPE OF WORK LITERATURE REVIEW EVALUATION OF RESPONSE REDUCTION FACTOR SAMPLE PROBLEM COMPARATIVE STUDY AND RESULTS CONCLUSION FUTURE SCOPE OF WORK REFERENCES
3INTRODUCTION
In the past, the structure were designed just for gravity loads only, seismic analysis is a recent development.
Seismic analysis is a subset of structural analysis and is the calculation of the response of a structure to earthquakes.
It is part of the process of structural design, earthquake engineering and retrofit in regions where earthquakes are prevalent.
There are different method of seismic analysis.
4Seismic analysis
Linear analysis Non linear analysis
static dynamic static dynamic
Seismic coefficient
Response spectrum,Time history
Pushover analysis
IDA,Nonlinear
time history
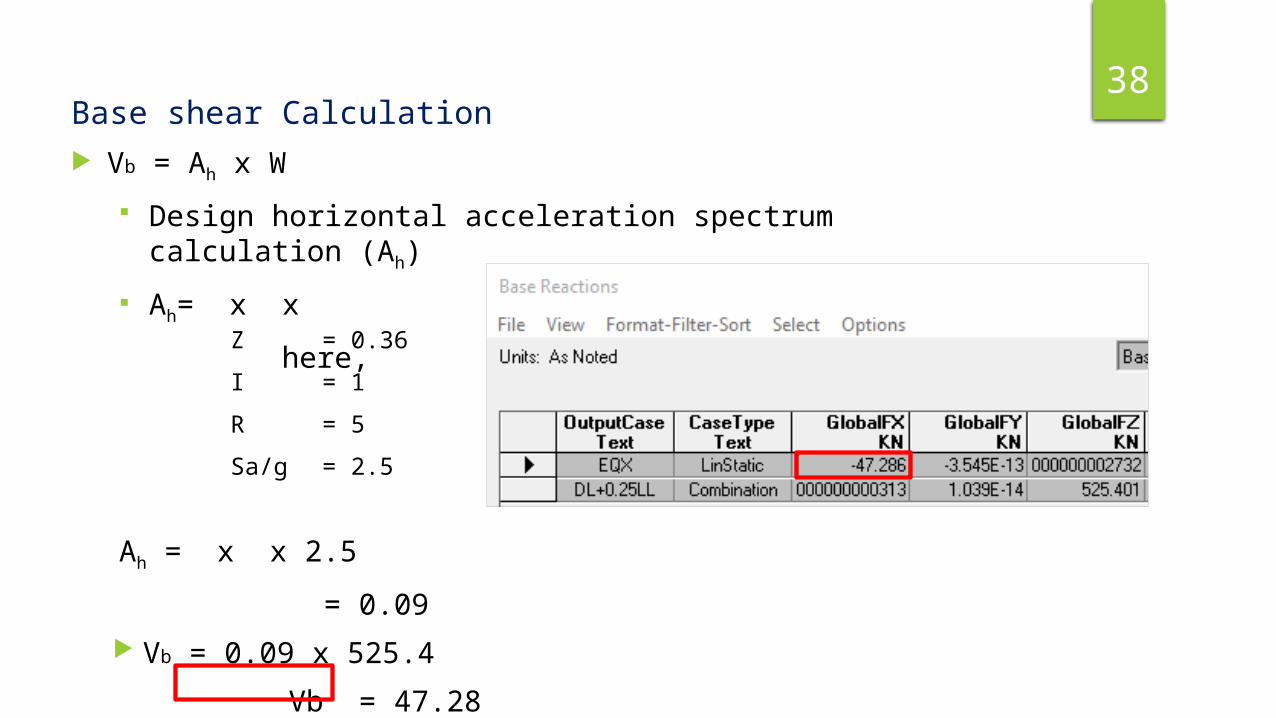
Vb = Ah x w Ah =
Seismic coefficient
5RESPONSE REDUCTION FACTOR
As per the IS 1893 definition, R factor which is used to reduce actual base shear forces to design lateral forces, because at design basis earthquake shaking (DBE) structure should remain in elastic response.
The response of the structure will be linear until yielding takes place, but as soon as yielding occurs at any section the behavior of structure is inelastic.
It would be too costly to design a structure based on the elastic spectrum. To reduce the seismic loads, IS 1893 introduced RESPONSE REDUCTION FACTOR. This reduction can be made, only if adequate ductility is developed through proper
design and proper detailing on the elements.
6 R factor reflects the capability of the structure to dissipate energy through inelastic
behavior. It is used to reduced the design forces in earthquake resisting design and account for
over strength and ductility of the structure. Over strength is develop because the maximum lateral strength of the structure is
always exceed its design strength. Once it enters the inelastic phase, it is capable of resisting and absorbing the large
amount of seismic energy. Hence, seismic codes introduce a reduction in design loads, taking benefit of fact
that structure posses over strength and ductility.
7
Horizontal Load
Δ
Δmax
Fu
Fy
Fdes
ΔyΔw
Fel
Due to Over strength
Due to Redundancy
Due to Ductility
0
Design force
Maximum Load Capacity
Non linear Response
First significant yield
Linear Elastic Response
Load at First Yield
Maximum force if structure remains elastic
Tota
l Hor
izon
tal L
oad
Roof Displacement (Δ)
8BACKGROUND OF DISSERTATION
Composite industrial building (steel truss on RC columns) are commonly used in
urban areas as the dominant mode of industrial construction, as RC columns costs
much less then the steel columns.
Indian standard doesn’t give any guideline regarding to response reduction factor’s
value of composite industrial building, and that motivates us to find the response
reduction factor for this kind of structure.
9AIM AND SCOPE OF WORK
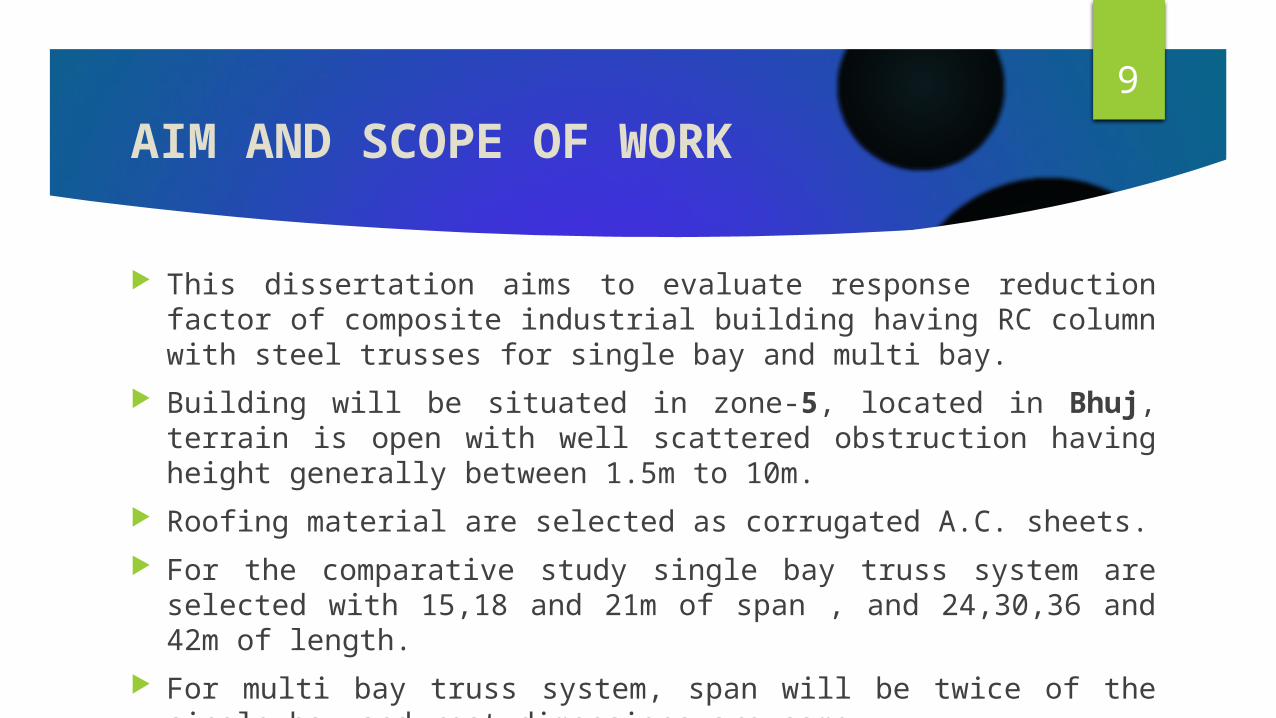
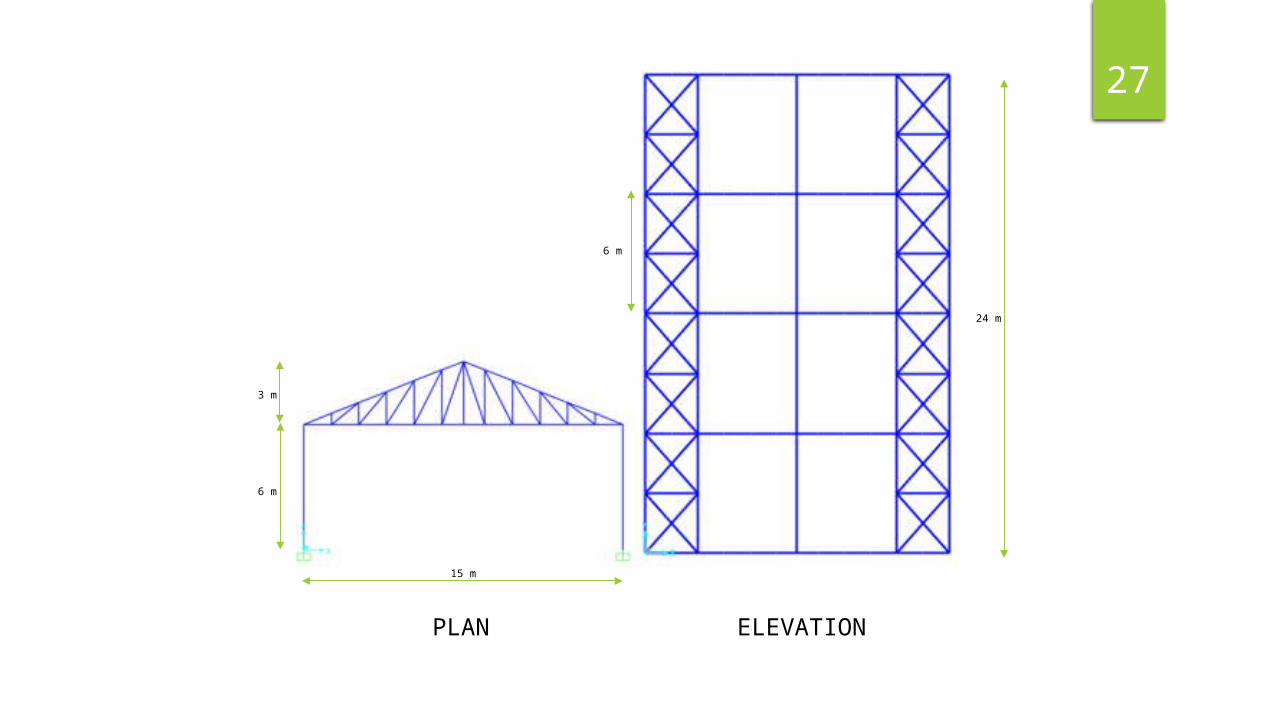
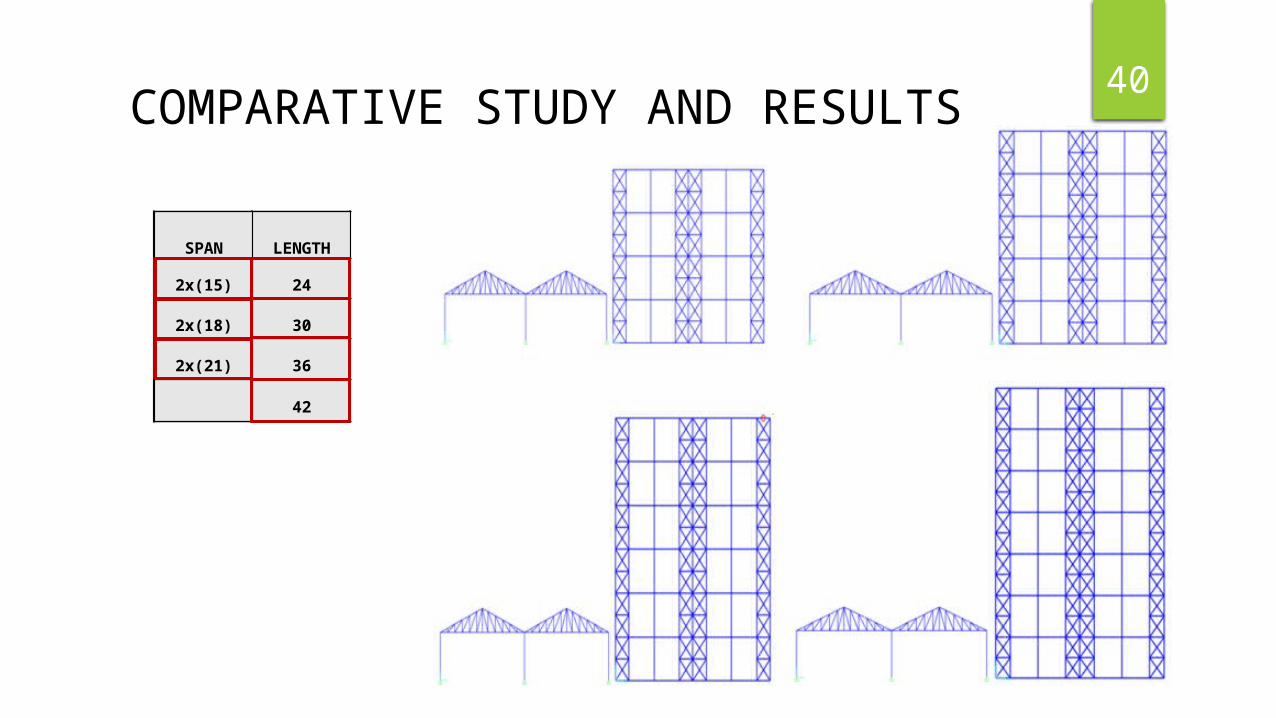
This dissertation aims to evaluate response reduction factor of composite industrial building having RC column with steel trusses for single bay and multi bay.
Building will be situated in zone-5, located in Bhuj, terrain is open with well scattered obstruction having height generally between 1.5m to 10m.
Roofing material are selected as corrugated A.C. sheets. For the comparative study single bay truss system are selected with 15,18 and 21m
of span , and 24,30,36 and 42m of length. For multi bay truss system, span will be twice of the single bay and rest dimensions
are same.
DELL
10
Nonlinear analysis of each model is carried out, so that nonlinear behavior of the
industrial building is observed due to changes in the geometry.
Performance based evaluation is carried out using non linear static (pushover)
analysis.
Nonlinear models are prepared and pushover analysis is performed in SAP-2000.
Value of response reduction factor is calculated for each model.
11LITERATURE REVIEW
Background of R factor Response modification factor were first proposed by the applied technology council
in 1978. The base shear vs roof displacement relationship were established of concentrically
braced frame by uang and bertero in 1986 and eccentrically braced frame by whittaker in 1987.
Using this data Berkeley researchers proposed splitting R into three factor, they account for contribution from reserved strength, ductility and viscous damping as follows,
R = Rs x Rμ x Rξ
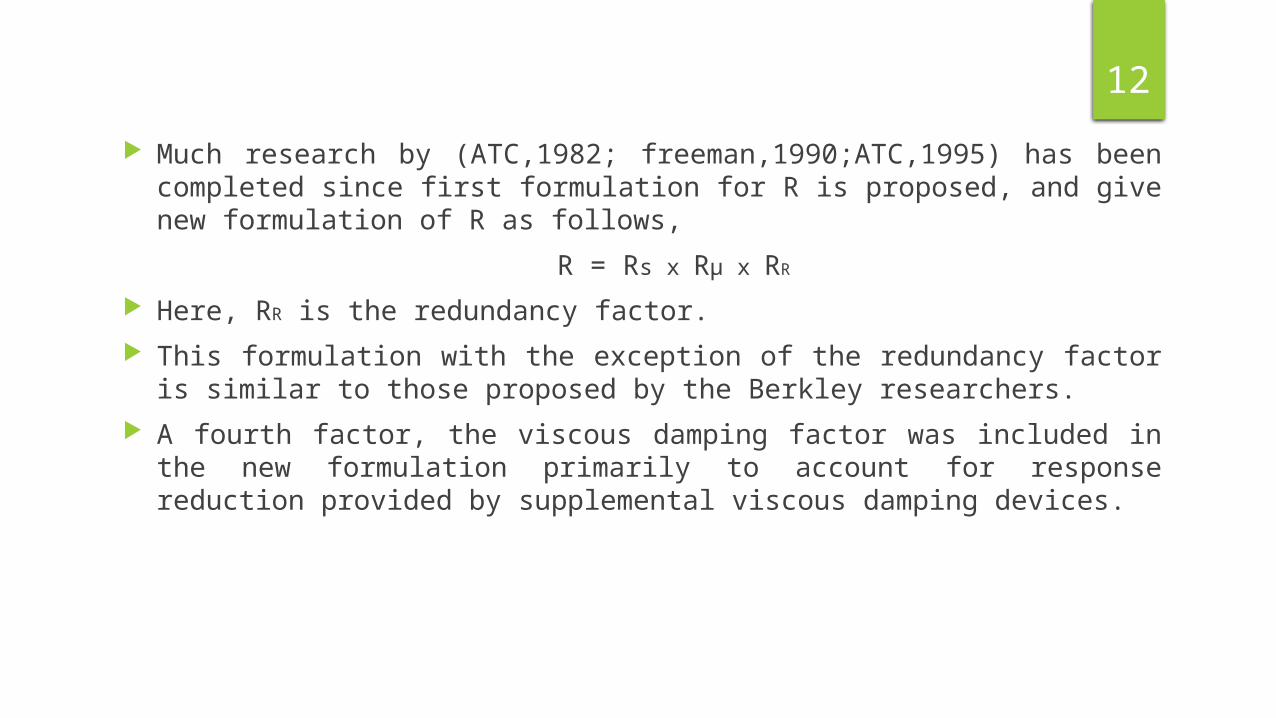
12 Much research by (ATC,1982; freeman,1990;ATC,1995) has been completed since
first formulation for R is proposed, and give new formulation of R as follows,
R = Rs x Rμ x RR
Here, RR is the redundancy factor. This formulation with the exception of the redundancy factor is similar to those
proposed by the Berkley researchers. A fourth factor, the viscous damping factor was included in the new formulation
primarily to account for response reduction provided by supplemental viscous damping devices.
13 Minnu M M (MAY-2014) (NIT-ROURKELA) The frames with number of story 2,4,8 and 12 with four bay is designed and details
as SMRF and OMRF as per IS:1893 (2000) The response reduction factors obtained shows that both the SMRF and OMRF
frames failed to achieve the respected target value of response reduction factor recommended by IS:1893 (2000) marginally.
It was also found that shorter frames exhibit higher R factor and as the height of the frame increase R factor is decreases.
For both SMRF and OMRF frames it is found that the over strength factors exhibits a decreasing trend as the number of story increases.
It is found that the ductility factor do not shows any trend with variation in number of stories for both SMRF and OMRF.
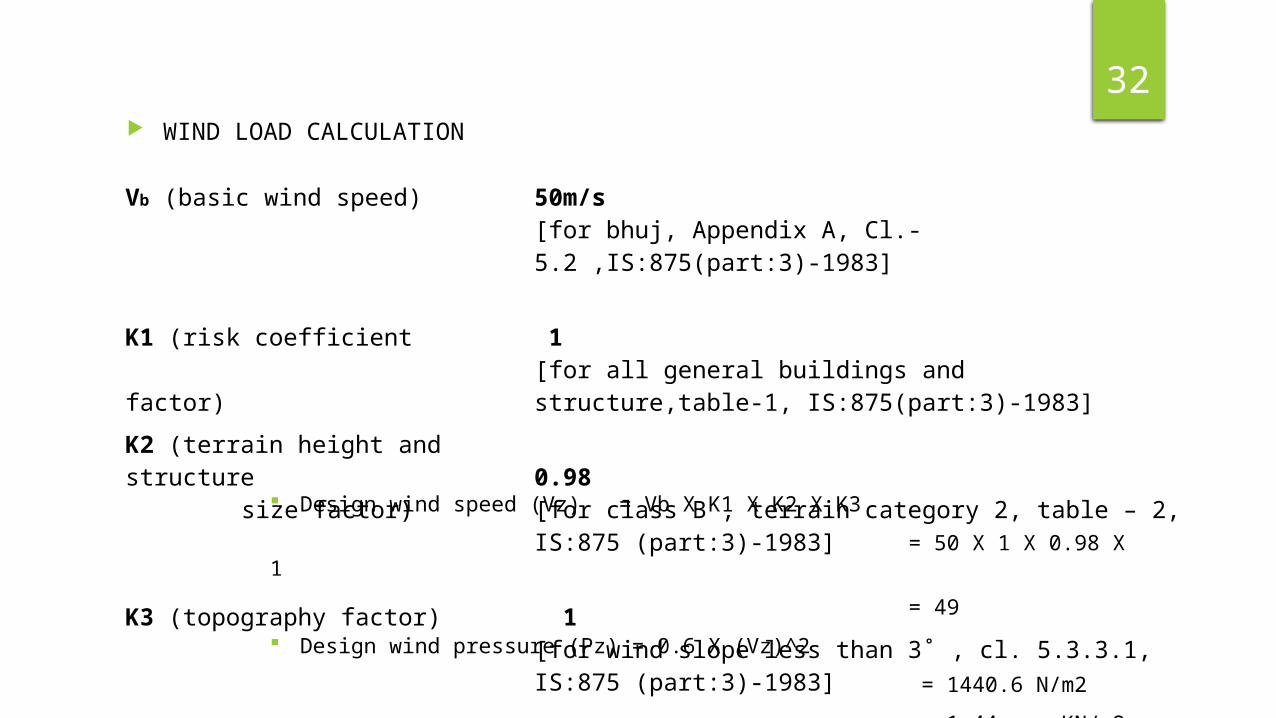
14IS: 875-1987(part-3)
The code is based on Design Loads For Buildings And Structures (other than
earthquake). The code provide the clauses for
Design Wind Speed (Cl-5.3)
Design Wind Pressure (Cl-5.4)
External Pressure Coefficients for walls of rectangular clad building (Table-4)
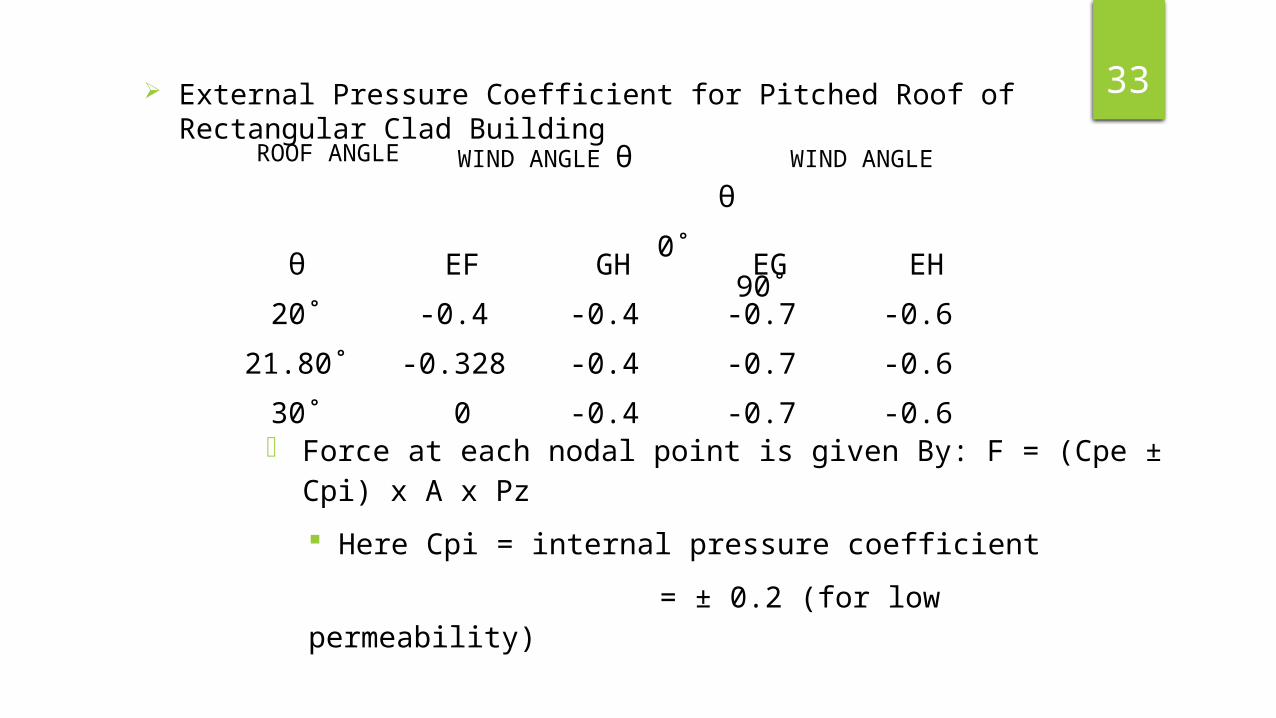
External Pressure Coefficients for pitched roof of rectangular clad building
(Table-5)
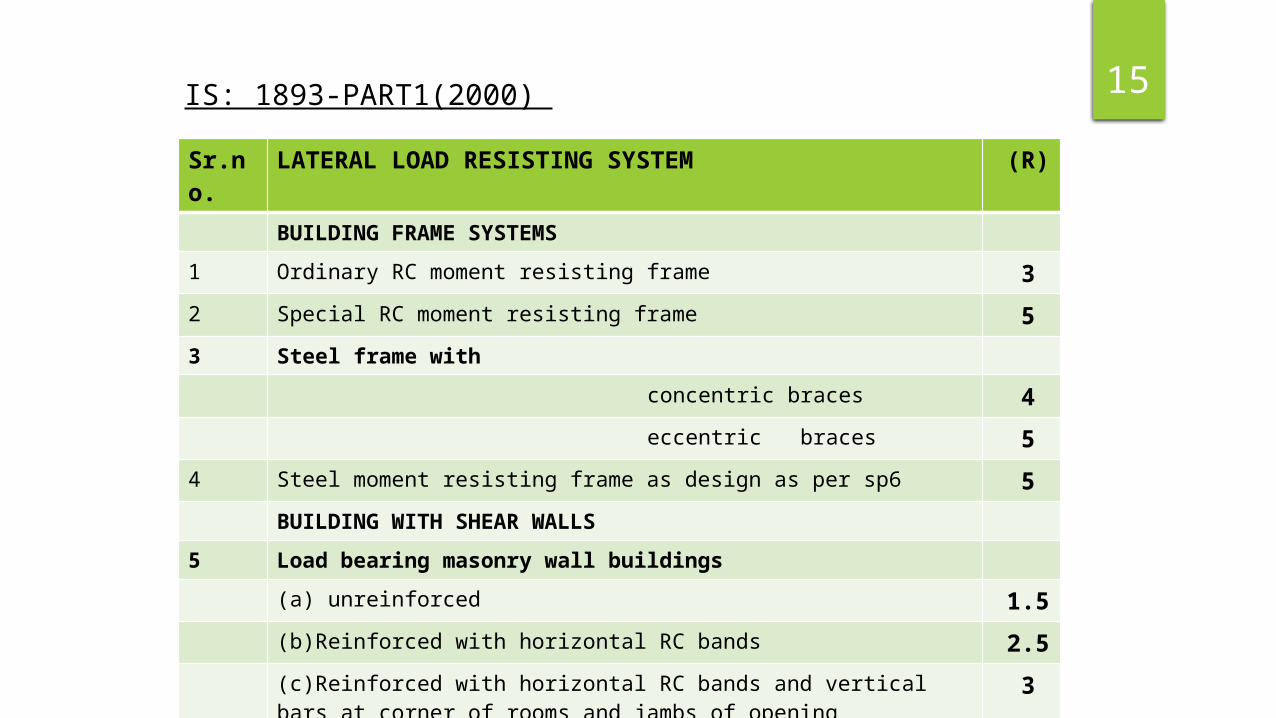
15Sr.no. LATERAL LOAD RESISTING SYSTEM (R)
BUILDING FRAME SYSTEMS
1 Ordinary RC moment resisting frame 32 Special RC moment resisting frame 53 Steel frame with
concentric braces 4 eccentric braces 5
4 Steel moment resisting frame as design as per sp6 5BUILDING WITH SHEAR WALLS
5 Load bearing masonry wall buildings
(a) unreinforced 1.5(b)Reinforced with horizontal RC bands 2.5(c)Reinforced with horizontal RC bands and vertical bars at corner of rooms and jambs of opening
3
IS: 1893-PART1(2000)
16EVALUATION OF RESPONSE REDUCTION FACTOR
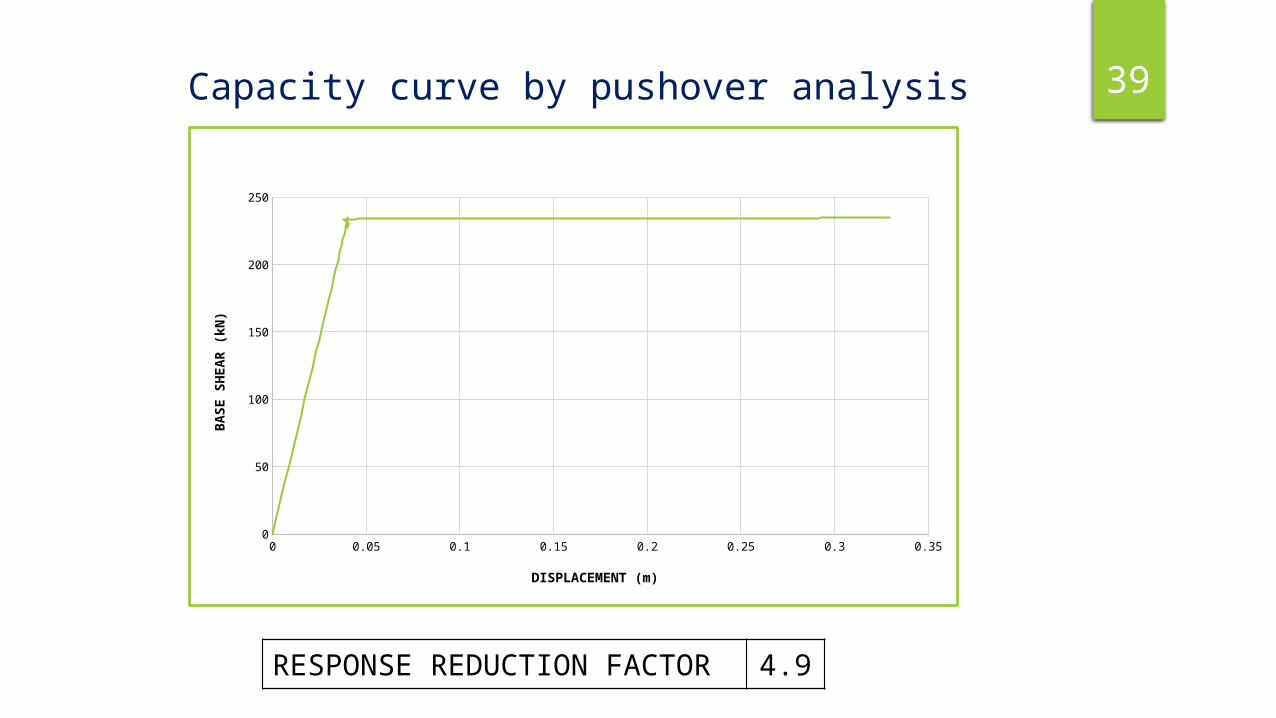
Evaluation of response reduction factor is carried out by force-displacement behavior of building.
This relationship describe the response of the building frame subjected to monotonically increasing displacements.
To achieve yield forces and yield displacement this non linear relation is often approximated by an idealized bilinear relationship.
Two bilinear approximation methods are widely used, both the methods will generally produce similar results.
17(1) Pauley and priestley
• Elastic stiffness is based on the secant stiffness of the
frame, calculated from the force displacement curve at
the force corresponding to 0.75 Vy.
(2) Equal energy concept
• This method is assumes that the area enclosed by the
curve above the bilinear approximation is equal to the
area enclosed by the curve below the bilinear
approximation.
18
Pushover analysis is a static nonlinear procedure to analyze the seismic performance of a building.
In this method, analysis is carried out under permanent vertical loads and gradually increasing lateral loads to estimate deformation and damage pattern of structure.
(I) Force Controlled
(II) Displacement Controlled
To obtain the exact response of the building or force-displacement behavior of building, it is recommended to perform nonlinear analysis.
Pushover analysis
19 Apply gravity loads and conduct static analysis:
DL+(0.25 OR 0.3)LL
Base
She
ar , V
Roof Displacement, d
Apply lateral loads to the structure in proportion to the selected load pattern:
Base
She
ar , V
Roof Displacement, d
dV
Moment
Curvature
Calculate member forces under the applied lateral load and gravity load combination – check for yielding in the members:
Base
She
ar , V
Roof Displacement, d
dV
Moment
Curvature
Record the base shear V and roof displacement d:
Base
She
ar , V
Roof Displacement, d
dV
Moment
Curvature
Repeat Steps to for increments of lateral load:
Base
She
ar , V
Roof Displacement, d
d
Moment
Curvature
⑥ Repeat Steps to for increments of lateral load:
Base
She
ar , V
Roof Displacement, d
d
Moment
Curvature
⑦ Repeat Steps to for increments of lateral load:
Base
She
ar , V
Roof Displacement, d
d
Moment
Curvature
⑧ Repeat Steps to for increments of lateral load:
Base
She
ar , V
Roof Displacement, d
d
Moment
Curvature
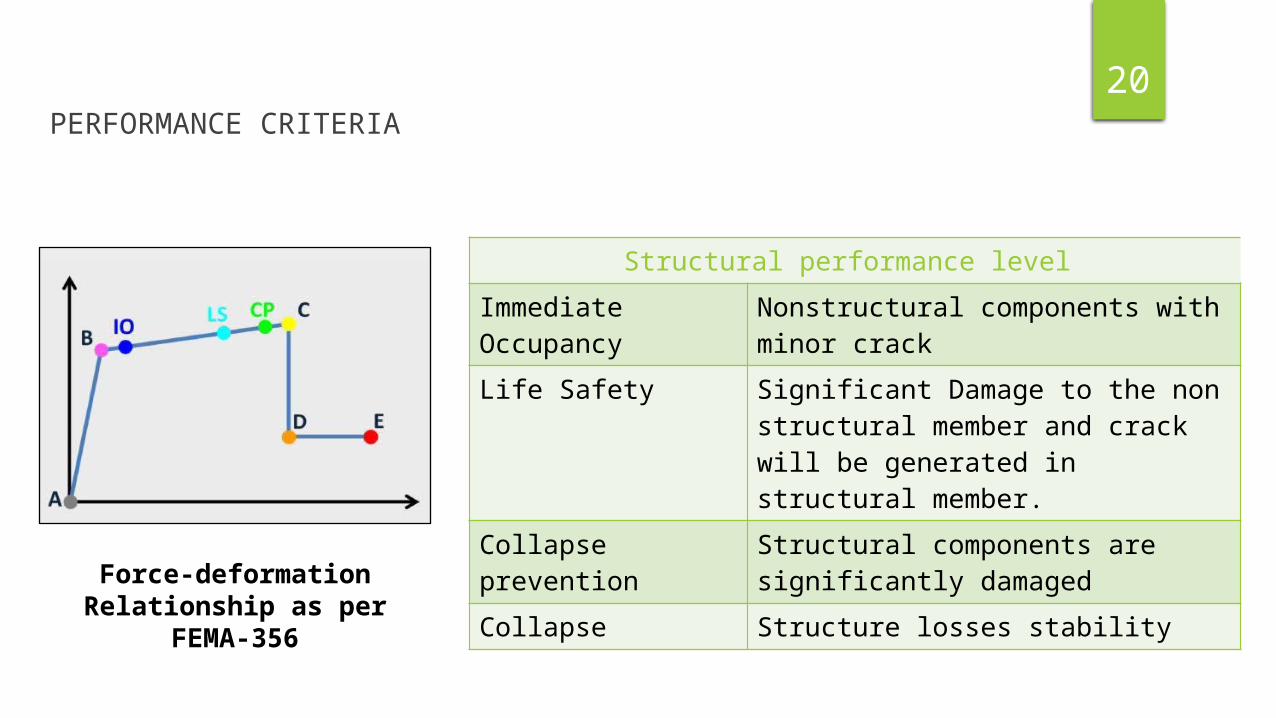
20PERFORMANCE CRITERIA
Structural performance level
Immediate Occupancy Nonstructural components with minor crack
Life Safety Significant Damage to the non structural member and crack will be generated in structural member.
Collapse prevention Structural components are significantly damaged
Collapse Structure losses stability
Force-deformation Relationship as per FEMA-356
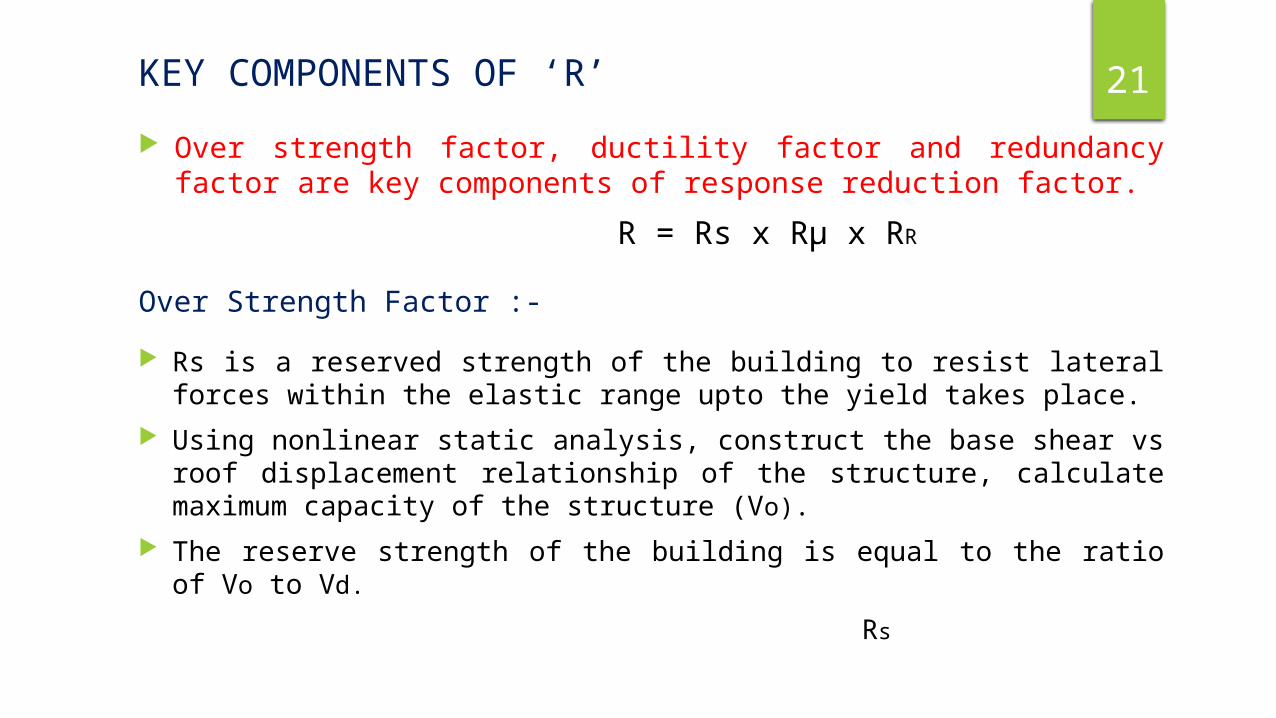
21KEY COMPONENTS OF ‘R’
Rs is a reserved strength of the building to resist lateral forces within the elastic range upto the yield takes place.
Using nonlinear static analysis, construct the base shear vs roof displacement relationship of the structure, calculate maximum capacity of the structure (Vo).
The reserve strength of the building is equal to the ratio of Vo to Vd.
Rs
Over Strength Factor :-
Over strength factor, ductility factor and redundancy factor are key components of response reduction factor.
R = Rs x Rμ x RR
22 The ability of the building frame to be displaced beyond the elastic limit, while
resisting significant load and absorbing energy by inelastic behavior is termed as ductility.
Displacement ductility is defined as the ratio of ∆m to ∆y.
Newmark and hall (1982) The relationship derived for Rμ as a function of μ, for short, intermediate and long
period structures is presented below:
Ductility Factor :-
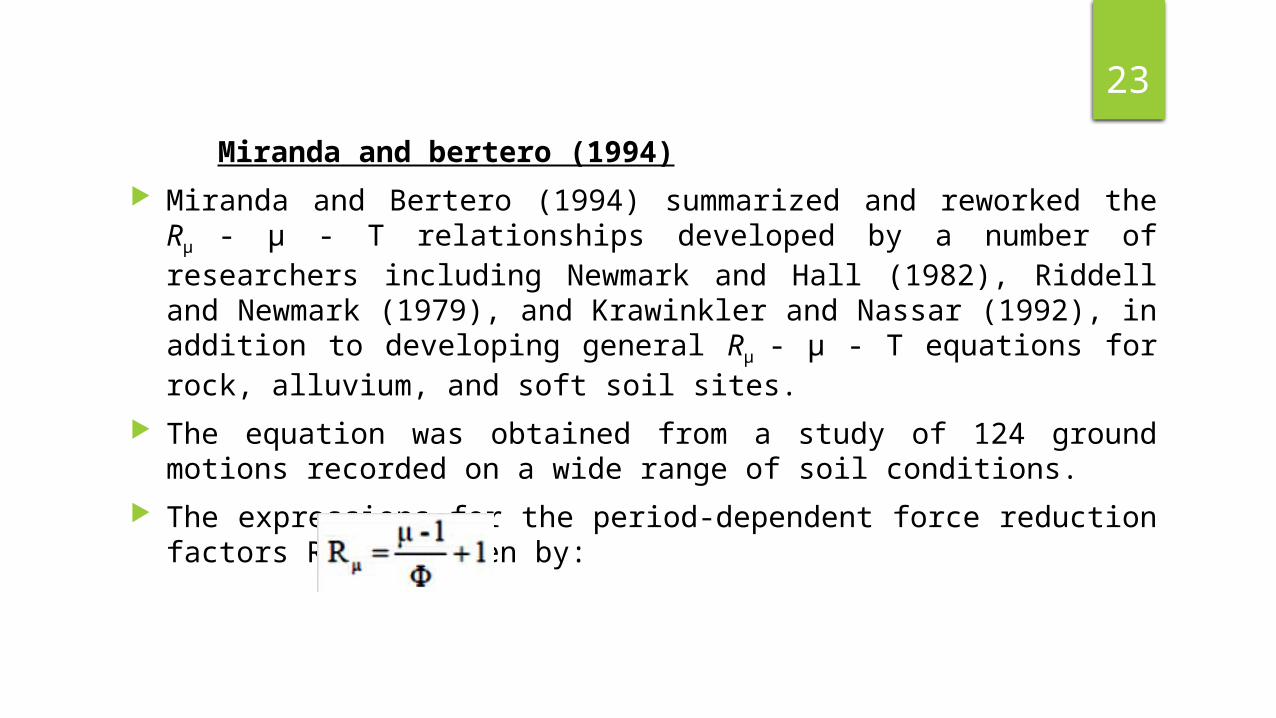
23 Miranda and bertero (1994) Miranda and Bertero (1994) summarized and reworked the Rμ - μ - T relationships
developed by a number of researchers including Newmark and Hall (1982), Riddell and Newmark (1979), and Krawinkler and Nassar (1992), in addition to developing general Rμ - μ - T equations for rock, alluvium, and soft soil sites.
The equation was obtained from a study of 124 ground motions recorded on a wide range of soil conditions.
The expressions for the period-dependent force reduction factors Rμ are given by:
24 Where Φ is calculated from different equations for rock, alluvium and soft sites as
shown below:
where, Tg is the predominant time period of the ground motion.
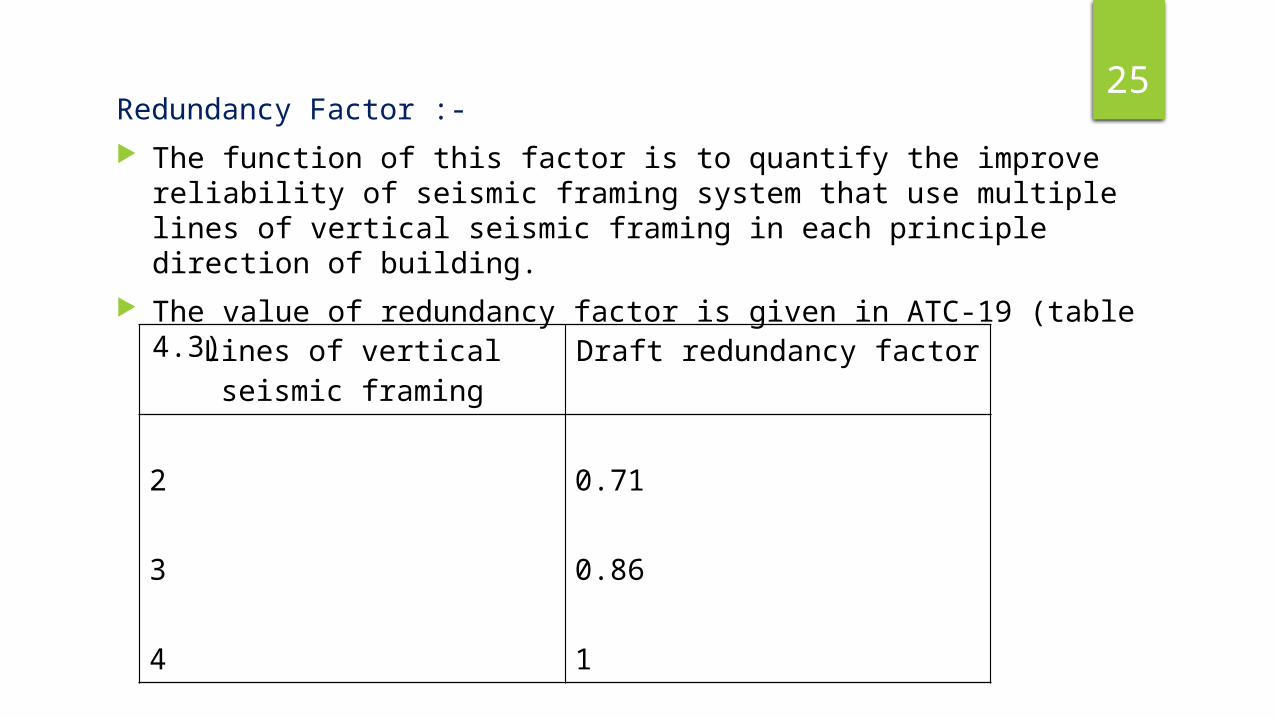
25 The function of this factor is to quantify the improve reliability of seismic framing
system that use multiple lines of vertical seismic framing in each principle direction of building.
The value of redundancy factor is given in ATC-19 (table 4.3)
A study of the variation of Response Reduction Factor with different span sizes and number of bays in length for both single bay and multi bay is conducted.
In both single bay truss system and multi bay truss system it is observed that as the number of bays increases the R factor tends to decrease.
Lateral dimension of building normal to the applied lateral forces influences the Response Reduction Factor.
Multibay frames exhibit lower response reduction factor as compare to singlebay frames.
The shorter frames exhibits higher R values compared to longer frame. The R factor for single bay truss system is varies from 3.9 to 5.23 and for multi bay
truss system it is varies from 2.96 to 5.03.
44FUTURE SCOPE OF STUDY
Performance Evaluation of the structure can be done by dynamic nonlinear method. The present study has not considered the effect of soil structure interaction. In the elements of structure, hinge modeling can be done as fiber modeling. The present study can be extended to frame with different height of building.
45REFERENCES
N. SUBRAMANIAN, Design of Steel Structure, Oxford University Publication. H.J.Shah (2009), Design of Reinforced Concrete Structure Vol.1, Charotar Publication. IS 456 (2000) Indian Standard for Plain and Reinforced Concrete - Code of Practice, Bureau
of Indian Standards, New Delhi. 2000. IS: 800-2007, “Code of Practice for General Construction in Steel”. IS: 875-1987(part-3),Code of Practice for Design Wind Loads For Buildings And Structures. Design Aids for Reinforced Concrete to IS 456-1978, Bureau of Indian Standards, New
Delhi. 2000. 1988 NEHRP
46
ATC 40 (1996) Seismic Evaluation and Retrofit of Concrete Buildings: Vol. 1.Applied Technology Council. USA.
ATC 19 (1995) structural standards modification factor by applied technology of council, (redwood city california)
Krawinkler, H. and Nassar, A. (1992) Seismic design based on ductility and cumulative damage demands and capacities. In: Nonlinear seismic analysis of reinforced concrete buildings, New York, USA. p. 27–47.
Park, R. 1988. Ductility evaluation from laboratory and analytical testing. Proceedings of the 9th World Conference on earthquake Engineering, Tokyo, Japan Vol.VIII, pp.605-616.
Minnu M M (MAY-2014), Evaluation of Response Reduction Factors for Moment Resisting RC Frames , M.Tech Thesis, NIT Rourkela.
Adeel Zafar (2009) Response Modification Factor Of Reinforced Concrete Moment Resisting Frames In Developing Countries, Master of Science in Civil Engineering Thesis, University of Illinois at Urbana-Champaign.
IS 1893 Part 1 (2002) Indian Standard Criteria for Earthquake Resistant Design of Structures. Bureau of Indian Standards. New Delhi. 2002.