77
"IECHNIA19 RPMR ""R AFT NIS EV 'U SFp~p~pr, 1968 DEPARTMENT OF TRANSPORTATION FEDERAL AVIATION ADMINSTRATION Office of Noise Abatement Washiflton D.C. 2I0590 i A R

"IECHNIA19 RPMR
""R AFT N IS EV 'U
SFp~p~pr, 1968
DEPARTMENT OF TRANSPORTATIONFEDERAL AVIATION ADMINSTRATION
Office of Noise AbatementWashiflton D.C. 2I0590
i A R

TECHNICAL REPORT
AIRCRAFT NOISE EVALUATION
550-003-03H
FAA-NO-68-34
WILLIAM C. SPERRY
SEPTEMBER 1968
Distribution of this document is unlimited. This docurbent doesnot necessarily reflect Federal Aviation Administration policyin all respects and it does not, in itself, constitute a stand-ard, specification, or regulation.
FEDERAL AVIATION ADMINISTRATIONOFFICE OF NOISE ABATEMENTTechnical Support Staff
Washington, D. C.
i

AB STRACT
The Federal Aviation Administration, in response to Plj.lic Land 90-411.,
has begun the rulemaking process leading to the certificati~ln of aircraftP
for noise. The basic element in the reguiatio)n critezipa is tlte nloise
evaluation measure designated as effective perceived noise leve., EPNL,
which is a single number evaluator of the subjective effects of aircraft
noise On human beings. Simply stated, EPN',' consis.ts of instantnecovi,
erceived noise level corrected foi tones and durationi. The history of
the development of EPNL is presented and a criticaL evaluation. of it's
validity is made, The couputational procedures are described in deta
including both integration and approximate methods for calculating
duration corrections. Examples are given. in the appendices.

TABLE OF CONTENTS
Section Page
Abstract iii
Table of Contents vList of Illustrations viiList of Tables ixList of Symbols xi
1. Introduction 1
2. Noise Evaluation Procedure 3
3. General Concepts 5
4. Complexities 7
5. Completeness 9
6. Exactness 11
7. Prediction 17
8. Perceived Noise Level 19
9. Tone Correction 23
10. Maximum Tone Corrected Perceived Noise Leve' 29
11. Integrated Duration Correction 31
12. Approximate Duration Correction 33
13. Effective Perceived Noise Level 35
14. Summary 37
15. References 39
Appendix
A. Mathematical Formulation of Noy Table Al
B. Examples of Perceived Noise Level Calculations BI
C. Examples of Tone Correction Calculations Cl
D. Examples of Duration Correction Calculations Dl
E. Approximate Methods El
v

LIST OF ILLUSTRATIONS
Figure Pg
8.1 Perceived Noise Level as a Function of Noys 21
10.1 Perceived Noise Level Corrected for Tones as 30Function of Aircraft Flyover Time
Al Sound Pressure Level as a Function of Ioys A4
Example of Sound Pressure Level S-ectruim
(a) Turbofan Engine B2
(b) Turbojet Engine B3
Cl Example of Adjusted Background Zcjnd k'e-sure
Level Spectrum
(a) Turbofan Engine C4
(b) Turbojet Engine C5
D1 Examples of Miscellaneous Flyover Curves with15-Sec. Duration Times D3
D2 Examples of Triangular -lyover Curves with Di -ferent Duration Times D4
D3 Examples of Haystack Flyover Curvs with 15-S. c.
Duration Times D5
D4 Flyover Curve for DC-8
(a) Takeoff at 980 Feet Altitude D6
(b) Landing at 305 Feet Altitude Di
D5 Flyover Curve for DC-9
(a) Takeoff at 1,000 Feot Altitude Dt
(b) Landing at 430 Feet Altitude D9
D6 Flyover Curve for 727
(a) Takeoff at 925 Feet Altitude D!O
(b) Landing at 358 Feet Altitude DII
vii

LIST OF I-L~U6TRATIONS
Fur e Page
El Differer'e Between EPNL and Max. PNL as aFunctisn of Altitude
0(.) in',egrate' Duration Calculation E6
(b) Approximate Duration Calculation H7
E2 D tn Detween EPNL and Peak PNL as aFunction of Altitude
(a) Integrated Duration Calculation E8
(b) Approximate Duration Calculation E9
viii

LIST OF TABLES
Table Page
8.1 Noys as a Function of Sound Pressure Level 20
9.1 Tone Correction Factors 27
Al Constants for Mathemati,,aliy For'mulated Noy Values A5
Cl Example of Tone Correction Calculation
(a) Turbofan, Engine C2
(b) Turbojet Engine C
DI Comp~arison -)f Duration Correction Factors Obtained D12by Various Calculation Methods
A4vtrraft W'vover Characteristics. Data from E3Hecker and Kryter, Reterence 4-..
E2 Objective Eveluations of Aircraft Flyover Noise
(a) Data from Hecker and Krytei, RefeLrence 21 E4
(b) Data from Yrytcr, Reference 22 E5
ix

LIST OF SYMBOLS
Symbol Unit Description
ant - Antilogrithm to the Base 10.
C dB Tone Correction. The factor to be added to PNL toaccount for the presence of discrete frequencies.
d sec Duration T.me. The length of the significant noisetime history; it is the time interval between thelimits of t(l) and t(2).
D dB Duration Correction. The factor to be added toPNLM to account for the time history of the noise.
EPNL dB Effective Perceived Noise Level. The value of PNL(1) adjusted for both the presence of discrete frequencies
and the time history.
f(i) Hz Frequency. The geometrical mean freque-ncy in thei-th ;,LI-Lhird octave band.
F(i) dB Delta-dB. The difference between the .rigJnal andbackground sound pressure levels in the i-th one-third octave band.
h dB dB-Down. The level to be subtracted from PNIkwhich defines the significant noise time history.
(i) Frequency Band Index. The numerical indicator whichdenotes any one of the 24 one-third octave bandsfrom 50 to 10,000 Hz.
(k) Time Increment Index. The numerical indicator whichdenotes the number of equal time increments thathave elapsed from a reference zero.
log Logarithm to the Base 10.
log n(O) Noy Discontinuity Coordinate. The log n value ofthe intersection point of the straight lines rep-resenting the variation of EPL with log n.
MM1) Noy Inverse Slope. The reciprocals of the slopes ofM(2) the straight lines representing the variation of SPL
with log n.
(1) It is common practice to use the designation EPNdB for tht unit of ef-fective perceived noise level instead of dB.
xi

n(i) noy Perceived Noisiness. -The perceived noisiness at
a given instant of time that xcura in the i-th
one-third octave band.
n noy Maximum Perceived Noisiness. The maximum value of
all of the 24 "alues of n(i) that occurs at a giveninstant of time.
N noy Total Perceived Noisineqs. The total perceivednoisiness at any given instant of time calculatedfrom the 24-instantaneous v%lues of n(i).
OASPL dB Overall Sound Pressure Level. The sound pressurelevel that occurs at i given instant of time overall of the 24 one-third octave bands from 50 to10,00 Hz.
p(l) Noy Slope. The slopes of the straight lines rep-p(2) resenting the variation of SIL with log n.
PNL(k) dB Perceived Noise Level. The perceived noise level(2) at the k-rh increment of time calculated from th:
,24-instantaneous values of SPL(i).
FNU dB Maximum Perceived Noise Level. The maximum valu,(2) of PNL(k) which occurs during the aircraft flyov r.
PNLP dB Peak Perceived Noise Level. The perceived noise(2) level computed from the highest levels reached it
each of the one-third octave bands irrespective
of time. It is commonly referred to as composit!perceived noise level.
P NLT(k) dB Tone Corrected Perceived Noite Level. The value of(2) PYL adjusted for the presence of discrete frequenicies
that occurs at the k-th incrimen- of time.
PNLTM dB M4&ximum Tone Corrected Perceived Noise Level. The(2) maximum value of PNLT(k) which occurs during the
aircraft flyover.
s(i) dB Slope of Sound Pressure Level. The c' ange in levelbetween adjacent one-third oct&ve bai pressurelevels at the i-th band.
(2) It is common practice to use the designation PN6B for th, uni, of per-ceived noise level instead of dB.
xii

Symbol Unit Debeription
As(i) dB Change In Slope of Sound Pressure Level.
s'(i) dB Adjusted Slope of Sound Pressure Level. Thechange in level betweeA adjacent adjusted one-third octave band sound pressure levels at thei-th band.
;(i) dB Average Slope of Sound Pressure Level.
SPL(O) dB Noy Discontinuity Coordinate. The SPL value ofthe intersection point of the straight linesrepresenting the variation of SPL with log n.
SPL(1) dB Noy Intercept. The intercepts on the SPL-axisSPL(2) dB of the straight lines representing the variation
of SPL with log n.
SPL(i) dB Sound Pressure Level. The sound pressure level ata given instant of time that occurs in the i-thone-third octave band.
SPL'(i) dB Adjusted Sound Pr.essure Level. The first npproxi-mation to background level in the i-th one-thirdoctave band.
SPL"(i) dB Background Sound Pressure Level. The finai approxi-mation to background level in the i-th one-thirdoctave band.
t sec Flyover Time. The length of time measured from areference zero that has elapsed during the aircraftflyover time history.
t(l) sec Time Limit. The beginning and end of the significantt(2) noise time history definee by h.
At sec Time Increment. The equal lnrements of time forwhich PNLT(k) are calculated.
T sec Normalizing Time Constant. The length of time usedas a reference in the integration method for couput-ing duration corrections.
xiii

1. INTRODUCTION
The aircraft noise legislation recently passed by the 90th Congress,Reference 1, delegates to the Federal Aviation Administration theauthority and responsibility to certificate aircraft for noise. Therule-making process will consist of a number of formal steps beginningwith a notice of proposed rule-making (NPRM) and ending with issuanceof a noise certification regulation. During each of the steps, thegeneral public and the aviation community (airport, airline, and air-craft operators and aircraft manufacturers) will be solicited fortheir inputs in order to arrive at the most equitable noise regula-tion. The public must be sufficiently protected from the noise en-vironment so that it will be neither harmful not unnecessarily annoy-ing and the aviation comnunity must be permitted to function in areasonably efficient manner.
Initially, the regulation will not be ideal because compromises willhave to be made. The public will be subjected to more annoyance andthe aviation community will operate less efficiently than each wouldprefer. However, in order to reflect the results of experience andresearch advancements, the regulations will be revised periodicallywith the objective of maintaining maxinum equity and to insure thatthe improved state-of-the-art of noise abatement is translated intoengine/aircraft design at the earliest practical date. The noise
regulatory process, with the understanding and cooperation of thepublic and the aviation community, can be an effective mechanism foraiding the orderly growth of the aviation industry. It i s conceiv-able that aircraft noise exposure ultimetely can be confined to areasand controlled to levels acceptable to all concerned.
The formal process of noise certification has begun for the FAA onlysince the regulation authority has been granted. However, in antici-pation of this, considerable informal effort has been devoted, for thepast three years, to aircraft noise evaluation, measurement, and cri-teria as related to certification. Reference 2 clearly indicated tothe aviation community that aircraft noise regulation authority wasbeing sought by the FAA. The work of Woodall and his scientific ad-visors, Reference 3, yielded six informal documents on the criteriaand technology being considered by the FAA. References 4, 5, and 6emphasized and extended the Woodall documents and Reference 7 presentsthe results to date of the preliminary international agreements among
the British, French, and United States Governments. Thus, at leastfourteen informal or semi-formal documents on proposed FAA noise cer-tification plans have been made available to the aviation communiLyby means of technical societies, task forces, and direct mailingsThe comments of the aviation community were solicited and they wereinvited to submit technical data either in support of -r against thecriteria and technology proposed in each document. As i result,each document was a refiniement over the previous one d representedthe current state-of-the-art as interpreted by the FAA.
Preceding Page Blank

Much of the work of Woodall, Reference 3, including the concept ofeffec..iVe perceived noise level, contributed to the development ofinternational standards, Reference 8. The particular definition ofeffective perceived noise level F en in Reference 8 is the oneadopted in the Tripartite agreement of Reference 7 and, with Refer-mnce 9, accepted by the FAA as, indicative of the best: current state-of-the-art.
The purpose of this report is to put into definitive forms all ofthe aizcraft noise evaluation proi-edures considered most valid atthe preses.. time including those portions of References 8 and 9that are applicable. Criteria relating to noise levels, d-istances,and aircraft weight and operation are not included here since theyproperly belong A.n the NPR14i and all subsequent formal rule-makingdocurents. Also omitted are measurement procedures which are in-cluded in a companion report, Reference 10. This report and Re-f-erence 10 are the latest evolvements of the informal docunentsinitiated by Woodall for the purpose of supporting for--.. reguiationdocuwants issued by the FMA leading to the certification of aircraftfor noise.
2

2. NOIM EVALUATION PROCEDURE
The total objective evaluation of the subjective effect of aircraftnoise is designated "effective perceived noise level" and is derivedfrom physical measurements of the spectral and temporal variationsof sound pressure level. Three basic physical properties of soundpressure must be measured; level, frequency distribution, and timevariation. More specifically, the instantaneous sound pressure levelin each of 24 one-third octave bands of the noise is required for anumber of consecutive increments of time during the aircraft flyover.
The method presented in this report for calculating effective per-ceived noise level is identical to that given in the recommendedinternational standards, References 8 and 9. However, the symbolsare different and are chosen to be more compatible with those incommon usage in the United States. Acoustical technology, especiallythe subjective aspects, have eipanded too rapidly for standard term-inology to keep pace. As a risult, recent publications almost alwayscontain some terms or symbols newly coined and this one is no ex-ception. It is Important, therefore, that lists of symbols be in-cluded and definitions be supplied for all unusual terminology. Thelist of symbols contained here includes brief but sufficient defini-tion to avoid conceptual conflicts among the various quantities.More detailed definitions are given in SAE ARP 865, Reference 11;Kryter, Reference 12; and SAE Draft ARP 1071, Reference 13. Thesymbols used here are often in multi-letter form and have no sub-scripts. Where a subscript would normally be used to identify oneof many quantities, a parenthetical expression is appended. Forexample, SPL(i) means the sound pressure level at a given instantof time that occurs in the i-th one-third octave band. The reasonfor choosing symbols that can be written on a line without suppres-sion is strictly for simplicity in manuscript typing. Very little,if any, confusion should result and the added simplicity might helpminimize errors. Computer print-outs are generally in this form,so most investigators should not find it strange.
The calculation method which utilizes physical measurements of noiseto derive subjective response is detailed in Sections 8 through 13 andsupporting information and examples are given in Appendices A throughE. The method) which conforms to the recommnended international stand-ards, References 8 and 9, consists of the following five steps:
(I) Instantaneous perceived noise levels are calculatedfor each noise spectrum occurring at consecutive incre-ments of time during the aircraft flyover. The calcula-tion method uses 24 one-third octave bands of sound pres-sure level similar to the SAX ARP 865 method of Reference11, but uses instantaneous instead of peak values anduses the noy modifications of Pinker, Reference 14.
3

(2) A correction factor is calculated for each spectrum toaccount for the subjective response to the presence ofthe maximmu tone. The tone correction method is identi-cal to that developed by Bishop, Reference 15, but ispresented with different symbol. and format.
(3) The tone correction factor is added to the perceivednoise lel to obtain tone corrected perceived noiselevels at given instants of time. The instantaneousvalues of tone corrected perceived noise level areplotted with respect to time, and the n&imum value isdetermined.
(4) A duration correction factor is conputed by integrationunder the curve of tone corrected perceived noise levelversus time or by using an alternate approximate method.
(5) Effective perceived noise level is determined by the
algebraic sum of the maximum tone corrected perceivednoise level and the duration correction factor.
4

'[". 3. GENERAL CONCEPT
Effective perceived noise level, simply stat4d, consists of instantan-
eous perceived noise level corrected for tones and flyover duration.kThis general concept is considered by the FAA Office of Noise Abatement
to be reasonable and valid. Furthermore, the five-step proceeuredescribed above, which is identical to that recomnended by the Inter-national Standards Organization, References 8 and 9, which forms partof the Tripartite agreement, Reference 7, is considered by the FAAOffice of Noise Abatement to be the best current state-of-the-art.
Most members of the aviation comnunity have supported the concept ofeffective perceived noise level in principle; that is, some form ofperceived noise level corrected for tones and duration but have notnecessarily advocated any particular calculation method. SAE Co itteeR2.5, Reference 16, states: "... The EPNL scale is believed to rateaircraft noise quantitatively better than any other scale presentlyin use for this purpose... The method of calculating EPNL is not con-sidered to be finalized at this date. It is believed to be a betterscale for use in relating complete aircraft flyover noise cycles toeach other than peak PN... " SAE Committee A-21, Reference 17, intro-duces some reservations by stating: "... Comnittee A-21 indicated itsunanimous support of the concept of Effective Perceived Noise Level,but expressed reservations concerning the lack of agreement on detaileddefinition of this unit..." The Aerospace Industries Association, Ref-erence 18, introduces a negative opinion by stating: "1... Further,while the AIL supports in principle a unit of measure similar to EPNL(EPNdB), we are convinced that this unit as described in your proposalis not suitable for Noise Certification purposes at this time.. ."
Also, the Aerospace Industries Association in a later letter, Reference19, adopts a regressive point of view by stating: "... AIA members ex-
pressed strong opposition to EPNL for certification purposes until suchtime that en-ineering experience is acquired in predicting and measur-ing flyover noise using this unit... AIA members recommended that PNLbe used for certification..."
The criticism that has been leveled by some of the aviation communitymembers at the calculation methods of References 3, 8, and 9, is onthe basis that they are (1) too complex, (2) not complete, (3) notexact, and (4) unsuitable for prediction. No alternatives have beenproposed, however, except the concept of peak perceived noise levelgiven in SAE ARP 865, Reference 11, or a curve of maximum perceivednoise level modified by an aircraft altitude correction factor presentedby the AIA, Reference 19. The latter is similar to a prediction curveused by SAE Conuittee R2.5, Reference 16. Neither of these alternativesis satisfactory to the FAA Office of Noise Abatement because they retro-gress from the basic concept which most members of the aviation communityprofess to support. Peak or maximum perceived noise level contaiIns noadjustments for tones and duration.
5

The basis for .he AIA curve, submitted to the FAA in the meeting ofReference 20, indicated so much data scatter than an envelop, insteadof a angle line curve, would be more appropriate. This subject isdiscussed in more detail in Appendix E where the results of recet __tests are presented in Figures El(a), (b), (c), and (d). Furthermore,the AIA, Reference 19, states that the recommended curve is based uponthe noise of two different types of current engines, both from thesame manufacturer, some with a specific tone and some without. How-ever, noise certification is directed primarily toward new aircraft,many of which may have propulsion cycles and lifting devices generat-ing sounds substantially different in character from current aircraft.Everyone concerned believes that tones and duration are legitimateevaluation factors, consequen£1y, the noise certification rule shouldicognize these factors now to insure the control of potentially ob-
noxious sounds of the future.
The particular aspects of the criticism directed to the calculationmethods, complexities, completeness, exactness, and prediction, areexamined in depth in the following four section3.
6

4. COMPLEXITIES
The FAA Office of Noise Abatement recognizes that the five-step pro-cedure is cumbersome and that effort should be devoted to simplifying
the calculation method. Nevertheless, procedures equally or morecomplicated have been programmed for electronic computers which thenpermitted results to be easily obtained in a routine manner; e.g.,Recker and Kryter, References 21 and 22.
One objective of this report is to clarify the ISO procedure ofReferences 8 and 9 by casting it in terms familiar to the Americanaviation conunity, using a slightly different format, and supplyinga number of examples. It may then be apparent that the calculationmethod is not too complex and can be programd for electronic com-putation without great difficulty. It would be very desirable, of
course, to have a procedure which would yield acceptable resultsfrom simple techniques of sound measurement and data analysis andwhich could be evaluated in short order by hand calculations. Thisis an ideal which, probably, never will be realized because it isunrealistic. There is no reason to expect that equipment as complexas aircraft, where virtually every design aspect utilizes highly so-phisticated technology, should have any the less complex noise sig-nature consisting of spacial, spectral, and temporal variations ofsound pressure.
The noise signature and its mechanisms of generation and suppressionmay well be one of the least understood characteristics of aircraft.Sperry, Reference 23, examines the general problem of aircraft noise,identifies it with the scientific discipline of non-linear acoustics,presents a catalog of equations of acoustics and fluid dynamics whichemphasizes the need for developing and exploiting second order theory.It is conceivable that, instead of being too complex, the proceduredoes not take into account enough noise signature characteristics topermit proper evaluation of all of the factors influencing humanresponse. For example, narrower frequency band widths than one-thirdoctave might be better. However, the five-step procedure and therelated calculation method are considered by the FAA Office of NoiseAbatement to be reasonable and amenable to modern computational tech-niques and, until further research advancements are made, the requiredmeasurements are considered necessary and sufficient for the currentstate-of-the-art.
7

5. COGPLETENESS
The FAA Office of Noise Abatement recognizes that the five-step pro-cedure is not complete and that more research is necessary on humanresponse to noise, as well as the physical mechanisms of noise genera-tion and suppression, in order to make the effective perceived noiselevel concept applicable to a wider range of sounds including sonicboom. The ultimate goal is to develop an objective procedure thatwill accurately evaluate the subjective effects of noise from all cur-rent and future transportation equipment as well as current aircraft,including high bypass engine, V/STOL, and supersonic aircraft, andautomobile, truck, railway, and air cushion ground vehicles. Consider-able noise abatement research programs and studies which have an in-fluence on effective perceived noise level have been performed, arepresently underway, and are in the planning stage.
The present form of effective perceived noise level evaluates fourfactors of the noise signature; level, broadband frequency distribu-tion, maximum tone, and duration. Other factors may be important aswell. For example, Ollerhead, Reference 24, reports on the influenceof the Dopplur shift on subjective ratings of noise from various air-craft. This effect should be explored in more detail and if signifi-cant, a Doppler correction factor should be included in a revised formof effective perceived noise level. Other spectral and temiporal char-acteristics such as multiple tones, frequency and amplituda modulationof tones, slowly varying lift pressures, and infra-sonic f-equenciesmight influence subjective response as well. These characteristicsand others ultimately will be investigated and the concept modified toinclude all influential factors. In addition, more work iq needed onthe speech interference effects of human response which up to now hasbeen concerned primarily with a mixture of loudness and anioyance.However, until such time as further research advancements are made,the FAA Office of Noise Abatement considers the four factors includedin the five-step procedure to be necessary and sufficient for thecurrent state-of-the-art.
9r1

6. EXACTNESS
The FAA Office of Noise Abatement recognizes that the five-step pro-cedure is not exact and that the objective evaluations of the subject-ive effects of one or more of the four noise signature factors cur-rently included in the procedure may need adjustment or refinement.The effects of level and frequency distribution of the broadbandportion of the spectra are determined by the first step of the pro-cedure - instantaneous perceived noise level. Very little objectionhas been raised by members of the aviation community with regard tothis aspect and what there is relates to the use of peak instead ofmaximum perceived noise level. Most of the criticism has been directedto the duration correction and very little to the tone correction.
It must be emphasized that the field of psychoacoustics is not yetan exact science and probably never will be. It deals with judgementdecisions b3; human beings on their response to such indefinite char-acteristics of noise as loudness, annoyance, noisiness, unwantedness,and speech interference. Results are obtained from statistical analyseswhich may have several interpretations and, because the tests are sub-jective, can be significantly influenced by testing bias. The lattercan result frota such causes as preconceived ideas of the principalinvestigator, :est environment, instructions to the test subjects,choice of test subjects, type of sound equipment, choice of referenceand test sounds, and methods of comparing sounds. Valid conclusionscan best be drawn from the results of many investigators who haveconducted their testing under conditions somewhat different from eachother. In this way, the testing bias and various statistical inter-pretations, which will always be present in subjective studies, willhave the opportunity to be more randomly oriented.
In its history of development, the tone correction concept has experi-enced some but not many conflicting results. The principal investi-gators in this area are practically unanimous in their agreement thatfor noise that contains audible tones, the best correlation of object-ive evaluations with subjective ratings results when some form of tonecorrection is used. They are not, however, in unanimous agreement onwhich calculation method is superior. On the other hand, the durationcorrection concept, in its history of development, has experienced con-siderable controversy. Some principal investigators are convinced thata duration correction, at least by the methods proposed for calculationso far, degrades the accuracy of subjective ratings. The pros and consof the effects on subjective ratings of both tone and duration correct-ions are presented below in the form of brief reviews of a number ofresearch papers and reports.
Little, Reference 25, reporting on investigations of steady state noisespectra with and without tones, concludes: "... The use of the PNdB
6 system does not adequately assess the annoyance of spiked noise...

Wells and Blazier, Reference 26, also reporting on investigationsof steady state noise spectra with and without tones, fcund that apure tone imposed on a broadband background increased the noisinestof the composite noise relative to the noisiness of the broadbandnoise without pure tones.
Kryter and Pearson, Reference 27, also reporting on investigationsof steady state noise spectra with and without tones found: "...The results clearly show that, for the sounds used in this study,the overall SPL or the perceived noise level in PNdB calculatedaccording to prescribed procedures would underestimate the judgednoisiness of the bands of noise containing a strong pure tonerelative to the judged noisiness of the bands of noise withoutthe pure tone; ..."
Bishop, Lyden, and Horonjeff, Reference 28, reporting on investi-gations of aircraft flyover noise, found that subjective ratingswere not influenced by flyover duration. They state: "... Littledifference was observed between approach and flyover judgementseven though the approach flyovers had, on the average, tignificantlyshorter time durations than the takeoff flyovers. These resilts,then, suggest that the possible changes in noisiness ratings producedby differences in flyover signal time duration, or by presence ofstrong pure tone components in the flyover signal; are compensatirgfactors in making compositive noisiness judgements of approach andtakeoff noise; or possibly are not factors of large enough magnitudeto require consideration in evaluating flyover noise signals of cur-rent jet aircraft ... "
Pearsons, Reference 29, investigated both the effects of durationand background noise level on the subjective ratings of aircraftnoise recordings. He concluded: "... Previous tests have shownthat an increase in the duration of an aircraft noise signal producesan increase in its judged noisiness. A combination of all previousand current data indicates that the slope showing the effect of dura-tion on perceived noisiness is continuously varying over the range ofdurations from 1.5 to 64 seconds... The examination of background noisemade during this study suggests that the presence of background noisereduces the judged noisiness of an aircraft flyover..."
Kryter, Reference 30, reports some conflicting results regarding thetone correction concept. He states: " (2) The presence of eithermodulated or unmodulated pure tones imposed on a broadband backgroundnoise did not increase the noisiness of the broadband sound withoutpure tones..." Kryter qualifies these results by pointing out thatthey are in conflict with the results of Little, Reference 25, Wellsand Blazier, Reference 26, and other unpublished work by himself cndassociates. He suggests the disagreement is associated vith the methodof judgement tests employed in the investigations of nolsiness. %heabove quoted results from Reference 30 used the method cf individualadJustmi-nts whereas the other referenced work used the r 'thcd of paired-
A icomparisons.
12
Pearsons, Reference 31, conducted judgement tests on the noisinessof helicopter noisee and compared the results with PNL, N-level, A-level,and OASPL. He concludes: "... (1) As a predictor of the noisinessof helicopter flyovers, the calculated perceived noise level providesthe most accurate measure of the four objective measures included inthis investigation. The N-level and A-level, although slightly lessaccurate, were also reasonable predictors, followed finally by the over-all SPL. (2) Duration and pure-tone correction did not improve thepredictability of the noisiness of the helicopter flyover noise samplesunder test, possibly due to inadequate duration measures or a factorin the additivity of the duration adjustment not previously tested..."
Pearsons and Horonjeff, Reference 32, reported the effects of toneand duration on the subjective ratings of aircraft noise recordings.Theyused the tone adjustment method of Reference 27 and the durationadjustment method of Reference 29 and found only slight improvementfor the adjusted perceived noise level over the peak perceived noiselevel but N-level seemed to provide the best a~asure of subjectivenoisiness. Field tests of aircraft flyovers ware also conducted andthe highest correlation between the noisiness rating scale and thephysical measures of peak PNL, A-level, N-leve! and overall SPL wasprovided by peak PNL. No increase in correlation was observed byadjusting the perceived noise level to account for the duration andpure tone content.
Williams, Stevens, Hecker, and Pearsons, Reference 33, reported thattime varying noise provided less masking of speech than steady statenoise. They also state: "... (5) If two aircraft flyovers differin duration by a factor of two, the peak level of the flyover havingthe longer duration must be 2.5 to 4.0 PNdB less than that of theother flyover if the two are to be judged equally acceptable. Thisfinding supports previously obtained data..." (Reference 29.)
Pearsons, Horonjeff, and Bishop, Reference 34, investigated subject-ive judgements of single, modulated, and multlple tones plus noise.They state: "... In general, pure tone corrections were necessary,the exception being situations in which the pure tone is added to anoctave band of noise ..." They also conclude: "... 6. The puretone corrections obtained using pure tones in broadband noise agreewith previous results; however, those obtained using octave bands ofnoise do not. 7. The maximum correction itecessary for the additionalnoisiness of a pure tone seems to occur at a tone-to-noise ratio nf25 dB as measured in a one-third octave band. Comparisons betweentones at this tone-to-noise ritio and tones without noise present arequite similar...
Wells, Reference 35, reporting on the progress of eubjective noisestudies at the General Electric Co., states: "... In the aircraftindustry in particular, the calculation of PNdB has comn into wide
13

ILsL
usage. However, it has been recognized for several years that thiscalculation doeenot agree well with actual subjective jury tests forcases where the noise spectra involve strong pure tones..."
Little and Mabry, Reference 36, discuss the state-of-the-art oT humanresponse to aircraft noise, They apr rently have no basic objectionto the tone correction concept except, perhaps, that the calculation
procedure of Reference 3 is not severe enough because they state:.... In a study just completed by Dinlap and Associates for Prattand Whitney Aircraft, the tone corrections were found to be halfthat required -o match subject's responses..." Referring to recentstudies conducted at the Boeing Co., they state: "... The use oftone corrections provided better results than PNL by itself, How-ever, in all cases, the additizr nf the duration factor increased eror...
Ollerhead, ,eference 24, conducted judgement tests on various recordedaircraft sounds, mostly from general aviation type aircraft. He foundconflicts with duration corrections and support for tone corrections.He states: "... A significant finding which the analysis revealed isthat the sound duration, defined conventionally as The interval betweenthe 10 dB-down points, has very little affect on judged noisiness ofthe sounds studied. Duration corrections when applied to five differ-ent rating methods substantially degraded the performance of thesemethods as noise predictors. The study suggests that an explanationfor this may '4e in the effects of the Doppler frequency 3hift whichhithert., has not been account/J for in any accepted rating scheme...Ignoring this Doppler shift correction, it was found that the puretone corrected perceived noise level, PNdBF, is currently the mostsatisfactory general purpose predictor of subjective noise evaluation..."
Hecker and Kryter, Refirence 21, evaluated various established and pro-puaed objective methods of measuring aircraft noise wivh respect totheir ability to predict subjective ratings of the acceptability ofnoise produced by present-day commercial aircraft. They conclude:
The smallest variance was associated with EPNdBt, a measure thattakes into account the spectral properties of a given flyover for itsentire duration and also the presence of pure tones or other narrow-band energy concentrations... The successful design of this measuremust undoubtedly be .tributed both to the integration method of cal-culeting effective perceived noise level and to the method of tunecorrection by Little. ."
Kryter, Refereuce 22, conducted judgement tests of aircraft flyov,-rnoise in conjunction with a sonic boom test program. His results sub-stantiated the conclusions of Reference 21.
Hinterkeuser and Sternfeld, Reference 17, conducted judgements on syn-thesized flight noise signatures of V/STOL aircraft. They appliedtone and duration corrections in accordance with an early revision to
14

Reference 2. They state: "... Although the statistical evaluationon Figure 15 does not show any great significant effects of the cor-r-ctiotia, thIf is not necessarily true for individual cases. In fact,these corrections can only be evaluated for those specific cases towhich corrections apply. Since the cruise operation involves elapsedtimes close to 15 qeconds, no correction is evident. The terminaloperation, however, involves substantially longer times, and an im-provement in correlation, due to inclusion of duration correction,is noted in all cases... Pure tone components are most strongly evi-dent during terminal operations of the fan lift, jet lift, and turbo-fan STOL aircraft. In these cases, a significant improvement in cor-relation is indicated by inclusion of the pure tone correction factor..."
The results of sixteen investigations on the subjective ratings ofaircraft noise were briefly reviewed for their conclusions on toneand duration corrections. Some controversy exists but the preponder-ance of evidence indicates that both tone and duration correctionsare required. Hence, the FAA Office of Noise Abatement considersthem valid as well and, until further research advancements are made,the calculation method of the five-step procedure is considered suf-ficiently exact for the current state-of-the-art.
15

7. PREDICTION
The basic problem that the aviation community has with the noise eval-uation procedure presented in this report is the inability of the manu-facturers to predict the noise of paper aircraft to the degree of re-finement implied by the procedure. It is possible, however, that theproblem of prediction refinement is overemphasized. Approximate methoasof calculation are available and others can be developed that mightyield results not too different from the more complex method. Thiswould be particularly true if sufficient noise abatement Is designedinto the aircraft to eliminate the presence of tones. The subject ofapproximate methods is discussed in more detail in Appendix E.
There are valid reasons why the noise evaluation procedure should havea high degree of refinement. First, it must be emphasized that theprocedure involves a computational method which utilizes physicalmeAsurements oO actual aircraft flyovers. And, as long as the aircraftexist and noise measurements are going to be made, it would be advan-tageous to obtain as much information on the noise signature as ispractical. Second, once this information is available, it does noharm to utilize it thoroughly even though for particular cases, lesscomplex methods might yield approximately the same answers. The cal-culation method proposed here is not difficult to apply with the aidof electronic computers and there is always the possibilit,: that newtypes of aircraft will have noise signatures that require ri ore detaile&data and sophisticated analyses to accurately evaluate subjectiveresponse then do current aircraft.
The prediction of aircraft noise can have more than one meaning andcan be accomplished in various ways. If the noise is to be predictedin terms of physical properties (such as the instAntaneous sound pres-sure level in each of 24 one-third octave bands of noise for a numberof consecutive increments of time during aircraft flyovers), the taskwill be difficult and the accuracy of the predicted level for any givenfrequency band, SPL(i), may be poor. The current state-of-the-art doe:
r not have the sophistication to include all of the effects of the mecha-Lnisms of sound generation, suppression, propagation, and radiation
necessary to accurately predict detailed physical properties. Thisis an important deficiency in the tecnnology of aircraft noise abate-ment that is recognized by all knowledgeable workers in the area andfor which substantial effort to amend is being devoted by governmentand industry.
If the noise is to be predicted in terms of subjective response suchas a perceived noise level (PNLP, PNL, PNLTh, or EPNL), the task willbe much less difficult and the accuracy much better than for the caseof physical property prediction. The subjective responsc oredictionis a single number evaluation of estimated physical properties, and thecurrent state-of-the-art is remarkably insensitive to wide variations
Preceding Page Blank
17

in Physical details. This is another deficiency which, probably,contributes to the data scatter in the psychoacoustics judgementtests and for which substantial effort to amend is also being oevotedby government and industry.
f the four perceived noise level evalua.tors listed above, the leastsensitive to physical details is peak perceived noise level, PNLP, andthe moat sensitive is effective perceived noise level, EPNL. However,there is not a great deal of difference in sensitivity between themand the issue must not be allowed to be clouded 'Ly confusing the pre-diction capabilities for hwnan response with those for detailed physicalproperties.
18
I.
I

8. PERCEIVED NOISE LEVEL
Instantaneous perceived noise level, PNL, is calculated according tor the following three-step procedure:
SeJ.
Convert each measured one-third octave band sound pressure levelfrom 50 to 10,000 Hz, SPL(i), that occurs at any given instant
of time tr nerceived noisiness, n(i), by reference to Tab>3 8.1.
The noy values, n(i). found in Step 1 are combined in the mannerprescribed by the following formula:
24
N n + 0.15 n(i) - n (8.1)
where n is the number of noys in the noisiest band and N is thetotal noy value.
Step 3.
The total perceived noisiness, N, is converted into perceived noiselevel, PNL, by means of the following formula:
PNL = 40 + 33.3 log N (8.2)
which is plotted in Figure 8.1. PNL can also be obtained by choosi.gN in the 1,000 Hz column of Table 8.1 and reading the correspondingvalue of SPL which, at 1,000 Hz, is identically equal to PNL.
The mathematical formulation of the Noy Table is given in Appendix Aand expriles of PNL calculations are given in Appendix B.
19

BSPLI One-Third Octave Bond Certer Fi'-.iuenries f, HZ
Sis In M 833 "0 M8 38 M8 M8 "a4 6m an 48 Wil 38 "M 7 " 8 40 M 14 % o
84. 1* 8.88
Table 8.1 NOYs As a Function of , 8.$ 8""
Sound Pressure Level. , :1:. .
11 : 8.a~8 8:.I - 1
': ;1 m2 l V': t, * ., :
,.. 1 4. 41 .l4 .. 61 3 d
a1.33 83 .1 7.R 7.5 .4 746 .8 8.1 ;i1 81. 88
1,,1 I.V 1,8 8.1:.3 1 p 88 & 468.
: ,. 'a. :Q:',., .
3 8A 4 : S,3 83. 1. . Ill
8. ' 11 3 8 I.S1.3:, "1.8 3 . 0
am 4.0 640:r4 6.40 tit Ibe 11.6 1: f 11 3 1 8 31. 743
SK.I I IS: . I I
"ri 'p. 1-4 M""" .T?,. TIe B-4 2
IS. I. It: lJ~ IS . I .
88 7.8 - 0 , I. .. , IS 1 a .1 .. . , 1. -,
84 34 11* r.I' I}t. 11 .1"11-0 2i8 I ,$ 4 I.: 4.
. . ...8 .. . . V . 3 ; 1 1.. ..
.31.4 18.8 .1
1 r fl. 17,) ) t.. .
47.4.3 ii. - . 1
, 1 17. ,1 . ,, . 1. .. .. .8 . 3 . . 2 , .?. , : .. .. ,, . 7 ..... , +;t wmF+ - + - ,- -. IIII-..8, : I 8" E -2Z .IN E a ; r4** V ': "i 1" 112 .'1. 3u M.i ,,., 94. r,,,.0 .
2:751.9H hi 48 W2 47 W IN 88 17 s"4S 12.4
44 .. t i a - 3 .1 N888 844 w 888 I8 1 -1 88U
at. 8 46 3, -8 4 82.
V. V+ m n__"itt
4t N 1 8 888 888li 1 81 ' 1 S 8 m 1 1 a1 0) M8 I!-
rd~~~88 18433N;U W V
IS S, "I T4 ,, 1, 188 8 8
M4 34. WM %34 7U: ... 4 1 ~ 7 88 r48888171M 8
AS. a)a it 888 37 07 .3
jI
wj- . - -H - %I4 4

z
E0;Z
CL 0
*C
v cn C4 - Go
9P~d'I~d'JO81 Q1ONPGAID-s
210

9. TONE CORRECTION
Noise having pronounced irregularities win the spectrum (for example,discrete frequency components or tones), is adjusted by the correctionfactor C calculated in accordance with the ten-step procedure definedbelow.
Step 1.
Starting with the measured sound pressure level in the 80 Hz one-third octave band (band number 3), calculate the changes in level(or "slopes") in the remainder of the 24 bands as follows:
s(3) = no value (9.1)
s(4) - SPL(4) - SPL(3) (9.2)
s(i) - SPL(i) - SPL(i-l) (9.3)
I
s(24) - SPL(24) - SPL(23) (9.4)
Step 2.
Encircle the value of the slope s(i) where the absolute value ofthe change in slope is greater than five; that is, where
a (i) s (i) - a(1-1)I 1 (9.5)
Step 3.
(a) If the encircled value of the slope s(i) is positivt and alge-braically greater than the slope s(i-1), encircle th, level SPL(i).
Preceding Page Blank
23

an-hIlpnvil spstve nfeete ee P~-)
(b) If the encircled value of the slope s(i) is zero or negative
(c) For all other cases, no level is to be encircled.
Omit all SPL(i) encircled in Step 3 and compute new levels as follows:
(a) For non-encircled levels, let the new levels equal theoriginal levels,
SPL'(i) - SPL(i) (9.6)
(b) For encircled levels, let the new level equal the arithmeticaverage of the preceding and following levels,
SI'L'(i) -1/2 [SPL(i-l) + SPL(i+l) ](9.7)(c) If the level in the highest frequency band is encircled,
let the new level equal
SPL' (24) -SPL(23) + 9(24) (9.8)
Stop 5.
Recmute new slopes including one for an imaginary 25-th band
as follows:
s'(3) - 8'(4) (9.9)81(4) - SPL'(4) - n SL(3) (9.10)
S(IM SPL'(i) -SPL'(i-l) (9.11)
s'(24) -SPL'(24) -SPL'(23) (9.12)
s'(25) -s'(24) (9.13)
24

Stev 6.
Compute the arithmetic average of the, three adjacent slopesas follows:
;(i) - 1/3 1 81(1) + s'(i+1) + s'(i+2) ](9.14)Step 7.
Comutte final adjusted levels by beginning with band number 3and prcceading to band numnber 24 as follows:
SPL"(3) - ..PL(3) (9.15)
SPL"(4) - SPI."(3) i(3) (9.16)
SPL"I(i) -SPL"I(i-l) + ;(1-1) (9.17)
SPL"(24) -SPL"'(23) + 9(23) (9.18)
Step 8.
Calculate the difference between the original and adjusted levelsI as follows:
F(i) = SPL(i) - SPL"I(i) (9.19)
and note only values greater than zero.
Step 9.
Tone correction levels C are determined for any one-third octaveband in accordance with Table 9.1. However, only the maxinxzm oneis important.
25

The maxim= value of C determined in Step 9 defines the tonecorrection that is to be added to the perceived noiEe level PNLto obtain the tone corrected perceived noise level PNLT.
Examples of the tone c :rrection prncedure are given in Appendix C.
2.
26
}-4

8 F-T 1 1 17
50-gC f O rm 500OH Z
C.0I413
2 0 Hf 5000 HZ
01f0 5 10 15 20 25
Level Difference F, ctl
Frequency Level Tonef, HZ Di ffere nc e Correction
F, dB C, dB
50migf 500 3 g;;F ~20 F/6
20 -- 'F 3 1/3
F- 3 0500 ggf g5000 3 ggF 20 F/3
20 jgF 6 2/3
Fe 305000 f -10000 3 F 20 F/6
2 0 F 3 1/3
Table 9.1. Tone Correction Factors
2 7

10. MAXIMUM TONE CORRECTED PERCEIVED NOISE LEVEL
The maxim-- tone corrected perceived noise level, PNLUI, is themaximum value determined from a smooth~curve of the values of thetone corrected perceived noise level, PNLT, calculated in accord-ance with the procedure of Section 9, plotted against the flyover
,4 time, t. Figure 10.1 is an exaqple of a flyover noise time historywhere the maximum value is clearly indicated. Half-second timeintervals, A t, will usually be small enough to obtain a satis-factory noise time history. The other symbols shown in Figure 10.1are defined in Section 11.
If there are no pronounced irregularities in the spectrum, then theprocedure of Section 9 would be redundant since PNLT would be ident-ically equal to PNL. For this case, PNLTM would be the maximumvalue of the curve of PNL versus t, that is, it would equal PNLM.
Preceding Page Blank
29
L-

U-0
aa h
d
t{1 )t(21Flyover Time t, sec.
Figure 10.1 . Perceived Noise Level Corrected for Tones as aFunction of Aircraft Flyover Time
10U

11. INTEGRATED DURATION CORRECTION
The integrated duration correction D is defined by the expression.
I t(2)
D -10 log [(lIT)] ant (PNLTIIO)dtj PNLTM (11.1)
ft:(1)
wnere T is a normalizing tim cono :.. , :,L : .: .LLX CPr,sin fLrtone corrected perceived noise level as a function of time, PNLTM isthe maximum value of the tone corrected perceived noise level, andt(l) and t(2) are the limits of the time interval d during which PNLTis within a specified value h of PNLTh. Figure 10.1 illustrates theabove conditions.
Since PNLT is calculated from measured values of SPL, there will, ingeneral, be no obvious equation for PNLT as a function of t. Conse-quently, Equation (11.1) can be rewritten with a summation sign insteadof the integral sign as follows:
d/At
D 10 log [(LIT) ~ t ant [PNLT(k)/lOH PnLTh (11.2)- k=O -'
where A t is the equal increment of time for which PNLT is calculatedand PNLT(k) is the value of PNLT at the k-th increment of time.
At this date, the following values are considered representative of thecurrent state-of-the-art for the integration procedure and are presentedas basic requirements:
T 10 sec (11.3)
At - 0.5 sec (11.4)
h - 10 dB (11.5)
Using the above values, Equation (11 .) becomes,
2d
D - 10 log [ Yant [ PNLT(k)i10] PNLTM - 13 (11.6)
k-0O
where d is the duration time defined by the 10 dB-down points.
Examples of duration correction calculations are given in Appendix D.
31

12. APPRO IhATE DURATION CORRCTI(N
The integrated duration calculation procedure presented in Section 11is considered to be most representative of the current state-of-the-art. Ibwever, an alternative method is given below which is simplerto use but yields, in general, larger duration correction values.
The approximate duration correction D is defined by the expression:
D - 10 log (d/T) (12.1)
where d is the time interval between the limits of t(l) and t(2)during which PNLT is within a specified value h of PNLTM and T is anormaliziag time constant. At this date, the following values areconsidered representative of the current state-of-the-arL for theapproximate procedure and are presented &: basic requirements:
T - 15 sec. (12.2)
h - 10 dB (12.3)
Using the above values, Equation (12 1) becomes
D - 10 log (d/15) (12.4)
where d is the duration time defined by the 10 dB-down points.
Examples of duration cotrection calculations are given in Appendix Dincluding comparisons between the two procedures.
33
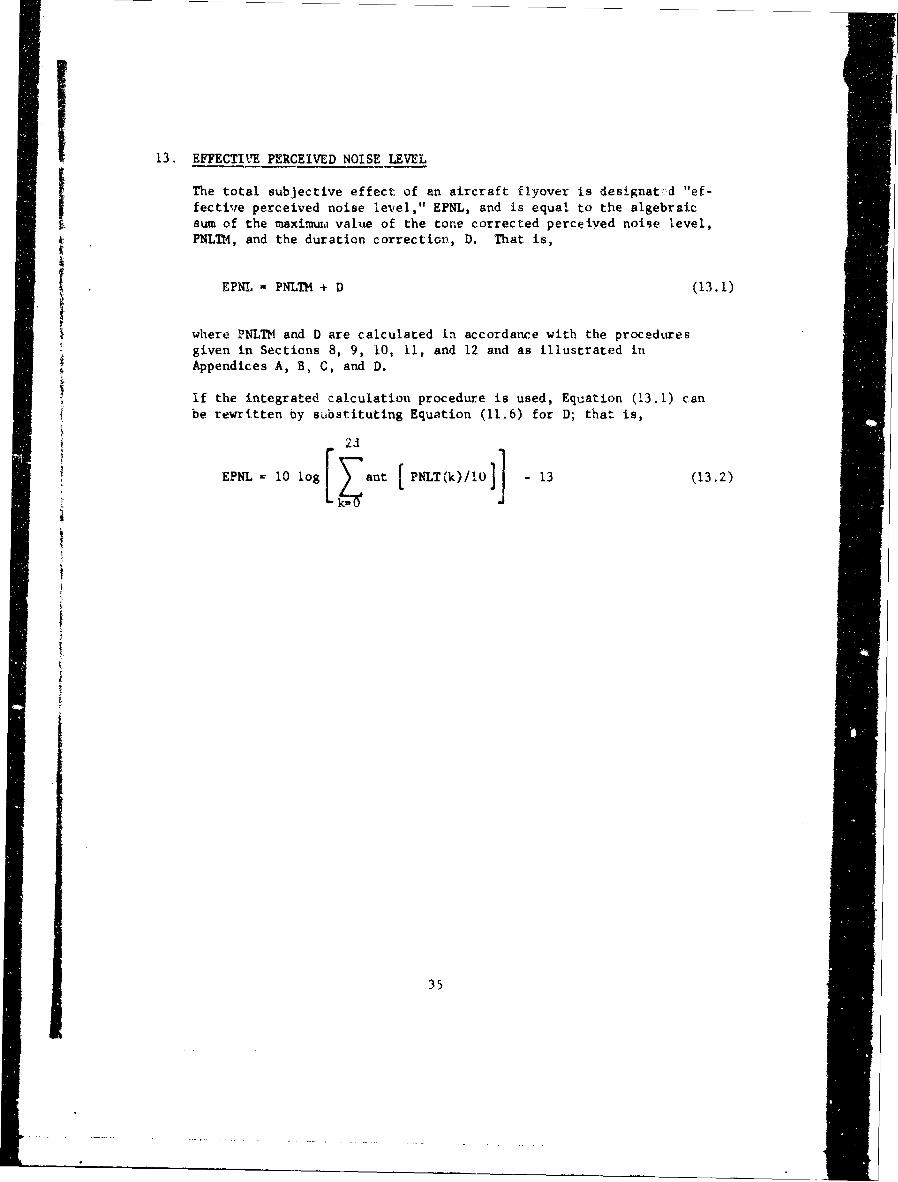
13. EFFECTIVE PERCEIVED NOISE LEVEL
The total subjective effect of an aircraft flyover is designatrld "ef-
fective perceived noise level," EPNL, and is equal to the algebraicsum of the maximum value of the tone corrected perceived noige level,
PNLTM, and the duration correction, D. That is,
EPNL = PNLTM + D (13.1)
where PNLTM and D are calculated in accordance with the proceduresgiven in Sections 8, 9, 10, 11, and 12 and as illustrated inAppendices A, B, C, and D.
If the integrated calculation procedure is used, Equation (13.1) can
be rewritten by substituting Equation (11.6) for D; that is,
2d[~23EPNL 10 log ant PNLT(k)/O - 13 (13.2)
35

14. SUMMARY
The primary eleme.. in any procedure fo,, certificating aircraftnoise is the evaluation measure upon which the criteria 13 based.Aircraft noise signatures, which involve interrelated spectral,tesporal, and spacial functions of sound pressure, are so complexthat the search for a suitable single number noise evaluator has
been long and difficult. The end result to date, considered thebest current state-of-the-art by the ?AA Office of Noise Abatement,
is effective perceived noise level, EPNL.
This opinion, however, is not shared by some members zf the aviationcomnity who would prefer a simpler evaluator such as perceived
noise level, PNL. This simpler measure responds LO the effects offrequency and level but does not permit the adjustments for the an-noyance of strong totses and long durations that are inherent in EPNL.
It is extremely imprtant that the noise evaluator chosen for certi-iication be versatile in the sense that it recognizes the annoyance
effects known today and is capable of modification or refinement forpotentially obnoxious sounds of the future. EPNL is such a unit;not complete and not exact, but the beat available at the present time.
Furthermore, it is not too complex and it is suitable for prediction.
Documentation in support of the above opinions has been presented 1nthe preceding sections. Detailed effort has been devoted to the spe~ificcriticisms proffered by those members of the aviation community thatare not in accord.
The specific noise evaluation procedure recommended by iSO, References8 and 9, has been delineated and rewritten with symbols chosen to he
more compatible with those in covmion usage in the United States.
Examples of the various couputational procedures that are basic to9PNL are given in the Apperdicer, Also included is a dis,-ussion onapproximate methods for determining EPNL which may be suitable forprediction unless the aircraft sounds of the future are radicallydifferent from those of today.
37

15. REFERENCES
1. "An Act to Amend the Federal Aviation Act of 1958 to RequireAircraft Noise Abatement Regulatiop, and for Other Purposes,"Public Law 90-411, 90th Congress (H. R. 3400 and S .707),July 21, 1968.
2. "Proposed FAA Maximum Allowable Noise Levels to be Required for
* Certification of Future Aircraft," Enclosed with letter byJoseph D. Blatt, September 1, 1966.
3. Woodall, J. F., and Advisors, "Aircraft Development ServiceProposal for FAA Noise Certification Criteria," Sixth Revisionto Reference 1, February 1, 1968.
4. Hoover, I. H., "Aircraft Noise Certification Alternatives,"Letter to the aircraft industry manufacturers, operators, andconsultants, October 3, 1967.
5. Systems Analysis Staff, Office of Noise Abatement, "AircraftNoise Analysis and Measurement," Federal Aviation Administration,Draft Advisory Circular, Third Revision, May 17, 1968.
6. "Aircraft Noise Measurement and Description Near an Airport,"Department of Transportation, Federal Aviatio Administration,Advisory Circular, june- 1 4f. 0&Qio1;k'e5e
7. "Draft Aircraft Noise Certification Plan," Tripartite Meeting,Washington, D. C., Second Revision, May 1, 1968.
8. "Procedure for Describing Aircraft Noise Around an Airport,"International Organiza.ion for Standardization, ISO RecommendationR507, Revision November 1967.
9. "Procedure for Describing Aircraft Noise Around an Airport,"International Organization for Standardization, ISO RecommendationR507, Amendment, April 1968.
10. Oleson, S. K., and Sperry, W. C., "Aircraft Noise Measurement,"Federal Aviation Administration, Report FAA-NO-692-Q, R 1968.
11. "Definition and Procedures for Computing the Perceived NoiseLevel of Aircraft Noise," SAE Committee A-21, ARP 865, November 15,1964.
12. Kryter, K. D., "Concepts of Perceived Noisiness, Their Implementa-tion and Application," Journal of Acoustical Society of America,Vol. 43, No. 2, PP 344-361, October 1967.
39

13. "Definition and Procedures for Computing the Effective PerceivedNoise Level for Flyover Aircraft Noise," SAE Comittee A-21,Draft ARP 1071, February 1, 1968.
14. Pinker, R. A., "Computation of Perceived Noise Level: Mathe-watical Formulation of the Noy Tables," National Gas TurbineEstablishment, N. G. T. E. NT. 684, Feburary 1968.
15. Bishop, D. E., "Exanples of Revised Procedurcs for EstimatingBroadband Noise Levels from One-Third Octave Band SpectrumMeasurements," Bolt, Beranek, &nd Newman, Inc., Tech. Memo toSAE Committee A-21, February 2, 1958.
16. SAE Research Project Comittee R2.5, "Technique for DevelopingNoise Exposure Forecasts," Federal Aviation Administration,FAA-DS-67-14, August 1961.
17. Minuteo of Meeting No. 23, SAE Committee A-21, Aircraft ExteriorNoise Measuremnt, February 7-8, 1968.
18. Aerospace Industries Association (Harr) letter to the FederalAviation Administration (McKee), 5 December 1967.
19. Aerocpace Industries Association (Snodgrass) letter to the FederalAviation Administration (Paullin), 25 March 1968.
20. Aerospace Industries Association Briefing to the Government/
Industry Task Force, July 11-12, 1968.
21. Hecker, M. H. L., and Kryter, K. D., "Comparisons Between Sub-jective Ratings of Aircraft Noise and Various Objective Measures,"
Federal Aviation Administration, FAA-NO-68-33, April 1968.
22. Kryter, K. D., "Results of Psychological Experiments Conductedat Edwards Air Force Base for the National Sonic Boom EvaluationOffice," National Sonic Boom Evaluation Office, Contract AF49(638)-1758, May 1968.
23. Sperry; W. C.,-"Governing Equations for Wave Propagation in aHomogeneous, Isotropic, Continuoup Fluid," University of TennesseeSpace Institute, Short Course on Noise Generation and Suppressionin Aircraft, January 29, 1968.
24. Ollerhead, J. B., "Subjective Evaluation of General AviationAircraft Noise," Federal Aviation Administration, FAA-NO-6f-35,April 1968.
25. Little: J. W., 'h=an Response to Jet Engine Noise," Noise Control 7,11-14, No. 3, May - June 1961.
40

26. Wells, R. J., and Blazier, W. E., "A Procedure for Computing theSubjective Reaction to Complex Noise," Fourth InternationalCongress on Acoustics, Copenhagen, Paper L24, 21-28 August 1962.
27. Kryter, K. D., and Pearsons, K. S., "Judged Noisinejs of a Bandof Random Noise Containing an Audible Pure Tone," J. Acoust.So. Am. 38, No. 1, 106-112, July 1965.,
28. Bishop, D. E., Lyden, F. J., and Horonjeff, R. D., "Analysis ofCommunity and Airport Relationships/Noise Abatement," FederalAviation Agency, FAA-RD-65-130, December 1965.
29. Pearsons, K. S., "The Effects of Duration and Background NoiseLevel on Perceived Noisiness," Federal Aviation Agency, FAA-ADS-78, April 1966.
30. Kryter, K. D., "Review of Research and Methods for Measuringthe Loudness and Noisiness of Complex Sounds," National Aero-nautics and Space Administration, NASA CR-422, April 1966.
31. Pearsons, K. S., "Noisiness Judgements of Helicopter Flyovers,"Federal Aviation Administration, FAA-DS-67-1, January 1967.
32. Pearsons, K. S,, and Horonjeff, R. D., "Category Scaling Judge-ment Tests on Motor Vehicle and Aircraft Noise," Federal AviationAdministration, FAA-DS-67-8, July 1967.
33. Williams, C. E., Stevens, K. N., Hecker, M. H. L., and Pearsons,K. S., "The Speech Interference Effects of Aircraft Noise,"Federal Aviation Administration, FAA-DS-67-19, Snptember 1967.
34. Pearsons, K. S., Horonjeff, R. D., and Bishop, D. E., "TheNoisiness of Tones Plus Noise," National Aeronautics and SpaceAdministration, Contract No. NAS 1-6364, 8 September 1967.
* 35. Wells, R. J., "Recent Research Relative to Perceived Noise Level,"Seventy-fourth Meeting of the Acoustical Society of America,Miami Beach, Florida, 14-17 November 1967.
36. Little, J. W., and Mabry, J. E., "Development and Validity ofthe Noise Unit Called Effective Perceived Noise Level," TheBoeing Co., January 15, 1968.
37. Hinterkeuser and Sternfeld, "Subjective Response to SynthesizedFlight Noise Signatures of Several Types of V/STOL Aircraft,"National Aeronautics and Space Administration Contract No.RAS 1-7083, Boeing Vertol Document D8-0907A, 1968.
41

38. Bishop, D. E., "Descriptions of Flyover Noise Signals Producedby Various Jet Transport Aircraft," FAA Technical Report, FAA-DS-67-18, August 1967.
39. Fisk, W. S., "Creation of Pseudo Pure Tones and Fnsitivityof TPHL Correction to Tolerances on Noise Spectr; or Level ofBackground Noise," G. E. Flight Propulsion Division, Tech. Memoto SAE Couittee A-21, November 10, 1967.
Copies of the formal government reports can be obtaine, from:
Clearinghouse for Federal Scientific and Technic ,. InformationU. S. Department of Coumrce5285 Port Royal RoadSpringfield, Virginia 22151
42

APPENDIX A. MATHEHATICAL FORMULATION OF NOY TABLES
The relationship between sound pressure level and perceived noisiness givenin Table 8.1 is illustrated in Figure Al. The variation of SPL with log nfor a given one-third octave band can be expressed by either one or taiostraight lines depending upon the frequency range. Figure Al(a) illustratesthe double line case for frequencies below 400 Hz and above 6300 Hz endFigure Al(b) illustrates the single line case for all other frequencies.
The iuportant aspects of the mathematical formrulation are:
1. the slopes of the straight lines, p(l) and p(2),
2. the intercepts of the lines on the SPL-axis, SPL(l) and SPL(2), and
3. the coordinates of the discontinuity, SPL(O) and log n(0).
The equations are as follows:
Case 1 Figure Al(a) f L400 Hz and f 6300 Hz.
SPL(0) = p (2) SPL~l) 2 1) SPL(2 (A")
log (O)= SPL(2) SPL(Q A2log (0) p(l) -p(2) (2
(a) SPL(l) SPL Z SPL(0)
n = ant SPL - SPL(l) (A3)
pM(1
(b) SPL N SPL(0)
n =ant SPL - SPL(?) (M)
p (2)
(c) 0 log n logn(o)
(SPL = ~) o n + SPL(l) AlS
SPL- p2)log n + SPL(2)(M

"a 2 Yigure AI(b) 4-0if . 6300 Hz
(a) SPL SPL(2/)
P (2) (A7)
(b) lo n Iu
SItI - p(2) log ni + SPL(2&, (M8)
Let the recipiv-sla of the slipes be defined as
I/p (1) (A9)
14(2) I /p(2) (A1O)
Then the equationa con tte witten
C&Se 1 Pit=*r.A1(A) fZ400 Rz atd f 6300 1z
SPL(O) M (I) SPL(l) - M(2) -SPL(21 '
1 og n (0) #LIL2-1LPZ± L (1) (A'?2M4(2) - 14(1)
(a) SPL(l) 4 SPL 4SPL(O)
n - anit ! 1 [i SPL SPL(I4j (A13)
(b) SPL I SPL(' )
ui ant MC(I) [SPL SPL(2) ](A14)(c) 0 Icg n log n(0)
SPL + SPL(l) (A15)
(d) log n I log n(0)
SPL lo n + SPL(2) (A16)M4(2)
A2

Case 2 Figure Al(b) 4-0C L'-f iL 6300 Hz
(-SPL SPL(2)
n -ant M(2) SPL - SPL(2)j 47
(b) log n O
SFL =lgn SPL(2)M.(2)
Table Al, taken from Reference 14, lists the values of the isportantconstants necessary to calculate sound pressure level as a function ofperceived noisiness,
A3

2
SPL (0)
SPL (1)00 f 400 H Z
f f6300 HZ
S P L(2)
log n(o)l
Log Perceived Noisiness, log n
8 400 ~ f~16300 HC,
SPi (2) (6)
I Log Perceived Noisiness, log nFigure A 1.Sounc'- Pressure Level as a Function of Noys.
V A

M(1) SPL SPL ,(2) SPL
; ) (1) (0) (2)HZ dB dS dB
1 50 0.043478 64 91 0 _ .030103 52
2 63 0.040570 60 85.9 -f
3 80 0.036831 56 87.3 .494 100 53 7.L95 125 0.035336 5 1 79.8 " 466 160 0.033333 48 76.0 " 457 200 46 74.0 '_ 438 250 0.032051 44 74. _ _- " 429 315 0.030675 42 94.6 " 41
10 400 - - - " 4011 500 - - '12 630 - - - "13 800 - - - "14 1000 - - - _ "
15 1250 - - - "3816 1600 - - - _ _ 3417 2000 - - " 3218 2500 - - - 30
19 3150 ---
20 4000 - - - it
21 5000 - - - " 30?') 6300 - - -31
23 8000 0.042285 37 44.3 34
24 ,0000 , 41 50.7 37 s7
Table Al. Cortants for Nkihemratically ForrnukmA d NOY Values
A5

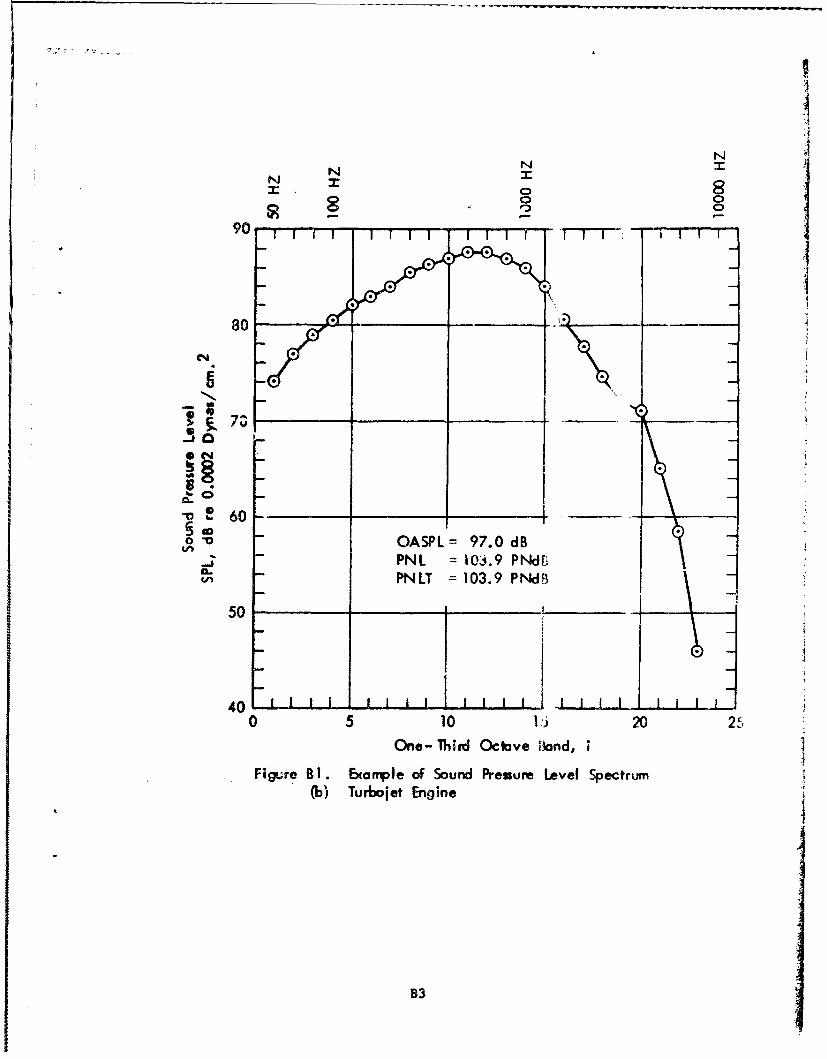
APENDIX B. EXAMPLES OF PERCEIVED NOISE LEVEL CALCULATIONS
Examples of instantaneous noise spectra are shown in Figure B!(a) for & turbo-fan engine and in Figure Bi(b) for a turbojet engine. The spectra are sig-nificantly different. The turbofan engir.e noise spectrum (taken from Ref-erence 38) contains pronounced irrvgularities due to a multiplicity of dis-crete frequency components or tones. The turbojtt engine noise spectrum(taken from Reftrence 39) is relatively smooth indicating broadband noisewith no apprecisble tones,
Associated with each noise zpectra are three different single number noiseratings. The over-all sound pressure level, OASPL, Is directly related tothe noise energy and, for the particular eyamples shown, the turbojet pro-auces the greatest noise energy, exceeding the turbofan by 4.5 dB. However,Lhe oerceived noise level, PNL, which is a subjective measure, is greaterby about one PNdB for the turbofan, This reversal of the energy rating bythe subject~ve rating 'learly indicates the influence that high frequencynoise has on annoyance.
The third uoise rating, tone corrected perceived noise level, PNLT, will bediscussed in detail in Appendix C However, further euphasi6 of the infli'\ance of spectral character on annoyance is indicated by the 2 PNdB greatervalue of PNLT over PNL for the turbofan engine. 2 or the turbojet engine,the PNL and PNLT values are identical because of the absence of tones.
Bi

NFJ I
I 0 IFf-
80
> 70.
_
_ _ _ _, I -
bQ OASPL 92.5 dB- PNI 1 104.8 PNdB
PNLT !06.8 PNIB5( __ - ---__ _~ 15C,
0 10 5 20 2
One - Third Octave Brind, i
Figure BI . Exomple of SourJ Pressure Level -,,ectrum(o) Turbofan Engine
B2
F--1-
80 -- :)!
Fe 7'
o 8o
o " OASPL= 97.0 dB-.. -PNL = 10.9 Pl ,dr -
CA PN LT = 103.9 PhlW501
40 I I I i I11 1 I40
0 5 10 1 20 25JOne-Third Octave ond, i
Figure 8 1. Example of Sound Presure Level 'Spectrum,(bo) Turbojet Engine503
40 .1 -L..L..L .L.L...L3

APPENDIX C. EXAMPLES OF TONE CORRECTION CALCU ATIONS
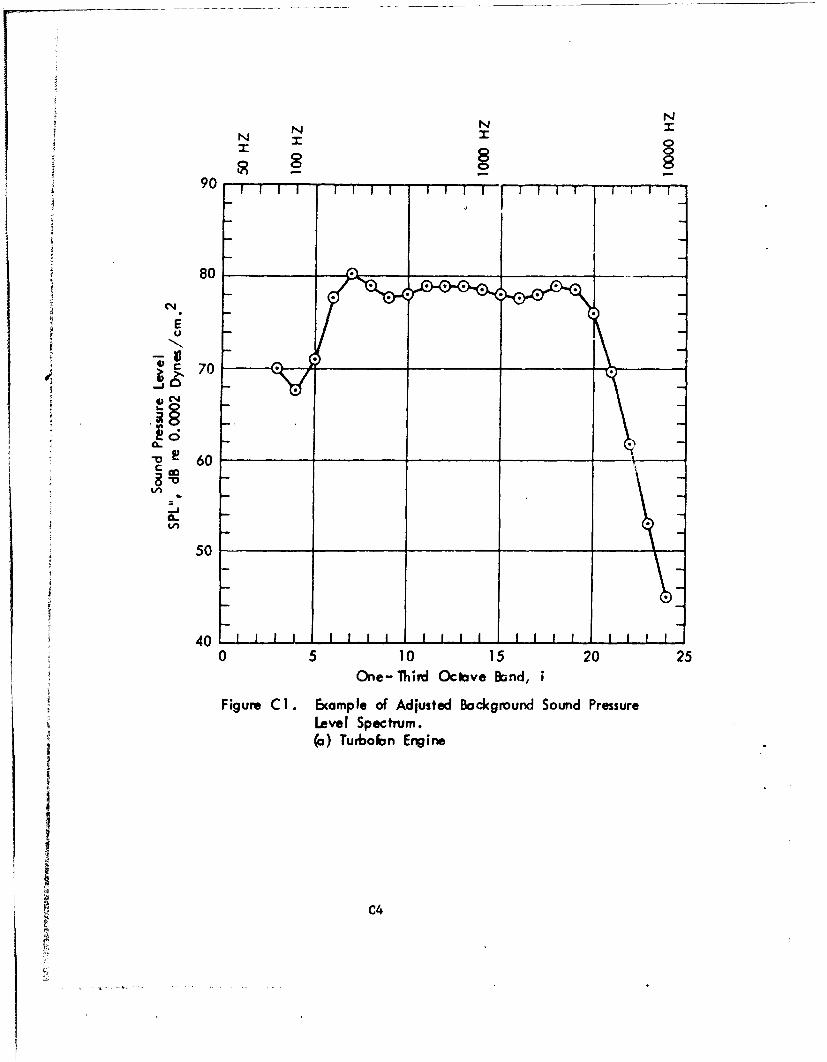
Calculations for adjusting noise spectra for the presence of tones areillustrated in Tables CI(a) and (b). The particular spectra used asexamples are the two presented in Appendix B for turbofan and turbojetengines, and the calculation procedure is that prescribed in detail inSection 9.
The adjusted spectra in terms of background sound pressure level, SPL",are shown in Figure Cl. Comparing the origira. ind adjusted spectra ofthe turbofan engine, Figures Bl(a) and Cl(a), it is seen that the irregulari-ties are not so pronounced after the tone correction procedure was exercised.The coMPuLed correction is 2 PNdB which, when added to the PNL, resultedin the PNLT value of 106.8 PNdB indicated in Figure Bl(a).
Comparing the original and adjusted spectra of the turbojet engine, FiguresBl(b) and Cl(b), it is seen that only a very slight difference exists. The
computed correction is zero which is the reason why the values of PNL andPNLT are identical as indicated in Figure BIb).
IC I
iC
....!- c l---- - - -

Band f SPL S IAS1 SPL' S' S SPL" F C() HZ dB dB dB dB dB dB dB dB dB
Step Step Step Step Stop Step Step S'm1 2 4 5 6 7 8 9
1 50 . . . . . .. -
2 6 . . . . . .L - -63LC3 80 70 - - 70 -8 -21/37 -
4 100 62 - - 62 -8 +31/3 67 2/35 125 48 16 71 +9 +62/371 -
6 160 80 +11 2 80 +9 +22/-? 77 2/3 2 !/31-_7 1 82 4(21 8 82 +2 -1 1I380 1/3 ,2/3I8 250 (8 + I 1 79 -3 -1 1/3 79 4 123
315 1 8 76 -3 + 1/377 2/3 -
4U- (80 4 11 78 +2 + 78-1, =- 4 80 2 0 7912 6379 179 - 1 79 -13 800 78 -1 0 78 -1 79 -
14 1000 80 +2 3 80 +2 - 3 78 21 1/-- - __ - - -1'3 78 -15 1250 78 - 2 4 78 -2 137
16 1600 76 -2 0 76 -2 + 1/3 77 2/317 2000 79 + 3 5 79 +3 +1 7818 2500 (85) +6 3 79 0 - 1/3179 6 /3 219 3150 -6 12 79.. 2/3 7823 T_20 4000 78 - 5 78 -1 -61/3 76 221 50D0071 -,7) 6 7 1 -7 -8 69 2/3 11IQ2 500 60 1 7 61 -11 -82 1 1
"23 8000 54 -6 5 1 -- 8_53 024 10000 45 -9 3 45 -9 - 45 -
stop 1 - (i-I Stop 6 ®(i) +((i+1)Stop 2 ITO., -®(!-0l + (D (i+2)] -: 3-Step 3 ! e instructions St 7 (2)(W) +0i-0SteT 4 see instructions St 8Step 5 1 (,i T -Ti .. Step 9 see Table 4.1
Table C1. Example of Tone Conection Calculation(a) Turbofan Engine
I

(fBan SPL S 1SI SPI' S' SPL" F C(i) HZ dB dB dB dB dB dB dB dB dB
Step Step Step Step Step Step Step Step-1 2 4 5 6 7 8 9
1I 50 -..
2 63 ...3 80 79 - - 79 +1.5 +1.50 79.00 -4 100i 80,5 +1.5 - 80.5 +1.5 +,33 80.50 -5 125 82 +1.5 0 82 +..5 +1.17 81.83 0.17 06 160 83 +1 0.5 83 +1 +1.17 83 -7 200 84 +1 0 84 +1 +1.17 84.17
-8 250 85.5 +1.5 0.5 85.5 +1.5 +1.00 85.34 0.169 315 86.5 +1 0.5 86.5 +1 +0.67 86.34 0.16
10 400 87 +0.5 0.5 87 +0.5 +0.33 87.01 -11 500 87.5 +0.5 0 87.5 +0.5 0 18734 0.16
12 630 87.5 0 0.5 87.5 0 -0.50 87.34 0.1613 800 87 -0.5 0.5 87 -0.5 -1.17 86.84 0.1614 1GO0 86 -1 0.5 86 -1 -2.17 85.67 0.3315 1250 84 -2 1 84 -2 -2.83 83.50 0.5016 1600 80.5 -3.5 0.5 80.5 -3.5 -3.17 80.67 -17 2000 77.5 -3 0.5 77.5 -3 -2.83 77.50 -18 2500 74.5 -3 0 74.5 -3 -2.17 74.67 -19 3150 72 -2.5 0.5 72 -2.5 -3.17 72.50 -
20 4000 71 -1 1.5 71 -1 -4.33 69.33 1.67 021 5000 65 -6 5 65 -6 -8.33 65.00 -22 6300 58.5 1-6 0.5 58.5 -6.5 -12.83 56.67 1.8323 8000 46 -12 6 46 -12.5 -17.17 43.84 2.16 024 10000 26.5 -1 7 26.5 -19.5 - 26.67 -
-1-19.5
Step 1 i 001 Step 6 [2) M (+)(0+1)Step 2 IT (ITF-I1l +efti+)]-3Step 3 see instructions Step 7 (i-I) +((i-1)Step 4 see "-structions Step 8 C)(1) - U9i)Srep 5 fi .67'o -) Step 9 see tobl
Table Cl. Exaiple of Tone Correction Calculation(b) Turbojet Engine
C3
90-rr--- rrr
80
C14,
EU
- 0 4
' 60
CL
50
40J LW W W0 5 10 15 20 25
One- Third Octave Bond, i
Figure C. I BEample of Adjusted Bacground Sound PressureLovelI Spectrum.(a) Turbobn Engine
C4

CNNE
80
4A~4A
D. 0 -
One 0hr cav od
CC

AFPENDIX D. EXAMPLES OF DURATION CORRECTION CALCULATIONS
Three examples of flyover curves are shown in Figure Dl. These shapes, :ect-angle, trapazoid, and triangle are not representative of real flyover curvesand are used simply as examples for illustrating the calculation procedt-res
2of Sections 11 and 12. The ordinates of these Figures are the tone correctedperceived noise level, PNLT, with the maximum value, PNLTM, chosen to be107 dB in conformance with the value (to the nearest whole number) of theturbofan engine aircraft shown in Figure Bl. Thus, the turbofan engine noisespectrum, previously used as an example for the PNL and PNLT compuitationalprocedures, is continued as an example for the duration computar --nal pro-cedure. It is assumed to be the spectrum for whicb PNLT is maximum.
The abscissa of Figure DI is the flyover time, t, and the values chosenare completely arbitrary. At the 33rd second after the time history hasbegun, the dB-down point, h, from the maximum is 10-dB which defines thebeginning of the significant time history, t(1). The end of the significanttime history, t(2), occurs when h is again 10 dE after PNLTM has been passed.Half-second time increments, A t, were used in the computational procedures.The duration time, d, for all three cases of Figure Dl is 15 seconds which,in accordance with Equation (12.4), would yield an approximate duration cor-rection, D, of zero. The integrated duration corrections are given inFigure DI for each case and it is seer. that only fcr the trapazoid case arethe approximate and integrated duration corrections equivalent. The resultsindicate that the integrated duration correction will be greater than the
* approximate when the flyover curve has a flatter shape than the trapazoidshown and will be less than the approximate when the flyover curve is sharperthan the trapazoid.
Figure D2 gives examples of triangular flyover curves with different durationtimes and in all cases the duration correction, D, is negative. However, theresults indicate that D approaches zero as d becomes about 26 seconds.
Figurc D3 illustrates three arbitrary noise flyover curves, of which thefirst two are more representative of reality than those of Figures Dl and D2.The "haystack" examples were chosen to have a 15-second duration time, d,which would yield an approximate duration correction of zero. The integratedduration corrections, however, are dependent upon the curve shape and for theexamples shown, are negative. Other flatter curves of 15-second durationcould be drawn which would have zero or positive integrated duration corrections.
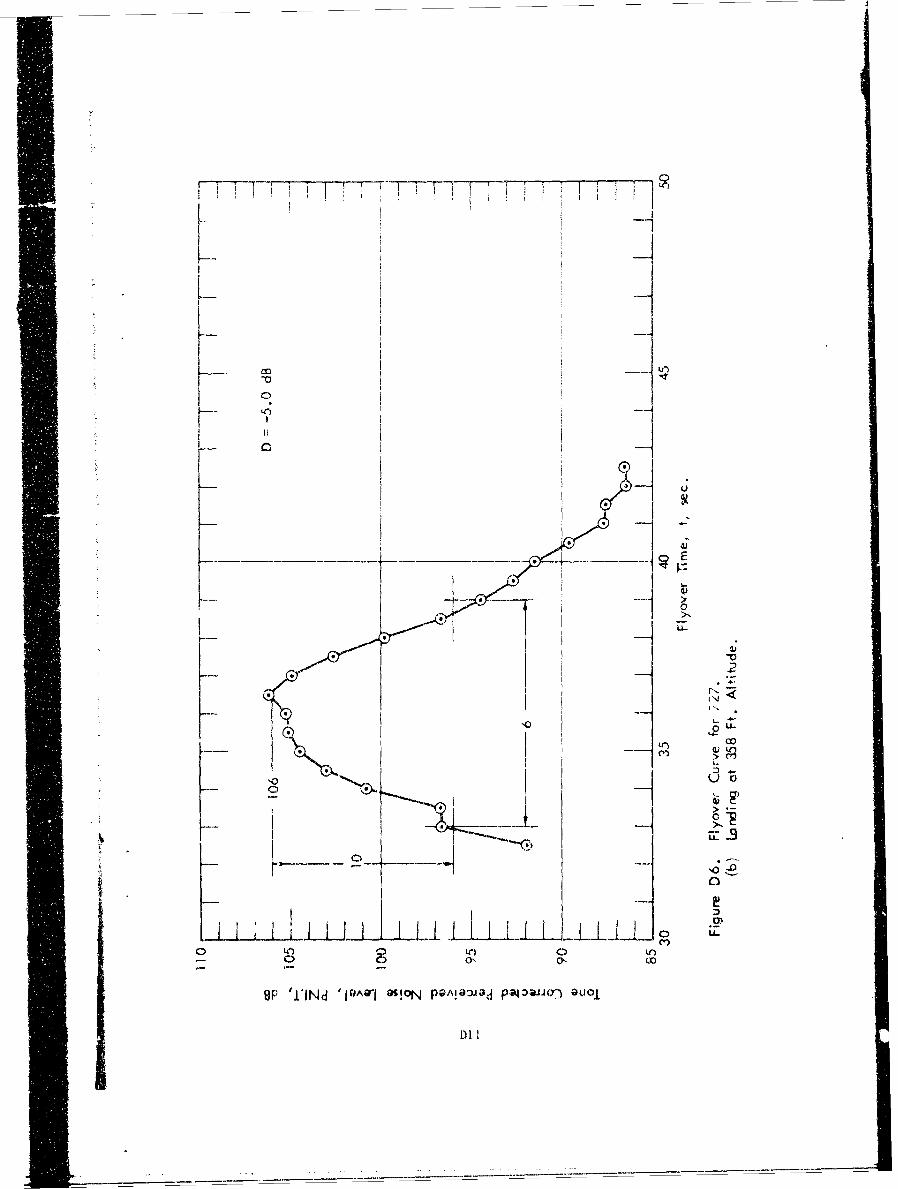
i o J" D5, and D6 il'.tratc actual takeofi and i.nding flyover curves
AvL iC-8, DC-9, and B-727 aircraft. Associated with each curve is the cal-
culated integrated duration correction which, in all cases, is negative. Thebasic data was obtained from Hecker and Kryter, Reference 21.
Table D1 lists all the flyover curves with their duration times and with bothintegrated and approximate duration corrections. The tabulated results of the
Preceding Page BlankI :1

of the integrsted duration corrections are given with respect to three dif-ferent norm~alizing tiames, T. The 10-second normalizing time is that recon-mended by ISO, Reference 8. The 15-second norrislizing time was used byHecker and Kryter, References 21 and 22, and the 6-second normalizing timeis given as a possible future lower limit. The difference in the durationcorrections resulting from 6 and 15 instead of 10-second normalizing timeis plus or minus 2 dB, respectively.
D2

110 J l i ii l i
100-1 D= +2.0 dB100 -
(a) Rectangle
o 90 I LI I LI . I L I I l I I I i lL I.L30 35 40 45 50 55
z
110 7 -I- -
T-/ b rp~oa,, D = 0 dB0
--
S0(b) Trapzoid-a100V
0
**
U 0
SF u30 35 40 A5 MS 55
11 I1 1 f I if I I I I
D=-2.5 dB
100
z Z- (c) Triangle
90 I I I
30 3540 45 50 5
Flyover Time, t, sec.
Figure D I. Examples of Miscellaneous Flyover Curves with 15-sec.Duration Times.
D3'a

110o
D -5.5 dB
100__ _ __ _ _ _
30 35 40 45 50 55z110
107C, ~-2.5 dt,
2 10-u100
(b) 15C-
S90 ~W L30 35 40 45 50 55
Durto Tie
).:a
-1 .0 d

110
D =-.5dB
100 _ _ _ _
/ (a) Single Peak
30 lii11111I35 40 45 50 55z-J
00 1(6) Peak with Plateau -
CL
30 35 40 45 50 550
11
0
D 1.-d
100
30 35 40 45 50 55Flyover Time, t, sec
Figure D3. Examples of Haystack Flyover Curves with 15 -Sec.Duration Times.
D5

TT)
-ol
I> 0
'IAI0 i d IS 10SO JdP40O)O~

CII)
'00
CV-
00
0.0
OP 'l N 'I A91091O POIDDJd P400JO:)Du-
D7~

H0 >
Ki* I I
-~ * I)
>. 0'
0Uol CIO
*9P ll~d'JOAJ aSON PAIQ:U~d 843aJO-)O--
D8a

In
coI
If;
o-
0
-
lu-
co-
- AP 'liNd 'IOADIOSI *o.jPGAID"Od P*40-OLIO Guoj
D9

*00
-E
0<
00
I4IO
1--
K0-
Cl)
Kl
KD I

Flyover Dur. Duration Corr. D, B~~Curve Tie ntegrac t on- Ci, Aprd Norm. Time, T, sec.
sec. 6 10 i5~~~(1) _(.
Rectongle 15.0 +4.0 +2.0 0 10Trapazoid 15.0 +2.0 0 -2.0 0
Triangle 15.0 +0.5 -2.5 -4,5 0
Triangle 7.0 -3.5 -5.5 -7.5 -3.5
T ingle 15.0 -0.5 -2.5 -4.5 0
Trinnalt. 1%) 41 ,, 0 -3.0 -- ,5
Single Pak 15.0 +1.5 -0.5 -1.5 0
Peak with Plateau 15.0 +1.5 -0.5 -2.5 0
Double Peak 15.0 +0.5 -i 5 -3.5 0
rDC-3 T/O 9.5 -1.0 -3.0 -5.0 -2.0
DC-8 Land. 6.0 -1.5 -3.5 -5.5 -4,0
DC-9 T/O 14.0 -0.5 -2.5 -4.5 -0.5
DC-9 Land. 4.5 -3.5 -5.5 -7.5 - 5.0
I727 T/O 8.5 -2.5 -4,5 -6.5 -2.5
727 Land. 6.0 --3.0 -5.0 -7.0 -4.0
(1) ISO Recommendation, Ref. 8(2) Hecker and Kryter, Refs. 21 and 22
Table D1. Comparison of Duration Correction Fnctors Obtained ByVarious Calculation Methods.
012
gilii~

APPENDIX E. APPROXIMATE METPODS
Variou aircraft flyover data are listed in Tables El and E2 ir.ludingthe komp!i:ed results for PNLP, PNLM, and EPNL. The latter is given InTal le F2(a) as the result of both the integrated and approximate durationca'culn,:Ion w-thods and in Table E2(b) as the result of the approximatem 0tod onT-y, The data are from the recent research of Hecker and Kryter,References 21 Pnd 22, and the integration and approximation values havebeen ad:lus'red to conform to normalizing times, T, of 10 and 15 seconds,respectively.
Peak percel.* d noise level, PNLP, is less sensitive to the physical prop-erties o the noise signature than maximum perceived noise level, PNLM,and both are les,% sensitive than effective perceived noise level, EPNL.if thE prediction of aircraft noise in terms of EPNL is considered to betoo ! ... ate., an approximate method would be to iirst predict the noisein terms of Ph'LP ar PNLk (which the aviation community considers feasible)aad then adjust the results to EPNL by some sor of conversion curve. Thisis precisely what the aviation community has recommended in References 19and 20, and F Sgurcs El and E2 show the type of proposed curve where the dif-f, wnceg in subjective evaluations are plotted as a function of distance.In all cases shown, the distance represents flyover altitude becaube thetest data was obtained from overhead flights, A more general curve wouldbe in terms of the %tinimum slant distance which would permit the inclusionof sidel.ne noise measurements.
Figure El(a) shows the difference bet-een EPNL based upon the integratedduration calculation and PNLM. Superimposed on the graph is the AIA curvefrom Reference 20. It is apparent that the data has not collapsed verywell along any single line and that an envelop should be used to containthe data. The AIA curve might represent the upper boundary of the envelopabove 1000 feet altitude but an adjustment would be needed for altitudesbelow 1000 feet.
Figure El(b) shcws the difference between EFNL based upon the approximateduration cai.cuiation and PNLM. For this case, the AIA curve would nearlyrepresent the lrmer boundary of the envelop. Comparing the two graphs, iti,P , en that the approximate duration calculation invokes a slight penalty.
.4 Figures E2(a) and /b) show the differences hetween the two forms of EPNLand PNLP. The AIA curve is not supcrimposed on these graphs because it isIntended to apply to PNI2 only. Again, the data scatter is such that anenvelop should be used and also the approximate duration calculation isshown to invoke a slight penalty.
S,'eri[ A.Atleortant conclusions can be drawr, from these curates which arebased upon measured physical properties of noise signatures of .urrent aircraft.
I~El

1. Differences in subjective evaluations versus distance can beadequately represented by envelopes.
2. If the upper boundary of the envelop were used for prediction,EPNL could be conservative (too Ir 2e) by a maximum of about6 dB at 200 feet, The conservatism would decrease as the dis-tances became greater amoutting to about 3 dB at 1000 feet andI dB at 5000 feet
3. Couparing the integration and approximate duration calculationprocedures, the former gives EPN values slightly lower andwhich can be contained in slightly smaller envelopes.
I
/I
j
I]I

01 0 'cJ '0 co 'o -- r co* N,
ooo-L C14
0 < ' ) 0L . C o> -N0 0 "
LU - 0
u-I -u
o 04 0% 0N m 3' 0
t/ 6~
IL Ujc c
O L. LL. LL U- LL FzA
u~~~~ll Cl C .. 4 - 4
0 >) 0 l 0 0 0o 0o OD 4 m 0 2~ ~ 2V
c> o 7
04 C N CN co o ),0 0 0 00 co
0i 0i uN -no 0(n-
U-
cc cc 0.E3
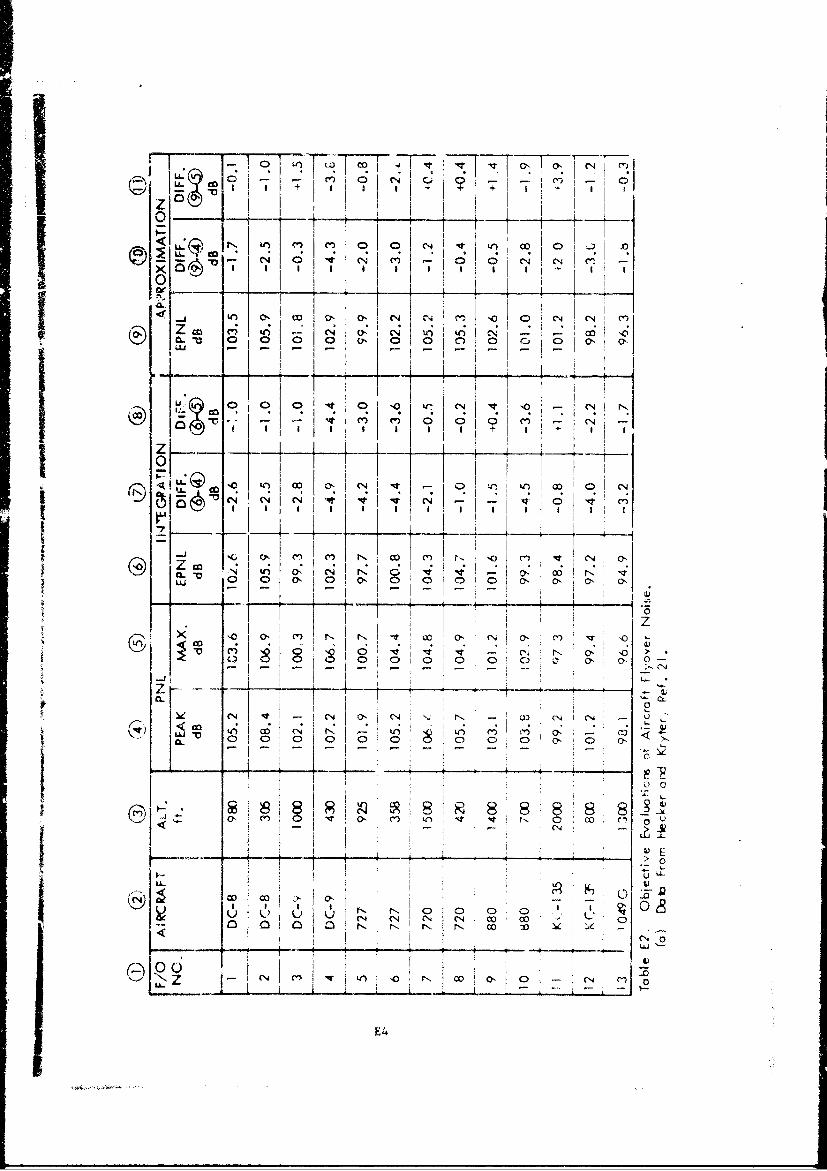
z i
0ol -0 0 11 C-'*v,0 1- 01
LL I I
z~ ca
CLil WIICI
-l 0,
00~I0I4 X1 004O O C14 0
-~o - CoI
> 0
(~ N NI I ~X 0' (Nc ' ~)~ u0 ' ' s
O CO
-9) oz tfl VO 'tsrt r, co
CI aa a 5 a aE4

0LIJ
-- - -- I%0 0. -l c*0' 11, ' ~
+ + a
0c o% 00 0v 0to- 0 - - 0
0a'
a) 0 0 -I -o - in 0 - 0e
- i -o a--
x 0 c o cc ' v' 0 co 04 cc m,~
uJ-I CC5 (q (N N (N 0 0 e6uco 0 o 0 0 - ( N 0 e4 aN 0
__>
8 8 8 ~co I.-CNC~
I Lu
co ao c co c a cc n ca ao a0 co
0 0 0 0 0 0 0 !1E5

El
T 0
Eli
c 0
4, '
E6l

0
0
'40-
o 01
z U
I--
C%4
0.
to toI4
SP 'WId l~U
E7C

cii
-
-0
Z-2
0 - 0
tn
V.El El
E8
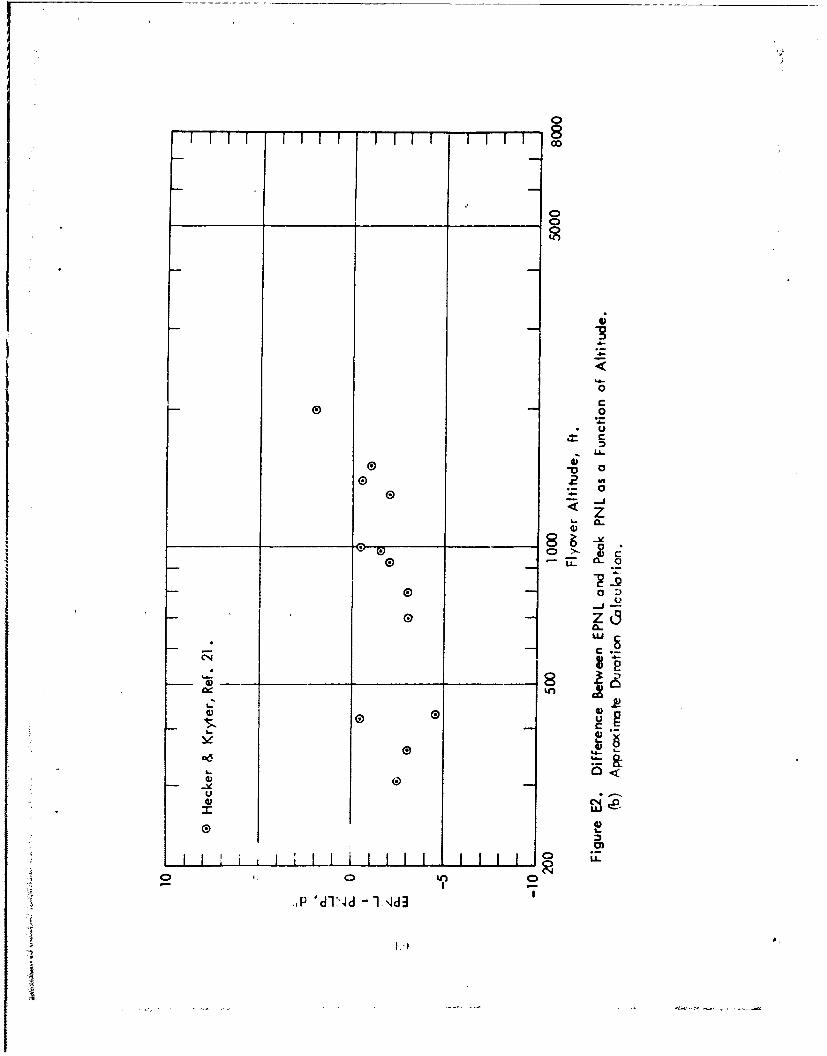
0
FTTF TTTF mFTT 8
________ ________ ________ 8
43
0
C0 0
4-* U
.4- C
- LLU,
-~ 00 _ I',0 0
z
O~.1 0
0U-a-
0LU~
(*%I
U,
I-
0
~0 .4-
I.- 0<43 0U . -~'
43 E;j~IU)0 1~
0)II: I LiLLL.LLLLL8 IL.
o U,- I -
..P 'dl:'4d -1 ~dJ
I


