1 RICE UNIVERSITY IEEJ: January 2007 International Natural Gas Market Developments to 2030 Peter Hartley Professor, Economics Department Kenneth B Medlock III Fellow in Energy Studies, James A Baker III Institute for Public Policy Adjunct Assistant Professor, Economics Department James A. Baker III Institute of Public Policy RICE UNIVERSITY
Transcript
1
RICEUNIVERSITY
IEEJ: January 2007
International Natural Gas Market Developments to 2030
Peter Hartley
Professor, Economics Department
Kenneth B Medlock III
Fellow in Energy Studies, James A Baker III Institute for Public Policy
Adjunct Assistant Professor, Economics Department
James A. Baker III Institute of Public PolicyRICE UNIVERSITY
2
RICEUNIVERSITY
IEEJ: January 2007
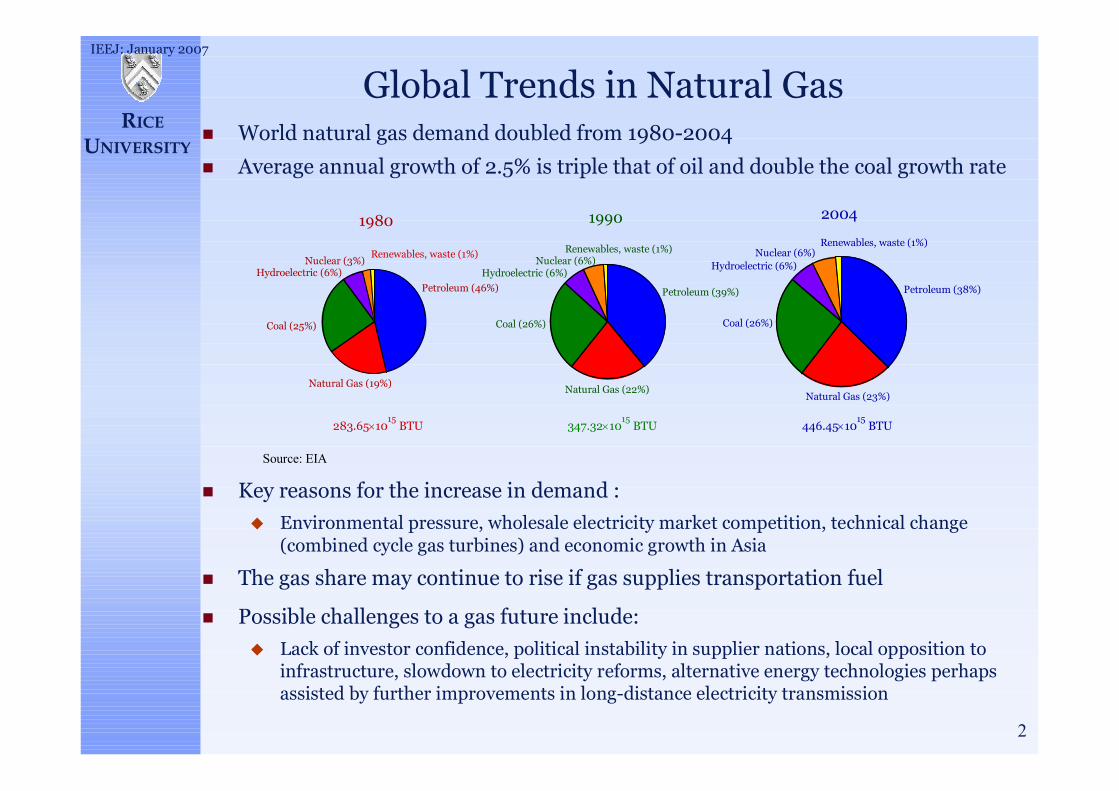
Global Trends in Natural GasWorld natural gas demand doubled from 1980-2004
Average annual growth of 2.5% is triple that of oil and double the coal growth rate
Key reasons for the increase in demand :
Environmental pressure, wholesale electricity market competition, technical change (combined cycle gas turbines) and economic growth in Asia
The gas share may continue to rise if gas supplies transportation fuel
Possible challenges to a gas future include:
Lack of investor confidence, political instability in supplier nations, local opposition to infrastructure, slowdown to electricity reforms, alternative energy technologies perhaps assisted by further improvements in long-distance electricity transmission
Petroleum (46%)
Natural Gas (19%)
Coal (25%)
Hydroelectric (6%)Nuclear (3%)
Renewables, waste (1%)
Petroleum (39%)
Natural Gas (22%)
Coal (26%)
Hydroelectric (6%)Nuclear (6%)
Renewables, waste (1%)
Petroleum (38%)
Natural Gas (23%)
Coal (26%)
Hydroelectric (6%)Nuclear (6%)
Renewables, waste (1%)
1980 1990 2004
283.65 1015
BTU 347.32 1015
BTU 446.45 1015
BTU
Source: EIA
3
RICEUNIVERSITY
IEEJ: January 2007
Prices 2015, 2030
J
J
J
J
JJ
J
JJ
Beijing Buenos Aires Delhi Henry Hub Seoul Sydney Tokyo UK - NBP Zeebrugge$0.00
$1.00
$2.00
$3.00
$4.00
$5.00
$6.00
-5%
-4%
-3%
-2%
-1%
0%
1%
2%
3%
2015 price ($2005/mmbtu)
J annual growth 2010-15
J
JJ
J J
J
J
J J
Beijing Buenos Aires Delhi Henry Hub Seoul Sydney Tokyo UK - NBP Zeebrugge$0.00
$1.00
$2.00
$3.00
$4.00
$5.00
$6.00
-5%
-4%
-3%
-2%
-1%
0%
1%
2%
3%
2030 price ($2005/mmbtu)
J annual growth 2025-30
4
RICEUNIVERSITY
IEEJ: January 2007
Supply 2015, 2030
Europe (10%)
Russia (19%)
Other FSU (7%)
North America (24%)
South America (5%)
Qatar (2%)
Iran (3%)
Saudi Arabia (2%)
Other Middle East (3%)
North Africa (6%)
Other Africa (3%)
Australia, NZ, PNG (3%)
ASEAN (7%)China (2%)
Other Asia (3%)
World total 128.51 Tcf
Supply 2015
Europe (6%)
Russia (20%)
Other FSU (7%)
North America (13%)
South America (8%)
Qatar (3%)
Iran (5%)
Saudi Arabia (4%)
Other Middle East (6%)
North Africa (6%)
Other Africa (5%)
Australia, NZ, PNG (5%)
ASEAN (7%)China (2%)
Other Asia (2%)
World total 159.80 Tcf
Supply 2030
5
RICEUNIVERSITY
IEEJ: January 2007
Demand 2015, 2030
Europe (18%)
Russia (14%)
Other FSU (7%)
North America (28%)
South America (4%)
Qatar (0%)
Iran (3%)
Saudi Arabia (2%)
Other Middle East (4%)
North Africa (2%)Other Africa (1%)
Australia, NZ, PNG (1%)
ASEAN (4%)
China (4%)
Other Asia (8%)
World total 126.00 Tcf
Demand 2015
Europe (16%)
Russia (13%)
Other FSU (7%)
North America (27%)
South America (5%)
Qatar (0%)Iran (3%)
Saudi Arabia (2%)
Other Middle East (4%)
North Africa (2%)Other Africa (1%)
Australia, NZ, PNG (1%)
ASEAN (5%)
China (5%)
Other Asia (9%)
World total 154.61 Tcf
Demand 2030
6
RICEUNIVERSITY
IEEJ: January 2007
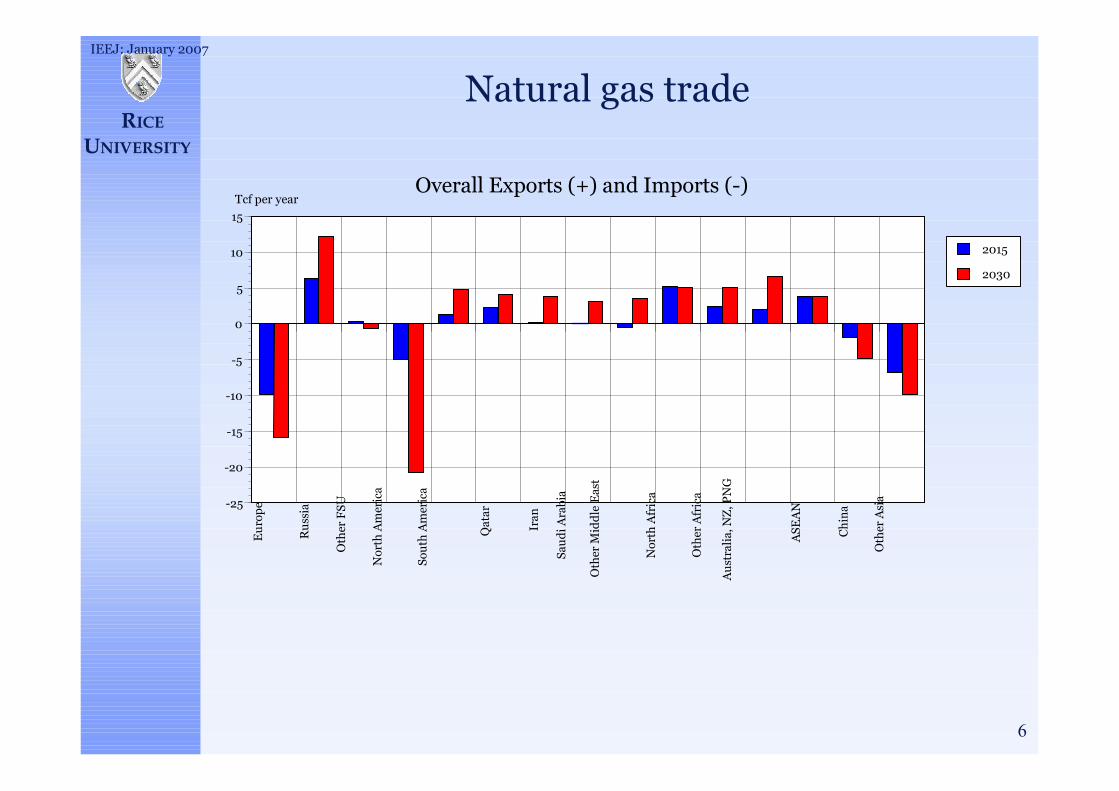
Natural gas trade
Eu
rop
e
Ru
ssia
Oth
er F
SU
Nor
th A
mer
ica
Sou
th A
mer
ica
Qat
ar
Iran
Sau
di A
rabi
a
Oth
er M
idd
le E
ast
Nor
th A
fric
a
Oth
er A
fric
a
Au
stra
lia,
NZ
, PN
G
ASE
AN
Ch
ina
Oth
er A
sia-25
-20
-15
-10
-5
0
5
10
15
Tcf per year
2015
2030
Overall Exports (+) and Imports (-)
7
RICEUNIVERSITY
IEEJ: January 2007
LNG trade
US
Atl
anti
c &
Gu
lf
Rem
ain
ing
Am
eric
as A
tlan
tic
UK
Bel
giu
m
Ital
y
Fra
nce
Res
t of
Eu
rop
e
Nor
th A
mer
ica
Pac
ific
Jap
an
Ch
ina
Sou
th K
orea
Rem
ain
ing
Pac
ific
Ind
ia
0
2
4
6
8
10
12
14
Tcf per year
2015
2030
LNG Major Importers
Au
stra
lia
Ind
ones
ia
Mal
aysi
a
Oth
er S
E A
sia
Ru
ssia
Pac
ific
Iran
Qat
ar
UA
E
Sau
di A
rab
ia
Oth
er M
idd
le E
ast
Nor
th A
fric
a
Nig
eria
Oth
er A
fric
a
Sou
th A
mer
ica
Gre
enla
nd
Nor
way
Ru
ssia
Atl
anti
c
0
1
2
3
4
5
6
7
Tcf per year
2015
2030
LNG Major Exporters
8
RICEUNIVERSITY
IEEJ: January 2007
Natural Gas Demand: Short and Long Run Substitution
9
RICEUNIVERSITY
IEEJ: January 2007
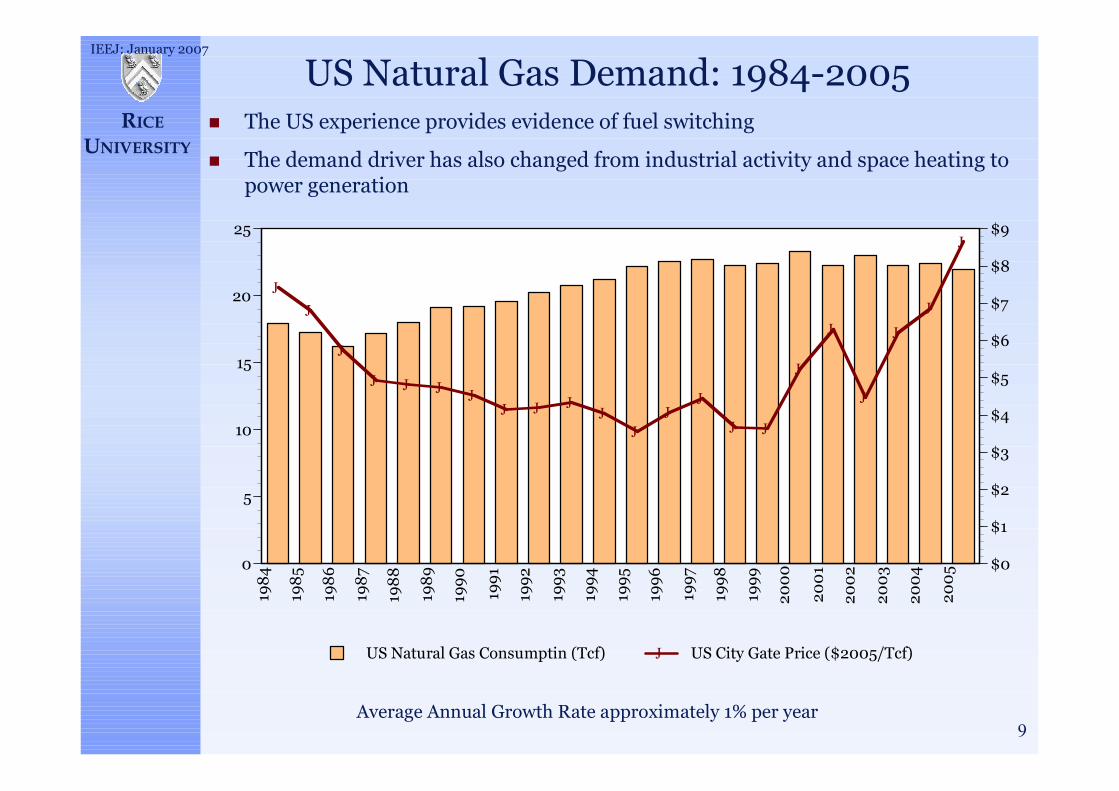
US Natural Gas Demand: 1984-2005The US experience provides evidence of fuel switching
The demand driver has also changed from industrial activity and space heating to power generation
Average Annual Growth Rate approximately 1% per year
JJ
J
J J J JJ J J
JJ
JJ
J J
J
J
J
JJ
J19
84
198
5
198
6
198
7
198
8
198
9
1990
1991
1992
1993
1994
1995
1996
1997
1998
1999
200
0
200
1
200
2
200
3
200
4
200
50
5
10
15
20
25
$0
$1
$2
$3
$4
$5
$6
$7
$8
$9
US Natural Gas Consumptin (Tcf) J US City Gate Price ($2005/Tcf)
10
RICEUNIVERSITY
IEEJ: January 2007
Linkage of crude oil and natural gas prices
US markets show strong evidence of a link between natural gas and oil prices:
Diesel Fuel Residual Fuel Oil Natural Gas Coal Refiner Acquisition Cost of Crude
11
RICEUNIVERSITY
IEEJ: January 2007
What links oil and gas prices?
Demand factors
Substitution in the generation of electricity
Substitution in industrial processes –refining, electricity cogeneration – but in sectors such as chemicals high gas prices cut demand without fuel switching
Substitution between gas and heating oil for space heating
Supply factors
Joint production of natural gas and oil can have positive or negative effectsIncreased oil production also yields additional associated gasHigher oil prices also raise the value of non-gas liquids often produced with gasHowever, gas can also be re-injected to enhance oil recovery
Unconventional oil, such as Canadian tar sands, requires natural gas as input
Gas-to-liquids (GTL) conversion (as in Qatar) can lead to direct competition between gas and oil for providing transportation fuel
Impediments to substitution
Environmental factors can affect demand side substitution of oil for gas
Short run capital costs can slow development of alternative supplies
Uncertainty about future energy prices limits willingness to invest
Economies of scale for GTL versus LNGGTL only makes economic sense for smaller scale projects or if oil prices are high
Africa 485.8 330.1 7.3%Nigeria 184.7 123.2 2.7%Algeria 160.5 49.0 1.9%
North Americac 265.1 451.5 6.4%Central and South America 250.8 421.0 6.0%
Venezuela 151.4 101.2 2.3%Europe 200.7 312.4 4.6%
Norway 84.3 183.0 2.4%World Totald 6112.1 5109.8
a - Oil and Gas Journal as of Jan. 1, 2006b - Compiled from USGS, ABARE, and other national sourcesc - Includes assessed non-conventional natural gas resourcesd - Does not include future growth in existing fields. USGS estimates the World Total at 3305 tcf.
15
RICEUNIVERSITY
IEEJ: January 2007
Linking supply with demand
16
RICEUNIVERSITY
IEEJ: January 2007
Concluding Remarks
17
RICEUNIVERSITY
IEEJ: January 2007
Concluding Remarks
Modeling illustrates the key roles Russia and the countries of the Middle East will play in the world gas market
Prices will be linked through global arbitrage
Trade need not actually occur, there simply needs to exist the ability to trade – LNG provides this capability
Long distance international gas trade provides opportunities forcountries to gain from cooperation, but also to lose from conflict
Absent political constraints, there appears to be substantial gas available to satisfy demand at a reasonable price
Political constraints may, however, present the largest impediment to globalization
Such political constraints may encourage alternative sources of supply and ultimately alternative sources of energy
The development of alternative energy sources later this century will likely mean that substantial natural gas resources will not be exploited for a very long time, if at all