Chairperson’s Corner—Risk Management Section’s Terrible Twos by David N. Ingram _______________________2 Risk Management Section Growing by Mike Boa______________________________4 Dynamic Risk Modeling by James E. Rech _________________________5 Chief Risk Officer Forum—Principles for Regulatory Admissibility of Internal Models by John Hele and Henk van Broekhoven _____7 Internal Controls—The COSO Way by Dorothy L. Andrews ___________________10 Standard & Poor’s Enterprise Risk Management Evaluation of Insurers by David N. Ingram_______________________14 ERM ≠ EC 2 by Sim Segal ____________________________18 Thirteen Ways to Kill a Company by Jennifer Bowen _______________________21 Risk Management Investor Survey by Mary Ellen Luning _____________________28 Policyholder Behavior in the Tail: Variable Annuity Guaranteed Benefits Survey Results by James Reiskytl________________________32 Continuing Education—2006 Activities by Hubert Mueller________________________34 March 2006, Issue No. 7 Published in Schaumburg, Ill. by the Society of Actuaries Risk Table of Contents Management R ISK M ANAGEMENT S ECTION “A KNOWLEDGE COMMUNITY FOR THE SOCIETY OF ACTUARIES”
Transcript
Chairperson’s Corner—Risk ManagementSection’s Terrible Twosby David N. Ingram _______________________2
Risk Management Section Growingby Mike Boa______________________________4
Dynamic Risk Modelingby James E. Rech _________________________5
Chief Risk Officer Forum—Principles forRegulatory Admissibility of InternalModelsby John Hele and Henk van Broekhoven _____7
Internal Controls—The COSO Wayby Dorothy L. Andrews ___________________10
Standard & Poor’s Enterprise RiskManagement Evaluation of Insurersby David N. Ingram_______________________14
ERM ≠ EC2
by Sim Segal ____________________________18
Thirteen Ways to Kill a Companyby Jennifer Bowen _______________________21
Risk Management Investor Surveyby Mary Ellen Luning _____________________28
Policyholder Behavior in the Tail: VariableAnnuity Guaranteed Benefits SurveyResultsby James Reiskytl________________________32
Published in Schaumburg, Ill.by the Society of ActuariesRisk
Table of Contents
Management
R I S K M A N A G E M E N T S E C T I O N“A KNOWLEDGE COMMUNITY FOR THE SOCIETY OF ACTUARIES”
Chairperson’s Corner Chairperson’s Corner
T he Risk Management Section recentlyturned two years old. As many of youwho are parents know, a two-year-old
can be quite a handful. Two-year-olds are justlearning that they can be much more independ-ent. They have more skills than one-year-oldsand much more potential to cause trouble.
Our group has been growing like a small child.Last count, our membership was around 3,000with more than 500 from the CAS (see the sec-
tion membership statisticsat end of this article). Ourparents, the SOA and theCAS have both recentlyexpanded their commit-ment to risk managementand to the importance ofour mission.
Our response, like a two-year-old, has been to runoff in several directions atonce. However, unlike thetypical two-year-old, wehave the advantage of hav-ing many legs and many,many hands. And hope-
fully, many heads as well.
The section council has expanded from nine totwelve members and we have also consolidatedour committee structure. We will be operatingwith only six committees. Each committee willbe empowered and expected to act within thebroad directions that have been set down by thecouncil. We will be making a special effort tobreak out of the standard for section councils,where the council members act as surrogate vol-unteers for the entire section membership.Committees will be made up of section councilmembers working with non-council members.YOU can help. You do not need to be elected tothe council to make a contribution.
The newsletter committee, headed by Ken SengTan and Ron Harasym, will be continuing toproduce this excellent publication. They arelooking for help from people who are willing to
write articles and from folks who would be ableto help develop articles.
Hubert Mueller, Larry Rubin and Tony Dardisare leading the efforts for the ContinuingEducation Committee. They will be developingsessions for SOA meetings as well as for stand-alone continuing education programs like lastyear’s very successful webcast.
The Risk Management Section will be again co-sponsoring the ERM Symposium in Chicagothis April. Valentina Isakina is leading theOrganizing Committee and council membersHubert Mueller, Frank Sabatini and KevinDickson have been working on the committee.You should have already heard about the pro-gram for 2006. We will be starting work on the2007 ERM Symposium this summer and will belooking for new committee members.
Fred Tavan and Ron Harasym are heading theResearch Committee. They have a workingcommittee that is reviewing research proposalsand finding staff for the project oversightgroups. They need several additional people towork with the Research Committee and on over-sight committees.
The rest of the section activities fall into the cat-egory of Special Projects. There are quite arange of these including: Risk Index,Operational Risk, Risk Management Terms,Risk Preference, ERM, Extreme ValueModeling, Policyholder Behavior, ActuarialValue Proposition, Best Practices and LocalNetworking.
In addition, while we generally find two-year-olds doing “side-by-side” play, I am hopefulthat the SOA and CAS members of the sectionwill very quickly move into actual collabora-tion. And along the way to collaboration, wequickly need to learn from each other the tech-niques, skills and experiences that we have de-veloped in our separate actuarial practices. Todo that, we are trying to encourage folks to sharetheir risk measurement and management experiences in hopes that sharing will help
Risk Management w March 2006
Risk Management Section’s Terrible Twosby David N. Ingram
w Page 2
David N. Ingram, FSA, is
director of enterprise risk
management with
Standard & Poor’s in
New York, NY. He can be
reached at david_ingram@
standardandpoors.com.
Chairperson’s Corner
identify these areas for learning and collabora-tion. If you have any thoughts, ideas or experi-ences to share that might further this learningand collaboration, please contact me or anymember of the section council.
Finally, before you pass on the content of thispublication, I want to mention one more thingabout volunteering. Five years ago, when the firstRisk Management Task Force Committees wereformed, few of the volunteers had much risk man-agement experience. Today, if you did a roll call ofthose initial volunteers, the majority of them now
have full-time risk management jobs. This is stilla new and growing area. The risk managementjob candidates with volunteer experience willhave two advantages over those without. Theywill have learned some valuable things aboutsome specific areas of risk management throughtheir volunteer work and they will have that vol-unteer work on their resume. If you might be in-terested, contact me or any section councilperson. We can fill you in on these success storiesand on current volunteer opportunities. F
March 2006 w Risk Management
Page 3 w
“...Risk managementjob candidates withvolunteer experiencewill have two advantages overthose without.
”
2006 SOA Section Membership Statistics(as of January 12, 2006)
Section Total Section Members
Education 693
Financial Reporting 3,758
Actuary of Future 899
Futurism 676
Health 3,486
International 1,747
Investment 4,778
LTCI 1,649
Management and Personal Development 1,302
Marketing and Distribution 2,108
Pension 3,950
Product Development 3,869
Reinsurance 2,392
Risk Management (exclude CAS members)
2,306
Smaller Consulting Firm 585
Smaller Insurance Company 685
Taxation 575
Technology 1,503
Grand Totals 36,961
Risk Management Section Growingby Mike Boa
Y ear 2005 was a year of remarkablegrowth for the joint CAS/SOA RiskManagement Section, as casualty ac-
tuaries joined in force. More than 500 membersof the CAS have joined the section, bringing thetotal section membership to about 3,000.
The rapid growth will helpthe section to achieve itsprimary 2006 objectives ofexpanding ERM educa-tional opportunities, fos-tering risk managementresearch, and supportingthe initiatives in promot-ing actuaries as risk man-agers.
The work of the section isaccomplished by its teams,and the additional CASmembers will help get thework done while providinga casualty perspective.The teams include:
• Membership Value Team• Communications and Publications Team • Newsletter Team • Continuing Education Team • Basic Education Team• Risk Management Research Team • Marketplace Relevance Team • Professional Community Team
The Research Team provides support and di-rection to several specific initiative-relatedresearch committees, two of which are led byCAS members. Mark Verheyen is chairing theOperational Risk Management Committee,while Michael Belfatti is chairing theStandard Risk Management TermsCommittee.
In addition to the chance to be on the front linein advancing actuaries in the risk managementarena, members of the section enjoy other bene-fits, such as receiving invitations to section net-working events, like the one held during the2005 CAS Annual Meeting in Baltimore. The
CAS Vice President of Risk Integration andERM, John J. Kollar, led a discussion over (real)breakfast with about 25 other early-risers aboutthe value that actuaries can bring to the riskmanagement profession.
Section members also receive RiskManagement, the section newsletter, and e-mailcommunications announcing upcoming re-search, projects, continuing education eventsand other activities.
Additional information about the section, in-cluding an application to join, can be found onthe SOA Web site at http://www.soa.org/ccm/content/?categoryID=342001.F
Risk Management Section Grows Dynamic Risk ModelingRisk Management w March 2006
w Page 4
Mike Boa is director
of communications and
research for the Casualty
Actuarial Society in
Arlington, Va. He can
be reached at mboa@
casact. org.
T he year was 1995 and the CasualtyActuarial Society’s Dynamic FinancialAnalysis Committee (DFAC) had pub-
lished its first DFA Handbook. The handbookprovided a cookbook approach outlining nu-merous considerations in the development of adynamic financial analysis model. The merefact that the handbook consisted of nearly 85pages of considerations and was reflective of theperceived notion that DFA modeling was a“daunting task;” few firms were willing to ex-pend the time and costs in developing and main-taining such extensive DFA models.
The DFA world continued to evolve. The DFACcreated new “chapters” for the DFA Handbookin order to expand the scope of the originalhandbook. More recently, the DFAC changed itsname to the Dynamic Risk Modeling Committee(DRMC). The name change was indicative of themore current thought process that advocates theusefulness of dynamic modeling techniques forprojects with various scales of scope and pur-pose. Firms were willing to fund the develop-ment of more specific dynamic risk modelsaddressing reinsurance strategies, stochasticreserving, aggregate loss distributions, catas-trophe modeling, predictive modeling, etc. Thepower of dynamic modeling techniques in ad-dressing specific management concerns is nowevident.
Ten years have passed since that original DFAHandbook. Last year, the DRMC set up aWorking Party (WP) to rewrite and update therenamed DRM handbook. Attesting to a wide in-terest in the handbook, the membership of theWP was fairly evenly distributed among creden-tialed actuaries, students and non-actuaries.Geographically, while the majority of memberswere in the United States, we have several mem-bers located outside the U.S. boarders.
The concept of this new handbook is to buildupon the substantial contributions from previ-ous authors. As such, much of the current un-dertaking is based on reorganizing, updatingand editing the current DFA Handbook in con-junction with other existing DRMC publishedarticles. The revised (and renamed) “Dynamic
Risk Modeling Handbook”is intended to provide a basicunderstanding of and practi-cal guidelines for the devel-opment and implementationof dynamic risk models com-mon to the property and casu-alty insurance industry. Inaddition, it is hoped that theDRM Handbook will becomea basic reference source forthe educational needs of fu-ture modelers and the practi-cal day-to-day applicationneeds of experienced practitioners.
The scope of this rewrite is to:• Restructure and edit the existing core
chapters of the current “Dynamic Financial Analysis Handbook” for consistency.
• Add new chapters including “Introduction,” “Asset Modeling,” “Coherent Risk Measures”, and “Presentations of DRM Results.”
• Introduce practical examples within these core (and new) chapters to illustrate the concepts using the Public Access DFA Model where that would be helpful to illustrate a concept.
• Add a bibliography relating investment concepts on the syllabus to Dynamic Risk Modeling (the syllabus now has sections on Part 8 that address interest rate models for example).
• Add at least five (5) case studies choosing from the subjects listed below (as Appendices) – ¡
Interest Rate Models¡
Investment Policy Statements (IPS) and the economic dependencies between Asset Classes and Liabilities
¡
Financial Risk Management (hedging and the use of financial derivatives, options, swaps and forwards)
¡
Surplus Allocation ¡
Reinsurance¡
Alternative growth strategies by line of business
Dynamic Risk Modeling
Page 5 w
Dynamic Risk Modelingby James E. Rech
continued on page 6 w
James Rech, ASA, ACAS,
MAAA,is a consulting
actuary and vice president
with GPW & Associates,
Inc. in Phoenix, Ariz. He
can be reached at jrech@
gpwa.com.
March 2006 w Risk Management
“
”
It is anticipated thatthe examples andcase studies used inthe handbook will bebased on the publicaccess model andwill be coordinatedto the greatestextent possible...
¡
Alternative investment strategies• Integrate some (or all) of the new case
studies with the Work Products of the Working Party on Executive Level Decision Making using DRM and the Working Party on the Public Access DFA Model.
• Set up guidelines for future enhancements, corrections or additions to the new handbook.
It is anticipated that the examples and case stud-ies used in the handbook will be based on thepublic access model and will be coordinated tothe greatest extent possible with the develop-ment of the Casualty Actuarial Society’s newRisk Modeling Workshop. Documentation, en-hancements and “conversion” to “open source”for the public access model is the subject of an-other WP being sponsored by the DRMC, so co-ordination of the handbook with this WP is alsopart of the process.
The general guideline was for the DRMHandbook Working Party to complete its assign-ment within one year. Unfortunately, the originaltime frame has turned out to be optimistic. Whilethe majority of the handbook is now in its editingstage, we still require a great effort on one of theprimary casualty chapters, Price/ReservingModels. But first, the basics of the handbook:The structure of the DRM Handbook will in-clude nine chapters and three appendices.
Chapters1. Introduction2. Overview of the DRM Process3. Strategies4. Scenarios5. Asset Modeling6. Price/Reserve Modeling7. Performance and Risk Measures8. Coherent Measures of Risk9. Presentations of DRM Results
Appendices1. Bibliography2. DRM Checklist of Considerations3. Glossary of Terms
Because the distribution of the handbook will bedigital, it is intended that it will be regularly up-dated to highlight technical advances and inno-vations in risk modeling.
While the majority of the DRM Handbook is pro-gressing nicely, there are still a couple of areas inwhich the handbook requires additional efforts.The first area is in the development of Chapter 6,Price/Reserve Modeling. The second area is inthe development of the five case studies for thehandbook. We are still looking for writers forthese critical additions to the DRM Handbook.If you are interested, please contact Run Yan [email protected] or myself at [email protected]. F
w Page 6
Dynamic Risk Modeling CRO ForumRisk Management w March 2006
Dynamic Risk ModelingHandbook
w continued from page 5
Page 7 w
CRO Forum
T he Chief Risk Officer (CRO) Forum,comprising risk officers of the majorEuropean insurance companies and fi-
nancial conglomerates, was formed to addresskey risk issues. It is a technical group focused ondeveloping and promoting industry best prac-tices in risk management. The membership ismade up of the following companies: AEGONNV, Allianz AG, Aviva PLC, AXA Group,Converium, Fortis, Generali, ING Group,Munich RE, Prudential PLC, Swiss Re,Winterthur and Zurich Financial Services. Inthe November 2005, Issue No. 6 of RiskManagement, the June 2005 CRO Forum study,“A Framework for Incorporating Diversificationin the Solvency Assessment of Insurers” waspresented. This article summarizes the otherCRO Forum study published at that time.
IntroductionThe CRO Forum has undertaken a study tobenchmark internal models, so as to discuss theadmissibility of these models for regulatory pur-poses in the context of Solvency II. In internalmodels the true risk profile and solvency posi-tion of a company is reflected and therefore theuse of internal models provides a real incentivefor improved risk measurement and risk man-agement. The study presents the results of thebenchmarking of internal models and also pre-sents a proposed set of principles that could beused by regulators for validating and admittinginternal models for regulatory capital purposes.
Inventory of Risk MeasurementFrameworks Used by CRO Forum MembersThe CRO Forum established a benchmarkingteam consisting of Damir Filipovic and DanielRost of the University of Munich, with MercerOliver Wyman for supplementary support. A de-tailed questionnaire, set up by the benchmark-ing team, was completed by all participants andthree regulatory agencies. The survey outcomeswere discussed with the risk management de-partments of all 13-member companies. Therewere also responses from BPV (Switzerland),DNB (Netherlands) and BaFin (Germany).
Overview of the Results of theBenchmarking StudyThe most important and interesting conclusionis that the approaches used by the participantsin the benchmark study are highly similar. Insome cases there are differences, often drivenby differences in the type of business.
With respect to the framework definition, mostof the participants (69 percent) use a VAR ap-proach with a one-year time horizon, and morethan 75 percent follow an economic approach.The vast majority (85 percent) only use, at max-imum, one year of new business. Only a few (15percent) use the IAA (A Global Framework forInsurer Solvency Assessment) advised TailVaRas the risk measure due to the complexity of thismeasure. With respect to the confidence levels,all participants use a confidence level above99.5 percent (99.6 percent to 99.99 percent).For solvency purposes a regulatory consensusappears to be converging to 99.5 percent.
Overall, the modeling methodologies used arein line with those recommended in the IAASolvency Framework paper. The importantissue is that ALL risk should be measured in aconsistent way. All participants model andmeasure market risk and credit risk. Most par-ticipants (more than 75 percent) also modelcredit risk for reinsurers. As expected the quan-titative measurement of operational risk is stillin its infancy.
The interesting conclusions on the frameworkimplementation are that most (69 percent)have a detailed documentation system, but thatonly about half (54 percent) have a formalizedsign-off procedure. Also it seems that, al-though critical for gaining senior managementcommitment, links to management compensa-tion are still in their infancy.
Chief Risk Officer ForumPrinciples for Regulatory Admissibility of Internal Modelsby John C.R. Hele and Henk van Broekhoven
People have troubleincorporating a prioriprobabilities, whichcan be the mostimportant factor with qualitative information in estimating probabilities.
Overview of the Resulting Principles Defined by the Chief Risk Officer ForumPrinciple Risk Modeling Framework• Internal models need to be based on the
adverse movement in the Economic Value of the difference between the Assets and Liabilities, calibrated to an annualized 99.5 percent probability of solvency.
• Modeling approaches based on longer time horizons or alternative risk measures (e.g., TailVaR) are permissible, provided the calibration approach used can be shown to be consistent with an annualized 0.5 percent probability of economic insolvency
• One year’s new business should be explicitly modeling, based on assumptions that are consistent with business plans, where this has a material impact on the risk profile of the group
• Assets that are not likely to be available in the event of insolvency (for example, profits from future new business, the component of deferred tax assets arising from losses carried forward), should not be included as available capital in the internal model
• Best estimate liability cash flows should be discounted at swap rates, as they are typically the most liquid, complete and reliable risk-free rates available. This is more conservative than using a truly economic discount rate that would include an allowance for the credit spread of the insurer itself (or of the counterparty to whom the liabilities would be transferred in the event of insolvency)
Principle Modeling Market RiskAll sources of market risk need to be modelingprobabilistically with inter-factor dependenciesexplicitly modeling.• Choice of modeling approach (simulation-
based or analytical) and granularity of modeling needs to be proportionate to the risks/businesses being modeling. For example:
• Interest rates — Cash flow matching taken account of by modeling of the whole yield curve
• FX mismatch risk — Currency mismatches between assets and liabilities/supporting capital explicitly modeling
• Equity risk — Equity risk modeling based on analysis of the relevant market index where concentration in individual sectors/ individual stocks differs from the index, such concentrations should be explicitly modeling
• Real estate risk — Real estate risk modeling based on analysis of the relevant property market index, or reasonable proxies if such an index is unavailable—where concentra-tion in individual sectors/individual stocks differs from the index, such concentrations should be explicitly modeling
• Derivatives/market risk mitigation — Explicit modeling through simulation/scenarios, with counter-party credit risk also being measured.
• Embedded options and guarantees explicitly modeling through simulation modeling:¡
Management actions (e.g., bonus rateson participating business, dynamic asset allocation policies), where material, should be explicitly and real-istically modeling, with modeling management actions codified as policy and disclosed to the supervisor
¡
Policyholder behavior, where material, should be explicitly and dynamically modeling, with key assumptions (which could be either expert-opinion based or empirically based) being disclosed to the supervisor
• Parameterization of volatility and depend-encies between market risk factors should be derived from an appropriate and reliably time series of market data, and should be estimated accounting for tail dependencies (e.g., understressed conditions)
Principle Modeling Credit Risk• All sources of credit risk need to be mod-
elled, or demonstrated to be insignificant.¡
Investments¡
Reinsurance/derivative counterparty failure
¡
Credit insurance¡
Trade creditors, debtors• All different manifestations of credit risk
should be modeling¡
Default risk¡
Migration risk¡
Spread risk
Principles for RegulatoryAdmissibility ...
w continued from page 7
CRO Forum CRO ForumRisk Management w March 2006
w Page 8
March 2006 w Risk Management
CRO Forum
Page 9 w
• Credit insurance should be modeling using methodologies that reflect the specificexposure characteristics and risk mitigation options inherent in the business
• If credit exposures can be accurately repre-sented by external credit indices (e.g., Euro ‘A’ corporate bond index) and credit concentrations are not material relative to the relevant index, then default risk, migration risk and spread risk can be modeling on integrated basis through direct modeling of the index (e.g., through an Economic Scenario Generator)
If representative credit indices are not avail-able, or credit concentrations are material, thendefault and migration risk need to be modelingexplicitly in a manner aligned with the princi-ples of Basel II.
Principle Modeling Insurance Risks• For life/health insurance mortality,
morbidity and persistency risk should all be measured, ensuring that parameter, process and calamity risks are all covered by the modeling
• For non-life insurance the risk associated with current year underwriting (premium risk) and prior years’ underwriting (reserve risk) should both be measured (either in an integrated model, or separately), again ensuring that parameter, process and calamity/catastrophe risks are all covered by the modeling
• For both life /health and non-life insurance process, catastrophe/calamity and param-eter risk should be measured using either scenario or probabilistic approaches¡
Process (or volatility) risk, the risk associated with the anticipated year-to year volatility in insurance result, should be measured probabilistically,supported by scenario analysis where appropriate
¡
Separate estimation of calamity/catastrophe risk should be carried out using scenarios/probability distribu-tions based on scientific analysis and expert opinion
¡
Parameter risk – if significant, level and trend risk should be measured separately based on a combination of scientific analysis, expert opinion andanalysis of historical experience
• Reinsurance/risk transfer¡
Proportional reinsurance can be modeling consistently with the approach used for modeling the gross losses
¡
For additional credit to be given for non-proportional reinsurance sce-nario or probabilistic approaches must be used
¡
Capital must be held to cover the risk of counterparty failure, taking into account possible dependencies between the size of gross losses occurring and counterparty failure
Principle Modeling Operational risk• Operational risk needs to be explicitly
accounted for under Pillar 1, in a manner aligned with the principles of the Basel II approach
Reaction to the StudyRegulators and other interested parties were ap-preciative and complimentary toward the study.Solvency II is moving ahead in 2006 with inter-nal models as a core foundation in the frame-work. Work is now underway by the CommitteeEuropean Assurance (CEA), the EuropeanInsurers Association, and also with the help ofthe CRO Forum, on the development of a recom-mended standard model for insurers. SolvencyII regulations are expected to be drafted by 2007for an expected introduction by 2010, creating amodern financial regulatory insurance systemfor Europe. F
More detailed information can be found in the June 10, 2005 CRO-
forum paper: “Principles for Regulatory Admissibility of Internal
Models.” Copies can be obtained at the secretariat, CRO Forum:
Further information: Risk Management, Issue No. 6, November 2005: “Chief Risk Officer
Forum: A framework for incorporating diversifications in solvency
Assessment of insurers.”
“Solvency Assessment Models Compared,” CEA and Mercer Oliver
Wyman, March 2005
IAA: “A Global Framework for Insurer Solvency Assessment” 2004
T he Committee of SponsoringOrganizations (COSO) of the TreadwayCommission was started by profession-
als from the following five professional organi-zations: The AmericanAccounting Association,The American Institute ofCertified Public Accounts,The Financial ExecutivesInstitute, The Institute ofInternal Auditors, and TheInstitute of ManagementAccountants. Actuarieslike to think of COSO as aeuphemism for account-ants taking over the world,especially in view of itssponsorship. The COSOhas as its primary goal theimprovement of corporate
financial reporting, which makes it a strongholdin the emerging practice of Enterprise RiskManagement.
The COSO published Internal Control—Integrated Framework, in 1992 in response torecent corporate scandals and audit impropri-eties. It should not be a surprise to anyone thatbusiness scandals lead to increased regula-tions. The Security and Exchange Commission(SEC) and the National Association ofInsurance Commissioners (NAIC) have as theirmission to protect consumer interests from theeffects of corporate misconduct. Their onlyweapons are legislation and regulation, but theyare aimed at the good, the bad, and the uglyalike. Paradoxically, the SEC and the NAIC, ineffect, contribute to the erosion of consumervalue because the burden of increased legisla-tion and regulation challenge the best andbiggest of companies to survive profitably undertough economic and regulatory conditions. TheCOSO principles of internal control are intend-ed to be self-policing, by providing a frameworkto place under surveillance the activities of keyareas of a company. A surveillance systemshould link key activities across an organization
and illustrate the impact on the organization of afailure in a key activity. For example, if policieserror from a reserve valuation run, then the sur-veillance system should capture the missingpolicies and trigger an alert to indicate, at thevery minimum, that the number of policies val-ued does not agree with the policy count of thevaluation file. While more complicated alertsare possible and appropriate, it was rare to findinsurers with this simple model in place to vali-date reserves in my many years of performingactuarial audits on insurance companies.
The new approach to risk management as em-bodied in the COSO principles looks at organi-zational risk from a broader perspective thanwould traditional risk management. Traditionalrisk management was purely concerned with thefrequency and severity of expected losses. Thenew risk management paradigm has a muchwider wingspan and circles over a much widerlandscape of an organization with its internalcontrol doctrines. The COSO defines internalcontrol as a process, effected by an entity’s boardof directors, management and other personnel,designed to provide reasonable assurance re-garding the achievement of objectives in the fol-lowing categories: 1) Effectiveness andefficiency of operations, 2) Reliability of finan-cial reporting, and 3) Compliance with applica-ble laws and regulations. It is important tounderstand the fundamental concepts uponwhich this definition rests. First, internal con-trol is a process, a means to an end, not an end initself. Second, internal control is effected by peo-ple. It is not merely policy manuals and forms,but people at every level of the organization.Third, internal control can be expected to provideonly reasonable assurance, not absolute assur-ance, to an entity’s management and board.Fourth, internal control is geared to the achieve-ment of objectives in one or more separate, butoverlapping categories.
Let’s examine briefly each of these fundamentalconcepts.
Internal Controls—The COSO Wayby Dorothy L. Andrews
The COSO Way The COSO WayRisk Management w March 2006
w Page 10
Dorothy L. Andrews, ASA,
MAAA, is vice president
of the risk management
department of Wachovia
Corporation in Charlotte,
N.C. She can be reached
at Dorothy.Andrews@
wachovia.com.
ProcessThe most important thing to understand aboutinternal control is that it is a management toolconsisting of a network of business activitiesthat are not only inter-related, but also reactiveto negative stimuli within the network. This net-work extends to and is ingrained in every cornerof the organization, making it as much of theessence of the organization as that expressed bythe organization’s mission statement. In thisway, internal control is not intended to relievemanagement of an active and participatory rolein running the business or the responsibility ofadverse consequences of business activities.
The COSO way describes internal controls as“built-ins” rather than “built-ons” to an organi-zation’s infrastructure. The difference is thatbuilt-in controls are internal to a process, whilebuilt-on controls are external to a process. Forexample, enabling valuation systems to pro-grammatically verify policy counts and premi-ums against financial ledger amounts is anexample of a built-in control. In this scenario,discrepancies are highlighted immediately andappropriate actions can be taken. A built-oncontrol would involve a manual reconciliationof the two files, which, depending on resources,may or may not get done. Built-in controls arethe handmaidens to effective quality initiatives,aiding in the containment of the cost of doingbusiness and decreasing reaction time to ad-verse events.
PeopleWe all know the cliché, “Our people are ourgreatest asset,” or something similar. These as-sets, however, can erode company value if ill-trained to perform as needed. Internal control isimplemented by every member of the organiza-tion, from the board members to the reception-ists and security guards. They all have a role toplay in effecting sound internal control manage-ment. Most people in an organization do not un-derstand the impact their jobs have on the workproductivity of others. For this reason, it is im-portant to train associates at all levels of an
organization in the principles of risk manage-ment. The principles emphasize the impact andinter-relationships among firm activities.
Information is a most valuable asset in a compa-ny and senior management depends on highquality information to steer the organization in aprofitable direction. However, the flow of infor-mation in many organizations is a lot like play-ing the familiar, childhood telephone game. Inthe telephone game, a message is whisperedfrom one person to the next until it gets to the lastperson in the line. The last person stands up andrecites the message and a comparison is made tothe content of the message whispered by the firstperson in the line. With near perfect probabili-ty, the recitation made by the last person has norelationship to the content of the initial messagewhispered. This game epitomizes the flow of in-formation in most insurance companies withsenior management as the final stop. The instal-lation of a sound set of internal controls will im-prove the handoff of information around theorganization, and empower management to bet-ter manage the company. Key to installing inter-nal controls is an associate education program,which focuses on the interplay and impact of ac-tivities conducted throughout the organization.At the very minimum, risk management educa-tion should begin with new hires and then ex-tend to others with the goal of changing thecurrent culture to a more risk-conscious one.
Reasonable AssuranceAn organization may not succeed with internalcontrols, but it clearly cannot survive withoutthem. They are not absolute in the preventingmanagement from navigating the organizationin the wrong direction, however. By their verynature, internal controls have limitations, as itis nearly impossible to manage for every opera-tional and enterprise contingency. But, internalcontrol systems do allow for retrofitting and up-grading as an organization sees fit to narrow therange of events that can nudge it off course. This
March 2006 w Risk Management
The COSO Way
Page 11 w
continued on page 12 w
“The difference is thatbuilt-in controls areinternal to a process,while built-on controlsare external to aprocess.
”
implies there must always be someone on watchand ready to react to adverse indicators triggeredby the system.
ObjectivesCompany objectives generally fall into one ofthree categories: operations, financial reporting,and compliance. Operational objectives includeall those objectives relating to the effective andefficient use of firm resources. Financial objec-tives relate to the preparation of financial state-
ments. And complianceobjectives relate to compli-ance with laws and regula-tions. Operational object-ives differ from the othertwo in that the achievementof the latter two objectivescan be measured by exter-nal means. For example, ei-ther a company is compliantwith a law or it is not.Operational objectivescome in two flavors: inter-nal and external. Theachievement of internal op-erational objectives is sub-
ject to the people and processes of anorganization. External operational objectives arenot always within complete and total control ofthe organization. For example, the achievementof a specified investment return is not in the solecontrol of management. The internal control in-frastructure should be responsive in measuringthe fit or lack of fit between external organiza-tional objectives and unfolding experience.
It should be recognized that an organization’s ob-jectives may fall into more than one category toaddress different needs and assign accountabili-ty for meeting those objectives to different offi-cers of the company. The overlap should notprevent a reasonable assignment of expectationsin meeting each category of objectives.
The Five Components of InternalControlThe COSO has defined internal control as con-sisting of the following five components: controlenvironment, risk assessment, control activities,information and communication, and monitor-ing. Each of these components is worthy of moreattention than the treatment given here.However, a coloring of the role of each compo-nent in building an effective internal control sys-tem is important to complete this discussion.
Under COSO, a control environment is the sumtotal of the people making up the organization.Their integrity, ethical values, and competenceare the main drivers of a company’s success orfailure. Education becomes key in making sureeach member of an organization understands therisk culture management values and in makingsure all members understand the required com-petencies required for their role.
The risk assessment function on a basic levelidentifies, analyzes and manages related risks.On a higher level, risk assessment involves theintegration of risk recognition with objectives re-lated to sales, production, marketing, financialand other activities. This integration should en-able all these activities to work in tandem to max-imize company value.
Control activities consist of the policies and pro-cedures that monitor the execution of manage-ment directives. These activities come in manydifferent forms depending on the directive.Approvals, authorizations, verifications, recon-ciliations, reviews of operating performance, se-curity of assets, and segregation of duties areamong the types of control activities supportedby a system of internal control. They are designedto prevent intentional and unintentional breach-es of the risk policy of an organization.
It is universally agreed that the delivery of quali-ty information is the central ingredient to gooddecision making. The COSO recognizes all thesources of both internally and externally generat-ed data and supports a complete inventory ofsuch to define the inter-relatedness of all thepieces. These inter-relationships form the basis
Internal Controls—TheCOSO Way
w continued from page 11
The COSO Way The COSO WayRisk Management w March 2006
w Page 12
of a risk management surveillance system andare integral to an internal control process. Thecommunication to and education of associatesfurther cements the importance of the roles per-formed by others and the impact of these variousroles in concert and in isolation.
Lastly, the ever important activity of monitoringis a necessary evil to ensure the process in work-ing as desired. Periodic evaluations are neces-sary to flag irregularities in the system. Thescope and frequency of these activities is afunction of the degree to which manual process-es are involved. More manual tasks naturallybecome candidates for more monitoring tomaintain equilibrium in the system. It is impor-tant to report imbalances upstream for immedi-ate resolution to empower management toadjust the course of the organization toward amore profitable direction.
In summary, installing internal controls is nosmall task. Many organizations have antiquatedsystems and depend on manual processes con-trolled by people to understand the organiza-tional mechanics that drive bottom line results.It also becomes very challenging to assess howand when pertinent data adversely changesform or if it has changed at all. Maintaining dataintegrity as data flows throughout the organiza-tion must be a top priority and a key objective indesigning an internal control process. A secondpriority and design incentive must be the align-ment of individual goals with company objec-tives. History has shown us that a misalignmentis often the root cause for the deterioration ofcompany value. It is more true than not that thelikelihood of a catastrophe event bringing downan organization is much, much smaller than thatof mismanagement. Therefore, if an organiza-tion needs two reasons for installing internalcontrol processes, then maintaining data in-tegrity and preventing mismanagement are verystrong ones.
Required reading for all risk officers: InternalControl—Integrated Framework, September,1992 and Enterprise Risk Management—Integrated Framework, September, 2004, bythe Committee of Sponsoring Organizations of
the Treadway Commission. Both are availablefrom the American Institute of Certified PublicAccountants (www.aicpa.org) for less than onebusiness scandal or one faulty audit. F
March 2006 w Risk Management
The COSO Way
Page 13 w
“History has shown usthat a misalignment isoften the root causefor the deterioration ofcompany value.
”
I n October 2005, Standard & Poor’sRatings Services announced a new addi-tion to the analysis process that leads to the
ratings of insurers: Enterprise RiskManagement (ERM) eval-uation criteria.
Within the evaluation ofERM capabilities, Stand-ard & Poor’s will primarilybe looking at how manage-ment of an insurer definesthe loss tolerance of thefirm and the processes thatare being performed to as-sure that losses experi-enced by the insurer arekept within that loss toler-ance. In addition, the ERM
evaluation will focus on the degree to which in-surer management views risk and return forrisk-taking in setting corporate direction and instrategic decision-making.
The ERM evaluation will primarily be a subjec-tive view of quality of management practices.The focus will be to look for practices that arebeing carried out in a systematic and consistentway that will lead to the control of future lossesin a predictable manner and that will lead to anoptimal risk/reward structure for the insurer’sbusinesses. The ERM practices will be viewedin comparison to the risks of the company and tothe practices of peer companies with similarrisks. Standard & Poor’s will look for sophisti-cated risk-management practices to deal withsophisticated risks.
Insurers will be viewed as having “excellent,”“strong,” “adequate” or “weak” ERM.
To reach those views, Standard & Poor’s willevaluate ERM quality in five areas:
I. Risk Management CultureRisk management culture is the degree towhich risk and risk management are importantconsiderations in the everyday aspects of cor-porate decision-making. To evaluate risk management culture, Standard & Poor’s willlook at the staffing and organizational struc-ture of the people who are charged with execut-ing the risk management function in theinsurer. The governance structure as it relatesto risk management is another aspect of risk-management culture. A favorable indicator ofrisk-management culture is a structure that isindicative of a high degree of influence on decision-making by risk management staff.Communication of risk and risk management—both inside and outside of the insurer—are also indicators of risk-management culture. An insurer with a strongrisk management culture will have a verytransparent risk management process withinthe company and with other interested partiesthrough their public communications.
II. Risk ControlsRisk control is achieved through identifying,measuring and monitoring risks as well as bysetting and enforcing risk limits and managingrisks to meet those limits through risk avoid-ance, risk transfer and risk offset or other risk-management processes. Standard & Poor’s willevaluate risk-control processes for each of theimportant risks of an insurer. Consistency be-tween the overall corporate risk tolerances andthe specific risk limits will be an important con-sideration. Summary descriptions of risk-con-trol programs as well as examples of actualexecution will be reviewed. Standard & Poor’swill be looking for insurers that have programsthat are structured to effectively deliver the riskcontrol needed to maintain the exposures andlosses within the risk tolerances as well as con-sistent execution of those programs that is suffi-ciently embedded in everyday practices thatfuture execution can be reliably inferred.
w Page 14
Standard & Poor’s Enterprise Risk ManagementEvaluation of Insurersby David N. Ingram
David N. Ingram, FSA, is
director of enterprise risk
management with
Standard & Poor’s in
New York, NY. He can be
reached at david_ingram@
standardandpoors.com.
Evaluating Insurers Evaluating InsurersRisk Management w March 2006
III. Extreme Risk ManagementExtreme-event risk management is concernedwith the impact of low frequency adverse eventson the company. Low frequency events cannoteasily be managed via a control process becausethe monitoring is not expected to show any re-sults in most periods. Common extreme eventrisk control practices include trend analysis,stress testing, contingency planning, problempost mortem and risk transfer. Standard &Poor’s will be looking for insurers to show thatthey are practicing extreme risk management inadvance of problem events and will also be look-ing for the results of effective extreme event riskmanagement during and after adverse events.Those results will include prompt informationon the exposure of the insurer to loss from the ac-tual event, prompt and surefooted insurer re-sponse to the event, losses that are moderated insome fashion, and a clear set of lessons learnedand adjustments to future procedures.
IV. Risk and Economic CapitalModelsRisk and economic capital models are an im-portant part of ERM. Effective flow of informa-tion about risk positions and their possibleimpact on the insurer are key to effective riskmanagement. Standard & Poor’s assesses therisk models of an insurer in relation to therisks of the insurer and to the processes thatthe insurer has to use the information from therisk models. An insurer with effective riskmodels will be able to show that the modelsproduce the information needed to performthe basic risk-control functions that are need-ed to sustain losses to within their risk toler-ances. This means that the risk models need toproduce information that is sufficiently accu-rate, up-to-date and timely to drive correctand well-timed risk-management decisionsand actions. These models need to be clearlyunderstood by management. The insurerneeds to demonstrate a regular process ofmodel validation as well as a process for up-dating data about the business activity beingmodeled and the assumptions that are used inthe model. The model needs to be sufficientlyrobust to produce insight into all of the risksthat are retained as well as the risks that arewritten but not retained. The models need to
provide information that is both descriptive ofthe size of the risk and information that is ac-tionable in managing the risks. If those twodifferent objectives are met by different mod-els, then the two models need to be reconciledregularly.
To accomplish strategic risk management, in-surers need to determine the risk capital that isassociated with their products, investments andoperations. Evaluation of an insurer’s processesfor developing risk capital involves looking atthe underlying assumptions, data flows, valida-tion and calculation processes. Insurers thatuse regulatory or rating agency risk-based capi-tal formulas without modification will bepressed to demonstrate that those models ap-propriately capture the actual risks of their spe-cific business. Insurers that modify thoseformulas in an appropriate manner to reason-ably approximate the capital needed to supporttheir risk positions are seen to have adequatepractice in this area. Economic capital modelsare sophisticated and detailed models that pro-duce spot values for capital needs, often linkedclosely to specific market values on the exactday of the calculation. For very complex risks,economic capital models might be the only man-ner of reasonably identifying capital needs.
At this point, Standard & Poor’s will be lookingfor appropriate processes to develop risk capitalamounts that are consistent with the insurer’srisks and risk-management programs, that havean update and validation process that producesa result that is consistent with the intent of theinsurer, and that are produced on a schedulethat will support usage in the insurer’s strategicrisk-management processes.
Standard & Poor’s will be continuing to developrobust processes of evaluating insurers’Economic Capital processes so as to better in-form our overall view of the financial strengthand capitalization in particular. This review willonly be performed for companies that are foundto have effective and coordinated processes forrisk control, business continuity, risk manage-ment culture, and risk models.
March 2006 w Risk Management
continued on page 16 w
Page 15 w
“As ERM becomes the mantra for today’sinsurance organizations, companies can fail toassess the real impactof reinsurance in theERM integrationprocess.
”
Evaluating Insurers
V. Strategic Risk ManagementStrategic risk management is the process that aninsurer uses to incorporate the ideas of risk, riskmanagement and return for risk into the corpo-rate strategic decision-making processes. Riskcapital is usually a key concept in theseprocesses. Standard & Poor’s analysis of strate-gic risk management will start with understand-ing the risk profile of the insurer and getting
management explanationof the reasons for recentpast changes in the riskprofile as well as expectedfuture changes. Risk pro-file can be expressed interms of risk capital forvarious risks or for each ofthe businesses of the in-surer. Insurers might alsobe able to express an un-derstanding of the sensi-tivities of that risk profileto the time view and theloss tolerance of the metric
used. Standard & Poor’s looks at the methodused for the allocation of any diversificationbenefit that is incorporated into the risk profileand the impact of the allocation choice on thestrategic decisions made using the risk capital.
Strategic processes that could be affected byrisk and risk management thinking include cap-ital budgeting, strategic asset allocation, prod-uct risk/reward standards, risk-adjustedfinancial targets, and performance measure-ment, dividend practices and incentive com-pensation. The degree to which risk capital isvital to these processes and to which risk andrisk management are a consideration on theseprocess is indicative of the quality of strategicrisk management.
Concluding RemarksThe evaluations of each of these five areas willbe combined into a single classification of qual-ity of ERM. The degree of importance of each
factor in that judgment will vary on an individ-ual basis among insurers according to the spe-cific situation of the insurer. (See Table 1 onpage 17).
The importance of ERM in that process will de-pend on the risks of the insurer and the capacityof the insurer to absorb losses. For an insurerwith a high capital position and/or excellent ac-cess to capital and a business plan that concen-trates on retaining only those risks that are lesscomplex and well understood by the company,ERM will be less important in forming the ratingdecision. For insurers with tight capital and/orlimited access to capital that are exposed to verycomplex risks, ERM will be a very importantpart of the rating decision. However, capital isnot seen as a substitute for ERM. A companywith a high capital position still needs to be ableto demonstrate that it has the ability to maintainthat position through limiting future losses. Inaddition, Standard & Poor’s will continue toview an insurer with more capital to be more se-cure than an insurer with less capital. F
ERM Evaluation of Insurers
w continued from page 15
w Page 16
Evaluating Insurers Evaluating InsurersRisk Management w March 2006
March 2006 w Risk Management
Page 17 w
Evaluating Insurers
Table 1: Definitions of ERM Classifications
Classifications Definition
Excellent
Insurer has extremely strong capabilities to consistently identify, measure and manage riskexposures and losses within the company's predetermined tolerance guidelines. There isconsistent evidence of the enterprise's practice of optimizing risk-adjusted returns. Riskand risk management are always important considerations in the insurer's corporate deci-sion-making.
Strong
Insurer has strong capabilities to consistently identify, measure and manage risk exposures and losses within the enterprise's predetermined tolerance guidelines. A strongERM insurer is somewhat more likely to experience unexpected losses that are outside ofits tolerance level than is an excellent ERM insurer. There is some evidence of the enterprise's practice of optimizing risk-adjusted returns, though it is not as well developedas those of leading industry practitioners. Risk and risk management are usually importantconsiderations in the insurer's corporate decision-making.
Adequate
Insurer has capabilities to identify, measure and manage most major risk exposures andlosses, but the process has not been comprehensively extended to all significant risks facing the enterprise. Insurer loss/risk tolerance guidelines are less developed. Executionof its existing risk-management programs is sufficient, albeit less comprehensive, than arestrong and excellent ERM practices. Unexpected losses are more likely to occur, especially in areas beyond the scope of the existing ERM practices. Risk and risk management are often important considerations in the insurer's corporate decision-making.
Weak
Insurer has limited capabilities to consistently identify, measure and manage risk exposures across the company and, thereby, limit losses. Execution of its risk-managementprogram is sporadic, and losses cannot be expected to be limited in accordance with a setof predetermined risk/loss tolerance guidelines. Risk and risk management are sometimesconsidered in the insurer's corporate decision-making. Business managers have yet toadopt a risk management framework, are satisfying regulatory minimums without regularly applying risk management to their business decisions, or have very recentlyadopted a risk management system that has yet to be tested.
M ost companies have begun to con-sider implementing enterprise riskmanagement (ERM) in some form.
ERM is a process that includes several steps,including:1) Establishing an ERM framework and risk
governance2) Risk identification3) Risk assessment4) Risk response5) Incorporation into performance
measurement/management6) External risk reporting
Some companies are more advanced along thisprocess than others, though few have masteredall of the steps above. However, many insurancecompanies have become overly focused on oneof these steps in particular, risk assessment.Many insurers hear ERM and immediatelythink Economic Capital (EC)— the process ofbuilding a model to quantify the amount of re-quired capital based on an internal assessmentof company-specific risks and correlations.This is partly because EC has the compellingpotential to reduce required capital by recog-nizing risk diversification benefits, as well asmany other applications. Also, the actuaries in-volved in ERM are attracted by the challenge ofsuch a complex modeling exercise.
Such companies also tend to begin the EC effortvery early in the ERM process, effectivelyjumping ahead to the risk assessment step (step3). EC takes a long time, so there is a tendency toget started in a hurry. Insurance companies typ-ically have a highly complex set of risks andsome very long-term contracts. Quantifyingthese risks often involves advanced tools andtechniques, which can push the envelope ofmodern data/projection systems.
EC can be a valuable component of the ERMprocess for insurance companies. However, anover-emphasis on EC, to the point of neglect ofother steps in the ERM process, can reduce theeffectiveness of an ERM program. This is analo-gous to building a critical machine part withoutfirst considering how it will mesh with its neigh-boring parts and gears. At best, this will cause
friction; at worst, the process will grind to a halt.These ERM programs typically suffer from anincomplete integration of EC into decision-making processes and a lack of buy-in from in-ternal and external stakeholders. As a result,these ERM programs are experiencing difficul-ties, regardless of how sophisticated, completeand accurate their EC models may be.
To successfully implement an ERM programsupported by EC, insurance companies mustbuild the EC model only after carefully consid-ering its interaction with each step in the ERMprocess.
ERM FrameworkThis step involves defining the ERM processsteps and how they will interact, developing animplementation plan, and defining the metricsand procedural structures for key strategicERM decisions—those made by the ERMcommittee.
Building the EC model without an ERM frame-work in place requires assumptions as to the ex-tent and timing of each ERM process step. Thiscan easily result in the EC model being unableto support other ERM steps in a timely fashion.One mid-size insurer was in the midst of build-ing a robust EC model when the ERM frame-work was revealed requiring that EC supportproduct pricing within a very short time period.The EC model being developed was too robust tocomplete within the required time frame.However, had the overall framework and planbeen known in advance, the EC model couldhave been built in advancing stages of robust-ness to provide at least adequate pricing supportin the near term.
Another implication of putting EC modelingahead of this step is that EC may be unable tosupport a key strategic ERM decision—manag-ing enterprise risk exposure to within risk ap-petite. The capital-only basis of the EC measuremay be inconsistent with the ERM frameworkdefinition of risk appetite. For example, risk ap-petite may be expressed as a measure of share-holder value volatility (based on a discountedprojection of distributable earnings) rather than
w Page 18
“To successfully implement an ERM program supported by EC, insurance companies must buildthe EC model only aftercarefully consideringits interaction witheach step in the ERMprocess.
”
ERM ≠ EC2
by Sim Segal
Sim Segal, FSA, MAAA, is
a senior manager in
Deloitte Consulting’s
Insurance and Actuarial
Solutions practice in New
York, N.Y. He can be
reached at simsegal@
deloitte.com.
ERM ≠ EC2 ERM ≠ EC2Risk Management w March 2006
a measure of capital alone as provided by the ECmodel. This would cause delays while the ECapproach is adjusted to support this, though thelength of the time needed will vary dependingon the specific EC methodology employed.
Risk GovernanceIn this step, management establishes the orga-nizational and functional risk governancestructure, including identifying the executiverisk owners and defining their roles. Not in-volving the executive risk owners early on inthe EC process can foster opposition to EC.Without input from executive risk owners, themodel results will be suspect. However, thiscan be quickly remedied once they are en-gaged, simply by revising model assumptionsand other inputs. Of more concern though isthe lack of political buy-in from internal stake-holders. Most executive risk owners are fromthe business segments. Excluding these stake-holders from early involvement may give theimpression that EC is an effort that will be con-trolled and imposed by corporate, with fewuseful applications for management. This willcause resistance in every arena of ERM inwhich EC is intended to operate. The longerthis notion is allowed to take hold, the morechallenging it is to overcome. Because EC isprimarily intended as a tool employed by therisk takers in the business segments, the earli-er these stakeholders are involved and receivethis message, the better.
Risk IdentificationIf the EC model precedes the risk identificationstep, the EC model may be incomplete, havingignored certain risks. For example, key risks (toinclude in EC quantification) may have beendefined in this step using qualitative criteria,whereas the risks included in the EC model mayhave been based on quantitative thresholds.This can result in delays while the missing risksare introduced into the EC approach and EC re-sults are revised based on new risk correlationfactors. If this is not corrected, the EC modelwill be unable to support decisions involvingthe risks excluded and the EC amount for the re-maining risks will be based on an incompletecorrelation covariance matrix.
Risk ResponseThis step includes the full range of decisionsthat will be supported by risk information in theERM process. Prior to building the EC model, it
is important to understand the scope of deci-sions that the model must support. Without this,the integration of EC into key decision-makingprocesses may be incomplete. There are a num-ber of issues that must be addressed in advance,including the following:
At what level of the organization will EC be ex-pected to support decisions—enterprise, busi-ness segment, product line, etc.? This impactsEC model structure and required data and as-sumptions. For example, assume that the ECmodel was constructed to support only businesssegment-level decisions—the level for which this com-pany has existing financialdata and supporting alloca-tions (e.g., investment in-come, expenses, etc).However, once the risk re-sponse step is defined, thereis a requirement that EC sup-port product-level decisions.This will cause significantdelays to produce the re-quired data inputs and modelenhancements and to satisfyother requirements, such astraining an additional layer ofmanagement in the use of EC.
What types of decisions will be supported—strategic (e.g., strategic planning, capital man-agement, etc.), tactical (e.g., retention efforts,hedging programs, etc.), pricing, etc.? This im-pacts the processes with which the EC effortmust be coordinated. This involves coordina-tion of people and processes, integration of sys-tems and building applications that support thespecific decisions. One large multi-line insurerdeveloped its EC model in isolation, without thecoordination needed to integrate the model intodecision-making processes through the compa-ny. As a result, after a lengthy and costly ECmodel development exercise, the model wasonly used by the corporate area and remaineddisconnected from decision-making processesin the business segments.
What risks must be reflected in the decisionssupported—just financial risks or also opera-tional risks? This may impact the EC modelingapproach. At many companies, the EC ap-proach uses a shortcut method (e.g., a fixed per-centage of capital) for assessing operational
March 2006 w Risk Management
Page 19 w
ERM ≠ EC2
continued on page 20 w
risks. Some of these companies later realize, inthe risk response step, that there is a need for amore robust approach to operational risk con-sistent with that used for financial risk. This re-sults in delays while the EC model is enhancedto address operational risks in the same way itaddresses financial risks. At companies wherethis issue is not addressed, the EC model is un-able to support decisions involving operationalrisks, e.g., evaluating alternate risk mitigationtechniques.
PerformanceMeasurement/ManagementEC measures should not be integrated into per-formance measures and certainly not into incen-tive compensation until the EC model is fullydeveloped and stabilized. However, to secureinternal stakeholder buy-in and support for theEC effort, it is important to clearly communicateearly in the process that EC measures will ulti-mately be incorporated into performance meas-urement/management. This demonstratessenior management commitment and will aligninternal stakeholder interests with the EC effort.In addition, credibility with external stakehold-ers such as rating agencies will, in part, dependon whether this is being done. A lack of internalstakeholder buy-in to the EC effort is an indica-tion that the company will not have a strongERM program.
Although EC measures will not be incorporatedinto incentive compensation for some time, theEC approach should consider its implications.One important consideration is that EC is high-ly sensitive to assumptions. To maintain a cred-ible EC measure, a disciplined process shouldbe established for the setting and changing of as-sumptions. This may include a combination ofproviding incentives (disincentives) for accura-cy (inaccuracy) and establishing corporateguidance and review protocols for any materialchanges.
External Risk ReportingSimilar to the performance measurement/man-agement step, EC measures should not be usedin external reporting until the EC model is cred-ible. However, internally communicating the in-
tent to eventually incorporate EC into externalreporting conveys management commitment tothe EC approach and can be an additional tacticfor securing internal stakeholder support.
In successful EC programs, EC measures arelikely, at some point, to be included in externalreporting—whether implicitly as a part of busi-ness segment earnings (i.e., interest on allocat-ed EC) or in a segment-level Return-on-EC(ROEC) measure or in some other manner. As aresult, it is useful to think through how and whenthe EC measures should be so employed, and thelikely implications of doing so, during the ECdevelopment process. This can assist in discus-sions with stakeholders and in various choicesmade in the EC development process. If this isnot done, there is a chance that risk disclosureswill not be in synch with EC, which may be inter-preted by external stakeholders as a signal thatthe ERM program is not being implemented aswell as it could be.
As insurance companies begin implementingERM, there are many steps in the process thatmust be considered. The risk assessment step,often represented by EC, is a critical step inthis process, and when done correctly can bethe catalyst for a powerful ERM program.However, companies believing that EC can op-erate in a vacuum will likely find their ERMprogram soon running out of air. In contrast,companies realizing and proactively address-ing the inter-dependencies between the riskassessment step and other ERM process stepswill more quickly reap the benefits of a suc-cessful ERM program. F
ERM ≠ EC2 Thirteen Ways to Kill a CompanyRisk Management w March 2006
ERM ≠ EC2
w continued from page 19
“Companies believingthat EC can operate in a vacuum will likelyfind their ERM programsoon running out of air.
”
w Page 20
A 2003 study of the 30 largest corporatefailures, frauds and accounting fias-coes yielded 13 attributes shared by
various groups of companies that had landed introuble:
70% Unusually high dependence on debt, or marginal ability to meet debt repay-ment requirements; acquisitions saddled the company with huge debts; or overpaid for acquisitions.
53% Unusually rapid growth and/or under-priced product for rapid growth, and/ or knowingly accepted more high-risk business than other firms.
47% Failed to stress-test assets and liabili-ties under a variety of assumptions about future economic and market conditions, to apply sophisticated valuation methods to embedded derivatives, to carefully study cash flow implications of proposed transaction(s), or to act on results of such analysis.
47% Lack of integrity in the company’s internal processes, systems and controls.
43% Management failed to set appropriate standards of ethics, integrity, accounting, or corporate governance;inadequate oversight by the Board of Directors.
23% Top executives, and sometimes directors, used shareholders’ funds as personal piggybank, often without informing all appropriate board members; insider trading.
17% Management’s reluctance to admit problems led to higher-risk investment strategies or financial engineering.
17% Strategy was not focused, clear or consistent; or misunderstood market.
17% Company’s nature was fragile, based on nontransparent leverage.
10% Significant financing arrangements were tied to the company’s credit rating and, in some cases, stock price. Without the credit rating or stock price strength, all the structuresimploded.
10% Not able to adapt and grow as deftly as competitors; not able to match competitors’ price prowess; inferior product.
10% Rogue trader concealed mounting losses, or principal misrepresented product.
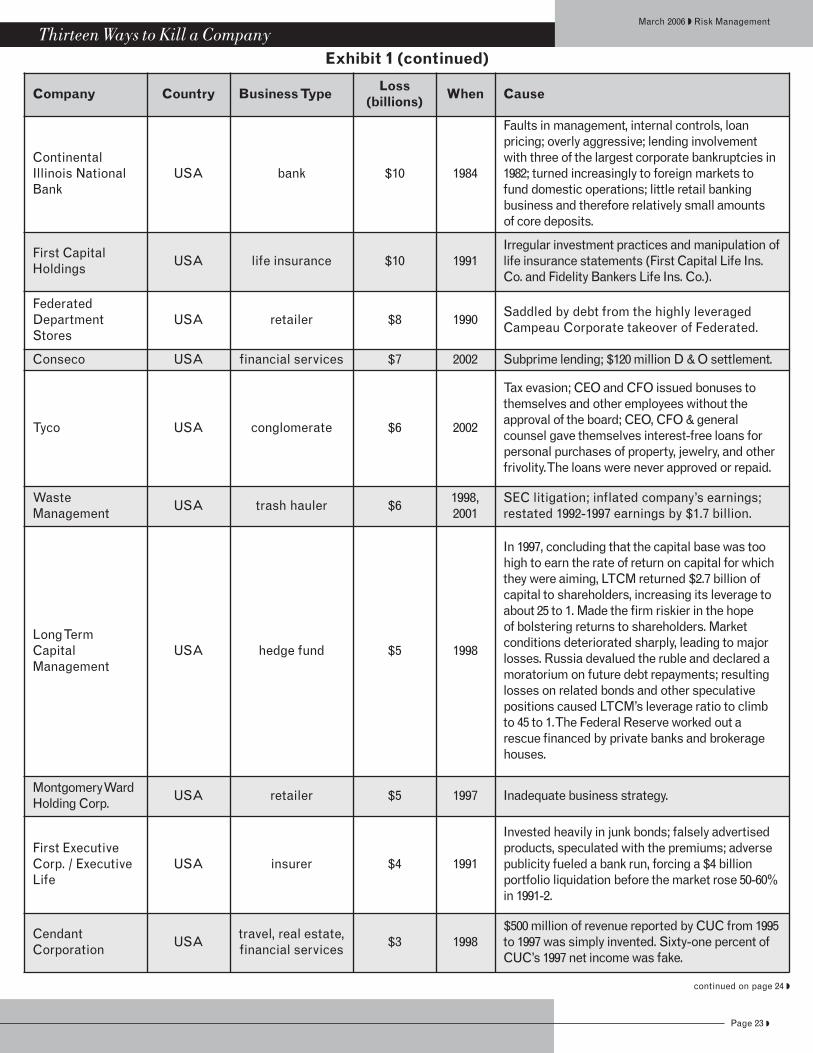
Exhibit 1 on pages 22-24 lists the companies in-cluded in the study and provides a brief summa-ry of the reasons for their inclusion.
Exhibit 2 on pages 25-26 provides an exampleof each of the 13 attributes as manifested in onecompany, respectively, from the study.
In 2003, I took on a new role at Jefferson PilotFinancial (JP) as vice president, internal auditplanning & development. My primary goal wasto develop and implement risk-based auditplanning. It was a great opportunity to apply theknowledge I had gained from studying aboutEnterprise Risk Management (ERM), by partic-ipating on the Society of Actuaries’ RiskManagement Task Force, as well as my under-standing of JP gained through my work in itscorporate actuarial department.
At the time, JP did not have a comprehensiveERM framework that could be used as the basisfor such audit planning. In 2004 I created a JP-specific framework for risk-based audit-planning, but in 2003 I was asked to provide anaudit prioritization in a shorter time than Iwould be able to complete one based on a studyof JP’s own risks.
The methodology I chose for the initial prioriti-zation was to study the largest corporate failuresthat had occurred, determine the attributes theyshared, and then identify the areas or activitieswithin JP that could at least theoretically be ex-posed to analogous risks.
Thirteen Ways to Kill a Company
Thirteen Ways to Kill a Companyby Jennifer Bowen
continued on page 24 w
March 2006 w Risk Management
Page 21 w
Jennifer Bowen, ASA,
MAAA, is second vice
president, account
manager and valuation
actuary, Swiss Re Life &
Health America in Armonk,
N.Y. She can be reached at
Jennifer_Bowen@swissre.
com.
Thirteen Ways to Kill a Company Thirteen Ways to Kill a CompanyRisk Management w March 2006
Exhibit 1
Company Country Business TypeLoss
(billions)When Cause
WorldCom USAtele-
communications$104 2002
Inappropriately accounted for $3.8 billion inexpenses; inflated profits.
Enron USA energy $68 2001
D & O’s created complex outside partnershipsthat kept billions of dollars in losses off Enron’s balance sheet. Recorded equity without receivingthe cash. Underestimated costs; booked all pro-jected profits on future sales. Arthur Andersonacted as Enron’s outside auditor and also performed internal auditing services.
AdelphiaCommunications
USA cable $60 2002$4.6 billion of undisclosed loans to foundingRigas family. Unconventional transactions,questionable accounting.
From a population of 270 actual cases of actualfailures and near-misses, 21 case studies were formulated. Each case study is an amalgam ofmore than one case, to preserve anonymity.Conference of Supervisory Services of the EUcountries performed the study to identify risks thatcan lead to failure. Management problems appearto be the root cause of every failure or near-failure.
Penn Central USA railroad $30 1970
Diversification; problems from merger ofPennsylvania Railroad and New York CentralRailroad in 1968; incompatible computer systemsand signaling systems.
MirantCorporation
USA energy $19 2003Liquidity strain; low power prices; slow economy.
Baldwin-United USApiano
maker/insurer$17 1983
Acquisitions financed by debt, but the company portrayed them as cash deals.
Kmart USA discount retailer $15 2002Cut back on promotions during economicdownturn; tried to compete with Wal-Mart &Target on similar brand names.
FINOVA Group USA financial services $14 2001Cash flow timing mismatch; imprudent lendingpractices; crisis of confidence on the part ofits investors and lenders.
NTL, Inc. USA cable operator $13 2002 Debts spiraled due to tech-boom spending spree.
Reliance GroupHoldings, Inc.
USA insurer $13 2001
During an ill-fated aggressive expansion in the1990s, the company wrote billions of dollars inhigh-risk policies at bargain prices, then founditself responsible for massive unexpected losses;divested itself of key business while retaining run-off exposure.
NRG USA energy $11 2003 Power industry’s post-Enron credit crunch.
w Page 22
Thirteen Ways to Kill a CompanyMarch 2006 w Risk Management
Exhibit 1 (continued)
Page 23 w
Company Country Business TypeLoss
(billions)When Cause
ContinentalIllinois NationalBank
USA bank $10 1984
Faults in management, internal controls, loan pricing; overly aggressive; lending involvementwith three of the largest corporate bankruptcies in1982; turned increasingly to foreign markets tofund domestic operations; little retail banking business and therefore relatively small amounts of core deposits.
First CapitalHoldings
USA life insurance $10 1991Irregular investment practices and manipulation oflife insurance statements (First Capital Life Ins.Co. and Fidelity Bankers Life Ins. Co.).
FederatedDepartmentStores
USA retailer $8 1990Saddled by debt from the highly leveragedCampeau Corporate takeover of Federated.
Conseco USA financial services $7 2002 Subprime lending; $120 million D & O settlement.
Tyco USA conglomerate $6 2002
Tax evasion; CEO and CFO issued bonuses tothemselves and other employees without theapproval of the board; CEO, CFO & general counsel gave themselves interest-free loans forpersonal purchases of property, jewelry, and otherfrivolity. The loans were never approved or repaid.
WasteManagement
USA trash hauler $61998,2001
SEC litigation; inflated company’s earnings;restated 1992-1997 earnings by $1.7 billion.
Long Term CapitalManagement
USA hedge fund $5 1998
In 1997, concluding that the capital base was toohigh to earn the rate of return on capital for whichthey were aiming, LTCM returned $2.7 billion ofcapital to shareholders, increasing its leverage toabout 25 to 1. Made the firm riskier in the hope of bolstering returns to shareholders. Market conditions deteriorated sharply, leading to majorlosses. Russia devalued the ruble and declared amoratorium on future debt repayments; resultinglosses on related bonds and other speculativepositions caused LTCM’s leverage ratio to climbto 45 to 1. The Federal Reserve worked out a rescue financed by private banks and brokeragehouses.
Montgomery WardHolding Corp.
USA retailer $5 1997 Inadequate business strategy.
First ExecutiveCorp. / ExecutiveLife
USA insurer $4 1991
Invested heavily in junk bonds; falsely advertisedproducts, speculated with the premiums; adversepublicity fueled a bank run, forcing a $4 billionportfolio liquidation before the market rose 50-60%in 1991-2.
CendantCorporation
USAtravel, real estate,financial services
$3 1998$500 million of revenue reported by CUC from 1995to 1997 was simply invented. Sixty-one percent ofCUC’s 1997 net income was fake.
continued on page 24 w
My search was almost entirely Google-based,although I did have some helpful documents asa result of my participation on the RiskManagement Task Force.
The first stage was to determine which companieswere worthy of inclusion in this elite group. I wasnot sure at first how many companies I would in-clude or what the minimum loss should be.
I decided that I was looking for failures, fraudsand accounting fiascoes. Something very badhad to have happened, although the companymight technically have survived it. I was alsoflexible with respect to quantifying the loss involved, because I was gathering information
from many sources and the data were very het-erogeneous.
I decided to use whatever I could find in the wayof pre-event assets (if the result was a bankrupt-cy, for example), dollars of income-statementloss, drop in market capitalization, etc. BecauseI was trying to identify a group of companies forwhom the financial repercussions were general-ly accepted to be very great, I considered this anacceptable methodology.
I ended up with 30 companies and a loss-amount threshold of about $1 billion.
Exhibit 1 (continued)
Thirteen Ways to Kill a Company Thirteen Ways to Kill a CompanyRisk Management w March 2006
Company Country Business TypeLoss
(billions)When Cause
HIH Australia insurer $3 2001
Egregious under-reserving; inability to price riskproperly; inadequate consideration of timing ofcash flows. Rather than responding to the underly-ing causes of poor performance, HIH managementused and relied on questionable transactions giv-ing rise to doubtful accounting entries. Poorly con-ceived & executed business decisions. Risks werenot properly identified and managed. Board hardlyanalyzed company’s future strategy. Inadequatepolicies and guidelines in essential areas.
HealthSouthCorporation
USAhealth care
services$2 2003
Overstating earnings to make it appear thatthe company was meeting Wall Street expectations.
Spiegel USA retailer $2 2003
Credit cards for higher-risk candidates; merchandising missteps; failure to publiclyreport improbability of continuing as a growingconcern.
Allfirst Bank USA bank $1 2002
Complex and very determined, hidden tradinglosses; internal and external collusion; controls did not work; foreign exchange trading operations.
Barings Bank UK bank $1 1996
Rogue trader Nicholas Leeson hid massivelosses; internal structure of Barings FuturesSingapore was seriously flawed by the factthat Leeson had control of both front and backoffices.
Drexel, BurnhamLambert
USA investment bank $1 1998180 different lawsuits; wide variety of wrongdoing.
GeneralAmerican
USA insurer $1 1999 Liquidity strain from 7-day puts on its GICs.
w Page 24
Thirteen Ways to Kill a CompanyMarch 2006 w Risk Management
Exhibit 2
Page 25 w
Attribute Company Example
Unusually high dependence on debt or marginalability to meet debt repayment requirements;acquisitions saddled the company with huge debts;or overpaid for acquisitions.
WorldComAmassed about $32 billion in both bond and bank-loan debt during a two-decade spree of more than 70 acquisitions.
Used partnerships to create the illusion that assets had beensold, funneling cash into Enron at critical times, when the company was struggling to meet Wall Street’s expectations.Used “parking” transactions – where true ownership of anasset is hidden through secret guarantees against loss.
Unusually rapid growth and/or underpriced productfor rapid growth; and/or knowingly accepted morehigh-risk business than other firms.
Conseco
Failed to take advantage of opportunities to raise cash eitherby selling insurance companies or issuing new stock. Tried togrow its way out of its problems. Made loans for mobile homesand other purposes that turned out to be riskier than those italready had. The aggressive lending was accelerated ratherthan being reined in.
Failed to stress-test assets and liabilities under avariety of assumptions about future economic andmarket conditions, to apply sophisticated valuationmethods to embedded derivatives, to carefullystudy cash flow implications of proposed transac-tion(s), or to act on results of such analysis.
LTCM
Failed to account for the fact that a substantial portion ofits balance sheet was exposed to a general change in the“price” of liquidity. If liquidity became more valuable (as itdid following the crisis) its short positions would increasein price relative to its long positions. This was essentiallya massive, unhedged exposure to a single risk factor.According to the complex mathematical models used byLTCM, the positions were low risk. Stress-testing againstthis lower correlation might have led LTCM to assumeless leverage in taking this bet.
Lack of integrity in the company’s internal process-es, systems, and controls.
AllfirstFor five full financial years, Allfirst controls and treasurymanagement apparently failed to spot any irregular orquestionable trading.
Management failed to set appropriate standards ofethics, integrity, accounting, or corporate gover-nance; inadequate oversight by the Board ofDirectors.
DrexelBurnhamLambert
Brokers traded on and exchanged inside informationobtained while assembling financial backing for corporateraiders. Milken was engaged in stock parking and colludedwith Boesky and others to manipulate the stocks oftakeover targets. He actively misled regulators.
Top executives, and sometimes directors, usedshareholders’ funds as personal piggybank, oftenwithout informing all appropriate Board members;insider trading.
Adelphia $4.6 billion of undisclosed loans to Rigas family.
continued on page 26 w
I excluded companies for more reasons than justsize.
Other reasons for exclusion:a) ongoing investigation—causes not yet
clear;b insufficient information;c) Asian companies, whose situations were
often not clear enough to me;d) too complicated;e) victim of litigation;f) problems were too industry-specific.
I excluded savings & loan companies becausethere were so many of them and their problemswere generally similar and specific to the in-dustry, and not relevant to my company, whichwas in the life insurance business as well ascommunications (radio & TV stations and
sports programming). I also excluded bankslending to the energy industry, for much thesame reasons.
I recorded attributes for each company, basedon the assessments that I found in published ar-ticles. I only used conclusions that authors of thearticles had drawn; none of the company-specif-ic analyses were my own.
Here are some of my own observations, afterstudying the stories of so many companies:
Industry Specific RisksThere are different types of industry-specificrisks. Some of these have to do with regulation,some with environmental issues and some witheconomic aspects of the industry. Looking backat some of the big scandals, though, I see that
Thirteen Ways to Kill a Company Thirteen Ways to Kill a CompanyRisk Management w March 2006
Exhibit 2 (continued)
Attribute Company Example
Management’s reluctance to admit problems led tohigher-risk investment strategies or financial engi-neering.
HIH
Expansion into lines of business beyond the expertise ofthe underwriters. Strategic decisions based on limitedinformation. Rather than responding to the underlyingcauses of poor performance, HIH relied on questionableaccounting transactions which disguised the seriousnessof the situation.
Strategy was not focused, clear, or consistent; ormisunderstood market.
Kmart
Kmart’s failure was a failure of marketing. Completely misunderstood market, guessed in the absolutely wrong direction, and was completely out of touch. Strategy was allover the place.
Company’s nature was fragile, based on non-transparent leverage.
BaldwinUnited
Acquisitions financed by debt, but the company portrayedthem as cash deals.
Significant financing arrangements were tied tothe company’s credit rating and, in some cases,stock price. Without the credit rating or stock pricestrength, all the structures imploded.
GeneralAmerican
Downgrade triggered investors calling in nearly $6.5 billion in GICs.
Not able to adapt and grow as deftly as competitors; not able to match competitors’ priceprowess; inferior product.
PennCentral
Penn and New York Central cultures clashed badly. Therewas confusion among the crews and Penn Central hadproblems with the unions even though it was forced toguarantee employment to all existing workers as a condition for the merger. Some trains were misplaced for days. Piggyback vans used by corporations likeEastman Kodak missed connections. Freight businessbegan to go elsewhere. Major industrial customers abandoned Penn Central.
Rogue trader concealed mounting losses, or principal misrepresented product.
BaringsBank
Rogue trader hid massive losses.
w Page 26
some of the company killers associated with en-tire industries are really industry-concentratedbad habits or socially acceptable deviant behavior. It was not necessary for these indus-tries to have crashed and burned, either finan-cially or reputationally. Some examples of thesebehaviors are fraud and aggressive lending byS&Ls, insider trading and stock manipulationby investment bankers, and conflicts of interestby auditors. Because these phenomena do notnecessarily arise from the institutions them-selves, they must be choices made by individu-als who happen to work in those industries. Myobservation is that it should be a competitive ad-vantage in the long run to not engage in such be-haviors. It is convenient to categorize the S&Lfailures as having common characteristics, butit was not necessary for those behaviors to occur.Perhaps a certain type of person was attractedby an environment that allowed enough freedomfor those behaviors, but it was still a matter ofpersonal choice.
The Path to RuinFor purposes of risk-based auditing it was rele-vant to look at the attributes of these companiesand not just the causes of their failure. For onething, the cause of failure is usually not that sim-ple. But I am more aware now of the path to ruinand the different stages it might go through.Besides twists and turns, it might make a fewcircles or become a sort of spiral.
I saw during this research that there were differ-ent types of fatal errors that started companiesdown that path. But there were also differentpoints at which corrections could have beenmade. There are different degrees of serious-ness of the trouble that a company has gotten it-self into, and different degrees of desperation inits response to that trouble.
The point at which the risk manager or auditor isgoing to make an observation might be in any ofthose stages. This is one reason for a holistic ap-proach to risk management. Because you don’tknow whether the company might be in the badstrategy stage, the aggressive behavior stage,the loss control stage or the desperation stage,you have no idea which stage you might need tolook for when making plans for what to observe.
Human FactorsI still have not seen any new-fangled businessmodel that has convinced me that good manage-ment is anything other than maturity.
The LTCM case was about judgment and matu-rity in two ways: 1) the fund managers returnedcapital to investors and increased leverage,chasing high returns; and 2) they did not doenough stress testing of key assumptions intheir complex mathematical model.
Even General American’s situation, whichsome could say was a complex ALM matter,could be viewed as a case of relying too much onoutside consultants in making decisions withgreat risk potential. Also, with 20/20 hindsightwe can see that reading, and giving thoughtfulconsideration to, a key provision in a contractwas all that was needed to see what a huge riskwas involved. That did not require a complexmathematical model.
In most of these cases, basic human nature wasa key driver, and basic business principlesplayed a key role. I agree that it is very importantto have good tools, and to apply controls at alllevels. But this research showed me that lack ofdiscipline, judgment, integrity, and a sense ofresponsibility by people in powerful positionswas the undoing of many of these companies.
It is sad to see that it has taken a string of corpo-rate disasters to raise awareness of the need formore accountability on the part of corporate ex-ecutives and board members. It is hard to beatthe sobering influence of significant jail sen-tences as the best deterrent for embezzlement orfraud.
To counter the next level of inadequacy, though,below intentional crime, the Risk Management(RM) culture has emerged as the best way toachieve the effectiveness and accountability ofcorporate executives and management. Riskmanagement will not be effective if it is viewedmerely as an exercise in filling out forms, report-ing metrics, and establishing covariance matri-ces. It will not mean a change in corporate lifeuntil it is represented by respected executiveswho have a place at the table and whose voicesare expected to be heard whenever importantdecisions are being made. The Board ofDirectors is assured that the voice representingRM is bringing up important considerations,asking appropriate questions, leveling the play-ing field within the enterprise on a risk-adjustedbasis, providing an aggregate risk profile for theoverall enterprise, and helping to ensure thatthe risks the enterprise takes on are “calculat-ed” risks. F
Thirteen Ways to Kill a CompanyMarch 2006 w Risk Management
Page 27 w
Author’s Note: Much of this article is excerpteddirectly from the investor survey performed by anE&Y team headed by Thomas McGrath, globalmanaging partner, Client Services andAccounts.
A s members of the Risk ManagementSection, there is no doubt in yourminds that Enterprise Risk
Management (ERM) is a hot topic. More thanthat, it is at the top of the minds of senior man-agement, boards of directors, and investors inall industries. Driven by fear of major businessfailures and under increasing compliance-re-lated pressures, companies are focusing ontheir exposures, and risk management has be-come part of the essential fabric of the corporategovernance structure.
Ernst & Young LLP is conducting a series of sur-veys around risk, exploring attitudes towardrisk and its management, comparing viewpointsacross key stakeholder groups including in-vestors, senior executives and audit commit-tees. While these surveys are not specific to theinsurance industry, or to the U.S. market, theyare quite relevant to our environment, especial-ly the most recent survey of 137 major investors.The survey participants are the institutional in-vestors and asset managers who run some of theworld’s largest investment portfolios, who rep-resent significant investors in most of our organ-izations.
The results of the survey may not be that sur-prising to the Risk Management Section, but thesurvey confirms the direction we are taking asan industry with increased focus, changes in ourcorporate culture and integrated approachesaround risk management. For one, the surveyshowed that investors do not want to eliminaterisk (Exhibit 1), but expect risk to be managedeffectively. Therefore, they must understandthe risks they are taking and thus, when makinginvestment decisions, transparency is at the topof their list of priorities (Exhibit 2). Investorswant to know more about how risk managementconcepts are applied in your organization. Thestudy clearly shows that what you communicate
about risk management is absolutely affectingthose decisions (Exhibit 3), with 61 percent say-ing that they have decided not to invest whererisk management was deemed insufficient.
Based on the survey results, it is clear that riskis playing an increasing role and receivinggreater emphasis in investment decisions. Sowhat are investors looking for? The investorssurveyed identified “clear ownership of risk” asa primary success factor. In addition to an inte-grated approach, they are clearly focused on thecorporate risk culture, e.g., an understanding ofrisk throughout the organization, active boardinvolvement, a dedicated risk function, etc.(Exhibit 4). Having a separate risk managementfunction was high on the list of success factors,but the results indicate that most investors feelthat ownership still lies ultimately with the CEOand the Board (Exhibit 5).
It is clear that investors are hungry for more in-formation on risk management in making theirdecisions, and in many cases they are currentlybasing decisions on incomplete information.The good news is that there is a premium avail-able for those companies that can demonstratesuccessful risk management through frequent,effective and transparent investor communica-tions. In summary, our ability to meet investorneeds and maximize shareholder value throughcommunicating our risk profile and demon-strating the effectiveness of risk managementactivities is not just important to operating ourbusinesses, but is also increasingly driving thevalue and valuations institutional investorsplace on our organizations. F
w Page 28
Risk Management Investor Surveyby Mary Ellen Luning
Investor Survey Investor SurveyRisk Management w March 2006
“Ernst & Young LLP isconducting a series ofsurveys around risk,exploring attitudestoward risk and itsmanagement, comparing viewpointsacross key stakeholdergroups includinginvestors, senior executives and auditcommittees.
Investor Survey Investor SurveyRisk Management w March 2006
Exhibit 3: How Investors Use the Information
Future Challenges for Companies … according to investors:• “Deciding what risks to mitigate and what risks to leave exposed.” Fund Director, United Kingdom
• “As an investor I want the companies to truly commit themselves to change what is wrong when
it comes to risk management.” Senior Investor, Brazil
• “To be more integrated and flexible and have the ability to change as the company’s growth and
profile change.” Chief Investment Officer, United States
• “Simply making sure that everything they say is the truth.” Senior Investor, United States
w Page 30
Risk Management Investor Survey
w continued from page 29
March 2006 w Risk Management
Investor Survey
Exhibit 4: Success Factors
Exhibit 5: Ownership
Page 31 w
T he Society of Actuaries' RiskManagement Task Force is trying to de-velop better estimates of policyholder
behavior in the tail (PBITT). Our mission is toexamine and ultimately give guidance to actuar-ies on how to set policyholder assumptions inextreme scenarios. We are most interested in theassumptions used by companies or consultantsfor the scenarios in the 90 CTE calculations ifstochastically modeled, or the assumptions forevents that occur above two standard deviationsof expected experience. Our first effort was anSOA questionnaire that confidentially gatheredthe range of assumptions actuaries use in pric-ing, reserving, and risk management of mini-mum guarantees on Variable Annuity (VA)products:• Guaranteed Minimum Death Benefit
(GMDB): guarantees minimum account value at death.
• Guaranteed Minimum Income Benefit (GMIB): guarantees minimum monthly income at annuitization.
• Guaranteed Minimum Withdrawal Benefit (GMWB): guarantees a minimum stream of income, provided it is withdrawn within specified limits over time.
• Guaranteed Minimum Accumulation Benefit (GMAB): guarantees minimum account value at a specified future date.
The survey is available on the SOA risk man-agement Web site http://www.soa.org/ccm/content/areas-of-practice/finance/research/policyholder-behavior-in-the-tail-survey-re-sults/. The questions that were asked in thequestionnaire include:
1. The profile of the companies.2. What equity tail scenarios are assumed?3. How the companies model the lapse and
their utilization functions?4. The lapse rates in the tail.
In this article, we provide an excerpt of our sur-vey results on GMIB and hopefully thereby en-courage readers to review our full summaryreport for greater details.
1. The Profile of the Companies The following table gives the profile of the par-ticipating companies (in millions) that issueGMIB:
2. The Assumed Equity TailScenariosDue to the proliferation of guaranteed minimumdeath benefits and guaranteed living benefit, atail scenario is most likely one with poor equitymarkets. However, depending on the type ofguarantees sold, a tail scenario for company Amay not necessarily be a tail scenario for compa-ny B. For example, a company with substantialratchet guarantees may be most hurt by a rapid-ly rising scenario followed by a crash, but a com-pany with mostly return of premium guaranteeswill not be badly hurt by such a scenario. Thewide variation in style of in-force business mayexplain the wide array in responses to this ques-tion, as demonstrated in Exhibit 1 on page 33.
3. Description of Lapses andUtilization FunctionsIt was responded that 69 percent (11 out of 16)use dynamic utilization for GMIBs:
• Of the 10 that described their function, 40 percent (4 out of 10) explicitly stated that dynamic utilization is a function of in-the-moneyness and attained age.
• The remainder only refers to in-the-moneyness as a factor for determining dynamic utilization.
• One carrier considers the option value of exercising the GMIB versus the option
Policyholder Behavior in the Tail: Variable AnnuityGuaranteed Benefits Survey Resultsby James Reiskytl
NetPremiums
AccountValue
GuaranteedValue
Average 1,373 2,439 3,447
25thPercentile
306 300 521
75thPercentile
1,339 3,252 5,406
Risk Management w March 2006
value of holding onto the variable annuity in addition to considering in-the-moneyness and attained age.
4. Lapse Rates in the TailCarriers were then asked to list their lapse ratesin the tail scenario they described at the begin-ning of the survey under four different benefits(GMDB, GMAB, GMIB, GMWB). The carrierswith the highest and lowest overall lapse rates,along with the average across the carriers, arehighlighted as shown in Exhibit 2 for GMIB.
It is our hope that the results of this survey willenhance the actuary’s ability to set assumptionsfor these products in extreme scenarios. Theymay also provide a basis for further discussion ofwhat may become current practices.
For our future activities, we plan to report the dif-ference in RBC results using these assumptionsfor a modeled block of business at an upcomingSOA Investment Symposium to try to provide apossible measure of these reported results.
We also plan to do this survey again this year.Hopefully the next report will include companyresponses for the new VA RBC ComponentRequirements for December 31, 2005. Our nextsurvey will address lapses assumed onUniversal Life products with secondary guaran-tees in the tails.
We greatly appreciate the time and efforts ofthose who responded. We encourage and wel-come comments, questions and suggestionsfrom all of you. Please send them to either JamesReiskytl at [email protected], chair of thePolicyholder Behavior in the Tail WorkingGroup or Steven Siegel at [email protected]. F
T he Risk Management Section is plan-ning a number of Continuing Education(ContEd) activities for 2006. These will
include, but are not limited to:
I) Spring Meeting SessionsOnce again, we have put together a series of ses-sions for the upcoming spring meetings.
a) Life Spring Meeting (May 23-24, Hollywood, Florida)
Sessions to be offered (with the session coordi-nator noted in parentheses), include:
• ERM and Corporate Governance(David Ingram)In a talk show format, our panelists will beasked a series of questions on corporategovernance issues relating to risk manage-ment and actuarial roles. Attendees will re-ceive a practical understanding of howERM fits into corporate governance, andthe effectiveness of companies’ ERMprogress in this area.
• Economic Capital (EC) – RecentTrends in Implementation (HubertMueller)This session will allow attendees to learnhow other companies are using EC in mak-ing business decisions, views towards ECby rating agencies and recent trends in themarketplace.
• Hedging Variable Annuities (VA) – APractical Discussion (Dan Guilbert)Panelists will discuss the benefits of hedg-ing VA guarantees (including death bene-fits and living benefits), the challengesthey face and how they keep score.Attendees will get insight into the ap-proaches used by companies for hedgingthe risk from VA guarantees and challengesfaced in execution and measuring effec-tiveness.
• Implementing Stochastic Methodol-ogies for Reserves & Capital (HubertMueller)This two-part seminar will take a look at re-cent developments regarding the introduc-tion of principles-based rules fordetermining reserves and capital for lifeand annuity products, and discuss initialexperience with the year-end 2005 filingsfor VAs (C-3 Phase II).
• Measuring and Pricing for Tail Risk(Larry Rubin)Panelists will review various approachesfor measuring and managing tail risk andhow to price for tail risk using capital-mar-ket consistent techniques. Attendees willgain a practical understanding of currentpricing techniques and risk managementapproaches for measuring and managingtail risk.
• Avian Influenza: Is Your CompanyPrepared? (Max Rudolph)This facilitated workshop is designed to bea follow-up to the session on tail risk, focus-ing on avian influenza. Attendees willshare information and techniques for stresstesting their company’s preparedness topandemics through scenario planning.
• Managing Market Conduct Risk(Frank Sabatini)This session will examine the drivingforces behind market conduct events fordistribution systems and insurance prod-ucts and the practices being employed tominimize the exposure to these events.Attendees will gain a practical under-standing of current views on market expo-sures and the approaches used to monitor,measure and manage these exposures.
• Risk Management Section Breakfast(David Ingram)In addition, the Risk Management Sectionwill have a breakfast session open to allmeeting attendees where we will discusscurrent section topics and activities.Attendees will need to register in advance.
b) Health Spring Meeting (June 23-24,Hollywood, Florida)
One risk management session will be offered atthe Health Spring Meeting, co-sponsored withthe Health Section: • Risk Management for Individual
Health Products (Tom Corcoran)This session will examine current riskmanagement issues for individual healthproducts and recent trends in the market-place.
II) Annual Meeting SessionsWe will have a similar slate of sessions for theAnnual Meeting to be held in October 2006 inChicago. Please contact Tony Dardis ([email protected]) if you are
interested in presenting on risk managementtopics.
III) ERM SymposiumThe 4th Annual ERM Symposium will be heldApril 23-25 in Chicago in conjunction with theBowles Symposium; SOA Seminar on CapitalEfficiency will be held Sept. 19-20, 2006GARP WS on ERM was held March 2.The RiskManagement Section is co-sponsoring this sym-posium, and has been very active in helping puttogether an outstanding schedule of sessions.Also, several workshops will be held in advanceof the symposium. For further details, pleasevisit the symposium Web site (www.ermsympo-sium.org).
IV) SeminarsThe Risk Management Section Council has alsobeen active in developing several seminars thatare co-sponsored with, or led by, other SOA sec-tions and other organizations. These include:
• A one-day workshop at the GARPConvention in New York¡
A workshop on ERM held at the GARP Convention in New York (March 1-2, 2006)
• SOA Seminar on Capital Efficiency¡
A seminar will be held in September 2006 (in conjunction with the Valuation Actuary Symposium), focused on the use of (stochastic) embedded value, ERM and ALM for measuring, optimizing and communi-cating capital efficiency. This seminar is being co-sponsored by the Risk Management, Taxation and Financial Reporting Sections.
• SOA Seminar on Management andPresentation Skills for RiskManagement Professionals¡
We are also developing a seminar that will focus on developing management and presentation skills for risk management professionals. The program would encompass the use of an outside consultant to teach tech-niques and another portion applying these techniques to a risk manage-ment case study. This seminar will be co-sponsored with the Management and Personal Development Section.
V) WebcastsWe are planning on offering at least one or twowebcasts on ALM, ERM and/or related topicsthis year.
VI) CAS ERM CourseThe CAS is offering an ERM course authored byStephen D’Arcy. For further details, please visitthe CAS Web site at www.CASACT.org.
VII) On-Line ERM CourseWe are in the process of developing an on-lineERM training course, intend-ed to train new entrants to therisk management field andrefresh skills for those work-ing in the field already. Thiscourse will be made up of ex-isting ERM training materi-als, supplemented by thepresentations and papers tobe discussed at the upcomingERM Symposium.
VIII) Local RiskManagementMeetingsFinally, we are looking to setup regular local meetings ofrisk management sectionmembers, allowing for an exchange of ideas andnetworking among risk management profes-sionals. These meetings will either be set up inselected metropolitan areas (like Boston, NewYork or Chicago), or held in conjunction with themeetings of local actuarial clubs.
Call for Additional VolunteersWe have recently expanded the list of people in-volved in planning ContEd activities of the RiskManagement Section. Current volunteers in-clude:
• Ed Betz• Tony Dardis• Todd Henderson• David Ingram• Hubert Mueller (Lead)• Larry Rubin• Frank Sabatini• Robert Wolf• SOA Liaison: Michel Rochette
With lots of activities planned this year, there isalways room for additional volunteers. If youwould like to help plan and coordinate some ofthese activities, or have other ideas or sugges-tions, please contact Huber Mueller at Hubert.Mueller@ TowersPerrin.com.
We look forward to hearing from you!
Page 35 w
March 2006 w Risk Management
Continuing Education
Articles Needed for RiskManagementYour help and participation is needed and welcomed. All articles will include abyline to give you full credit for your effort. If you would like to submit an article, please contact Ken Seng Tan, editor, at [email protected] or RonHarasym, co-editor, at [email protected].
The next issue of Risk Management will be published:
Publication Date Submission DeadlineJuly 2006 April 28, 2006
Preferred FormatIn order to efficiently handle articles, please use the following format whensubmitting articles:
Please e-mail your articles as attachments in either MS Word (.doc) orSimple Text (.txt) files. We are able to convert most PC-compatible softwarepackages. Headlines are typed upper and lower case. Please use a 10-pointTimes New Roman font for the body text. Carriage returns are put in only atthe end of paragraphs. The right-hand margin is not justified.
If you must submit articles in another manner, please call Joe Adduci,(847) 706-3548, at the Society of Actuaries for help.
Please send an electronic copy of the article to:
Dr. Ken Seng Tan, ASA, Ph.D.University of WaterlooWaterloo, Ontario Canada N2L 3G1phone: (519) 888-4567 ext. 6688fax: (519) 746-1875e-mail: [email protected]
Published by the Society of Actuaries475 N. Martingale Road, Suite 600Schaumburg, IL 60173-2226phone: (847) 706-3500 fax: (847) 706-3599www.soa.org
This newsletter is free to section members. Asubscription is $15.00 for nonmembers.Current-year issues are available from theCommunications Department. Back issues ofsection newsletters have been placed in theSOA library and on the SOA Web site:(www.soa.org). Photocopies of back issues maybe requested for a nominal fee.
Facts and opinions contained hereinare the sole responsibility of the persons expressing them and should not be attributed to the Society of Actuaries, itscommittees, the Risk Management Section or the employers of the authors. We willpromptly correct errors brought to our attention.