1963/64,No. 2/3 THE PERCEPTION OF PITCH by R. J. RITSMA *) and B. LOPES CARDOZO *). Survey; pure tones and complex sounds The perception of pitch, which can be remarkably accurate in persons with some amount of practice, depends on a mechanism which is as yet only partly understood. In this article we shall present a concise survey of the present state of knowledge concerning the perception of pitch and describe a number of experiments on which this knowledge is based. To avoid misunderstanding, we begin by pointing out that the pitch of a sound is a subjective property and must therefore be measured by psychophysical methods 1). Furthermore, pitch is not to be identified offhand with a sound frequency. On the contrary: it is precisely the purpose of research on pitch per- ception to discover the dependence of the perceived pitch on the various parameters with which a given sound can be described. Research into this subject is possible owing to the fact that pitch is a "one- dimensional" quantity: given two tones one can always ascertain whether their pitch is the same and, if not, which is higher. Thus, anyone can check the pitch he assigns to a given tone by comparing it with a reference- tone, and so circumvent the difficulty that pitch, like any perception, cannot be observed directly. From what follows it will be seen that a distinction must he made between sounds that consist of a single sinusoidal vibration (pure tones) and sounds that show a composite spectrum (complex sounds). As regards the first, the frequency can in the conven- tional way be taken as a measure of the pitch. This makes it possible, for example, to write a scale of musical tones as a series of numbers. In the pitch of a complex sound, however, it may be that the frequency of a pure tone that sounds just as high does not correspond to one of the frequencies contained in the spectrum, and cannot' easily he derived from them. Instances are to be found' in the chimes of church bells and in the human voice 2). We shall demonstrate below that the latter phenomenon is not to be explained in terms of the place theory, which was until recently generally accepted, and then indicate the probable direction *) Institute for Perception Research, Eindhoven. 1) See the first article in this number: J. F. Schouten, Philips tech. Rev. 25, 33-36, 1963/64. 2) See A. Cohen, Phonetic Research, Philips tech. Rev. 25, 43-48, 1963/64. 534.321 I m which an explanation should he sought. First, referring to fig. 1, we shall briefly recapitulate this theory 3). Fig. la gives a schematic representation of the human ear. Left, the external ear canal (auditory meatus), separated from the middle ear by the tympanic membrane, and right the inner ear. The latter consists of an oblong cavity (35 mm long) which is filled with a fluid and divided lengthwise into two by the cochlear partition, which is set in vibration by sound waves. This partition consists, among other things, of the basilar membrane in which the hair cells of Corti lie. These cells are at- tached by nerve fibres to the auditory nerv.e and detect the deflection of the relevant point of the basilar membrane. In reality the drawn section of the inner ear, the cochlea, is wound in a spiral resembling a snail-shell (which is what the term cochlea means in Latin) 4). Now the place theory, very briefly, states firstly that every frequency is Fig. La) Schematic representation of the human ear. From left to right the external ear (1), the middle ear (2) and the inner ear (3). The air vibrations pass down the ear canal 4 to the tympanic membrane 5. The movement of the latter is transmitted via the middle ear ossieles 6 - represented as a lever with a long and a short arm - to the oval window 7 which closes the inner ear. This sets up, through the fluid in the inner ear, a pressure wavewhich sets in motion the cochlear partition 8, thereby stimulating the auditory nerve terminals originatingin this region.The amplitude pattern ofthis motion for pure tones at various frequencies is sketched in (b). The peak of such a curve lies closer to the end of the cochlear partition the lower the frequency. The fluidmovement required toset7inmotionismadepossibleby theelasticround window9. In reality the space 3 (the cochlea) is rolled up in a spiral. 3) Theplacetheory i~dealtwithextensively bye.g.H.Fletcher, Speech and hearing in communication, Van Nostrand, New York 1953. 4) For an ánatomical description see: E. G. Wever and M. Lawrence, Physiological acoustics, Princeton Univer- sity Press, Princeton 1954. 37 b a
Transcript
1963/64,No. 2/3
THE PERCEPTION OF PITCH
by R. J. RITSMA *) and B. LOPES CARDOZO *).
Survey; pure tones and complex sounds
The perception of pitch, which can be remarkablyaccurate in persons with some amount of practice,depends on a mechanism which is as yet only partlyunderstood. In this article we shall present a concisesurvey of the present state of knowledge concerningthe perception of pitch and describe a number ofexperiments on which this knowledge is based.To avoid misunderstanding, we begin by pointing
out that the pitch of a sound is a subjective propertyand must therefore be measured by psychophysicalmethods 1). Furthermore, pitch is not to be identifiedoffhand with a sound frequency. On the contrary:it is precisely the purpose of research on pitch per-ception to discover the dependence of the perceivedpitch on the various parameters with which a givensound can be described. Research into this subject ispossible owing to the fact that pitch is a "one-dimensional" quantity: given two tones one canalways ascertain whether their pitch is the same and,if not, which is higher. Thus, anyone can check thepitch he assigns to a given tone by comparing it witha reference- tone, and so circumvent the difficultythat pitch, like any perception, cannot be observeddirectly.From what follows it will be seen that a distinction
must he made between sounds that consist of a singlesinusoidal vibration (pure tones) and sounds thatshow a composite spectrum (complex sounds). Asregards the first, the frequency can in the conven-tional way be taken as a measure of the pitch. Thismakes it possible, for example, to write a scale ofmusical tones as a series of numbers. In the pitch ofa complex sound, however, it may be that thefrequency of a pure tone that sounds just as highdoes not correspond to one of the frequenciescontained in the spectrum, and cannot' easily hederived from them. Instances are to be found' in thechimes of church bells and in the human voice 2).We shall demonstrate below that the latter
phenomenon is not to be explained in terms of theplace theory, which was until recently generallyaccepted, and then indicate the probable direction
*) Institute for Perception Research, Eindhoven.1) See the first article in this number: J. F. Schouten, Philips
tech. Rev. 25, 33-36, 1963/64.2) See A. Cohen, Phonetic Research, Philips tech. Rev. 25,
43-48, 1963/64.
534.321
I
m which an explanation should he sought. First,referring to fig. 1, we shall briefly recapitulate thistheory 3).
Fig. la gives a schematic representation of thehuman ear. Left, the external ear canal (auditorymeatus), separated from the middle ear by thetympanic membrane, and right the inner ear. Thelatter consists of an oblong cavity (35 mm long)which is filled with a fluid and divided lengthwiseinto two by the cochlear partition, which is set invibration by sound waves. This partition consists,among other things, of the basilar membrane inwhich the hair cells of Corti lie. These cells are at-tached by nerve fibres to the auditory nerv.e anddetect the deflection of the relevant point of thebasilar membrane. In reality the drawn section ofthe inner ear, the cochlea, is wound in a spiralresembling a snail-shell (which is what the termcochlea means in Latin) 4). Now the place theory,very briefly, states firstly that every frequency is
Fig. La) Schematic representation of the human ear. Fromleft to right the external ear (1), the middle ear (2) and theinner ear (3). The air vibrations pass down the ear canal 4to the tympanic membrane 5. The movement of the latter istransmitted via the middle ear ossieles 6 - represented as alever with a long and a short arm - to the oval window 7which closes the inner ear. This sets up, through the fluid inthe inner ear, a pressure wavewhich sets in motion the cochlearpartition 8, thereby stimulating the auditory nerve terminalsoriginating in this region. The amplitude pattern of this motionfor pure tones at various frequencies is sketched in (b). Thepeak of such a curve lies closer to the end of the cochlearpartition the lower the frequency. The fluidmovement requiredto set 7inmotion is made possibleby the elastic round window9.In reality the space 3 (the cochlea) is rolled up in a spiral.
3) The place theory i~dealtwith extensively by e.g.H. Fletcher,Speech and hearing in communication, Van Nostrand,New York 1953.
4) For an ánatomical description see: E. G. Wever andM. Lawrence, Physiological acoustics, Princeton Univer-sity Press, Princeton 1954.
37
b
a
38 PHILIPS TECHNICAL REVIEW VOLUME 25
I
associated with a definite location on the cochlearpartition, and secondly that every location is as-sociated with a definite pitch.
For pure tones the process can in fact be sum-marized schematically in the way described: fromthe work of Von Békésy 5) we now know that thetravelling waves which, via the oval window of thecochlea, are set up in the fluid of the inner ear whena sound vibration strikes the tympanic membrane,are "damped" more rapidly the higher is the fre-quency; only waves of fairly low frequency "passthrough" to the end of the inner ear. This is illus-trated in fig. lb, where the amplitude of sound wavesof several frequencies is plotted (schematically)as a function of location in the cochlea. The point ofthe cochlea corresponding to a certain frequency canbe identified with the abscissa of the peak of therelevant curve, i.e. with the place where the excita-tion of the cochlear partition is strongest. The innerear can thus indeed be regarded as a frequencyindicator.
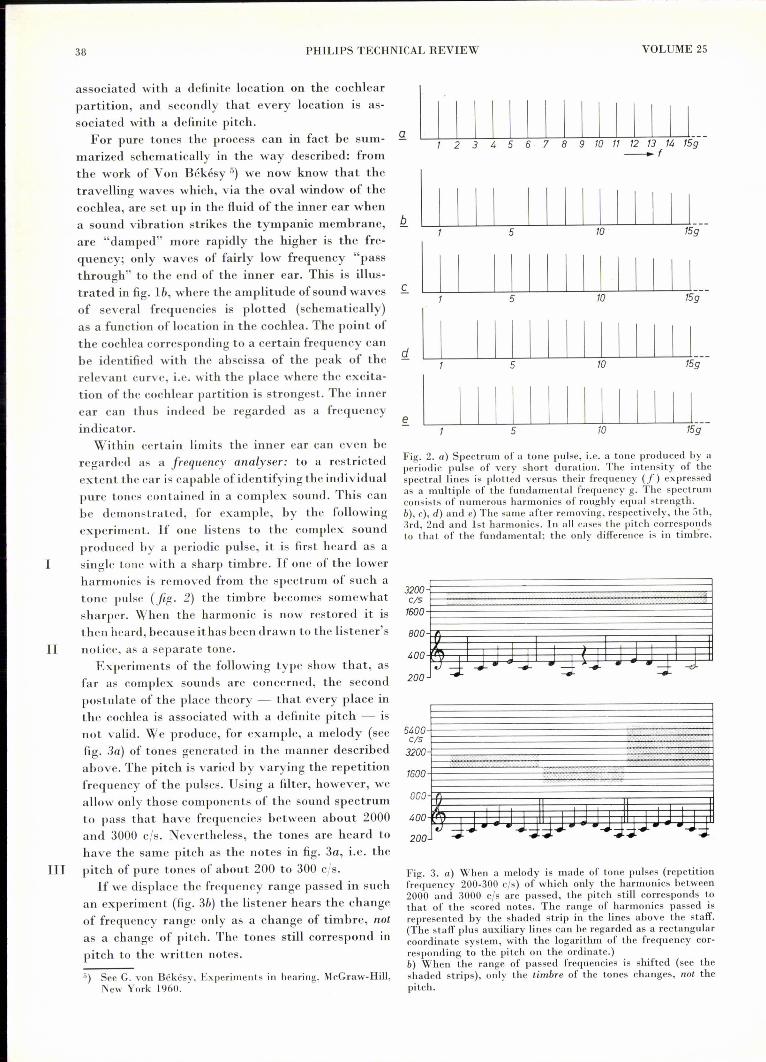
Within certain limits the inner ear can even beregarded as a frequency analyser: to a restrictedextent the ear is capable of identifying the individualpure tones contained in a complex sound. This canbe demonstrated, for example, by the followingexperiment. If one listens to the complex soundproduced by a periodic pulse, it is first heard as asingle tone with a sharp timbre. If one of the lowerharmonics is removed from the spectrum of such atone pulse (fig. 2) the timbre becomes somewhatsharper. When the harmonic is now restored it isthen heard, because ithas been drawn to the listener'snotice, as a separate tone.
Experiments of the following type show that, asfar as complex sounds are concerned, the secondpostulate of the place theory - that every place inthe cochlea is associated with a definite pitch - isnot valid. We produce, for example, a melody (seefig. 3a) of tones generated in the manner describedabove. The pitch is varied by varying the repetitionfrequency of the pulses. Using a filter, however, weallow only those components of the sound spectrumto pass that have frequencies between about 2000and 3000 cis. Nevertheless, the tones are heard tohave the same pitch as the notes in fig. 3a, i.e. thepitch of pure tones of about 200 to 300 cis.If we displace the frequency range passed in such
an experiment (fig. 3b) the listener hears the changeof frequency range only as a change of timbre, notas a change of pitch. The tones still correspond inpitch to the written notes.
11
III
5) See G. von Békésy, Experiments in hearing, McGraw-Hill,New York 1960.
11·1 I I I I I I I I I I I t t __2 3 4 5 6· 7 8 9 10 11 12 13 14 15g__ f
b I1 I I I1
\ I I1
\ I15g
I I I I I I I I I 1 ___
5 la 15g
I I I I I I I I I I I 1 ___
15g5 la
I I I I I I I I I I I I I5 la
I I I I I I I I I I I I I 1 _
5 la 15g
Fig. 2. a) Spectrum of a tone pulse, i.e. a tone produced by aperiodic pulse of very short duration. The intensity of thespectral lines is plotted versus their frequency (f) expressedas a multiple of the fundamental frequency g. The spectrumconsists of numerous harmonics of roughly equal strength.b), c), d) and e) The same after removing, respectively, the 5th,3rd, 2nd and I st harmonics. In all cases the pitch correspondsto that of the fundamental; tbe only difference is in timbre.
320011l1lie/s1600800400200
Fig. 3. a) When a melody is made of tone pulses (repetitionfrequency 200-300 els) of which only tbe harmonics between2000 and 3000 cis are passed, tbe pitch still corresponds tothat of the scored notes. The range of harmonics passed isrepresented by tbe shaded strip in the lines above the staff.(The staff plus auxiliary lines can be regarded as a rectangularcoordinate system, with the logarithm of the frequency cor-responding to the pitch on the ordinate.)b) When the range of passed frequencies is shifted (see theshaded strips), only the timbre of the tones changes, not thepitch.
1963/64, No. 2/3 PERCEPTION OF PITCH
In all cases, then, a pitch is heard which is thesame as that of a pure tone having a frequency farbelow the lower limit of the passed frequency band,and which does not at all correspond to the excitedlocation in the cochlea.
A complex sound which is heard as a single tonewhose pitch does not correspond to one of thefrequencies present has been given the name (tonal)"residue" 6). The name arose because the pitchphenomenon described was first observed on a tonepulse (see above) from which all separately audible(lower) harmonics had been removed; the remaininggroup ofharmonics could therefore properly be calleda "residue". Later it was found that a group of onlythree successive harmonics, e.g. the 8th, 9th and10th, already showed the residue effect. It may bementioned that it is not in fact necessary to eliminateall separately audible harmonics.
Further consideration of the residue effect
For a long time it was doubted that the residueeffect was an independent phenomenon. It was be-lieved that a tone ofthe perceived frequency was reallypresent in the ear; this tone, it was held, was simplya difference tone, produced by non-linear distortionin the ear. If this explanation were correct, theplace theory would lose none of its validity.
For no n-Iinear distortion the relation between the inputsignal V;(t) and the output signal Vu(t) may in general beformulated as:
Vu(t) = C [V;(t) + 0, V;2(t) + ... lwhere C and ö] ... are constants. Given an inpnt signalconsisting of two equally strong sinusoidal components:
V;(t) = A (sin WIt + sin w2t), .... . . (2)we find from (1) for the output signal (putting C = 1):
Vu(t) = V;(t) + v,A2 [1 -1- cos 2w]t - ~ cos 2w2t ++ cos (w] + w2)t + cos (w] - W2)/.] + . .. . .
The non-linear distortion thus "contaminates" the originalsignal among others with a vibration of the frequency (w1 + w2)
and one of the frequency (w] - w2). In acoustics these arereferred to respectively as the sum tone and the difference tone.The existence of these tones was propounded by musicians asfar back as the middle of the 18th century (G. A. Sorge 174.4;G. Tartini 1754).
The difference-tone hypothesis can be opposed onfour quite distinct grounds:1) The residue effect is found even with sounds that
are so weak as to rule out non-linear distortion.2) The tonal residue gives no beat effect with a pure
tone of roughly the same pitch.3) The tonal residue, unlike a pure tone of equal
pitch, cannot be masked by noise whose fre-quency spectrum extends around the frequency fp
6) See J. F. Schouten, The perception of pitch, Philips tech.Rev, 5, 286-294" 1940.
that corresponds to the perceived pitch; it can,however, be masked by noise whose spectrumcontains the components of the residue 7); seejig. 4.
4) An irrefutable argument against the difference-tone hypothesis is that the pitch of the tonalresidue does not always correspond to thedifference frequency. This can be observed, forexample, in an experiment of the followingtype.
Qcis
sin res
20_f
sin
50020_f
Fig. 4. Masking by noise shows that the tonal residue does notarise as a difference tone in the ear. If the noise spectrum ischosen to correspond roughly with the shaded part in (a), apure tone of 200 els (sin) disappears, but not the tonal residue,which is heard to have the same pitch and originates from thecomplex res (frequencies 1800, 2000 and 2200 cis). If the noisespectrum is as shown in (b), it is the residue that disappearsand the pure tone remains audible,
(1) We take a tonal residue of, say, three componentswith frequencies 1800, 2000 and 2200 cis, i.e. the9th, 10th and 11th harmonic of 200 els. The pitchcorresponds to 200 els (fp = 200 cis). Next, weraise all frequencies by the same amount, e.g. 10 cis,and repeat this a few trnes up to e.g. about 1850,2050 and 2250 cis. Although the frequency differenceofthe components remains constant in this operation(200 cis), the pitch of the residue is heard to rise.When the frequencies have reached the values lastmentioned, fp has risen to nearly 205 cis (jig. 5).If the frequencies are lowered in the same way, thepitch of the residue decreases.
The pitch of a complex sound of three components
The simplest complex sound on which the residueeffect can be observed consists of three pure tones,each differing from the other by the same frequencyinterval. Apart from the loudness and the mutualintensity ratio, which are disregarded here, a com-plex sound of this kind can be defined with only twoparameters - the frequency f of the centre corn-
7) This was first demonstrated by J. C. R. Licklider, J. Acoust.Soc. Amer. 26, 945, 1954.
39
IV
V
40 PHILlPS TECHNICAL REVIEW VOLUME 25
, Ij 1111100 200 500 1000 2000 els
_f
II , ,1000 2000 els_fp
Fig. 5. When the components of a complex sound (a) areequidistantly shifted, the pitch of the residue (which is thefrequency fp of a pure tone of equal pitch, shown in b), doesnot remain constant but changes proportionally with thefrequency f of the middle component.
100 200 500
ponent and the frequency difference g. Experimentsof the type just described have shown that when f isvaried while g is kept constant (equidistant shift)the pitch fp varies proportionally with f8). This isnot to say, however, that the pitch rises continuouslyasfis increased. Taking a complex sound consisting,as in the above experiment, for example, of the 9th,10th and 11th harmonics (f = 109), then whenf R:i 10.5g the pitch abruptly falls 9). Asfis furtherincreased, fp again rises and, at f = lIg, once morereaches the value g. Initially fp =f/lO; after thejump fill, and so on. The variation of fp with fthus has a sawtooth waveform; the pitch correspondsto the frequency difference (fp = g) only when f isan Integral multiple of g (fig. 6).
The proportionality between fp and f can beexplained in the following manner from the fine
lIg 12g8g 9g lag
fp
Î 100
~600 2400cls2000 2200-f
Fig. 6. When the three components of a complex sound (middlefrequency f,frequency difference g) are equidistantly shifted,Ji, does not rise continuously withf Whenfhas covered roughlyhalf the distance to the next multiple of g,fp makes a jump sothat, when that multiple is reached, fp is again equal to g.
1800
8) J. F. Schouten, R. J. Ritsma and B. Lopes Cardozo, Pitchof the residue, J. Acoust. Soc.Amer. 34, 1418-1424"1962.
0) See also E. de Boer, On the "residue" in hearing, thesis,Amsterdam 1956.
structure of the acoustic signal. In our experimentsthis had the form showninfig. 7. We have a vibrationof frequency f(the solid line) the amplitude ofwhichis modulated to a depth of 100% with the frequency g(dotted line); this was, incidentally, the way in whichthe signal was produced. Now the perceived. pitchapparently corresponds to the periodicity of theamplitude modulation, in such a way that the earderives this periodicity from the distance betweenthe peaks which lie closest to the maxima of thedotted line 9). This distance is of course proportionalto the distance l/J. Expressed as a formula:l/fp = n/f. If f rises so far that the distance ligbetween the said maxima is better approximated bychanging to a neighbouring peak, i.e, by choosingfor n a number that is larger by one, then the pitchmakes a "jump". The same reasoning also explainswhy fe = g when f is an integral multiple of g.
l/f
11._1;.llr
l/g
·~IIffp
. ,..,tt
Fig. 7. Explanation of the effect that, when a complex of threecomponents is equidistantly shifted, the pitch of the residue fpchanges proportionally with the middle frequency[. The soundsignal is represented by the solid line (sinusoidal vibration offrequency f,modulated 100% by the frequency g). Althoughthe ear derives the pitch from the periodicity of the signal, itdoes so only in the sense that it regards as such the distancebetween the peaks which, within each period l/g, are closestto maxima of the dotted envelope (see arrows). This distanceis of course a multiple of the distance l/f. If f is not also amultiple ofg (anharmonic complex soundjj], will differ from g.
The foregoing leads to the conclusion that theorgan which determines the pitch of complex soundsis not situated in the mechanical part ofthe ear, butis of a neural nature and must be in the auditorynerve tract or in the brain. Apparently it is not somuch a spectrograph as a kind of "time measuringdevice" which analyses the fine structure, of thesignal P).
To conclude this section it should be pointed outthat the residue effect does not occur with anyarbitrary combination of frequencies 11). Fig. 8shows the existence region of the tonal residuefor a complex sound of three components, the
10) R. J. Ritsma, A model of human pitch-extraction based onadditive correlation, Proc. 4th int. Congr. Acoust. I,paper HSl, Copenhagen 1962.
11) R. J. Ritsma, Existence region of the tonal residue I,J. Acoust. Soc. Amer. 34, 1224-1229, 1962.
frequency f being plotted versus the quotient nofiand g. The sloping lines are lines of constant g.We shall first consider only the solid contourM = 100%. For the combinations offand n valueswhich fall within the area bounded by this contoura tonal residue is perceptible, but for those outsideit is not. Although the form of the contour differsin details from one person to another, it is true ingeneral that the highest f value is found at an n
40 50 60
n=f/g
r
appear when the two outer components of a complexsound of three components are progressively reducedin strength.
The variation offp withfin the equidistant displacement ofa complex sound of three sinusoidal (pure) vibrations need notalways take the form sketched in fig. 6. A subject who con-centrates on the change in the pitch of the residue can "post-pone" the jump in fp B). Some plots of this phenomenon are
TOO T50
300
400
600
700BOa els
Fig. 8. Existence region of the tonal residue of a complex sound consistingof three neigh-bouring harmonics (middle frequency f, fundamental frequency g): the tonal residue isheard in the region bounded by the solid contour. If the two outer components are attenu-ated (experimentally by modulatingf to a depth M less than 100%) the result is a smallerexistence region.
over ten, and the highest n value at f = 2000 to3000 cIs. The lowest g - and hence roughly thelowestfp -is about 35 els, the highest about 800 ele.If one experiments with a complex sound which
is identical as regards frequencies but in which thecomponents with frequencies (i-g) and U+g) areweaker, the existence region is smaller. The vibrationpattern of such a complex sound is in principle thesame as that in fig. 7, but the modulation depth Mis smaller than 100%. The dotted contours in fig. 8give the boundaries of the existence region for theindicated values of M. The contraction of theexistence region with decreasing M explains why thetonal residue is heard at a certain moment ·to dis-
shown in fig. 9. It can be seen that the frequency regions towhich the various fp-f curves relate overlap each other tosuch an extent that at e.g. f = 1800 cIs, no fewer than fourvalues can be assigned to fp• The pitch assigned by the humanear to a given sound is therefore not in all cases unambiguouslydetermined by the physical parameters of the sound. This isreferred to as the ambivalence of pitch perception.If, on the other hand, one listens without bias to such a
complex sound which is equidistantly shifted from, say,f = 10g to f = llg, and if the perceived pitch is notregularlycompared with that of a reference tone, our experience showsthat one makes the jump unconsciously. The listener thinks hehears a continuously rising tone, and at the end of the experi-ment finds to his surprise that fp is as equal to g as at the.beginning.As can be inferred from fig. 9, the change infp is not exactly
equal to the nth part of that in f. The magnitude of the dis-
---------------------------------------- --_ ..
41
PHILlPS TECHNICAL REVIEW
/ /1/ /
/ ,I /
o~ oj;v- I/ cV~ .1 /
g=200c/s ~ ~ }7 V lP) ) V
V V VI V t>I / / / V V
V 11' / V/ l( ~) j /'
VI Vc 11' ;/ kt /.1 ~/ / "'0
/ l/ L/ / Vu t;r // // / / /
1/ / // ~/ //
1/ /1 1/ /1 /
n=7/
8I
240cls
220
fp
t 200
180
160
1200 1400 1600 1800 2000 2200_f
2400c/s
crepancy appears to depend on the loudness. Research into thecause of this effect is in progress.
The pitch of sounds of short duration
So far we have been dealing with more or lesssustained sounds. We shall now turn our attentionto sounds of short duration.
After the foregoing considerations regarding thetonal residue of a complex sound of three compo-nents, and the proportional variation of its pitch withf when the components are equidistantly shifted, thequestion arises as to how many periods lig the earneeds to perceive the pitch of the residue. Experi-ments at this Institute have shown that the numberof periods for values of fp between 200 and 4,75 cisis always four. At a g value of, say, 200 cis the earis thus apparently able to establish the pitch fairlyaccurately in 20 ms.Whereas the allocation of pitch to a tonal residue
is governed by the number of periods lig, the decisivefactor as regards pure tones is the duration of thesound. A relatively long "burst" or pulse is hearddistinctly as a tone. If the duration is shortened,hardly anything changes at first, but at a certain
VI critical value the sound begins to change in character,gradually going over from a tone into a click.
Experiments on the perception of the pitch ofshort tone bursts can best be done by letting thesubject hear in quick succession two equally longbursts of dissimilar frequencies. To start with, thefrequency difference is very small and is graduallyincreased. The frequency difference is noted at whichthe subject only just hears the pitch of the two
VII "tones" to be no longer identical.
9/
la/
VOLUME 25
Fig. 9.Thechangein the pitchj],of a complex sound of threecomponents when the middlefrequency j is varied can, if thelistener concentrates on it, befollowed for a short time beyondthe frequency at which an un-suspecting listener hears a jumpin jp (cf. fig. 6).This means thatthe pitch of such a complexsound is not unambiguouslyestablished. In the case towhich the graph relates, nofewer than four pitches can beassigned to the complex toneat j = 1800 cis. (According tothe hypothesis on the variationofjp (see fig. 7) the change injpshould be exactly equal to thenth part of the change inf, andthe curves should coincide withthe dotted lines. As can be seen,there is a small systematicdiscrepancy; no explanation ofthis effect has yet been found.)
The results of such experiments carried out in thisInstitute are summarized infig. 10. The sounds usedwere bursts of a sinusoidal vibration of 1000 cis, thebeginning and end of each of which coincided witha zero transition ofthe vibration 12). The quantity LJ!is the critical frequency difference just mentionedand LJt is the duration of the burst.As can be seen, LJf is nearly constant and very
small (~l cis) provided that LJt is longer than50 ms. When LJt is shortened still further, LJf rises,
Fig. 10. The distinctness with which a short sinusoidal burstis heard as a tone depends on the duration LIt of the burst.As LIt is decreased the listener becomes more and more un-certain of the pitch. The graph shows the result of experimentsin which the subject listened to pairs of tone bursts (1000 cis)of length Lit presented in quick succession, each two burstshaving a small frequency difference which was gradually in-creased. Plotted on the ordinate is the (threshold) frequencydifference LIJ, at which the subject first hears a difference inthe pitch of the two tones.
12) B. Lopes Cardozo, Frequency discrimination of the humancar, Proc. 4th int. Congr.Acoust. I, paper H 16, Copenhagen1962.
1963/64, No. 2/3 PERCEPTION OF PITCH 43
PHONETIC RESEARCH
but not very steeply. At LIt = 2 ms, Llf is still nohigher than 50 cis, i.e, only 2t% of f. The humanear is thus apparently able, when presented withsinusoidal vibrations - i.e. vibrations whose peri-odicity is identical with the reciprocal of the fre-quency - to distinguish a frequency difference of afew per cent in a few milliseconds. The plot in fig. 10for LIt < 50 ms can be described to a good approxi-mation by the equation LlfLlt = constant. Theconstant, which differs from one person to another,is of the order of magnitude of 0.1.
Finally, a few remarks on more irregular complexsounds than the three-component groups discussed,and on sounds which change rapidly in characterafter their beginning.The properties of stationary harmonic complex
sounds with more than three components can oftenbe derived from the properties mentioned of thethree-component sounds discussed. Complex soundswhose components are not equidistant have not yetbeen investigated.
As far as sounds are concerned which changerapidly after their beginning, our knowledge alsoshows gaps. In spite of the considerable importanceof the "attack" effect - a piano note deprived ofits opening is scarcely recognizable as such 13) -
13) Compare, for example, the sound examples given with thearticle: H. Badings and J. W. de Bruyn, Electronic music,Philips tech. Rev. 19, 191-201, 1957/58.
this effect has not yet been extensively studied onmusical instruments. On the contrary, intensiveresearch has been carried out on the human voice.This research, however, should be classed among thephonetic fields of study.
Examples of the experiments denoted in thisarticle by Roman numerals (I to VII) in the marginare contained on a gramophone record made by theI.P.O. 14). With the aid of this record the reader canhear for himself the properties of pitch perceptiondiscussed in this article.
14) This gramophone record (on which the sound examplesare accompanied by a commentary) can be obtainedfree of charge by sending in the coupon attached to thesummary sheet enclosed in this number.
SummaryThe well-known relation between the frequency andpitch of pure tones is often not applicable to complex sounds:a group ofthree (or more) neighbouring harmonics(frequenciesf-g, f and f+g) possesses in a wide range off,g combinationsthe same pitch as the fundamental tone (residue effect).Masking experiments with noise, and the fact that the pitchchanges when the three components are equidistantly shifted(i.e. withg constant) showthat the tonal residue does not arisein the mechanical part of the ear but is of neural origin. Thelatter experiments also demonstrate that the pitch does notcorrespond exactly to the periodicity of the signal envelope(frequency g) but is derived from the fine structure of thesignal.Where complex sounds of short duration are concerned,the pitch of the residue is already heard if the sound is fourperiods lig long. As regards pure tones, the duration of thesinusoidal pulse is the decisive factor.
by A. COHEN *).
Phonetics is concerned with the study of speechsounds, traditionally including their production andrecently also their perception. One can say that pho-netics studies communication from man to man bymeans of speech, the language spoken being consid-ered not as an object of study but as a datum 1).Phonetics cannot be regarded purely as a branch oflinguistics, of biology or of physics; all these sciences
*) Institute for Perception Research, Eindhoven.1) Thc science of phonetics is treated in various manuals and
text books. See e.g. L. Kaiser, Manualof phonetics, NorthHolland Publ. Co.,Amsterdam 1957.The science concernedwith the structure of a given language (or dialect) in terms ofconstituents of speech that distinguish one utterance fromanother (called phonemes) is a branch of linguistics calledphonemics. Since the only yardstick applied is the distin-gnishability of the utterances, no distinction is made inthe English phonological system, for example, between thek's of cool and keel. In phonetics these are different sounds.
534.4
make their contribution to it. For if we go link bylink along the whole "communication chain" wefind: 1) the human vocal organ (an object of ana-tomical and physiological study), 2) the system bywhich this organ produces the speech sounds (thestudy of articulation), 3) the uttered sounds treatedas air vibrations (acoustics), 4) the ear and its as-sociated neural elements (anatomy and physiology).That this last link of the chain - perception - isnow comprised in phonetic research is attributableto the deliberate application of the fairly recent con-cepts of communication theory.
In the phonetic research carried out in the I.P.O.since 1959 the question posed as central problem is:Which physical properties of speech sounds are essen-tial to the recognition of the linguistiè content of the