Page 1
Jack R. Smith, Ph.D. Interim State Superintendent of Schools
200 West Baltimore Street• Baltimore, MD 21201 • 410-767-0100 • 410-333-6442 TIY/TDD • msde.maryland.gov
January 5, 2016
The Honorable Larry Hogan State House 100 State Circle Annapolis, MD 21401
The Honorable Thomas V. Mike Miller H-107 State House 100 State Circle Annapolis, MD 21401
The Honorable Michael E. Busch H-101 State House 100 State Circle Annapolis, MD 21401
Re: Judy Centers Evaluation and Early Childhood Education Services (MSAR#l0072)
Dear Governor Hogan, President Miller, and Speaker Busch:
The enclosed report in accordance with Chapter 2 (SB332 - 2014) provides information about the evaluation, based on objective performance criteria established by the Maryland State Department of Education (MSDE), of the effectiveness of the Judy Centers. The report, The Association between Judy Center Services and Kindergarten Readiness, was completed in August 2015 and represents the most recent study on the effectiveness of the Judy Centers. The report reveals:
• Students who received Judy Center services score higher on the State's Kindergarten Readiness Assessment (KRA) that students who did not receive Judy Center services.
• Students with special needs (i.e., special education, English learners, or those from disadvantaged backgrounds) that utilized Judy Center services scored higher on the KRA that students who did not.
Chapter 2 also required MSDE to provide a report on early childhood education services and family support services that are purchased with funds from Preschool Services Grants and Early Childhood Education Enhancement Grants. That information is currently not available since students who were enrolled in such programs were not assessed on the KRA until this fall. The results for those students will be released in late March 2016.
Please contact Dr. Rolf Grafwallner, Assistant State Superintendent, at [email protected] or (41) 767-0335 if you have questions or need additional information.
Sincerely, r-.,,.y-
ith, Ph.D. ate Superintendent of Schools
Attachment
Page 2
The Association between Judy Center
Services and Kindergarten Readiness
Page 3
2
ABOUT MSDE
The Maryland State Department of Education (MSDE) provides leadership, support,
accountability, in addition to innovative products and services to improve public
education, library services, and rehabilitation services statewide.
DIVISION OF EARLY CHILDHOOD DEVELOPMENT
The Division of Early Childhood Development at the MSDE is responsible for early
care and education throughout the state of Maryland. The main mission of the
Division is to improve early education in Maryland so that young children are well
prepared for school. The Division is composed of the Office of Child Care (Child Care
Subsidy, Credentialing, Licensing, and Maryland EXCELS), the Early Learning Branch,
and the Collaboration and Program Improvement Branch.
Page 4
3
The Association between Judy Center Services and Kindergarten Readiness
Table of Contents
Message from the Superintendent............................................5
Introduction .....................................................................6
Method ...........................................................................7
Findings ..........................................................................10
Summary and Discussion ......................................................16
Page 5
4
MARYLAND STATE DEPARTMENT OF EDUCATION
Lillian M. Lowery, Ed.D. State Superintendent of Schools
Guffrie M. Smith, Jr.
President, Maryland State Board of Education
Larry Hogan
Governor
Rolf Grafwallner, Ph.D.
Assistant State Superintendent
Division of Early Childhood Development
Board Members
Dr. S. James Gates, Jr.
James H. DeGraffenreidt, Jr.
Linda Eberhart
Chester E. Finn, Jr.
Larry Giammo
Dr. Michele Jenkins Guyton
Stephanie R. Iszard, M.Ed.
Madhu Sidhu
Andrew R. Smarick
Laura E. Weeldreyer
Quinn M. Wandalowski
©Maryland State Department of Education 2015
All rights reserved. Published August 2015.
Page 6
5
Lillian M. Lowery, Ed.D.
State Superintendent of Schools
200 West Baltimore Street • Baltimore, MD 21201
410-767-0100 410-333-6442 TTY/TDD
Dear Colleagues, Community Leaders, and Families:
I am pleased to issue this report which includes data demonstrating the positive impact
statewide efforts have had in helping young children enter school ready to learn. Through
the Judith P. Hoyer Early Childhood and Education Enhancement Program, education and
support services are available for children (birth through kindergarten) and their families
who reside in Title I school districts across the state. Twenty-seven Judith P. Hoyer Family
Learning Centers, also known as Judy Centers, and three satellite locations, in collaboration
with a diverse group of agencies, governmental organizations and private providers have
been instrumental in better preparing rising kindergartners for school.
A recent study examined whether students entering kindergarten who received Judy Center
services were better prepared for school than students who did not. This Report reveals:
Students who received Judy Center services scored higher on the Kindergarten Readi-
ness Assessment (KRA) than students who did not receive Judy Center services.
Students with special needs (i.e. special education, ELL, FARMS) that utilized Judy
Center services scored higher on the KRA than students who did not.
Judy Center special education students scored higher on the KRA Composite score
than special education students who did not.
The investments from the Maryland State Legislature are palpable; and we are seeing im-
provements in the readiness of young learners entering school. Although we celebrate these
successes, there is room for improvement. This report highlights the positive outcomes for
the children using Judy Centers and also identifies opportunities to further improve readi-
ness.
The lessons from this study will influence how we focus our future efforts and address the
needs of young learners and their families. We look forward to supporting Maryland’s chil-
dren in achieving their highest potential.
Lillian M. Lowery, Ed.D.
State Superintendent of Schools
Page 7
6
The Association between Judy Center Services and Kindergarten
Readiness
Introduction
Judy Centers
Judith P. Hoyer Family Learning Centers, also known as Judy Centers, serve all
children birth through kindergarten who live in designated Title I school zones. There
are twenty-seven Judy Centers and three satellites throughout Maryland serving forty-
four elementary school zones. Through collaboration with partners, each Judy Center
maintains public prekindergarten and kindergarten, an Infants and Toddlers Program,
preschool special education, private childcare providers, and a Family Support Center,
as well as other community programs. Services are required to meet the full-day and
year-round needs of children and families; family support and parenting, and the
integration of early education services. Further, Judy Centers focus on early
identification and intervention and on serving young children with disabilities; various
health services are provided; professional development of staff; adult education and
family literacy. All early education programs, including child care, Head Start, public
prekindergarten, and kindergarten must be nationally or state accredited. The Judy
Center Partnership plays a leadership role in the community.
Kindergarten Readiness Assessment (KRA)
The Kindergarten Readiness Assessment (KRA) is conducted in the beginning of the
kindergarten year and reflects school readiness based on the new curricular standards.
The KRA replaces the previous school readiness assessment, the Maryland Model of
School Readiness (MMSR). Comprised of a range of selected-response, performance-
task, and observational-rubric items, readiness is measured in four domains—Language
and Literacy, Mathematics, Social Foundations, and Physical Well-Being and Motor
Development—as well as a combined, or Composite, score. In the four domains,
students are rated as Demonstrating Readiness or Not Yet Demonstrating Readiness.
For the Composite score, students are rated as Demonstrating Readiness, Approaching
Readiness, or Emerging Readiness.
Purpose of the Study
The purpose of this study is to examine whether entering kindergarteners who had
received Judy Center services were better prepared for school compared to those who
did not. Further, the study examines whether the Judy Center services ameliorate the
school readiness gap for at-risk children.
Page 8
7
Method
The examination between the two groups, representing kindergarten students, is
limited to different early education experiences. One group represents those
kindergarten students that accessed Judy Center services and experienced more
integrated early learning experiences in the preschool years, were enrolled in programs
of high quality, and had families who were more engaged in parenting and their
children’s learning. The second group represents those kindergarten students who did
not have that experience. The study will examine the differences in their school
readiness skills between students who did and did not access Judy Center services. In
addition, this study will compare students in a set of schools with Judy Center access to
all students in Maryland. We hypothesize that students who accessed Judy Center
services prior to kindergarten entry performed better on the school readiness measure
than those who did not access Judy Center services.
Measures
As described briefly above, the measure of school readiness in Maryland is the
Kindergarten Readiness Assessment (KRA.) The KRA assesses student performances in
four areas, or domains—Language and Literacy, Mathematics, Social Foundations, and
Physical Well-Being and Motor Development. Within each of these domains are a set of
strands. Within each strand is a set of standards, defined by an essential skill and
knowledge statement.
Within the Language and Literacy domain, there are four strands—Reading,
Speaking and Listening, Writing, and Language. Examples of standards include
comprehending interactive read-alouds, demonstrating an understanding of phonemes,
knowing letter-sound correspondence, and producing letter-like shapes.
Math consists of four strands—Counting and Cardinality, Operations and
Algebraic Thinking, Measurement and Data, and Geometry. Examples of standards in
Mathematics include knowing number names, understanding addition, sorting objects,
describing measurable attributes, and describing shapes.
Social Foundations consists of three strands—Social-Emotional, Approaches to
Learning/Executive Functioning, and Social Studies. Examples of Social Foundations
standards include recognizing and identifying emotions of self and others,
demonstrating the ability to persist with a task, and demonstrating an understanding of
rules and responsible behavior.
The Physical Well-Being and Motor Development domain includes two
strands—Physical Education and Health. Examples of Physical Well-Being and Motor
Development standards include demonstrating the ability to use large muscles to
perform a variety of physical skills, and demonstrating personal health and hygiene
skills.
Page 9
8
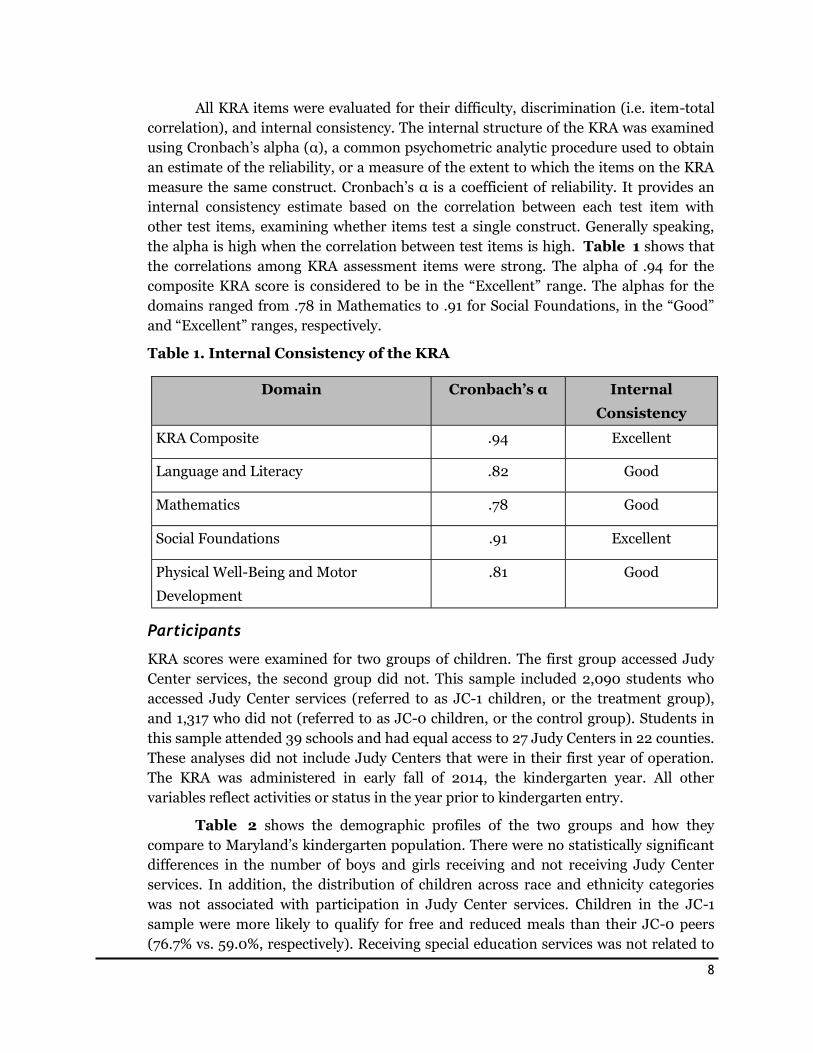
All KRA items were evaluated for their difficulty, discrimination (i.e. item-total
correlation), and internal consistency. The internal structure of the KRA was examined
using Cronbach’s alpha (α), a common psychometric analytic procedure used to obtain
an estimate of the reliability, or a measure of the extent to which the items on the KRA
measure the same construct. Cronbach’s α is a coefficient of reliability. It provides an
internal consistency estimate based on the correlation between each test item with
other test items, examining whether items test a single construct. Generally speaking,
the alpha is high when the correlation between test items is high. Table 1 shows that
the correlations among KRA assessment items were strong. The alpha of .94 for the
composite KRA score is considered to be in the “Excellent” range. The alphas for the
domains ranged from .78 in Mathematics to .91 for Social Foundations, in the “Good”
and “Excellent” ranges, respectively.
Table 1. Internal Consistency of the KRA
Participants
KRA scores were examined for two groups of children. The first group accessed Judy
Center services, the second group did not. This sample included 2,090 students who
accessed Judy Center services (referred to as JC-1 children, or the treatment group),
and 1,317 who did not (referred to as JC-0 children, or the control group). Students in
this sample attended 39 schools and had equal access to 27 Judy Centers in 22 counties.
These analyses did not include Judy Centers that were in their first year of operation.
The KRA was administered in early fall of 2014, the kindergarten year. All other
variables reflect activities or status in the year prior to kindergarten entry.
Table 2 shows the demographic profiles of the two groups and how they
compare to Maryland’s kindergarten population. There were no statistically significant
differences in the number of boys and girls receiving and not receiving Judy Center
services. In addition, the distribution of children across race and ethnicity categories
was not associated with participation in Judy Center services. Children in the JC-1
sample were more likely to qualify for free and reduced meals than their JC-0 peers
(76.7% vs. 59.0%, respectively). Receiving special education services was not related to
Domain Cronbach’s α Internal
Consistency
KRA Composite .94 Excellent
Language and Literacy .82 Good
Mathematics .78 Good
Social Foundations .91 Excellent
Physical Well-Being and Motor
Development
.81 Good
Page 10
9
receiving Judy Center services. Similarly, being an English Language Learner (ELL) was
not related to receiving Judy Center services. JC-0 children received statistically
significantly different types of predominant prior care than their JC-1 peers. For
example, 24.5% of JC-0 children had attended prekindergarten, as opposed to 75.6% of
JC-1 children. Also, more JC-0 children had attended home/informal care (35.5%) than
JC-1 children (6.4%).
Table 2. Demographics
Demographic Characteristic JC-0
% JC-1
%
χ2 p-
value1
All MD Kinder-garten
Students
Gender
Male 53.2 50.1 .082 51.5
Female 46.8 49.9 48.5
Race/Ethnicity
American Indian/Alaska Native1 0.3 0.1 0.3
Native Hawaiian/Other Pacific Islander2
0.7 0.2 0.2
Asian 2.8 2.1 .102 6.0
Black/African American 35.9 33.5 33.1
White 30.0 33.9 36.4
Hispanic/Latino 23.7 22.9 17.3
Two or More Races (Non-Hispanic/Latino)
6.5 7.3 6.7
Free and Reduced Priced Meals
No 41.0 23.3 < .001 51.4
Yes 59.0 76.7 48.6
Special Education
No 89.5 91.5 0.441 91.3
Yes 10.4 8.5 8.7
English Language Learner
No 78.47 81.0 .078 83.5
Yes 21.5 19.0 16.5
Predominant Prior Care
Head Start 8.7 10.4 < .001 5.7
Prekindergarten 24.5 75.6 35.7
Child Care Center 15.6 2.8 13.3
Family Child Care 6.8 2.9 5.5
Home/Informal Care 35.5 6.4 22.2
Non-Public Nursery School 8.0 1.1 15.7
Repeated Kindergarten3 1.1 1.4 1.8 1A p-value of less than .05 indicates a statistically significant finding.
2This race was not included in the χ
2 calculation because there were fewer than 5 participants in these cells.
3This prior care category was not included in the χ
2 calculation because it has not historically been considered a form
of prior care.
Page 11
10
Procedure
The analytic procedures were Chi squares, calculated to determine whether the KRA
scores of children who accessed Judy Center Services differed significantly from the
scores of children who did not access Judy Center services. Analyses were conducted in
SAS 9.3 and Excel.
Findings
Kindergarten Readiness Results
As shown in Table 3, there were statistically significant differences in Language and
Literacy scores by Judy Center experience, with a higher proportion of JC-1 children
scoring in the Demonstrating range than JC-0 children (41.8% vs. 37.8%, respectively).
Further, in the Social Foundations domain, nearly half (49.1%) of JC-1 children scored
in the Demonstrating range, compared to 43.5% of the JC-0 children. JC-1 children
were also more likely to score in the Demonstrating range than JC-0 children in the
Physical Well-Being and Motor Development domain (56.6% and 45.0%, respectively).
Finally, higher proportions of JC-1 children scored in both the Demonstrating and
Approaching ranges in the Composite score compared to JC-0 children. Mathematics
performance was also associated with Judy Center service receipt.
Domain JC-0 (Control)
n (%) JC-1
(Treatment) n (%)
χ2 p-value
Language and Literacy
Demonstrating 461 (37.8) 849 (41.8) < .001
Not Yet Demonstrating 760 (62.2) 1,183 (58.2)
Mathematics
Demonstrating 334 (27.0) 566 (27.6) < .001
Not Yet Demonstrating 901 (73.0) 1,487 (72.4)
Social Foundations
Demonstrating 543 (43.5) 1,008 (49.1) < .001
Not Yet Demonstrating 705 (56.5) 1,044 (50.9)
Physical Well-Being and Motor Development
Demonstrating 562 (45.0) 1,162 (56.6) < .001
Not Yet Demonstrating 687 (55.0) 892 (43.4)
Composite Score
Demonstrating 433 (35.7) 820 (40.8) < .001
Approaching 464 (38.3) 844 (42.0)
Emerging 316 (26.1) 346 (17.2)
Page 12
11
Figure 1 describes the KRA performance of kindergarten students who had
special needs defined as being in either of the three groups: special education
services, services for English Language Learners (ELL), and Free and Reduced Priced
Meals (FARMS), a proxy for income. There was no difference in KRA performance for
students who accessed special education services among those who did and did not
access Judy Center services. ELL students who accessed Judy Center services were
more likely to be rated Demonstrating Readiness than those who did not access Judy
Center services (20% vs. 11%, respectively). Students who qualified for FARMS who
accessed Judy Center services were more likely to be rated Demonstrating Readiness
than those who did not access Judy Center services (38% vs. 26%, respectively).
Figure 1. Percent of MD Kindergarten Students Rated Demonstrating
Readiness, by Special Needs Subgroup
***p < .0001
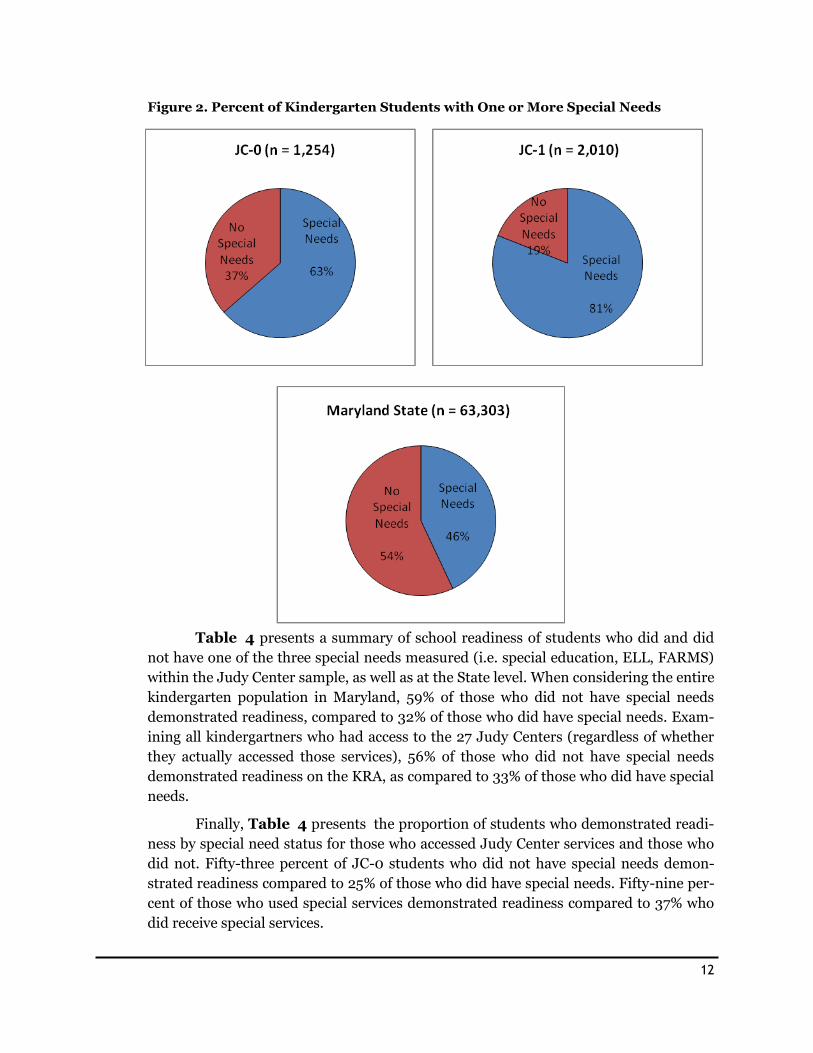
As seen in Figure 2, students in Judy Centers were more likely to have one or
more special needs (special education, ELL, FARMS) than the State at large. Further,
JC-1 students were more likely than JC-0 students to have one or more special needs.
About two-thirds of JC-0 students had one or more special needs, while 81% of JC-1
students had one or more special needs. In comparison, in Maryland, only 46% of
students had one or more special needs.
10% 11%
26%
13%
20%***
38%***
0%
10%
20%
30%
40%
50%
60%
70%
80%
90%
100%
SPED ELL FARMS
JC-0
JC-1
Page 13
12
Figure 2. Percent of Kindergarten Students with One or More Special Needs
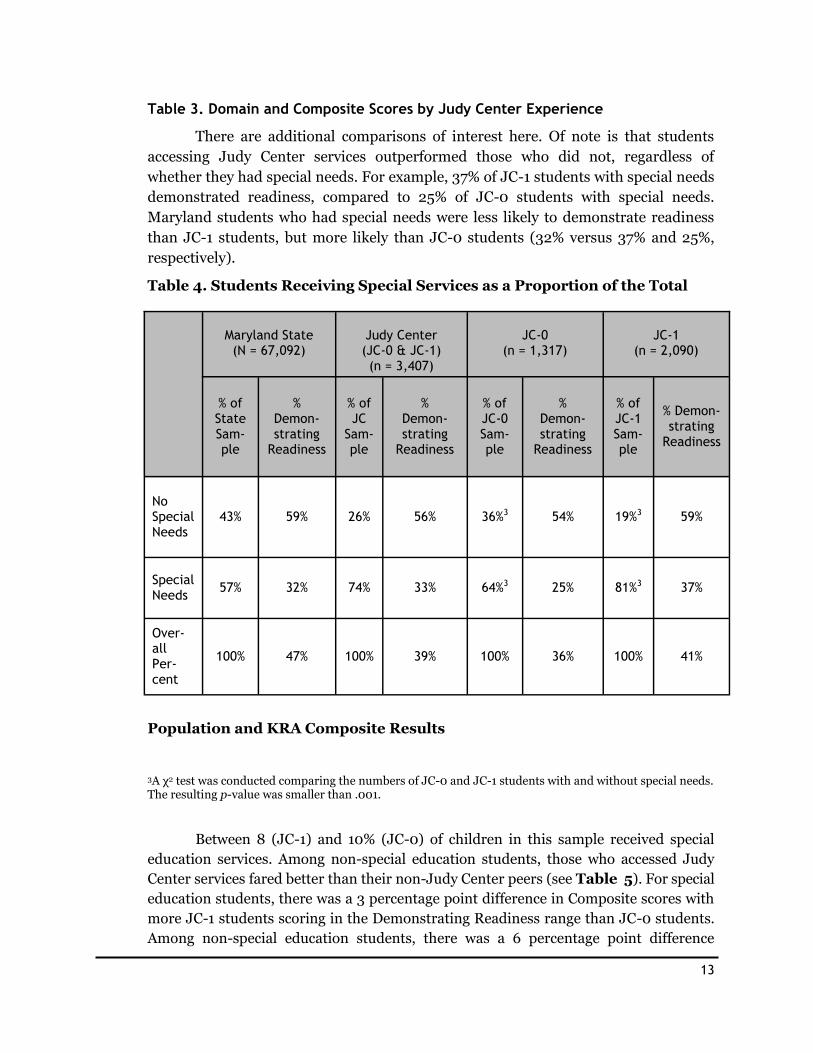
Table 4 presents a summary of school readiness of students who did and did
not have one of the three special needs measured (i.e. special education, ELL, FARMS)
within the Judy Center sample, as well as at the State level. When considering the entire
kindergarten population in Maryland, 59% of those who did not have special needs
demonstrated readiness, compared to 32% of those who did have special needs. Exam-
ining all kindergartners who had access to the 27 Judy Centers (regardless of whether
they actually accessed those services), 56% of those who did not have special needs
demonstrated readiness on the KRA, as compared to 33% of those who did have special
needs.
Finally, Table 4 presents the proportion of students who demonstrated readi-
ness by special need status for those who accessed Judy Center services and those who
did not. Fifty-three percent of JC-0 students who did not have special needs demon-
strated readiness compared to 25% of those who did have special needs. Fifty-nine per-
cent of those who used special services demonstrated readiness compared to 37% who
did receive special services.
Page 14
13
Table 3. Domain and Composite Scores by Judy Center Experience
There are additional comparisons of interest here. Of note is that students
accessing Judy Center services outperformed those who did not, regardless of
whether they had special needs. For example, 37% of JC-1 students with special needs
demonstrated readiness, compared to 25% of JC-0 students with special needs.
Maryland students who had special needs were less likely to demonstrate readiness
than JC-1 students, but more likely than JC-0 students (32% versus 37% and 25%,
respectively).
Table 4. Students Receiving Special Services as a Proportion of the Total
Population and KRA Composite Results
3A χ2 test was conducted comparing the numbers of JC-0 and JC-1 students with and without special needs. The resulting p-value was smaller than .001.
Between 8 (JC-1) and 10% (JC-0) of children in this sample received special
education services. Among non-special education students, those who accessed Judy
Center services fared better than their non-Judy Center peers (see Table 5). For special
education students, there was a 3 percentage point difference in Composite scores with
more JC-1 students scoring in the Demonstrating Readiness range than JC-0 students.
Among non-special education students, there was a 6 percentage point difference
Maryland State
(N = 67,092)
Judy Center (JC-0 & JC-1) (n = 3,407)
JC-0
(n = 1,317)
JC-1
(n = 2,090)
% of State Sam-ple
% Demon-strating
Readiness
% of JC
Sam-ple
% Demon-strating
Readiness
% of JC-0 Sam-ple
% Demon-strating
Readiness
% of JC-1 Sam-ple
% Demon-strating
Readiness
No Special Needs
43% 59% 26% 56% 36%3 54% 19%3 59%
Special Needs
57% 32% 74% 33% 64%3 25% 81%3 37%
Over-all Per-cent
100% 47% 100% 39% 100% 36% 100% 41%
Page 15
14
between JC-0 and JC-1 students’ Composite scores with JC-1 students scoring in the
Demonstrating Readiness range than JC-0 students.
Table 5. Percent of Special Education and Non-Special Education Students
Rated as Demonstrating Readiness, by Prior Judy Center Service Receipt4
Table 6 highlights the performance gap between special education and non-
special education students in the JC-0 and JC-1 samples. Among JC-0 students, there
was a 28 percentage point gap when comparing special education and non-special
education students. Among JC-1 students, there was a 31 percentage point gap when
comparing special education and non-special education students. While the JC-1 group
consistently outperformed the JC-0 group, being a JC-1 student was associated with a
larger increase in score for non-special education students than special education
students.
Table 6. Percent of Special Education and Non-Special Education Students
Rated as Demonstrating Readiness, by Prior Judy Center Service Receipt4
Nineteen percent of JC-0 students were ELLs, and 21% of JC-1 students were
ELLs. Table 7 presents the difference in the proportion of JC-0 and JC-1 ELL and
non-ELL students scoring in the Demonstrating Readiness range. This indicates that
JC-1 ELL students were consistently more likely to score in the Demonstrating
Readiness range than JC-0 ELL students.
Special Education Non-Special Education Gap
JC-0 10 38 28
JC-1 13 44 31
Composite
Special Education Non-Special Education
JC-0 10 38
JC-1 13 44
Difference +3 +6
Page 16
15
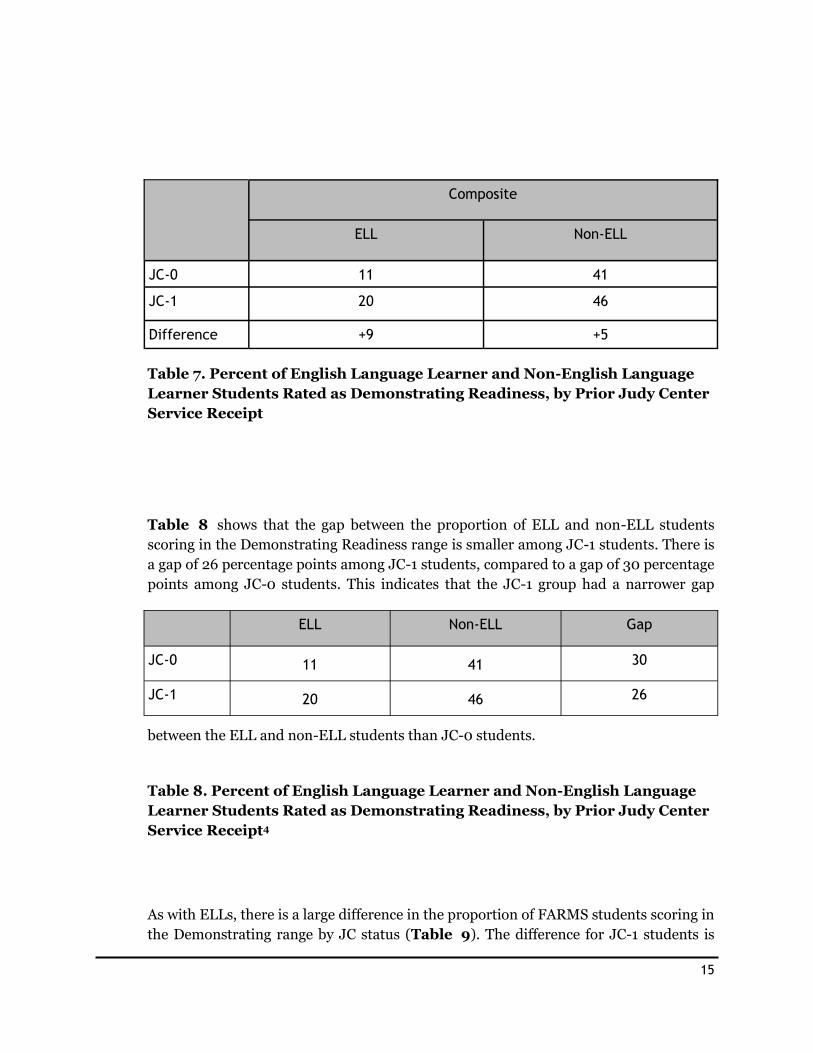
Table 7. Percent of English Language Learner and Non-English Language
Learner Students Rated as Demonstrating Readiness, by Prior Judy Center
Service Receipt
Table 8 shows that the gap between the proportion of ELL and non-ELL students
scoring in the Demonstrating Readiness range is smaller among JC-1 students. There is
a gap of 26 percentage points among JC-1 students, compared to a gap of 30 percentage
points among JC-0 students. This indicates that the JC-1 group had a narrower gap
between the ELL and non-ELL students than JC-0 students.
Table 8. Percent of English Language Learner and Non-English Language
Learner Students Rated as Demonstrating Readiness, by Prior Judy Center
Service Receipt4
As with ELLs, there is a large difference in the proportion of FARMS students scoring in
the Demonstrating range by JC status (Table 9). The difference for JC-1 students is
ELL Non-ELL Gap
JC-0 11 41 30
JC-1 20 46 26
Composite
ELL Non-ELL
JC-0 11 41
JC-1 20 46
Difference +9 +5
Page 17
16
12%. A smaller difference in proportions is evident among the non-FARMS students (1
percentage point). This indicates that, overall, the JC-1 group outperformed the JC-0
group.
Table 9. Percent of Students Qualified for Free and Reduced Meals and
those Not Qualified Rated as Demonstrating Readiness, by Prior Judy
Center Services
Table 10 presents the difference between the proportion of FARMS and non-FARMS
students scoring in the Demonstrating Readiness range by JC status. In both JC
groups, non-FARMS students were more likely to score in the Demonstrating
Readiness range, but that gap was smaller among JC-1 students than it was for JC-0
students.
Table 10. Percent of Special Education and Non-Special Education Students
Rated as Demonstrating Readiness, by Prior Judy Center Service Receipt4
FARMS Non-FARMS Gap
JC-0 26 50 24
JC-1 38 51 13
Composite
FARMS Non-FARMS
JC-0 26 50
JC-1 38 51
Difference +12 +1
Page 18
17
Summary and Discussion
One of the first findings of this study is that there was a higher proportion of FARMS
students in the JC-1 sample than in either the JC-0 sample or Maryland population.
The key take-away message from this is that the JC-1 sample presents a solid target
group for further intervention. Additional efforts could be made to direct resources
toward engaging this subgroup with additional Judy Center services.
A second key finding is that JC-1 students scored higher on the KRA than JC-0
students. Primarily, it appears that Judy Center services have a positive relationship
with students’ KRA performance. As such, encouraging those students who have special
needs to access Judy Center services in the year prior to kindergarten could affect their
KRA performance. Further, expanding Judy Center implementation to areas that are in
need of such services could further improve KRA performance.
This study examined the proportion of kindergarten students who had one or
more special needs (i.e. special education, ELL, FARMS). The full Judy Center sample
had a greater proportion of students with special needs than Maryland overall. This
suggests that the current Judy Centers are well-placed to address the needs of
Maryland’s neediest children and families. In addition, JC-1 students with special needs
out-performed JC-0 students with special needs on the KRA. This points toward the
Judy Centers’ success at addressing the needs of the most disadvantaged students.
With regards to special education, this study found that, first, there is a very low
prevalence of kindergartners receiving special education services (between 8 and 10%).
Also, JC-1 special education students scored higher on the KRA Composite score than
JC-0 special education students, but not on the Mathematics or Language and Literacy
domains. This suggests that students with disabilities may need more than a single year
of Judy Center services to address their needs. ELL students’ scores, on the other hand,
demonstrated that accessing Judy Center services was associated with demonstrating
readiness. This finding indicates that Judy Center services are affecting outcomes
quickly and effectively for ELL students. Finally, there were very notable differences
between JC-0 and JC-1 scores among FARMS students, with JC-1 FARMS students
regularly out-performing the JC-0 FARMS students. This suggests that Judy Center
services are positively associated with students’ performance and readiness.
Page 19
18
Allegany County
Beall Elementary
3 College Avenue
Frostburg 21532
South Penn Elementary
500 East Second St.
Cumberland, MD 21502
Anne Arundel
Hilltop Elementary
415 Melrose Avenue
Glen Burnie 21061
Baltimore City
Moravia Park Elementary/Middle
6201 Frankford Avenue
Baltimore 21206
John Eager Howard Elementary
2011 Linden Avenue
Baltimore 21217
Furman L. Templeton Prep Acad-
emy (satellite)
1200 N. Pennsylvania Ave.
Baltimore 21217
The Historic Samuel Coleridge
Taylor Elementary (satellite)
507 W. Preston Street
Baltimore 21201
Comm. John Rodgers Elementary
100 N. Chester Street
Baltimore 21231
Liberty Elementary
3901 Maine Avenue
Baltimore 21207
Arundel Elementary/Middle
2400 Round Road
Baltimore 21225
Baltimore County
Campfield Early Childhood Ctr.
6834 Alter Street
Baltimore 21207
Calvert County
Patuxent Elementary
35 Appeal Lane
Lusby 20657
Caroline County
Federalsburg Judy Center
323 S. University Avenue
Federalsburg 21632
Federalsburg Elementary
University & Academy Avenues
Federalsburg 21632
Greensboro Elementary
625 Main Street
Greensboro 21639
Carroll County
Robert Moton Elementary
1413 Washington Road
Westminster 21157
Taneytown Elementary
100 Kings Drive
Taneytown 21787
Cranberry Station Elementary
505 North Center Street
Westminster 21157
Elmer A. Wolfe Elementary
119 North Main Street
Union Bridge 21791
Cecil County
Holly Hall Elementary
233 White Hall Rd.
Elkton 21921
Gilpin Manor Elementary
203 Newark Avenue
Elkton 21921
Family Education Center
200 Road B
Hollingsworth Manor
Elkton 21921
Charles County
Dr. Samuel A. Mudd Elementary
820 Stone Avenue
Waldorf 20602
C. Paul Barnhart Elementary
4800 Lancaster Circle
Waldorf 20603
Eva Turner Elementary
1000 Bannister Circle
Waldorf 20602
Dorchester County
The Judy Center
1405 Glasgow Street
Cambridge 21613
Sandy Hill Elementary
1503 Glasgow Street
Cambridge 21613
Frederick County
Waverley Elementary
201Waverley Drive
Frederick 21702
Judy Center Locations
Page 20
19
Hillcrest Elementary
1285 Hillcrest Drive
Frederick 21703
Lincoln Elementary
200 Madison Street
Frederick 21701
Garrett County
Garrett County Judy Center Part-
nership
41 Highview Drive
Oakland 21550
Yough Glades Elementary
70 Wolf Acres Drive
Oakland 21550
Friendsville Elementary
841 First Avenue
Friendsville, MD 21631
Grantsville Elementary
120 Grant Street
Grantsville 21536
Crellin Elementary
115 Kendall Drive
Crellin 21550
Broad Ford Elementary
607 Harvey Winters Road
Oakland 21550
Harford County
Magnolia Elementary
901 Trimble Road
Joppa 21085
Howard County
Cradlerock Elementary
6700 Cradlerock Way
Columbia 21045
Kent County
Henry Highland Garnett Elem.
320 Calvert Street
Chestertown 21620
Montgomery County
Rolling Terrace Elementary
705 Bayfield Street
Takoma Park 20912
Summit Hall Elementary
101 West Deer Park Road
Gaithersburg 20877
Washington Grove Elementary
8712 Oakmont Street
Gaithersburg 20877
Prince George’s County
Judy Hoyer Family Learning Ctr.
8908 Riggs Road
Adelphi 20783
Cool Spring Elementary School
8910 Riggs Road
Adelphi 20783
Carmody Hills Elementary
(satellite)
401 Jadeleaf Avenue
Capitol Heights 20743
Queen Anne’s County
Sudlersville Elementary
300 S. Church Street
Sudlersville 21668
Somerset County
Princess Anne Elementary
11576 Lankford Street
Princess Anne 21853
St. Mary’s County
Green Holly Elementary
46060 Millstone Landing
Lexington Park 20653
George Washington Carver Ele-
mentary
46155 Carver School Blvd.
Great Mills 20634
Talbot County
Easton Elementary
305 Glenwood Avenue
Easton 21601
Washington County
Bester Elementary
385 Mill Street
Hagerstown 21740
Winter Street Elementary
59 Winter Street
Hagerstown 21740
Wicomico County
Wicomico Early Learning Center
1101 Robert Street
Salisbury 21804
Pemberton Elementary
1300 Pemberton Drive
Salisbury 21804
Beaver Run Elementary
31481 Old Ocean City Road
Salisbury 21804
Worcester County
Snow Hill Elementary
515 Coulbourne Lane
Snow Hill 21863
MD State Dept. of Education
Judy Center Partnerships
Specialist
Division of Early Childhood Dev.
200 W. Baltimore Street, 10th
Floor
Baltimore 21207
Page 21
20
The Maryland State Department of Education does not discriminate on the basis of
age, ancestry, color, creed, gender identity and expression, genetic information,
marital status, disability, national origin, race, religion, sex, or sexual orientation in
matters affecting employment or in providing access to programs.
For more information about the contents of this document, contact:
Maryland State Department of Education
Division of Early Childhood Development
200 West Baltimore Street
Baltimore, MD 21201
Phone: 410-767-0335
Toll Free: 1-811-605-1539
410-333-6442 (TTY/TDD)
Fax: 410-333-6226
www.MarylandPublicSchools.org