64
Annual Report 2003 Annual Report 2005 Growing Partnerships Worldwide

AnnualReport2003
AnnualReport2005
Growing Partnerships WorldwideRegistered office: Hesslewood Country Office Park,Hessle, East Yorkshire HU13 0PW, Telephone 01482 626511 Fax: 01482 626512Registered Number: 329377 www.fenner.com
Fe
nn
er P
LC
Annual R
eport 2005
Fenner is a world leader in reinforced polymertechnology.
Our strategy is to increase market share andtarget new value added product areas. We willcontinue to concentrate on growing thosebusinesses where we already demonstrateleadership through our skills in applications,design, materials technology and dedication tocustomer service as well as by carefully plannedacquisitions.
Advanced Sealing TechnologiesAdvanced Sealing Technologies
CHARLOTTETel: (1) 704 334 5353Fax: (1) 704 334 1733www.scandura.net
Tel: (44) 1482 781234Fax: (44) 1482 785438www.fennerdunlop.com/europe
Tel: (31) 512 585 555Fax: (31) 512 585 511www.fennerdunlop.com/europe
Tel: (86) 21 599 369 89Fax: (86) 21 599 367 34www.fennerdunlop.com/shanghai
Tel: (61) 3 9680 4500Fax: (61) 3 9689 9191www.apexfenner.com.au
Tel: (44) 1522 781800Fax: (44) 1522 510029www.james-dawson.com
Tel: (44) 113 249 3486Fax: (44) 113 248 9656www.fennerdrives.com
Tel: (44) 20 8941 2244Fax: (44) 20 8783 1669www.hallite.com
Tel: (49) 40 73 47 480Fax: (49) 40 73 47 48 49www.hallite.de
Tel: (27) 11 974 1902Fax: (27) 11 974 1900www.fenner.co.za
Tel: (27) 11 828 8950Fax: (27) 11 822 2013www. ksbpumps.co.za
ATLANTATel: (1) 404 294 5272Fax: (1) 404 296 5165www.gaduck.com
Tel: (1) 717 665 2421Fax: (1) 717 665 2649www.fennerdrives.com
DETROITTel: 248 362 0170Fax: 248 362 4246www.hallite.com
HOUSTONTel: 281 446 6662Fax: 281 446 7034www.cdipolytek.com
Advanced Sealing Technologies
JamesD wsonaPANTONE 28060% TINT 280
Tel: (86) 21 599 369 89Fax: (86) 21 599 367 34www.james-dawson.com
JamesD wsonaPANTONE 28060% TINT 280
C O N V E Y O R B E L T I N G E U R O P E
C O N V E Y O R B E L T I N G E U R O P E
Tel: (91) 452 2464201Fax: (91) 452 2464204
C O N V E Y O R B E L T I N G A M E R I C A S
C O N V E Y O R B E L T I N G A U S T R A L I A
C O N V E Y O R B E L T I N G
C O N V E Y O R B E L T I N G
Tel: (1) 705 645 4431Fax: (1) 705 645 3112www.scandura.net
C O N V E Y O R B E L T I N G A M E R I C A S

AustraliaCONVEYOR BELTING
n Melbourne, AustraliaOver 20 stockholding branchesPrincipal products: Rubber ply beltsTechnical rubber products Conveyor services
n Sydney, AustraliaPrincipal products: Solid-woven PVC belts Conveyor services
ChinaCONVEYOR BELTING
n Shanghai, ChinaPrincipal products: Solid-woven PVC belts Nitrile covered PVC belts
PRECISION POLYMERS
n Shanghai, ChinaPrincipal products: Silicone hoses
IndiaCONVEYOR BELTING
n Madurai, IndiaPrincipal product: Solid-woven PVC belts
Southern AfricaCONVEYOR BELTING
n Johannesburg, South AfricaPrincipal products: Solid-woven PVC belts Nitrile covered PVC beltsRubber compound
KSB PUMPS
JamesD wsonaPANTONE 28060% TINT 280
n Johannesburg, South AfricaEight branchesPrincipal product: Centrifugal pumps
C O N V E Y O R B E L T I N G A U S T R A L I A
C O N V E Y O R B E L T I N G
C O N V E Y O R B E L T I N G
Key:-Conveyor BeltingManufacturing facilitiesSales/service branches
Precision PolymersManufacturing facilitiesSales/service branches
Advanced SealingTechnologiesManufacturing facilitySales/service branches
PumpsManufacturing facilitySales/service branches
North America
n Atlanta, GeorgiaPrincipal products: Rubber ply beltsLightweight rubber belts
n Bracebridge, OntarioPrincipal products: Steel cord belts Rubber ply belts
n Charlotte, North CarolinaPrincipal product: Lightweight PVC belts
n Port Clinton, OhioPrincipal product: Rubber ply belts
n Toledo, OhioPrincipal products: Rubber ply belts Special profile belts
n Tlalnepantla, MexicoPrincipal product: Rubber ply belts
ADVANCED SEALS
n Detroit, MichiganPrincipal product: Hallite Dynamic Seals
n Houston, TexasPrincipal product: CDI Polytek Seals
EuropePRECISION POLYMERS
n Lincoln, UKPrincipal products: Precision beltsSilicone hosesIndustrial ductingIndustrial rubberproducts
n Poynton, UKPrincipal products: Silicone hoses
n Leeds, UKPrincipal products: Detachable link beltsExtruded belting
North AmericaPRECISION POLYMERS
n Manheim, PennsylvaniaPrincipal products: Precision beltsDetachable link beltsKeyless bushingsUrethane beltingHigh-tech fabrics
n Wilmington,North CarolinaPrincipal products: Composite pulleys, sprockets & couplingsBelt & chain guidesGuide rail systems
Europe
n Hull, UKPrincipal products: Solid-woven PVC beltsNitrile covered PVC belts
n Drachten, NetherlandsSales/service offices in France, Spain & UKPrincipal products: Rubber ply beltsPassenger conveyorbeltingRubber profiles & sheeting
ADVANCED SEALS
n Hampton, UKPrincipal products: Hallite &CDI Polytek Seals
n Hamburg, GermanyPrincipal product: Hallite Seals
C O N V E Y O R B E L T I N G E U R O P E
JamesD wsonaPANTONE 28060% TINT 280
C O N V E Y O R B E L T I N G A M E R I C A S
CONVEYOR BELTING
CONVEYOR BELTING
Advanced Sealing TechnologiesAdvanced Sealing Technologies
Fenner PLC 1
Financial Highlights 2005 2004£000 £000
Turnover 313,012 260,595Operating profit before goodwill amortisation
and exceptional items 21,255 16,101Operating profit 15,849 8,738Profit before tax 12,025 6,395Adjusted earnings per share before goodwill amortisation,
exceptional items and profit on sale of operations 9.34p 7.67pBasic earnings per share 5.28p 2.19pDividends per share 5.825p 5.825p
Contents
1 Financial Highlights
2 Chairman’s Statement
4 Chief Executive Officer’s Review
1 0 Group Finance Director’s Review
1 2 The Board
1 3 Corporate Governance
1 7 Board Remuneration Report
2 3 Directors’ Report
2 5 Independent Auditors’ Report
2 6 Financial Accounts
5 9 Five Year Summary
6 0 Annual General MeetingAdvisorsFinancial Calendar
Chairman’s Statement2 Fenner PLC
Following a solid first half performance, Group profit before tax for the
year increased 88% to £12.0m. We have benefited from an
unprecedented worldwide demand for energy particularly in China.
Our capital expenditure and rationalisation programmes have created
opportunities for productivity improvements throughout our operations.
The acquisition of Wellington Holdings plc (“Wellington”) in May
has provided a valuable addition to our niche precision polymer
businesses. Our strengthened balance sheet leaves us well placed to
exploit these opportunities.
We are encouraged by our
strong start to the year and
by current positive
indications for the future.
Colin CookeChairman
TURNOVER AND
PROFITS
Group turnover increased
20% to £313.0m (2004
£260.6m) which includes £10.8m from the former Wellington businesses acquired on 20 May
2005. Turnover growth in our underlying businesses amounted to 16% reflecting the strong
recovery in the heavyweight belting market driven by global energy demands.
Group operating profit for the year before goodwill amortisation and exceptional items
amounted to £21.3m (2004 £16.1m) including £1.9m from the former Wellington businesses.
After goodwill amortisation and exceptional items, Group operating profit amounted to
£15.8m (2004 £8.7m).
Turnover for the second half year reached £171.7m (2004 £139.8m) generating an
operating profit before goodwill amortisation and exceptional items of £14.7m (2004 £10.6m)
reflecting a strong second half performance characteristic of the markets in which the Group
operates.
Following an improved first half performance, our heavyweight belting businesses made
further progress building on the significant volume recovery particularly in North America.
Despite intense raw material price pressures, profit margins have continued to improve.
The Precision Polymers businesses in both the UK and North America have performed
well, benefiting from a recovery in levels of industrial activity.
The former Wellington businesses outperformed our expectations during the final
quarter of our financial year.
Exceptional items of £3.5m (2004 £6.2m) principally arose from impairment costs,
giving a Group profit before tax of £12.0m (2004 £6.4m). As a result of the much improved
operating performance, Group earnings per share before goodwill amortisation and
exceptional items increased to 9.34p per share (2004 7.67p) and after goodwill amortisation
and exceptional items to 5.28p (2004 2.19p).
Improvementsthroughoutour operations

Fenner PLC 3
DIVIDENDS
The Board recommends a final dividend maintained at 3.85p, which, together with the
interim dividend of 1.975p, represents a total for the year of 5.825p (2004 5.825p). The
underlying dividend cover is 1.6 after adjusting for goodwill amortisation, exceptional items
and the element relating to shares that were only in issue for three months of the year.
CASH RESOURCES AND INVESTMENT
We have raised a net £56.3m from shareholders during the year. £45.7m was invested in the
Wellington acquisition. The balance was applied to reducing our
existing debt levels whilst we examine the opportunities available
for further investment. Net borrowings at the year end amounted
to £33.9m (2004 £39.4m).
PEOPLE
The progress in improving our margin returns is a demonstration of the commitment by all
our employees, whom I thank for their efforts in this regard.
Our AGM in January 2006 will mark the retirement from the Board of Tom Glucklich,
who has been a non-executive director of the Company for over 10 years. I would like to
take this opportunity to thank Tom for his support and intellectual contribution during that
period and to wish him every success for the future.
I am pleased to announce the appointment on 1 November 2005 of David Campbell as
a non-executive director of the Company. David was formerly Chief Executive of British Vita
PLC and following the retirement of Tom Glucklich in January 2006, will chair the Company’s
Remuneration Committee.
OUTLOOK
We have made a strong start to the new year with many of our markets showing continuing,
robust strength. A buoyant energy sector has been a significant factor
in our recent growth and the confidence of our customers in this area is
an encouraging sign. Asian demand has provided the opportunity for
further new developments as the region becomes a more significant
part of the Group. Overall we look forward to another year of healthy
progress as we consolidate the benefits of our acquisition strategy.
Colin Cooke Chairman
“...opportunities...for furtherinvestment.”
“...strong startto the newyear...”

A transformationalyear
Chief Executive Officer’s Review4 Fenner PLC
Fenner Advanced Sealing Technologies service a wide range ofindustries worldwide including mobile hydraulics, industrialprocessing, materials handling, well servicing, forestry, aircraft fuelsystems, oil and gas, earthmoving and mining.

2005 saw a transformation in the Group with the acquisition of
Wellington Holdings plc in May. As a result we have now increased
the high-margin Precision Polymer’s turnover to a third of the Group’s.
We believe this also improves our profit and cash generating ability
and provides a further platform for growth.
Since the acquisition, the Wellington business, now renamed
Fenner Advanced Sealing Technologies, has performed above our
initial expectations and has already started to deliver the synergies
envisaged.
During the year we saw many of our markets strengthen as the combination of Chinese
demand and surging energy prices benefited many of our operations, both directly and
indirectly. These developments have been particularly favourable to our Asia Pacific
businesses, encouraging us to expand further our operations in China with three additional
new major projects in progress, which are detailed below.
ASIA PACIFIC
Our Chinese conveyor belting operation continued to gain momentum with strong sales
growth. As China’s burgeoning economy surged ahead on the strength of its exports and
insatiable demand for energy, coal producers
endeavoured to match the requirements. The
ensuing drive for coal productivity
improvements has proved beneficial for our
heavy duty products, as existing and new
customers realise the value of utilising higher
performance belting. This upward trend has
supported our capital investment to date with
further plant expansion planned to service our broadening customer base in this
increasingly important territory for the Group.
The hose operation in Shanghai received additional investment during the year to
accommodate output levels which are increasing as new business is gained. Slow but
steady progress is being made towards tighter truck emissions
legislation that requires changes to be made to original equipment
manufacturers’ designs, which in turn increases demand for our
products. These positive developments underpin our capital expenditure
programme for the commissioning of a dedicated world-class
manufacturing hose facility capable of meeting market demand.
The acquisition of Wellington Holdings plc brought numerous new
and exciting opportunities to the Group. These included the identification of gaps in their
geographical coverage in locations where we have existing knowledge and expertise. To
exploit these distinctive competencies, plans are underway for further penetration of seals’
markets in China with the construction of a new plant.
Fenner PLC 5
Mark AbrahamsChief Executive Officer
“...dedicatedworld-classmanufacturinghose facility...”
Above: Manufactured at the Fenner Shanghai facility, this Fenaplast conveyor belt is in operation undergroundat the Shenhua Yujialiang mine in Inner Mongolia. Currently, over 100km of Fenner Chinese-manufacturedbelting is running underground and constantly setting new records of service life and coal output.
Production of computer peripherals has progressively migrated to South East Asia in recent
years, and the overwhelming majority of our mini-pitched timing belts are shipped into the
region. Accordingly, our presence has been strengthened in South East Asia to support
existing office equipment accounts and to identify and develop new business opportunities.
Australia recorded a solid return from both the heavyweight conveyor belting and
service operations. Strong coal market
conditions, enhanced by lower Chinese
coal exports in order to serve their
domestic demand, facilitated a year-on-
year improvement in this sector. The
performance was particularly
encouraging in our network of national
service operations where the focus is
on the provision of solutions tailored to
meet our customers’ existing and future
requirements. This network was further
strengthened during the year through the acquisition of L&K Conveyor Services which has
enhanced our presence in Western Australia and provides a strong foundation for further
penetration of this territory.
Our Indian conveyor belting operation enjoyed a successful first full year as a wholly
owned subsidiary, following the prior year’s restructuring of the Group’s interest.
NORTH AMERICA
Our conveyor belting operations experienced a continuation of the market and productivity
improvements from the latter part of the previous year although rising oil prices caused
upward pressure on input costs. Sales to the mining sector were particularly strong as
reinvestment programmes commenced, underpinned by the buoyant global demand for
energy which has held coal prices at near record levels. Sales to industrial markets
improved through a combination of the recovery in the economic conditions and the
increasing value of our organisational support structure. A dedication to solving all
conveying challenges, with the use of the latest technology,
has uniquely positioned the business to develop key
partnerships with our customers.
Precision polymer operations encountered more
volatile demand patterns as US markets faced rising oil prices and consequent raw material
price inflation. Despite these effects, the industrial products group successfully continued to
deploy their strategy of product line expansion and channel exploitation. The development
programme included the launch of two new products in the year. The T-Max range of belt
and chain tensioners was expanded through the launch of the innovative, light-duty RT-3000
rotary tensioner. A new, patented variant of PowerTwist link belt has been developed
specifically to meet the market demand for roller conveyor systems to carry higher loads,
faster and more quietly.
“...key partnerships with our customers...”
6 Fenner PLC Chief Executive Officer’s Review
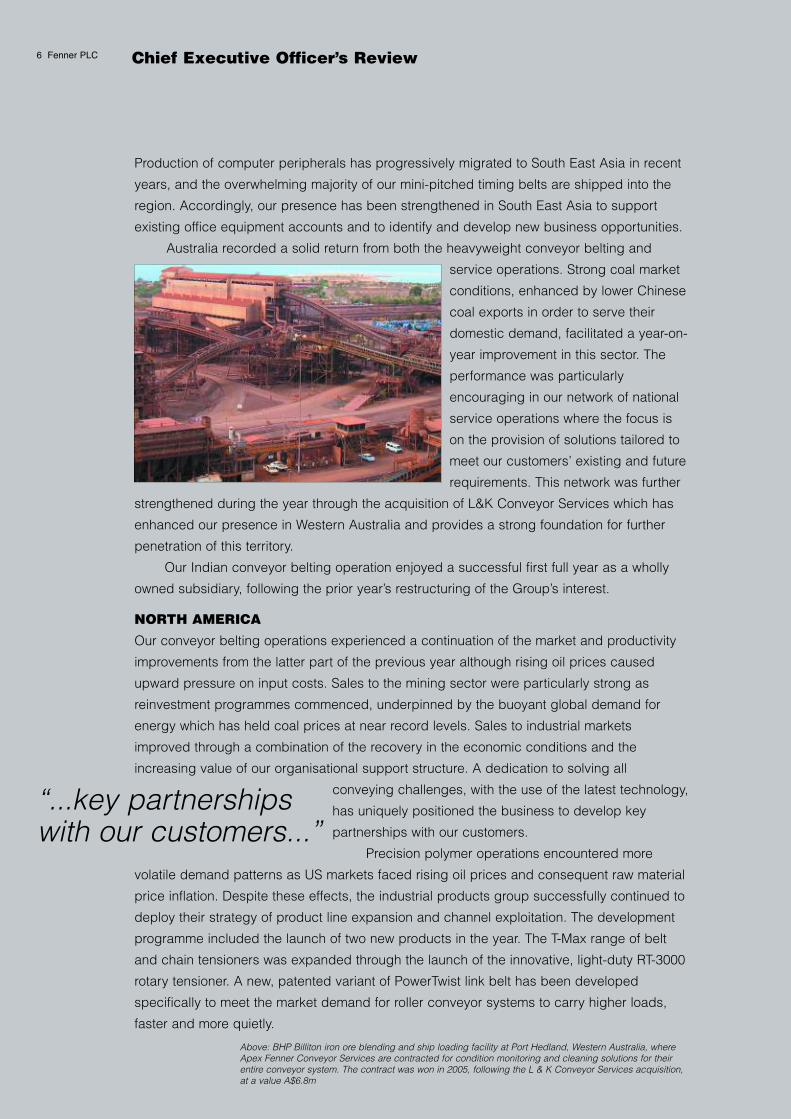
Above: BHP Billiton iron ore blending and ship loading facility at Port Hedland, Western Australia, whereApex Fenner Conveyor Services are contracted for condition monitoring and cleaning solutions for theirentire conveyor system. The contract was won in 2005, following the L & K Conveyor Services acquisition,at a value A$6.8m
The markets have responded favourably to both
of these carefully targeted product launches.
These, together with our marketing alliances, have
contributed to incremental sales growth. Market
demand in the office equipment segment was
slow in the first few months of the year, but
recovered considerably in the second half. Our
continuous improvement programme increased
production yields, but nevertheless, capacity was
flexed to meet customer demand for mini-pitch
timing belts. Planning is now well advanced for a
building extension to accommodate an increase in capacity with completion scheduled for
2006.
The newly-acquired seals operations benefited from buoyant energy markets. To
enhance growth further new applications, including the semi conductor processing industry,
were developed. The design of new sealing solutions, such as the patented SigmaSeal is
encouraging. This seal, which is generating interest in new markets, has unique
self-energising and low friction properties suitable to the control valve industry.
EUROPE
The environment for our UK based heavyweight conveyor belting operation became
increasingly difficult during the year with declining demand from both the UK and German
coal industries. Against this, the demand from our worldwide potash customers remained
robust and further penetration of Eastern European, Ukrainian and Russian coal markets was
achieved. Whilst raw material prices increased significantly during the year, sales pricing
action coupled with improved purchasing enabled margins to be maintained.
Weak economic conditions prevailed in most of our major European industrial markets,
which together with the threat from the competition
over an otherwise flat market, led to a difficult year for
our Dutch operation. As a consequence, action to
address the cost base was implemented in the
second half through a reduction in the workforce
whilst overall productivity improvements were
achieved through additional investment in new plant
and systems.
James Dawson at Lincoln built upon the solid
foundations established in recent years to record a
good performance overall. Demand from the speciality vehicle and business machine
markets was generally strong allowing the benefits from recent capital investment
programmes to be realised. Further recognition of the accomplishments of this operation
was gained in the year with the Queen’s Award for Enterprise in International Trade.
Fenner PLC 7
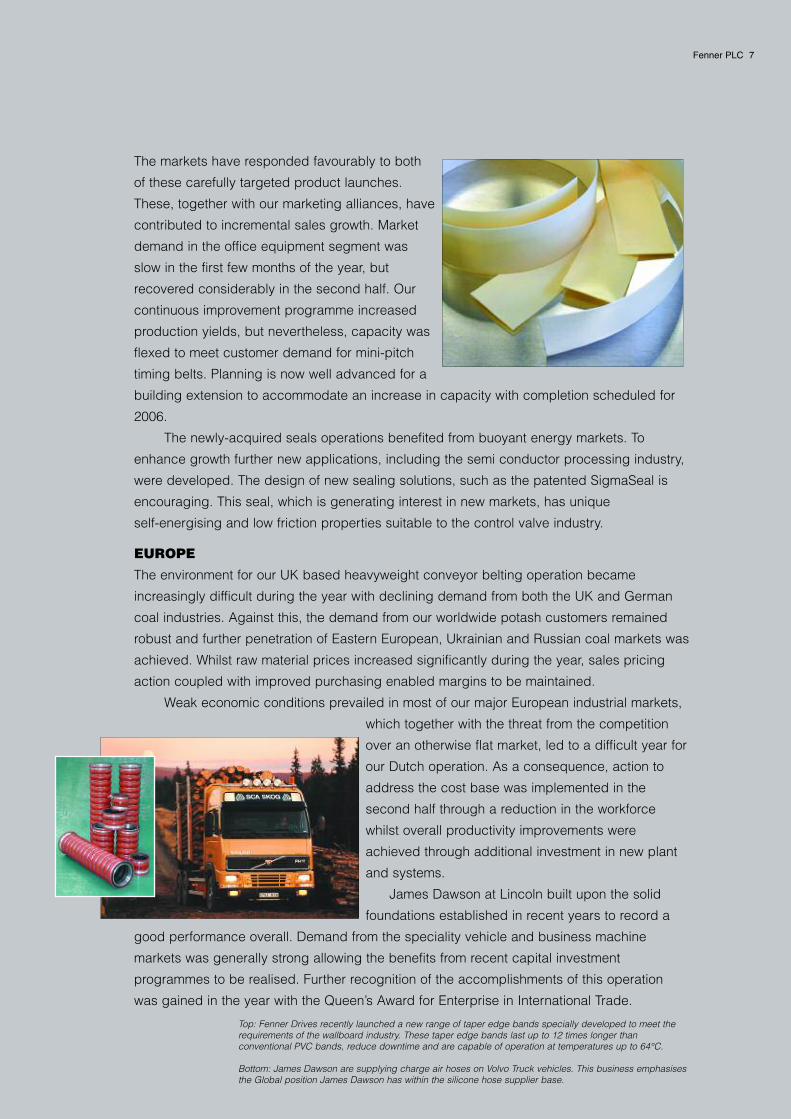
Top: Fenner Drives recently launched a new range of taper edge bands specially developed to meet therequirements of the wallboard industry. These taper edge bands last up to 12 times longer thanconventional PVC bands, reduce downtime and are capable of operation at temperatures up to 64°C.
Bottom: James Dawson are supplying charge air hoses on Volvo Truck vehicles. This business emphasisesthe Global position James Dawson has within the silicone hose supplier base.
8 Fenner PLC Chief Executive Officer’s Review
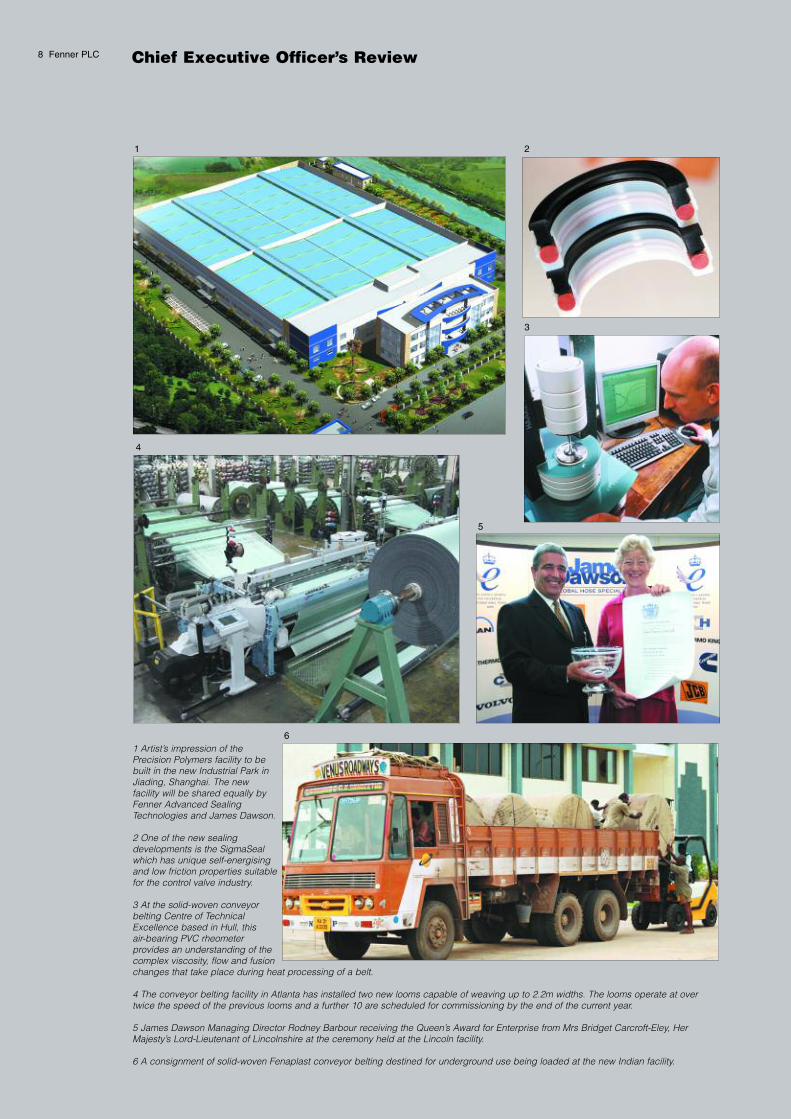
1 Artist’s impression of thePrecision Polymers facility to bebuilt in the new Industrial Park inJiading, Shanghai. The newfacility will be shared equally byFenner Advanced SealingTechnologies and James Dawson.
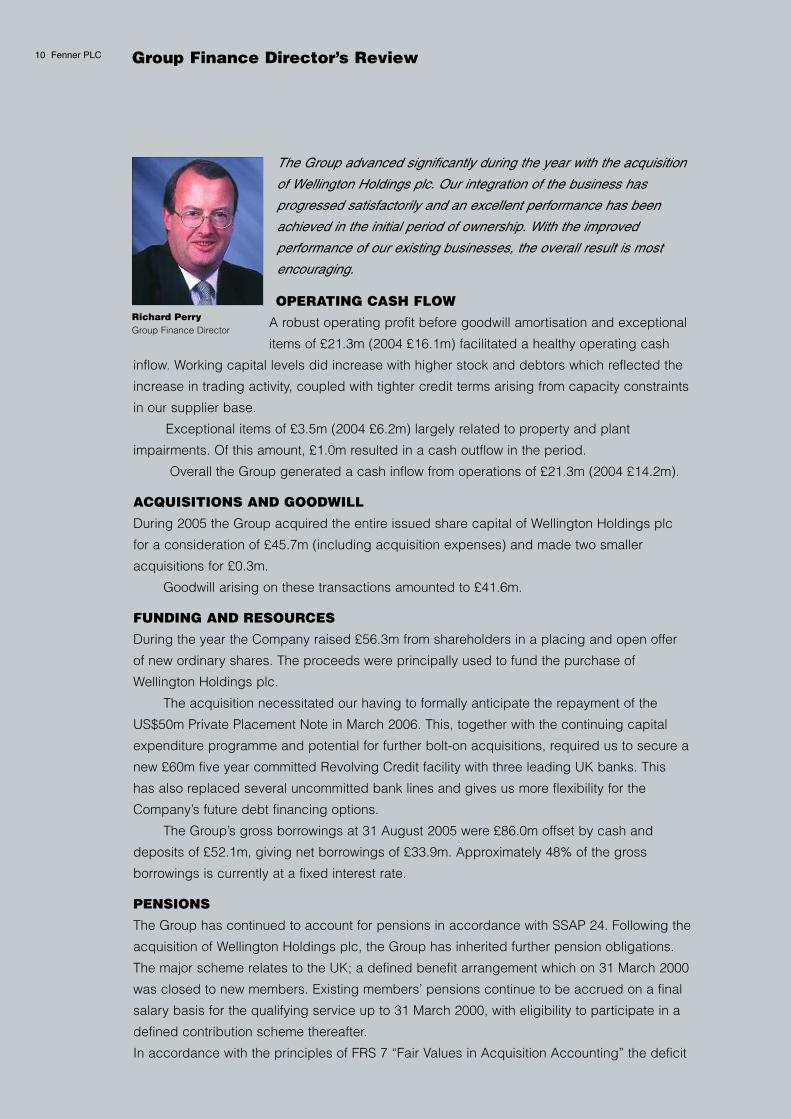
2 One of the new sealingdevelopments is the SigmaSealwhich has unique self-energisingand low friction properties suitablefor the control valve industry.
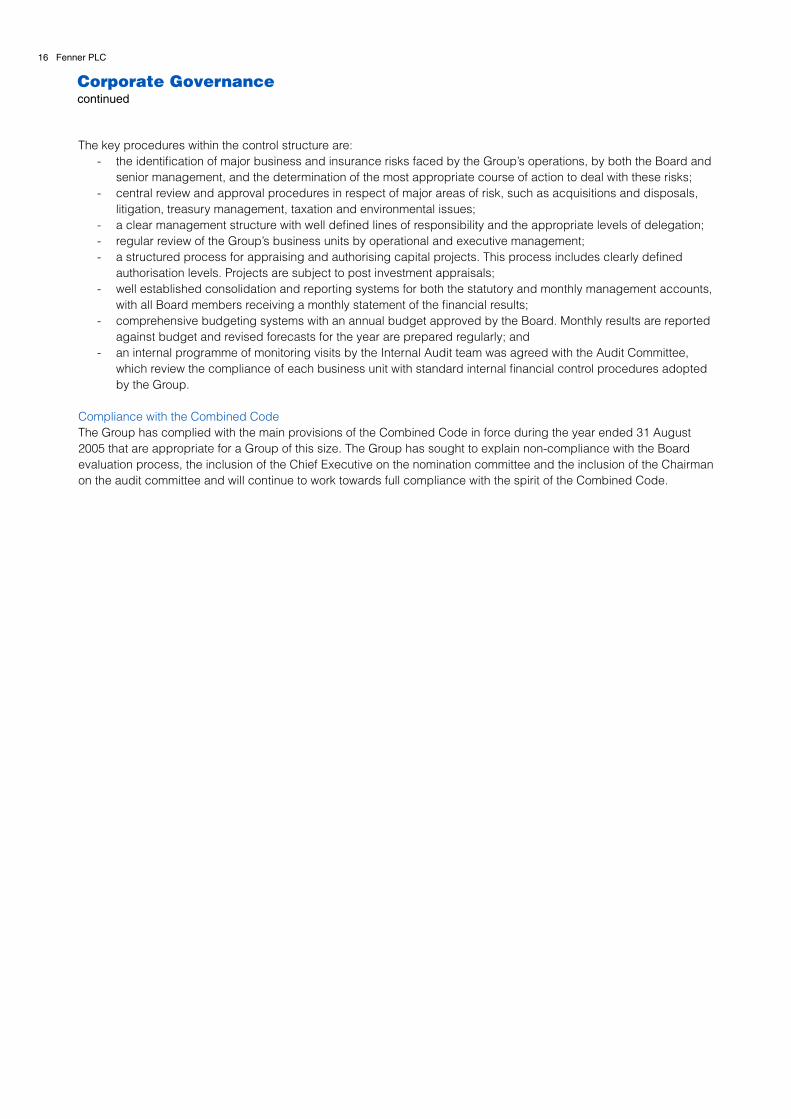
3 At the solid-woven conveyorbelting Centre of TechnicalExcellence based in Hull, thisair-bearing PVC rheometerprovides an understanding of thecomplex viscosity, flow and fusionchanges that take place during heat processing of a belt.
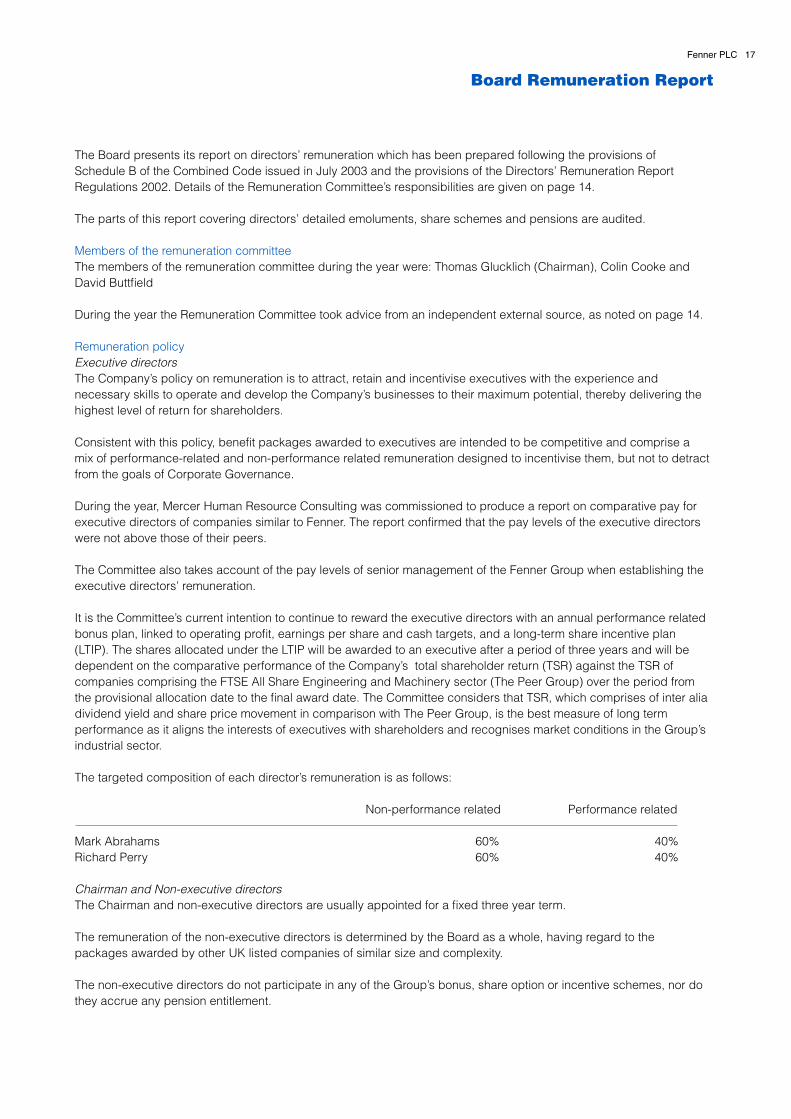
4 The conveyor belting facility in Atlanta has installed two new looms capable of weaving up to 2.2m widths. The looms operate at overtwice the speed of the previous looms and a further 10 are scheduled for commissioning by the end of the current year.
5 James Dawson Managing Director Rodney Barbour receiving the Queen’s Award for Enterprise from Mrs Bridget Carcroft-Eley, HerMajesty’s Lord-Lieutenant of Lincolnshire at the ceremony held at the Lincoln facility.
6 A consignment of solid-woven Fenaplast conveyor belting destined for underground use being loaded at the new Indian facility.
1 2
3
4
5
6

The Poynton (Cheshire) hose facility, which was acquired in February 2004, continued to
perform well. The projected market synergy between Poynton’s EPDM hose and Lincoln’s
silicone hose products is now beginning to be realised and is expected to lead to continued
steady growth of sales of Poynton products.
Fenner Drives Europe, formerly BTL in Leeds, experienced a continuing reduction in
demand from traditional markets, reflecting the general decline in UK manufacturing.
However, this decline was more than offset as programmes of innovative marketing, product
line expansion and increased activity in Europe took effect.
At the end of the year, the UK operations of both James Dawson and Fenner Drives
were restructured. James Dawson now operates exclusively in the world markets for
commercial and speciality vehicles, focusing upon capitalising on recent investments in the
specialist hose business. The industrial rubber and business machine products of James
Dawson have been brought under the responsibility of Fenner Drives Europe.
Sales from our European seals operations exceeded expectations in the period since
acquisition with strong demand from longwall mining
equipment and the oil and gas industry. As we enter the new
year, the planned relocation of the UK operation to a new
facility is progressing satisfactorily. The factory and offices
which are currently under construction at Hampton will
replace the existing network of 1920’s buildings. The benefits of the move will follow the
completion which is scheduled for the second half of 2006.
AFRICA
An increase in demand for energy in South Africa caused a heightened activity in the
region’s coal mining industry and the
commissioning of previously mothballed power
generation plants. This environment enabled the
achievement of a further successful year by our
conveyor belting operation, despite the keen
competition within the local market.
The Group’s other South African operation,
KSB, improved as the year progressed
following softer volumes into agricultural markets
in the early months and higher contract volumes
in the second half-year.
Significant progress has been made during the last year with an increasingly encouraging
trend in performance. As we enter the new financial year we do so with confidence that most
of our businesses are seeing healthy market conditions with opportunities for growth.
Mark Abrahams Chief Executive Officer
Fenner PLC 9
“...seals operationsexceededexpectations...”
Above: Fenner South Africa’s in-house splicing crew out in the fieldsplicing a solid-woven, high abrasion resistant conveyor belt on akey installation feeding coal to Lethabo, one of South Africa’snational power stations.
Group Finance Director’s Review10 Fenner PLC
The Group advanced significantly during the year with the acquisition
of Wellington Holdings plc. Our integration of the business has
progressed satisfactorily and an excellent performance has been
achieved in the initial period of ownership. With the improved
performance of our existing businesses, the overall result is most
encouraging.
OPERATING CASH FLOW
A robust operating profit before goodwill amortisation and exceptional
items of £21.3m (2004 £16.1m) facilitated a healthy operating cash
inflow. Working capital levels did increase with higher stock and debtors which reflected the
increase in trading activity, coupled with tighter credit terms arising from capacity constraints
in our supplier base.
Exceptional items of £3.5m (2004 £6.2m) largely related to property and plant
impairments. Of this amount, £1.0m resulted in a cash outflow in the period.
Overall the Group generated a cash inflow from operations of £21.3m (2004 £14.2m).
ACQUISITIONS AND GOODWILL
During 2005 the Group acquired the entire issued share capital of Wellington Holdings plc
for a consideration of £45.7m (including acquisition expenses) and made two smaller
acquisitions for £0.3m.
Goodwill arising on these transactions amounted to £41.6m.
FUNDING AND RESOURCES
During the year the Company raised £56.3m from shareholders in a placing and open offer
of new ordinary shares. The proceeds were principally used to fund the purchase of
Wellington Holdings plc.
The acquisition necessitated our having to formally anticipate the repayment of the
US$50m Private Placement Note in March 2006. This, together with the continuing capital
expenditure programme and potential for further bolt-on acquisitions, required us to secure a
new £60m five year committed Revolving Credit facility with three leading UK banks. This
has also replaced several uncommitted bank lines and gives us more flexibility for the
Company’s future debt financing options.
The Group’s gross borrowings at 31 August 2005 were £86.0m offset by cash and
deposits of £52.1m, giving net borrowings of £33.9m. Approximately 48% of the gross
borrowings is currently at a fixed interest rate.
PENSIONS
The Group has continued to account for pensions in accordance with SSAP 24. Following the
acquisition of Wellington Holdings plc, the Group has inherited further pension obligations.
The major scheme relates to the UK; a defined benefit arrangement which on 31 March 2000
was closed to new members. Existing members’ pensions continue to be accrued on a final
salary basis for the qualifying service up to 31 March 2000, with eligibility to participate in a
defined contribution scheme thereafter.
In accordance with the principles of FRS 7 “Fair Values in Acquisition Accounting” the deficit
Richard PerryGroup Finance Director

Fenner PLC 11
of £2.1m in this scheme has been included within the provisional fair value of net assets
acquired.
The manner in which pension arrangements are reflected in the Group’s accounts will
change when the substantive requirements of FRS 17 “Retirement Benefits” are adopted
under International Financial Reporting Standards. Note 27b of the accounts gives the
funding position and pension cost in accordance with FRS 17 principles.
TAXATION
The Group’s taxation charge for the year was £4.5m (2004 £3.1m) after offsetting a tax credit
of £0.4m in respect of exceptional items. Before exceptionals and goodwill amortisation, the
tax rate was 28% (2004 29%).
TREASURY POLICY
The Group has a central treasury function which operates in accordance with Board
approved policies. Its principal objective is to minimise financial risk. Where appropriate,
derivative transactions are undertaken to reduce interest rate and currency rate risks arising
from the Group’s operations and sources of finance. No speculative trading is undertaken.
The interest cost arising on borrowings is managed on a net basis through the use,
where appropriate, of swaps to reduce the interest rate risk.
Deposits of funds are made with banks and financial institutions approved by the Board
and within set credit limits. Bank and loan facilities are monitored on a regular basis and
maintained at a level which provides adequate funding for seasonal variations in borrowings
whilst allowing for acquisitions and organic expansion.
The Group’s principal foreign currency exposures arise on the translation of overseas
profits and net assets into sterling, the translation of intra-group lending (principally from the
UK to overseas subsidiaries) and from trading transactions in foreign currencies. The Group
normally only hedges the accounting exposure on the translation of overseas profits to the
extent that such profits are offset by interest charges on foreign currency borrowings.
Where cost effective, overseas net assets are hedged by foreign currency borrowings and
intra-group lending is matched by external borrowings in the same currency. Currency
exposures arising from trading transactions are continually monitored and material
exposures are hedged once cash flows can be identified with sufficient certainty.
During the year the derivatives used by the Group have been forward foreign exchange
contracts, options and interest rate swaps.
INTERNATIONAL FINANCIAL REPORTING STANDARDS (IFRS)
For accounting periods commencing on or after 1 January 2005 all European listed
companies are required to use IFRS to prepare their consolidated financial statements. For
Fenner this means that the 2006 Interim Report, the 2006 Annual Report and all subsequent
reports including all comparative information will be prepared using IFRS. The Group has
continued its preparatory work to ensure full compliance with these requirements.
Richard Perry Group Finance Director

12 Fenner PLC
COLINCOOKE (65)* a r n
ChairmanJoined the Companyin May 1993 as non-executive Chairman.He is also a non-executive director ofAdvanced FluidConnections plc(formerly known asOystertec plc).
The Board
MARKABRAHAMS (50) n
Chief ExecutiveOfficerAppointed to theBoard as GroupFinance Director in1990, and becameChief ExecutiveOfficer in May 1994.He is also non-executive Chairmanof Inditherm plc.
RICHARDPERRY (55)Group FinanceDirectorAppointed to theBoard in September1994. He is also anon-executivedirector of ScapaGroup plc.
DAVID BUTTFIELD(59)* a r n
Appointed to theBoard in January2003, he is a formerexecutive directorof D S Smith Plc.
THOMASGLUCKLICH (69)* a r n
Appointed to theBoard in August 1995,he was formerly adirector of LazardBros & Co Limited.
DEBRABRADBURY (39)Company SecretaryJoined the Company in2001 and wasappointed CompanySecretary in July 2002.
DAVID CAMPBELL(55)* a r n
Appointed to theBoard in November2005, he wasformerly ChiefExecutive of BritishVita plc.
* Non executive a Audit Committeer Remuneration Committeen Nomination Committee

Fenner PLC 13
The Group is committed to comply with the Principles of Corporate Governance as set out in the 2003 FinancialReporting Council’s Combined Code as incorporated into the FSA Listing Rules (“Combined Code”) and continues torecognise the importance of high standards of corporate governance. This statement explains how the Principles ofCorporate Governance are applied within the Group and areas of non compliance are explained.
Directors & Directors’ IndependenceThe Board usually comprises the non-executive Chairman, two executive directors and two non-executive directors andis responsible to shareholders for the proper management of the Group. Specific matters are reserved for the Board’sconsideration under a formal schedule including Group strategy, reviewing trading performance, considering seniormanagement appointments, formulating policy on key issues including the approval of significant capital expenditure,acquisitions and disposals and reporting to shareholders.
The Board is headed by a non-executive Chairman who was independent upon appointment and whose role is distinctand separate from that of the Chief Executive Officer. The other non-executive directors are also independent. ThomasGlucklich, a non-executive director is the senior independent director of the company and is considered by the Boardto be independent in both character, judgement and contribution despite having served for 10 years. Thomas Glucklichwill be retiring from the Board at the forthcoming AGM. David Campbell was appointed to the Board on 1st November2005 and was independent upon appointment. The Chairman and the non-executive directors are independent ofmanagement and do not have any business relationships which could interfere with the exercise of their judgement.
Biographical details of the directors are set out on page 12.
Non-executive directors receive appropriate briefings on the Group and its operations when they are appointed to theBoard. They are encouraged to visit the Group’s offices and factories whenever the opportunity presents itself, wherethey are briefed on local business operations. All directors have access to the Company Secretary, who is responsiblefor ensuring that Board procedures are followed and that the Group complies with all applicable rules, regulations andobligations governing its operations. A procedure exists for directors to take independent professional advice, at theGroup’s expense, if necessary, in the furtherance of their duties. The Board is provided with timely and appropriateinformation prior to each Board, Committee or General Meeting covering the items on the agenda for such meetings.
The Board is in the process of identifying a suitable and meaningful board evaluation process. The NominationCommittee appraised the requirements of the Board during the year as part of the recruitment process for a new nonexecutive director.
All directors are subject to election by shareholders at the first Annual General Meeting following their appointment andto re-election thereafter at intervals of no more than three years.
The Board has a number of committees consisting of directors and senior executives. Details of their composition andpurpose are outlined below. In addition the Chairman and the non-executive directors meet from time to time withoutthe executive directors being present.
Group ExecutiveThe Executive Committee is chaired by Mark Abrahams. It consists of the two executive directors, the CompanySecretary and five members of the Group’s senior management. The Executive Committee meets at least 6 times a yearand deals with the daily management of the Group through powers delegated to it by the Board.
Audit CommitteeThe Audit Committee comprises the Chairman and the non-executive directors and is chaired by David Buttfield whohas recent and relevant financial experience. Due to the size of the Company and the number of non-executivedirectors, the Board has decided that the Chairman of the Company should remain a member of the Committee.
The terms of reference of the Audit Committee cover all the main points recommended by the Combined Code. Itsprincipal duties are to monitor the integrity of the financial statements, to review the internal controls and riskmanagement systems, to review the work of internal audit and to consider all aspects of the relationship with theexternal auditor. The Committee has the authority to obtain external legal or other professional advice on any matterwithin its terms of reference.
Corporate Governance

There is a policy on the provision of non-audit services by the external auditor. Certain services such as due diligencein relation to acquisitions and disposals, taxation and actuarial advice are permitted but others, for example, internalaudit, information technology and HR consultancy are generally considered inappropriate. Non-audit fees are reportedto the Committee.
The Committee has received and reviewed written confirmation from the external auditor on all relationships that in theirjudgement may bear on its independence. The external auditor has also confirmed that it considers itself independentwithin the meaning of UK regulatory and professional requirements.
Nomination CommitteeThe Nomination Committee, which consists of the Chairman, the non-executive directors and the Group ChiefExecutive Officer, is chaired by Colin Cooke. The duty of the Committee is to make recommendations to the Boardregarding the appointment of new Board members. Given the size of the Board and the Company, it is felt bothappropriate and prudent to have Mark Abrahams on the Committee to work with the Chairman and non-executivedirectors on senior recruitment issues. Written terms of reference were adopted during the year clearly setting out therole and scope of the Committee. There were three meetings during the year to identify and recruit a new non-executivedirector to replace Thomas Glucklich when he retires at the forthcoming AGM. The Committee was assisted bySpencer Stuart Consultants in identifying a short list of candidates who met the profile being sought by the Board.David Campbell was subsequently selected and joined the Board on 1 November 2005.
Remuneration CommitteeThe Remuneration Committee consists of the Chairman and non-executive directors and is chaired by ThomasGlucklich. David Campbell will become the Chairman of the Committee when Thomas Glucklich retires. The GroupChief Executive Officer also attends the meetings by invitation.
The Committee is responsible to the Board for determining the remuneration packages of the executive directors andother senior executives and advises on executive remuneration policy issues. It also approves the granting of shareoptions to employees within the Group and administers the Group’s Long Term Share Incentive Plan (LTIP).
The Remuneration Committee during the year received advice from MM&K Ltd who assisted the Committee inconsideration of matters relating to directors’ incentives and Mercer Human Resource Consulting, who conducted areview of executive directors’ remuneration.
Directors’ remunerationThe Board Remuneration Report is set out on pages 17 to 22.
Relations with shareholdersThe Company encourages regular dialogue with its institutional shareholders and also with private investors at theAnnual General Meeting. Update meetings are held with institutional shareholders following the announcement ofinterim and final results and as requested throughout the year. Similar meetings are held with private client brokers sothat the same information can be disseminated to private investors. Recent analyst presentations are also madeavailable on the www.fenner.com website. The Group website was revised during the year and now providescomprehensive investor relations information for shareholders to view. The website includes the current share price,regulatory announcements, financial performance information, shareholder information and an investor relationscontact address.
Corporate Governancecontinued
14 Fenner PLC
Number of meetings during the yearChairman C I Cooke
Executive directorsM S AbrahamsR J Perry
Non-executive directorsT C GlucklichD F Buttfield
* By invitation
Group Board
109
109
910
Meetings of the BoardAudit
Committee
32
3*3*
33
RemunerationCommittee
55
3*-
55
NominationCommittee
33
3-
33

Fenner PLC 15
Annual General MeetingIn relation to the Company’s Annual General Meeting:
- the proxy count in respect of each resolution is announced after it has been dealt with on a show of hands;- a separate resolution is proposed for each substantially separate issue, including the receipt of the annual
report and accounts;- all executive and non-executive Board members normally attend the Meeting; and- the Notice of the Meeting, the annual report and accounts and any other related papers are normally sent to
shareholders more than one month before the Meeting.
Accountability and auditDirectors’ responsibilities in respect of the financial statementsCompany law requires the directors to prepare financial statements for each financial year which give a true and fairview of the state of affairs of the Company and the Group and of the profit or loss of the Group for that period. Inpreparing those financial statements, the directors are required to:
- select suitable accounting policies and then apply them consistently;- make judgments and estimates that are reasonable and prudent;- state whether applicable accounting standards have been followed, subject to any material departures
disclosed and explained in the financial statements; and- prepare the financial statements on the going concern basis unless it is inappropriate to presume that the
Company and the Group will continue in business.
The directors are responsible for keeping proper accounting records which disclose with reasonable accuracy at anytime the financial position of the Company and the Group and enable them to ensure that the financial statementscomply with the Companies Act 1985. They are also responsible for safeguarding the assets of the Company and theGroup and hence for taking reasonable steps for the prevention and detection of fraud and other irregularities.
The maintenance and integrity of the Fenner PLC website is the responsibility of the directors; the work carried out bythe auditors does not involve consideration of these matters and accordingly, the auditors accept no responsibility forany changes that may have occurred to the financial statements since they were initially presented on the website.Legislation in the UK governing the preparation and dissemination of financial statements may differ from legislation inother jurisdictions.
Going concernAfter making enquiries, the directors have formed a judgment at the time of approving the financial statements thatthere is a reasonable expectation that the Company and Group have adequate resources to continue in operationalexistence for the foreseeable future. For this reason, the directors continue to adopt the going concern basis inpreparing the financial statements.
Internal controlThe Board continues to review the effectiveness of the Group’s system of internal control and evaluates the InternalControl report at least twice a year. This review covers all controls, including operational, financial, compliance and riskmanagement.
As required by the UK Listing Authority, the Group has complied with the Combined Code provisions on internal controlhaving established the procedures necessary to implement the guidance contained in “Guidance for Directors on theCombined Code” issued by the Institute of Chartered Accountants in England and Wales and by reporting inaccordance with that guidance.
The directors are responsible for the Group’s system of internal control which, like any system of internal control, canonly provide reasonable and not absolute assurance against material misstatement or loss.
The directors have reviewed the effectiveness of the system of internal control in operation during the year and up tothe date of approval of the annual report.
Corporate Governancecontinued
16 Fenner PLC
The key procedures within the control structure are:- the identification of major business and insurance risks faced by the Group’s operations, by both the Board and
senior management, and the determination of the most appropriate course of action to deal with these risks;- central review and approval procedures in respect of major areas of risk, such as acquisitions and disposals,
litigation, treasury management, taxation and environmental issues;- a clear management structure with well defined lines of responsibility and the appropriate levels of delegation;- regular review of the Group’s business units by operational and executive management;- a structured process for appraising and authorising capital projects. This process includes clearly defined
authorisation levels. Projects are subject to post investment appraisals;- well established consolidation and reporting systems for both the statutory and monthly management accounts,
with all Board members receiving a monthly statement of the financial results;- comprehensive budgeting systems with an annual budget approved by the Board. Monthly results are reported
against budget and revised forecasts for the year are prepared regularly; and- an internal programme of monitoring visits by the Internal Audit team was agreed with the Audit Committee,
which review the compliance of each business unit with standard internal financial control procedures adopted by the Group.
Compliance with the Combined CodeThe Group has complied with the main provisions of the Combined Code in force during the year ended 31 August2005 that are appropriate for a Group of this size. The Group has sought to explain non-compliance with the Boardevaluation process, the inclusion of the Chief Executive on the nomination committee and the inclusion of the Chairmanon the audit committee and will continue to work towards full compliance with the spirit of the Combined Code.
Board Remuneration Report
The Board presents its report on directors’ remuneration which has been prepared following the provisions ofSchedule B of the Combined Code issued in July 2003 and the provisions of the Directors’ Remuneration ReportRegulations 2002. Details of the Remuneration Committee’s responsibilities are given on page 14.
The parts of this report covering directors’ detailed emoluments, share schemes and pensions are audited.
Members of the remuneration committeeThe members of the remuneration committee during the year were: Thomas Glucklich (Chairman), Colin Cooke andDavid Buttfield
During the year the Remuneration Committee took advice from an independent external source, as noted on page 14.
Remuneration policyExecutive directorsThe Company’s policy on remuneration is to attract, retain and incentivise executives with the experience andnecessary skills to operate and develop the Company’s businesses to their maximum potential, thereby delivering thehighest level of return for shareholders.
Consistent with this policy, benefit packages awarded to executives are intended to be competitive and comprise amix of performance-related and non-performance related remuneration designed to incentivise them, but not to detractfrom the goals of Corporate Governance.
During the year, Mercer Human Resource Consulting was commissioned to produce a report on comparative pay forexecutive directors of companies similar to Fenner. The report confirmed that the pay levels of the executive directorswere not above those of their peers.
The Committee also takes account of the pay levels of senior management of the Fenner Group when establishing theexecutive directors’ remuneration.
It is the Committee’s current intention to continue to reward the executive directors with an annual performance relatedbonus plan, linked to operating profit, earnings per share and cash targets, and a long-term share incentive plan(LTIP). The shares allocated under the LTIP will be awarded to an executive after a period of three years and will bedependent on the comparative performance of the Company’s total shareholder return (TSR) against the TSR ofcompanies comprising the FTSE All Share Engineering and Machinery sector (The Peer Group) over the period fromthe provisional allocation date to the final award date. The Committee considers that TSR, which comprises of inter aliadividend yield and share price movement in comparison with The Peer Group, is the best measure of long termperformance as it aligns the interests of executives with shareholders and recognises market conditions in the Group’sindustrial sector.
The targeted composition of each director’s remuneration is as follows:
Non-performance related Performance related
Mark Abrahams 60% 40%Richard Perry 60% 40%
Chairman and Non-executive directorsThe Chairman and non-executive directors are usually appointed for a fixed three year term.
The remuneration of the non-executive directors is determined by the Board as a whole, having regard to thepackages awarded by other UK listed companies of similar size and complexity.
The non-executive directors do not participate in any of the Group’s bonus, share option or incentive schemes, nor dothey accrue any pension entitlement.
Fenner PLC 17

Board Remuneration Reportcontinued
18 Fenner PLC
Directors’ service contractsThe executive directors have rolling 12 month contracts, in addition the Company has agreed to the payment of aprescribed sum equivalent to 12 months salary and contractual benefits if there is a change of control or termination oftheir contracts by the company other than for cause.
The service contracts do not contain any provision for compensation on early termination other than the notice period,and the provision noted above, however the Committee will seek to mitigate cost to the Company whilst dealing fairlywith each individual case.
The details of the service contracts in relation to the executive directors and letters of appointment in relation to theChairman and non-executive directors, who served as directors during the year are:
Unexpiredterm at Notice
31 August 2005 period
Mark Abrahams - 1 yearRichard Perry - 1 yearColin Cooke* 28 months Fixed TermThomas Glucklich 4 months Fixed TermDavid Buttfield 4 months Fixed Term
* Colin Cooke’s services are provided by way of an agreement between the Company, Steels Management Limited andColin Cooke.
External appointmentsFenner recognises that its executive directors are likely to be invited to become non-executive directors of othercompanies and that such appointments can broaden experience and knowledge, which may benefit Fenner. Thereforeexecutive directors may, subject to approval by the Board and providing there is no conflict of interest, be allowed toaccept appointments as a non-executive director of another company and are normally allowed to retain the fees paidfrom such appointments. In normal circumstances, they may not accept more than one appointment. Currently theChief Executive Officer, Mark Abrahams, is non-executive Chairman of Inditherm plc and retained fees of £35,000 inrelation to Inditherm plc’s year ending 31 December 2004. The Group Finance Director, Richard Perry, was appointedas a non-executive director of Scapa Group plc on 1 June 2005 and will retain the fees.
Remuneration components for executive directorsThe major components of the executive directors’ remuneration are:
Basic annual salary and benefitsThe basic annual salary is subject to an annual review which takes into account the performance of the Group and theindividual and salary trends in comparable companies. In addition, a car allowance, healthcare insurance and otherbenefits are available in line with normal corporate practice.
Annual performance related bonusPerformance related cash bonuses are reviewed annually. Demanding performance targets are set, which must beachieved before the maximum bonus is payable. The confirmed criteria include targets linked to the Group’sperformance in terms of operating profit and earnings per share. The target bonus for achievement of the annualbudget for these measures is 35% of basic annual salary and the maximum potential payment for the annual bonus is60% of basic annual salary, excluding benefits in kind and pension contributions.
Long Term Share Incentive PlanThe Long Term Share Incentive Plan (LTIP) is designed to encourage its participants to deliver sustained long termperformance.
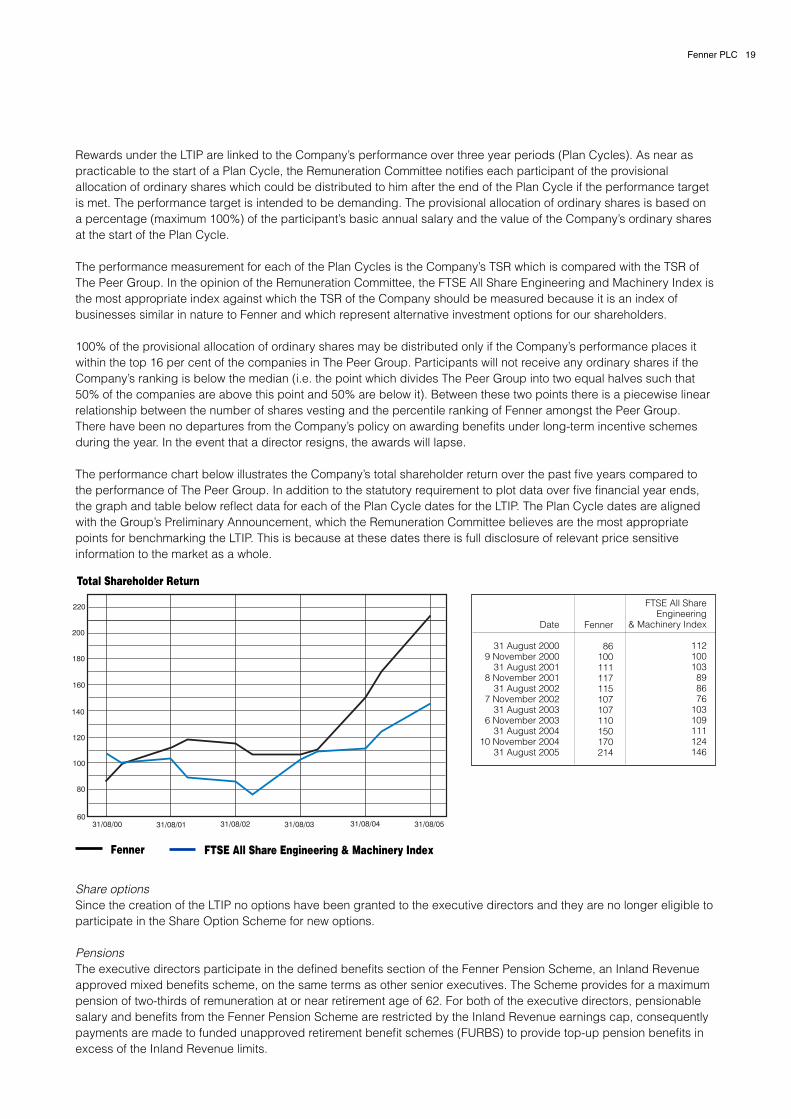
Rewards under the LTIP are linked to the Company’s performance over three year periods (Plan Cycles). As near aspracticable to the start of a Plan Cycle, the Remuneration Committee notifies each participant of the provisionalallocation of ordinary shares which could be distributed to him after the end of the Plan Cycle if the performance targetis met. The performance target is intended to be demanding. The provisional allocation of ordinary shares is based ona percentage (maximum 100%) of the participant’s basic annual salary and the value of the Company’s ordinary sharesat the start of the Plan Cycle.
The performance measurement for each of the Plan Cycles is the Company’s TSR which is compared with the TSR ofThe Peer Group. In the opinion of the Remuneration Committee, the FTSE All Share Engineering and Machinery Index isthe most appropriate index against which the TSR of the Company should be measured because it is an index ofbusinesses similar in nature to Fenner and which represent alternative investment options for our shareholders.
100% of the provisional allocation of ordinary shares may be distributed only if the Company’s performance places itwithin the top 16 per cent of the companies in The Peer Group. Participants will not receive any ordinary shares if theCompany’s ranking is below the median (i.e. the point which divides The Peer Group into two equal halves such that50% of the companies are above this point and 50% are below it). Between these two points there is a piecewise linearrelationship between the number of shares vesting and the percentile ranking of Fenner amongst the Peer Group.There have been no departures from the Company’s policy on awarding benefits under long-term incentive schemesduring the year. In the event that a director resigns, the awards will lapse.
The performance chart below illustrates the Company’s total shareholder return over the past five years compared tothe performance of The Peer Group. In addition to the statutory requirement to plot data over five financial year ends,the graph and table below reflect data for each of the Plan Cycle dates for the LTIP. The Plan Cycle dates are alignedwith the Group’s Preliminary Announcement, which the Remuneration Committee believes are the most appropriatepoints for benchmarking the LTIP. This is because at these dates there is full disclosure of relevant price sensitiveinformation to the market as a whole.
Share optionsSince the creation of the LTIP no options have been granted to the executive directors and they are no longer eligible toparticipate in the Share Option Scheme for new options.
PensionsThe executive directors participate in the defined benefits section of the Fenner Pension Scheme, an Inland Revenueapproved mixed benefits scheme, on the same terms as other senior executives. The Scheme provides for a maximumpension of two-thirds of remuneration at or near retirement age of 62. For both of the executive directors, pensionablesalary and benefits from the Fenner Pension Scheme are restricted by the Inland Revenue earnings cap, consequentlypayments are made to funded unapproved retirement benefit schemes (FURBS) to provide top-up pension benefits inexcess of the Inland Revenue limits.
FTSE All ShareEngineering
& Machinery Index
112100103898676
103109111124146
Fenner
86100111117115107107110150170214
Date
31 August 2000 9 November 2000
31 August 20018 November 2001
31 August 20027 November 2002
31 August 20036 November 2003
31 August 200410 November 2004
31 August 2005
Total Shareholder Return
31/08/00 31/08/01 31/08/02 31/08/03 31/08/04 31/08/05
120
100
80
60
140
160
180
200
220
Fenner FTSE All Share Engineering & Machinery Index
Fenner PLC 19
Board Remuneration Reportcontinued
20 Fenner PLC
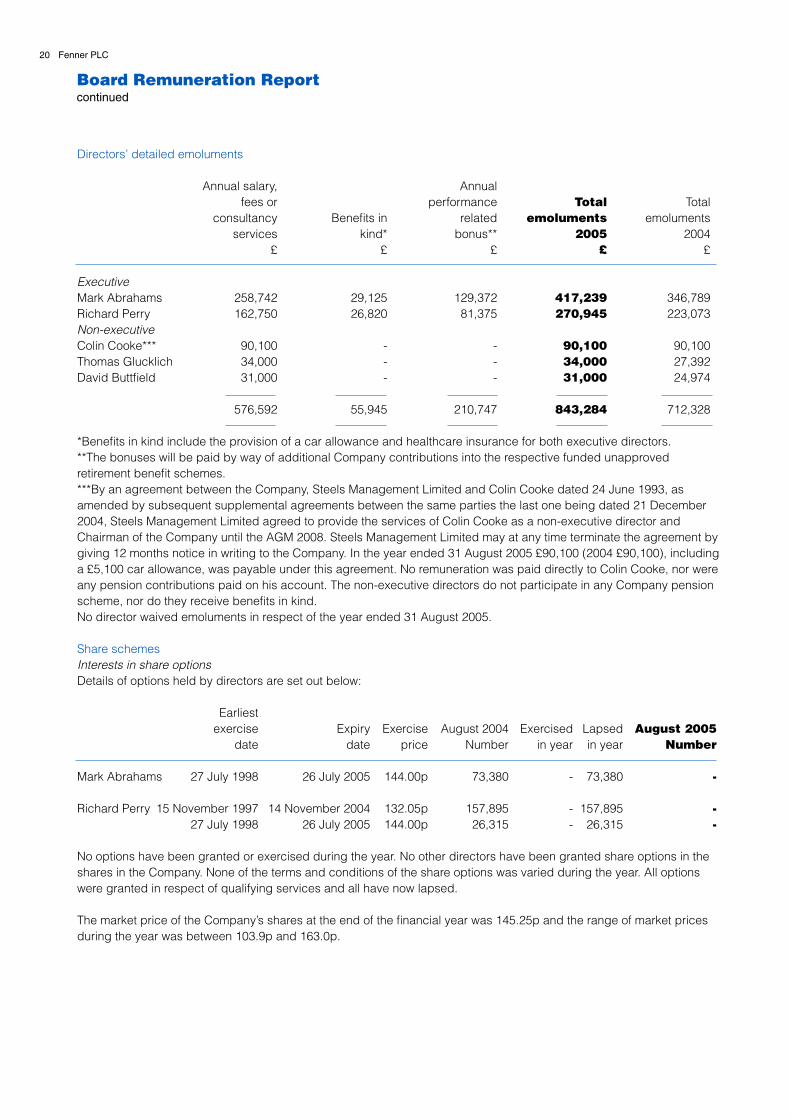
Directors’ detailed emoluments
Annual salary, Annual fees or performance Total Total
consultancy Benefits in related emoluments emolumentsservices kind* bonus** 2005 2004
£ £ £ £ £
ExecutiveMark Abrahams 258,742 29,125 129,372 417,239 346,789Richard Perry 162,750 26,820 81,375 270,945 223,073Non-executiveColin Cooke*** 90,100 - - 90,100 90,100Thomas Glucklich 34,000 - - 34,000 27,392David Buttfield 31,000 - - 31,000 24,974
576,592 55,945 210,747 843,284 712,328
*Benefits in kind include the provision of a car allowance and healthcare insurance for both executive directors.**The bonuses will be paid by way of additional Company contributions into the respective funded unapprovedretirement benefit schemes. ***By an agreement between the Company, Steels Management Limited and Colin Cooke dated 24 June 1993, asamended by subsequent supplemental agreements between the same parties the last one being dated 21 December2004, Steels Management Limited agreed to provide the services of Colin Cooke as a non-executive director and Chairman of the Company until the AGM 2008. Steels Management Limited may at any time terminate the agreement bygiving 12 months notice in writing to the Company. In the year ended 31 August 2005 £90,100 (2004 £90,100), includinga £5,100 car allowance, was payable under this agreement. No remuneration was paid directly to Colin Cooke, nor wereany pension contributions paid on his account. The non-executive directors do not participate in any Company pensionscheme, nor do they receive benefits in kind.No director waived emoluments in respect of the year ended 31 August 2005.
Share schemesInterests in share optionsDetails of options held by directors are set out below:
Earliest exercise Expiry Exercise August 2004 Exercised Lapsed August 2005
date date price Number in year in year Number
Mark Abrahams 27 July 1998 26 July 2005 144.00p 73,380 - 73,380 -
Richard Perry 15 November 1997 14 November 2004 132.05p 157,895 - 157,895 -27 July 1998 26 July 2005 144.00p 26,315 - 26,315 -
No options have been granted or exercised during the year. No other directors have been granted share options in theshares in the Company. None of the terms and conditions of the share options was varied during the year. All optionswere granted in respect of qualifying services and all have now lapsed.
The market price of the Company’s shares at the end of the financial year was 145.25p and the range of market pricesduring the year was between 103.9p and 163.0p.

Interests in sharesThe interests of the directors in the 25p ordinary shares of the Company were:
31 August 2005 1 September 2004 Number Number
Mark Abrahams 394,840 360,255Richard Perry 327,032 290,173Colin Cooke 210,408 198,596Thomas Glucklich 1,000 1,000David Buttfield - -
All directors’ interests are beneficially held. There have been no changes in the interests set out above between31 August 2005 and 9 November 2005.
Long-term incentive schemesShares awarded to executive directors under the long-term incentive plan are as follows:
End of Plan Cycle 1 September Provisional Shares Shares 31 August Value & Award
Allocation 2004 allocation awarded lapsed 2005 awarded Determinationdate Number Number Number Number Number £ date
Mark Abrahams7 November 2001 161,296 161,296 38,598 122,698 - 46,318 16 November 20046 November 2002 196,569 200,559 200,559 6 November 20055 November 2003 212,623 216,939 216,939 5 November 200610 November 2004 155,046 155,046 10 November 2007
Richard Perry7 November 2001 104,667 104,667 25,047 79,620 - 30,056 16 November 20046 November 2002 127,390 129,976 129,976 6 November 20055 November 2003 136,925 139,704 139,704 5 November 200610 November 2004 97,524 97,524 10 November 2007
Total of awards in year 63,645 76,374
The number of shares provisionally allocated was adjusted under the rules of the long term incentive plan following theShare Placing and Open Offer.
The performance criteria attached to the shares that were awarded on 16 November 2004 and those provisionallyallocated on 10 November 2004 relate to the Company’s TSR, which is compared with the TSR of The Peer Group.
There have been no variations in the terms and conditions of scheme interests during the year. All awards under long-termincentive plans were in respect of qualifying services.
The Plan Cycle ending on 16 November 2004 was independently evaluated and an award of shares made representing24% of the original award of shares was made on 14 December 2004. The market value (as defined in the Rules of thePlan) of an Ordinary Share of the Company at the beginning of the Plan Cycle was 103.9p, at the end of the Plan Cyclewas 120.00p and the market value used on 16 November 2004 for the new Plan Cycle was 127.7p (125.16p afteradjustment for the Share Placing and Open Offer).
The Performance Graph on page 18 showing TSR gives an indication of whether each LTIP Plan Cycle will achieve theperformance criteria, based upon the share price at 31 August 2005.
Given the nature of the performance calculation, it could be misleading to indicate a likely outcome for future shareawards.
Fenner PLC 21

Signed on behalf of the Board of DirectorsT C Glucklich Chairman of the Remuneration Committee9 November 2005
Additional information as required by the Listing RulesTransfer value of additional accrued benefits
Additional accrued benefits earned in year earned in year less directors’ contributions£ £
Mark Abrahams 2,700 26,400Richard Perry 3,500 36,200
The accrued pension entitlement is the amount that the director would be paid annually on retirement based on serviceto 31 August 2005. The Listing Rules require the increase in this amount to be disclosed excluding inflation. Thebenefits do not allow for any retained benefits which the directors may have relating to previous employment. Thepension benefits exclude any additional pension purchased by additional voluntary contributions.
The increase in the accrued entitlement is the difference between the accrued entitlement at the year end (31 August2005) and the accrued entitlement at the previous year end (31 August 2004).
The pension benefits are based on the directors’ pensionable salaries which are limited to the Inland Revenue earningscap (currently £105,600 per annum).
All transfer values have been calculated on the basis of actuarial advice in accordance with Actuarial Guidance NoteGN11. The transfer values of the accrued entitlement represent the value of assets that the pension scheme wouldneed to transfer to another pension provider on transferring the scheme’s liability in respect of the directors’ pensionbenefits. They do not represent sums payable to individual directors and, therefore, cannot be added meaningfully toannual remuneration.
The transfer value of the increase in accrued benefits, required by the Listing Rules, discloses the current value of theincrease in accrued benefits that the director has earned in the period, whereas the change in his transfer value,required by the Companies Act discloses the absolute increase or decrease in his transfer value and includes thechange in value of the accrued benefits that results from market volatility affecting the transfer value at the beginning ofthe period, as well as the additional value earned in the year.
The Company also makes contributions to funded unapproved retirement benefit schemes (FURBS) in respect of theexecutive directors. The contributions made by the Company, excluding the annual performance related bonus, were:
2005 2004£ £
Mark Abrahams 174,652 170,430Richard Perry 108,229 127,779
PensionsDirectors’ pension entitlementSet out below are details of the pension benefits to which each of the executive directors is entitled.
Accrued Increase in Accrued Transfer Transfer Increase inentitlement accrued entitlement value at value at transfer value31 August entitlement 31 August 31 August 31 August less directors’
2004 over the year 2005 2004 2005 contributions£ £ £ £ £ £
Mark Abrahams 35,900 4,000 39,900 304,200 397,900 93,700Richard Perry 34,000 4,700 38,700 378,200 495,500 109,140
22 Fenner PLC
Board Remuneration Reportcontinued
The directors submit their report and the audited Group accounts for the financial year ended 31 August 2005.
Principal activities and review of businessFenner is a global manufacturer and distributor of conveyor belting and reinforced precision polymer products.
The trading year under review, future prospects and the Group’s research and development activities are covered inthe reports on pages 1 to 11.
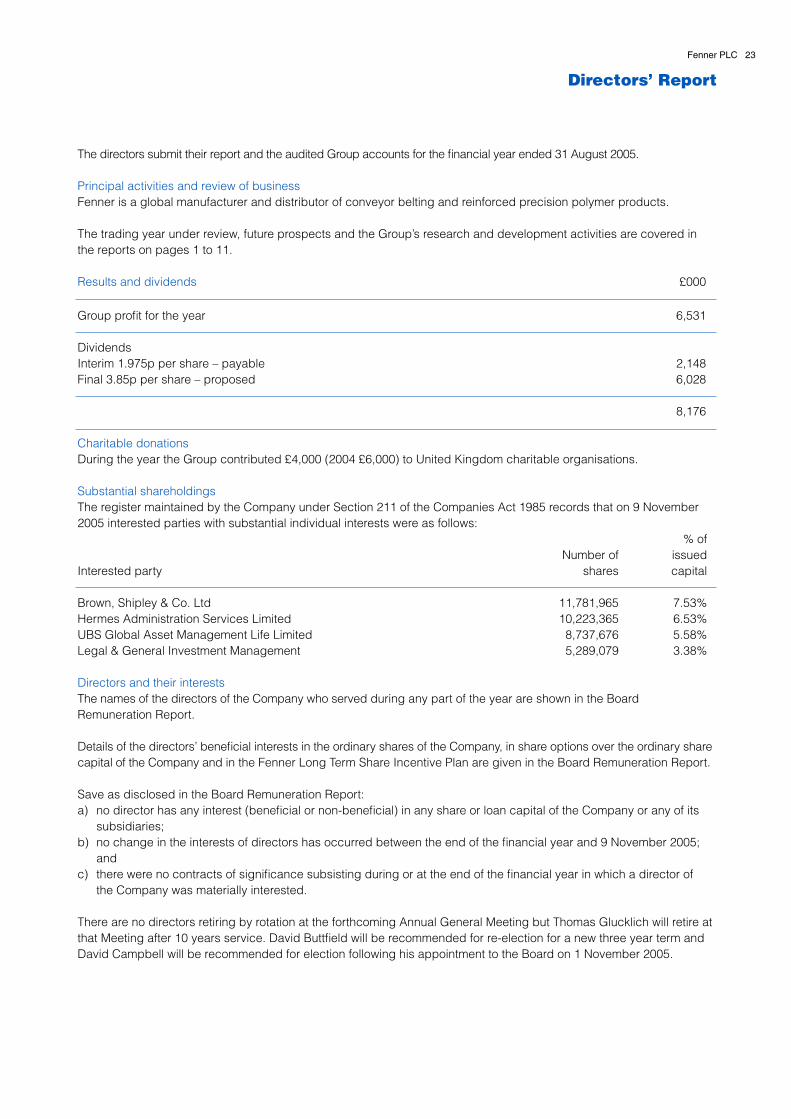
Results and dividends £000
Group profit for the year 6,531
DividendsInterim 1.975p per share – payable 2,148Final 3.85p per share – proposed 6,028
8,176
Charitable donationsDuring the year the Group contributed £4,000 (2004 £6,000) to United Kingdom charitable organisations.
Substantial shareholdingsThe register maintained by the Company under Section 211 of the Companies Act 1985 records that on 9 November2005 interested parties with substantial individual interests were as follows:
% ofNumber of issued
Interested party shares capital
Brown, Shipley & Co. Ltd 11,781,965 7.53%Hermes Administration Services Limited 10,223,365 6.53%UBS Global Asset Management Life Limited 8,737,676 5.58%Legal & General Investment Management 5,289,079 3.38%
Directors and their interestsThe names of the directors of the Company who served during any part of the year are shown in the BoardRemuneration Report.
Details of the directors’ beneficial interests in the ordinary shares of the Company, in share options over the ordinary sharecapital of the Company and in the Fenner Long Term Share Incentive Plan are given in the Board Remuneration Report.
Save as disclosed in the Board Remuneration Report:a) no director has any interest (beneficial or non-beneficial) in any share or loan capital of the Company or any of its
subsidiaries;b) no change in the interests of directors has occurred between the end of the financial year and 9 November 2005;
andc) there were no contracts of significance subsisting during or at the end of the financial year in which a director of
the Company was materially interested.
There are no directors retiring by rotation at the forthcoming Annual General Meeting but Thomas Glucklich will retire atthat Meeting after 10 years service. David Buttfield will be recommended for re-election for a new three year term andDavid Campbell will be recommended for election following his appointment to the Board on 1 November 2005.
Directors’ Report
Fenner PLC 23

Supplier payment policyGiven the international nature of the Group’s operations, the Group does not operate a standard code in respect ofpayments to suppliers. Individual operating businesses are responsible for agreeing the terms and conditions underwhich transactions with their suppliers are conducted, including the terms of payment. It is the Group’s policy thatpayments to suppliers are made in accordance with these terms. The average creditor days for the Group during the yearended 31 August 2005 was 52 days (2004 54 days). The Company does not have any trade creditors.
Employment policyThe Group operates worldwide and its employment policies are designed to meet local conditions and requirements butare established on the basis of the best practices in each country. Wherever the Group operates, it encourages theprovision of equal employment opportunities regardless of sex, race, religion or age.
The Group’s policy is to secure good relations between management and all employees, to promote a betterunderstanding of all the issues, both internal and external, that influence the Group’s business performance and toimprove performance and productivity. Formal and informal meetings are used to consult employees and to keep theminformed about the performance of the Group. The practices of consultation and involvement vary from country tocountry according to local customs, legal considerations and the size of the operation. The regular worldwide issue of aGroup newspaper assists the process of communication, as do briefing meetings, information bulletins and meetingswith employee representatives.
The Group continues to recognise its social and statutory duty to employ disabled persons and does all that ispracticable to meet this responsibility. Full and fair consideration is given to the recruitment, training, careerdevelopment and promotion of disabled persons bearing in mind the aptitude and ability of the individual concerned.
If an employee becomes disabled while employed by the Group, wherever possible, he or she will continue to beemployed in the same job. If this action is not practicable or possible then every effort will be made to find suitablealternative employment. In these circumstances retraining would be made available using Group resources as well asby contact with the local disabilities employment adviser.
Environmental policyFenner PLC recognises and accepts that concern for the environment is an integral and fundamental part of theCompany's corporate business strategy.
The Company actively seeks to reduce its impact on the environment to the lowest practical level by ensuring that alloperations and activities within the Group exemplify best contemporary practice in respect of the environment. Anythreat of pollution from the Group’s activities is identified and either eliminated or controlled effectively.
Independent auditorsA resolution to re-appoint PricewaterhouseCoopers LLP as independent auditors to the Company will be proposed at theAnnual General Meeting.
Annual General MeetingAs special business at the forthcoming Annual General Meeting resolutions will be proposed to renew the directors’authority to allot relevant securities, to disapply the statutory pre-emption rights to a limited extent and to make marketpurchases of Ordinary Shares in the Company subject to defined limits. The proposed resolutions and further detailsregarding these proposals are set out in the Chairman’s explanatory letter accompanying the Notice of the AnnualGeneral Meeting.
Signed on behalf of the Board of DirectorsC I Cooke Chairman9 November 2005
Directors’ Reportcontinued
24 Fenner PLC

Independent Auditors' Report to the members of Fenner PLC
We have audited the financial statements which comprise the Group profit and loss account, the balance sheets,Group cash flow statement, the statement of total recognised gains and losses, and the note of historical cost profitsand losses, the reconciliation of movements in shareholders’ funds and the related notes. We have also audited thedisclosures required by part 3 of Schedule 7A to the Companies Act 1985 contained in the Board Remuneration Report(“the auditable part”).
Respective responsibilities of directors and auditorsThe directors’ responsibilities for preparing the annual report and the financial statements in accordance withapplicable United Kingdom law and accounting standards are set out in the statement of directors' responsibilities. Thedirectors are also responsible for preparing the Board Remuneration Report.
Our responsibility is to audit the financial statements and the auditable part of the Board Remuneration Report inaccordance with relevant legal and regulatory requirements and United Kingdom Auditing Standards issued by theAuditing Practices Board. This report, including the opinion, has been prepared for and only for the Company’smembers as a body in accordance with Section 235 of the Companies Act 1985 and for no other purpose. We do not,in giving this opinion, accept or assume responsibility for any other purpose or to any other person to whom this reportis shown or into whose hands it may come save where expressly agreed by our prior consent in writing.
We report to you our opinion as to whether the financial statements give a true and fair view and whether the financialstatements and the auditable part of the Board Remuneration Report have been properly prepared in accordance withthe Companies Act 1985. We also report to you if, in our opinion, the Directors' Report is not consistent with thefinancial statements, if the Company has not kept proper accounting records, if we have not received all the informationand explanations we require for our audit, or if information specified by law or the Listing Rules regarding directors'remuneration and transactions is not disclosed.
We read the other information contained in the annual report and consider the implications for our report if we becomeaware of any apparent misstatements or material inconsistencies with the financial statements. The other informationcomprises the Directors' Report, the financial highlights, the Chairman's Statement, the Chief Executive Officer'sReview, the Group Finance Director's Review, the Corporate Governance statement and the unaudited part of theBoard Remuneration Report
We review whether the Corporate Governance statement reflects the Company's compliance with the nine provisions ofthe 2003 FRC Combined Code specified for our review by the Listing Rules of the Financial Services Authority, and wereport if it does not. We are not required to consider whether the Board's statements on internal control cover all risksand controls, or to form an opinion on the effectiveness of the Company’s or Group's corporate governance proceduresor its risk and control procedures.
Basis of audit opinionWe conducted our audit in accordance with auditing standards issued by the Auditing Practices Board. An auditincludes examination, on a test basis, of evidence relevant to the amounts and disclosures in the financial statementsand the auditable part of the Board Remuneration Report. It also includes an assessment of the significant estimatesand judgements made by the directors in the preparation of the financial statements, and of whether the accountingpolicies are appropriate to the Company and Group’s circumstances, consistently applied and adequately disclosed.
We planned and performed our audit so as to obtain all the information and explanations which we considerednecessary in order to provide us with sufficient evidence to give reasonable assurance that the financial statementsand the auditable part of the Board Remuneration Report are free from material misstatement, whether caused by fraudor other irregularity or error. In forming our opinion we also evaluated the overall adequacy of the presentation ofinformation in the financial statements.
OpinionIn our opinion:
l the financial statements give a true and fair view of the state of affairs of the Company and the Group at 31 August 2005 and of the profit and cash flows of the Group for the year then ended;
l the financial statements have been properly prepared in accordance with the Companies Act 1985; and
l those parts of the Board Remuneration Report required by Part 3 of the Schedule 7A to the Companies Act 1985 have been properly prepared in accordance with the Companies Act 1985.
PricewaterhouseCoopers LLPChartered Accountants and Registered AuditorsQueen Victoria House, Guildhall Road, Hull, HU1 1HH9 November 2005
Fenner PLC 25

313,012302,193
10,819
21,255(1,904)(3,502)
15,84914,775
1,074
(20)-
15,829(3,761)
(43)
12,025(4,514)
7,511(980)
6,531(8,174)
(1,643)
TurnoverContinuing operations
Acquisitions
Operating profit before goodwill amortisation and exceptional itemsGoodwill amortisation
Exceptional items
Operating profitContinuing operations
Acquisitions
Share of operating loss in associated undertaking
Profit on sale of associated undertaking
Profit on ordinary activities before interestNet interest payable
Share of net interest payable in associated undertaking
Profit on ordinary activities before taxationTaxation on profit on ordinary activities
Profit on ordinary activities after taxationMinority equity interests
Profit for the yearDividends
Retained loss for the year
Earnings per share*Adjusted - before goodwill amortisation, exceptional items and profit on sale of operations
Basic - after goodwill amortisation, exceptional items and profit on sale of operations
Diluted - after goodwill amortisation, exceptional items and profit on sale of operations
*Comparative figures have been restated following a placing and open offer on 20 May 2005 (note 22).
All of the Group’s activities are continuing operations.
The notes on pages 30 to 58 form part of these accounts.
260,595
260,595
-
16,101
(1,149)
(6,214)
8,738
8,738
-
489
695
9,922
(3,458)
(69)
6,395
(3,052)
3,343
(976)
2,367
(6,324)
(3,957)
7.67p
2.19p
2.17p
9.34p
5.28p
5.25p
2
10
5
2,3
6
7
8
21
9
9
9
Note
Group Profit and Loss Accountfor the financial year ended 31 August 2005
26 Fenner PLC
2005£000
2004£000
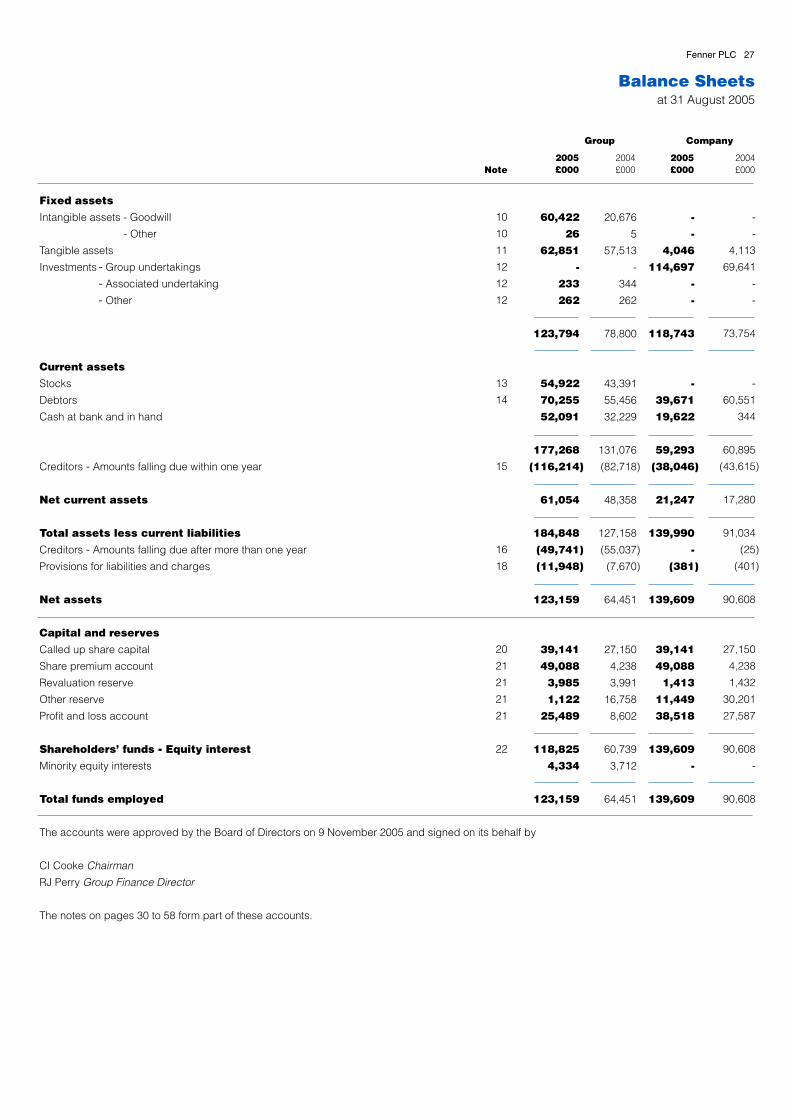
Fixed assets
Intangible assets - Goodwill
- Other
Tangible assets
Investments - Group undertakings
- Associated undertaking
- Other
Current assets
Stocks
Debtors
Cash at bank and in hand
Creditors - Amounts falling due within one year
Net current assets
Total assets less current liabilities
Creditors - Amounts falling due after more than one year
Provisions for liabilities and charges
Net assets
Capital and reserves
Called up share capital
Share premium account
Revaluation reserve
Other reserve
Profit and loss account
Shareholders’ funds - Equity interest
Minority equity interests
Total funds employed
The accounts were approved by the Board of Directors on 9 November 2005 and signed on its behalf by
CI Cooke Chairman
RJ Perry Group Finance Director
The notes on pages 30 to 58 form part of these accounts.
10
10
11
12
12
12
13
14
15
16
18
20
21
21
21
21
22
Note2004£000
2004£000
2005£000
20,676
5
57,513
-
344
262
78,800
43,391
55,456
32,229
131,076
(82,718)
48,358
127,158
(55,037)
(7,670)
64,451
27,150
4,238
3,991
16,758
8,602
60,739
3,712
64,451
60,422
26
62,851
-
233
262
123,794
54,922
70,255
52,091
177,268
(116,214)
61,054
184,848
(49,741)
(11,948)
123,159
39,141
49,088
3,985
1,122
25,489
118,825
4,334
123,159
-
-
4,046
114,697
-
-
118,743
-
39,671
19,622
59,293
(38,046)
21,247
139,990
-
(381)
139,609
39,141
49,088
1,413
11,449
38,518
139,609
-
139,609
2005£000
-
-
4,113
69,641
-
-
73,754
-
60,551
344
60,895
(43,615)
17,280
91,034
(25)
(401)
90,608
27,150
4,238
1,432
30,201
27,587
90,608
-
90,608
Group Company
Balance Sheetsat 31 August 2005
Fenner PLC 27

Net cash inflow from operating activities
Dividends received from associated undertaking
Returns on investments and servicing of finance
Interest received
Interest paid
Interest element of finance lease rental payments
Dividends paid to minority shareholders
Net cash outflow from returns on investments and servicing of finance
Taxation
Capital expenditure and financial investment
Purchase of tangible fixed assets
Purchase of investments and secured loans
Sale of tangible fixed assets
Net cash outflow on capital expenditure and financial investment
Acquisitions and disposals
Purchase of subsidiary undertakings
Sale of subsidiary undertakings
Net proceeds on disposal of associated undertaking and purchase of related subsidiary
Net cash outflow on acquisitions and disposals
Equity dividends paid
Net cash outflow before financing
Financing
Issue of ordinary share capital
Loan repayment from associated undertaking
Capital element of finance lease repayments
Repayment of bank and other borrowings
New bank and other borrowings
Net cash inflow from financing
Increase in cash
The notes on pages 30 to 58 form part of these accounts.
14,191
77
(4,245)
(2,591)
(8,700)
(1,506)
(6,015)
(8,789)
1,689
(7,100)
1,142
(4,874)
(2)
(511)
(7,999)
(744)
43
(2,796)
11
1,279
4,684
68
(11)
(3,968)
916
21,315
-
(3,910)
(5,590)
(7,901)
(44,218)
(6,324)
(46,628)
75,200
28,572
1,142
(4,565)
(10)
(477)
(8,031)
-
130
(44,199)
(19)
-
56,340
70
(106)
(7,436)
26,332
Group Cash Flow Statementfor the financial year ended 31 August 2005
28 Fenner PLC
23
26(b)
24
Note £000 £000£000 £0002005 2004

(7,100)
3,063
(4,037)
9,117
-
-
5,080
(44,496)
(39,416)
28,572
(18,790)
9,782
234
(4,452)
(55)
5,509
(39,416)
(33,907)
64.9%28.5%
6,395
85
6,480
(3,875)
12,025
23
12,048
(1,623)
2,367
1,378
3,745
6,531
1,715
8,246
Increase in cash
Cash inflow from increase in loans and finance leases
Decrease in net debt resulting from cash flows
Effect of foreign exchange rate changes
Loans and finance leases acquired with subsidiaries
New finance leases
Decrease in net debt
Opening net debt
Closing net debt
Gearing (closing net debt / shareholders’ funds)
The notes on pages 30 to 58 form part of these accounts.
Statement of Total Recognised Gains and Lossesfor the financial year ended 31 August 2005
Reconciliation of Net Cash Flow to Movement in Net Debtfor the financial year ended 31 August 2005
Note of Historical Cost Profits and Lossesfor the financial year ended 31 August 2005
Fenner PLC 29
Profit for the year
Currency translation differences on foreign currency net investments
Total recognised gains and losses since last annual report
2005£000
2004£000
Group
Reported profit on ordinary activities before taxation
Difference between a historical cost depreciation charge and the actual
depreciation charge of the year calculated on the revalued amount
Historical cost profit on ordinary activities before taxation
Historical cost retained loss for the year after taxation, minority equity interests and dividends
2005£000
2004£000
Group
2005£000Note
2004£000
Group
24
Notes
1 Accounting policies
Basis of preparation
The accounts have been prepared in accordance with applicable accounting standards in the United Kingdom, the Companies Act 1985 and
under the historical cost convention, as modified by the revaluation of certain fixed assets, and have been applied consistently.
The disclosures required to comply with the transitional arrangements of Financial Reporting Standard (FRS) 17 Retirement Benefits are made in
note 27.
As allowed by Section 230 of the Companies Act 1985, a separate profit and loss account dealing with the results of the parent company has
not been presented.
Basis of consolidation
a) The Group accounts consolidate the accounts of Fenner PLC and its subsidiary undertakings.
b) In the Group balance sheet, investments in associated undertakings are stated at cost plus an appropriate share of post acquisition reserves
attributable to the Group, including the revaluation of land and buildings. An associated undertaking is an undertaking in which the Group has
a participating interest and exercises a significant influence over operating and financial policy and which is neither a subsidiary undertaking
of the parent company nor a joint venture accounted for by the gross equity method.
c) The results of businesses acquired during the year are incorporated from the date on which control passes.
d) The results of businesses sold during the year are incorporated up to the date on which control passes.
Goodwill
Prior to 1 September 1998, goodwill arising on consolidation, representing the excess of the fair value of the consideration over the fair value of
the net assets acquired, was written off directly to reserves. Subsequent to that date, in accordance with FRS10, Goodwill and Intangible
Assets, goodwill is capitalised and amortised through the profit and loss account over its estimated useful economic life.
Where a subsequent disposal occurs any goodwill which has not been amortised through the profit and loss account or which was previously
written off directly to reserves is taken into account in determining the profit or loss on disposal.
Tangible fixed assets
Fixed assets are stated at their cost (purchase price or production cost and any cost directly attributable to bringing the fixed asset into
working condition for its intended use) or at subsequent valuation less any provision for depreciation or diminution in value where required.
In prior years certain of the Group’s and the Company’s freehold and leasehold properties have been revalued by independent qualified
professional valuers on the basis of open market value for their existing use. As permitted by FRS15 Tangible Fixed Assets these valuations
have been frozen.
Freehold land is not depreciated. Depreciation is provided by reference to cost or valuation at rates estimated to write off the relevant assets by
equal instalments over their estimated useful economic lives. The lives most widely applied are:
Freehold buildings 40 years
Leasehold land and buildings Unexpired term of lease
Plant, machinery and equipment 3-10 years
Patents Unexpired life of patent
Properties
Where the Group disposes of properties, the difference between the carrying value and the net proceeds is dealt with through the profit and
loss account and any realised revaluation surplus is transferred from the revaluation reserve to the profit and loss account reserve.
Government grants
Grants in respect of capital expenditure are treated as deferred credits in the balance sheet. An annual transfer is made to the profit and loss
account reflecting the benefit over the useful lives of the assets concerned. Grants in respect of revenue expenditure are credited to the profit and
loss account in the period in which the related expenditure is incurred.
Research and development expenditure
All expenditure on research and development is charged against profits in the year incurred except expenditure of a capital nature which is
included in the balance sheet and depreciated as noted above.
Other investments
Other investments are stated at cost or valuation less provision for any diminution in value.
30 Fenner PLC
Stocks
Stocks and work in progress are valued at the lower of cost, including an addition for overheads where appropriate, and net realisable value.
Turnover
Turnover is recognised when goods are dispatched and represents amounts receivable for goods and services provided in the normal course
of business, net of trade discounts, VAT and other sales related taxes.
Foreign currencies
Transactions denominated in foreign currencies are translated at the rate of exchange on the day the transaction occurs or at the contracted
rate if the transaction is covered by a forward exchange contract. Assets and liabilities denominated in foreign currencies are translated at the
exchange rate ruling at the balance sheet date or if appropriate at the forward contract rate. Exchange differences arising in the accounts of
individual companies are included in the profit and loss account except that, where financial instruments have been used to finance equity
investments in foreign currencies, exchange differences arising on the instruments are dealt with through reserves to the extent that they are
covered by exchange differences arising on the net assets represented by the equity investments.
The accounts of overseas subsidiaries and associated undertakings are translated into sterling on the following bases:
- Assets and liabilities at the rate of exchange at the end of the financial year.
- Profit and loss account items at the average rate of exchange during the financial year.
- Exchange differences arising on the retranslation of opening net assets into sterling are recorded as movements on reserves in the Group
balance sheet.
Financial instruments
The Group uses derivative financial instruments to manage its exposures to fluctuations in interest and foreign currency exchange rates.
Receipts and payments on interest rate instruments are recognised on an accruals basis in the profit and loss account over the life of the
instrument. Changes in the fair value of derivative financial instruments used to manage foreign exchange exposures are dealt with in the profit
and loss account if they relate to trading exposures or deferred until the underlying transaction occurs. Any gain or loss on instruments used to
hedge an exposure on the net investment in overseas territories is dealt with through reserves.
Leased assets
For assets acquired under finance leases the amount representing the outright purchase price of such assets is included in tangible fixed
assets. Depreciation is provided at rates designed to write off the cost in equal annual amounts over the shorter of the estimated useful lives of
the assets (which are the same as those for assets purchased outright) and the period of the leases. Assets acquired under a hire purchase
contract which has the characteristics of a finance lease are depreciated over their estimated useful economic lives.
The capital element of future rentals is treated as a liability and the interest element is charged to the profit and loss account over the period of
the leases in proportion to the balances outstanding.
Operating lease rentals are charged to the profit and loss account when incurred.
Deferred taxation
Deferred tax is recognised in respect of all timing differences that have originated but not reversed at the balance sheet date and is
determined using the average tax rates that are expected to apply in the periods in which the timing differences are expected to reverse.
Timing differences are differences between the Group's taxable profits and its results as stated in the financial statements that arise from the
inclusion of gains and losses in tax assessments in the periods different from those in which they are recognised in the financial statements.
Deferred tax assets are recognised only when it can be regarded as more likely than not that there will be suitable taxable profits from which
the future reversal of the underlying timing differences can be deducted.
Deferred tax is not recognised when fixed assets are revalued unless by the balance sheet date there is a binding agreement to sell the
revalued assets. Deferred tax is measured on a non-discounted basis.
Pensions and other post-retirement benefits
Employees are provided with retirement and death benefits under pension schemes adapted to suit social conditions in the countries where the
Group operates. The schemes are subject to an actuarial review where appropriate.
Throughout the Group, for both defined benefit schemes and defined contribution schemes, contributions are charged to the profit and loss
account so as to spread the cost of pensions over the employees’ working lives with the particular operating company.
The cost of providing other post-retirement benefits, principally private healthcare, is charged to the profit and loss account so as to spread the
cost over the service lives of relevant employees in accordance with the advice of qualified actuaries.
Fenner PLC 31

2 Segmental reporting
2005Turnover by geographical origin
Total sales
Inter-segment sales
Sales to third parties
Operating profit
Operating profit before goodwill amortisation & exceptional items
Goodwill amortisation (note 10)
Exceptional items (note 5)
Operating profit after goodwill amortisation & exceptional items
Net assets
Segment net assets
Associated undertaking
Taxation and dividends payable
Net debt
Total net assets
2004Turnover by geographical origin
Total sales
Inter-segment sales
Sales to third parties
Operating profit
Operating profit before goodwill amortisation & exceptional items
Goodwill amortisation
Exceptional items (note 5)
Operating profit after goodwill amortisation & exceptional items
Net assets
Segment net assets
Associated undertaking
Taxation and dividends payable
Net debt
Total net assets
265,542
(4,947)
260,595
16,101
(1,149)
(6,214)
8,738
110,896
344
(7,373)
(39,416)
64,451
39,237
(307)
38,930
4,083
(135)
(80)
3,868
19,845
26,594
(182)
26,412
4,402
-
-
4,402
7,173
119,413
(1,020)
118,393
5,471
(729)
3,037
7,779
54,624
80,298
(3,438)
76,860
2,145
(285)
(9,171)
(7,311)
29,254
317,138
(4,126)
313,012
21,255
(1,904)
(3,502)
15,849
165,921
233
(9,088)
(33,907)
123,159
50,709
(779)
49,930
6,010
(314)
-
5,696
28,018
30,791
(132)
30,659
4,494
-
-
4,494
8,683
144,053
(1,126)
142,927
10,584
(946)
(444)
9,194
76,013
91,585
(2,089)
89,496
167
(644)
(3,058)
(3,535)
53,207
Group£000
Rest ofWorld£000
Africa£000
NorthAmerica
£000Europe
£000
Notes continued
32 Fenner PLC
It is not possible to analyse net interest payable by geographical segment as funding for the Group is managed centrally.
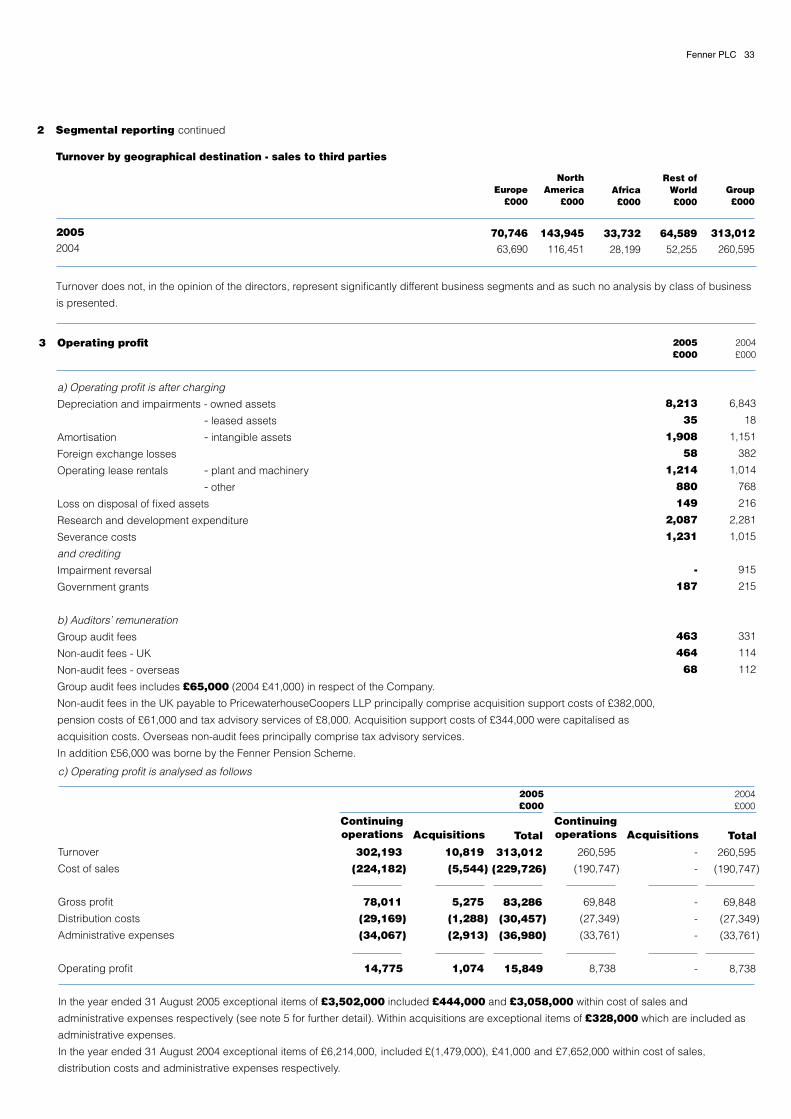
c) Operating profit is analysed as follows
Turnover
Cost of sales
Gross profit
Distribution costs
Administrative expenses
Operating profit
In the year ended 31 August 2005 exceptional items of £3,502,000 included £444,000 and £3,058,000 within cost of sales and
administrative expenses respectively (see note 5 for further detail). Within acquisitions are exceptional items of £328,000 which are included as
administrative expenses.
In the year ended 31 August 2004 exceptional items of £6,214,000, included £(1,479,000), £41,000 and £7,652,000 within cost of sales,
distribution costs and administrative expenses respectively.
10,819
(5,544)
5,275
(1,288)
(2,913)
1,074
260,595
(190,747)
69,848
(27,349)
(33,761)
8,738
Total
313,012
(229,726)
83,286
(30,457)
(36,980)
15,849
Total
260,595
(190,747)
69,848
(27,349)
(33,761)
8,738
-
-
-
-
-
-
302,193
(224,182)
78,011
(29,169)
(34,067)
14,775
2004£000
6,843
18
1,151
382
1,014
768
216
2,281
1,015
915
215
331
114
112
2005£000
8,213
35
1,908
58
1,214
880
149
2,087
1,231
-
187
463
464
68
2005£000
2004£000
3 Operating profit
a) Operating profit is after charging
Depreciation and impairments - owned assets
- leased assets
Amortisation - intangible assets
Foreign exchange losses
Operating lease rentals - plant and machinery
- other
Loss on disposal of fixed assets
Research and development expenditure
Severance costs
and crediting
Impairment reversal
Government grants
b) Auditors’ remuneration
Group audit fees
Non-audit fees - UK
Non-audit fees - overseas
Group audit fees includes £65,000 (2004 £41,000) in respect of the Company.
Non-audit fees in the UK payable to PricewaterhouseCoopers LLP principally comprise acquisition support costs of £382,000,
pension costs of £61,000 and tax advisory services of £8,000. Acquisition support costs of £344,000 were capitalised as
acquisition costs. Overseas non-audit fees principally comprise tax advisory services.
In addition £56,000 was borne by the Fenner Pension Scheme.
Fenner PLC 33
2 Segmental reporting continued
Turnover by geographical destination - sales to third parties
Group£000
313,012260,595
Rest ofWorld£000
64,58952,255
Africa£000
33,73228,199
NorthAmerica
£000
143,945116,451
Europe£000
70,74663,690
20052004
Turnover does not, in the opinion of the directors, represent significantly different business segments and as such no analysis by class of business
is presented.
AcquisitionsContinuingoperationsAcquisitions
Continuingoperations
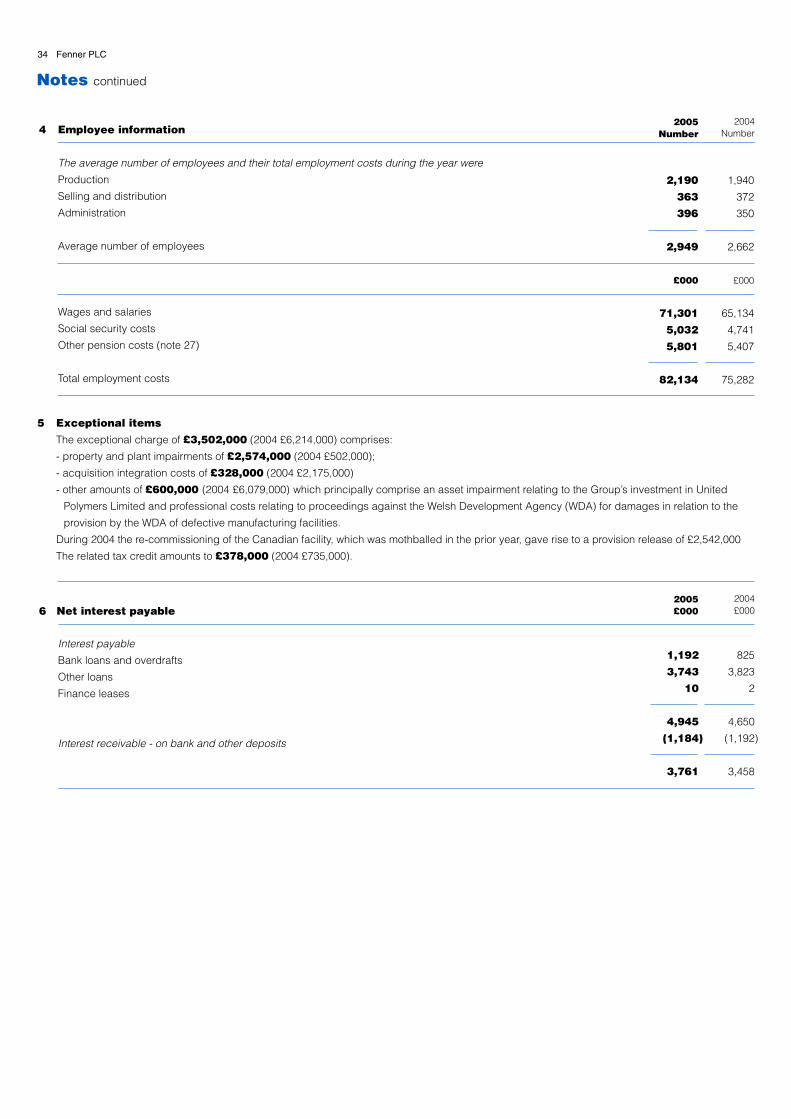
5 Exceptional items
The exceptional charge of £3,502,000 (2004 £6,214,000) comprises:
- property and plant impairments of £2,574,000 (2004 £502,000);
- acquisition integration costs of £328,000 (2004 £2,175,000)
- other amounts of £600,000 (2004 £6,079,000) which principally comprise an asset impairment relating to the Group’s investment in United
Polymers Limited and professional costs relating to proceedings against the Welsh Development Agency (WDA) for damages in relation to the
provision by the WDA of defective manufacturing facilities.
During 2004 the re-commissioning of the Canadian facility, which was mothballed in the prior year, gave rise to a provision release of £2,542,000
The related tax credit amounts to £378,000 (2004 £735,000).
6 Net interest payable
Interest payable
Bank loans and overdrafts
Other loans
Finance leases
Interest receivable - on bank and other deposits
34 Fenner PLC
Notes continued
1,940
372
350
2,662
£000
65,134
4,741
5,407
75,282
2,190
363
396
2,949
£000
71,301
5,032
5,801
82,134
2005Number
2004Number
2005£000
2004£000
4 Employee information
The average number of employees and their total employment costs during the year were
Production
Selling and distribution
Administration
Average number of employees
Wages and salaries
Social security costs
Other pension costs (note 27)
Total employment costs
825
3,823
2
4,650
(1,192)
3,458
1,192
3,743
10
4,945
(1,184)
3,761
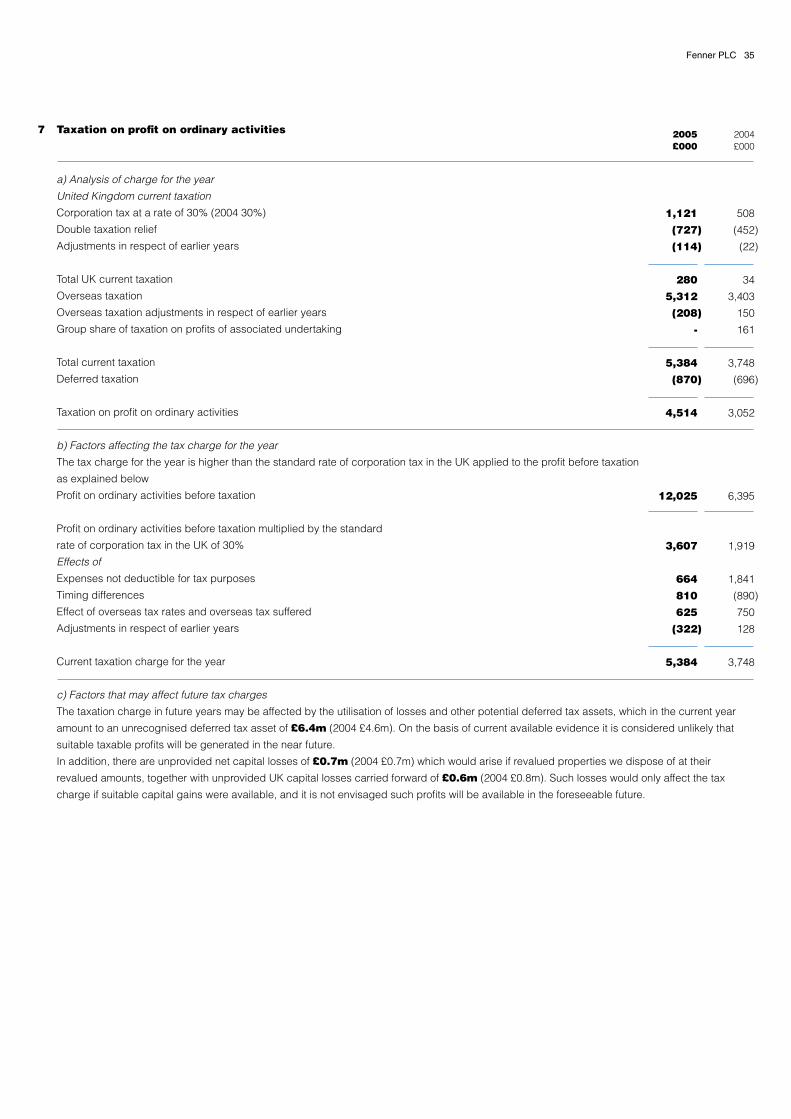
Fenner PLC 35
7 Taxation on profit on ordinary activities
a) Analysis of charge for the year
United Kingdom current taxation
Corporation tax at a rate of 30% (2004 30%)
Double taxation relief
Adjustments in respect of earlier years
Total UK current taxation
Overseas taxation
Overseas taxation adjustments in respect of earlier years
Group share of taxation on profits of associated undertaking
Total current taxation
Deferred taxation
Taxation on profit on ordinary activities
b) Factors affecting the tax charge for the year
The tax charge for the year is higher than the standard rate of corporation tax in the UK applied to the profit before taxation
as explained below
Profit on ordinary activities before taxation
Profit on ordinary activities before taxation multiplied by the standard
rate of corporation tax in the UK of 30%
Effects of
Expenses not deductible for tax purposes
Timing differences
Effect of overseas tax rates and overseas tax suffered
Adjustments in respect of earlier years
Current taxation charge for the year
c) Factors that may affect future tax charges
The taxation charge in future years may be affected by the utilisation of losses and other potential deferred tax assets, which in the current year
amount to an unrecognised deferred tax asset of £6.4m (2004 £4.6m). On the basis of current available evidence it is considered unlikely that
suitable taxable profits will be generated in the near future.
In addition, there are unprovided net capital losses of £0.7m (2004 £0.7m) which would arise if revalued properties we dispose of at their
revalued amounts, together with unprovided UK capital losses carried forward of £0.6m (2004 £0.8m). Such losses would only affect the tax
charge if suitable capital gains were available, and it is not envisaged such profits will be available in the foreseeable future.
508
(452)
(22)
34
3,403
150
161
3,748
(696)
3,052
6,395
1,919
1,841
(890)
750
128
3,748
1,121
(727)
(114)
280
5,312
(208)
-
5,384
(870)
4,514
12,025
3,607
664
810
625
(322)
5,384
2005£000
2004£000

8 Dividends
Ordinary shares
Dividend payable – interim 1.975p (2004 1.975p)
Dividend proposed – final 3.85p (2004 3.85p)
Adjustment to prior year final dividend
Amount due to the Employee Share Ownership Plan Trust
If approved, the final dividend of 3.85p per share (2004 3.85p) will be paid on 16 January 2006 to shareholders on the register on 16 December
2005. UK income tax at the lower rate of 10% is deemed to have been paid in respect of these dividends but will not in most cases be recoverable
by shareholders.
2004£000
2,145
4,181
6
6,332
(8)
6,324
2005£000
2,148
6,028
6
8,182
(8)
8,174
Notes continued
36 Fenner PLC
Earnings
Profit for the year
Goodwill amortisation, exceptional items and profit on sale of operations
Tax attributable to exceptional items and profit on sale of operations
Earnings for the year before goodwill amortisation, exceptional items and profit on sale of operations
Weighted average number of ordinary shares in issue during the year*
Weighted average number of shares in issue
Weighted average number of shares held by the Employee Share Ownership Plan Trust
Weighted average number of shares in issue - basic
Weighted average effect of share options and contingent long term incentive plan shares
Weighted average number of shares in issue - diluted
Earnings per share*
Basic - after goodwill amortisation, exceptional items and profit on sale of operations
Goodwill amortisation, exceptional items and profit on sale of operations
Tax attributable to exceptional items and profit on sale of operations
Adjusted - before goodwill amortisation, exceptional items and profit on sale of operations
Diluted earnings per share after goodwill amortisation, exceptional items and profit on sale of operations amount to 5.25p (2004 2.17p).
Diluted earnings per share before goodwill amortisation, exceptional items and profit on sale of operations amount to 9.28p (2004 7.60p).
*Comparative figures have been restated following a placing and open offer on 20 May 2005 (note 22).
2,367
6,668
(735)
8,300
Number
108,348,584
(134,684)
108,213,900
945,675
109,159,575
Pence
2.19
6.16
(0.68)
7.67
6,531
5,406
(378)
11,559
Number
123,908,805
(133,769)
123,775,036
735,681
124,510,717
Pence
5.28
4.37
(0.31)
9.34
2004£000
2005£000
9 Earnings per share
In view of the significance of the exceptional items, goodwill amortisation and profit on sale of operations, in the current and prior years, the
directors consider it appropriate to disclose earnings per share calculated both before and after these items.

10 Intangible fixed assets
GROUP
Cost
1 September 2004
Exchange adjustments
Additions
Subsidiaries acquired
31 August 2005
Accumulated amortisation
1 September 2004
Exchange adjustments
Charge for year
31 August 2005
Net book value
31 August 2005
31 August 2004
Goodwill is amortised over its useful economic life of up to 20 years.
COMPANY
The Company has no intangible assets.
Total£000
23,529
5
41,652
22
65,208
2,848
4
1,908
4,760
60,448
20,681
Other£000
194
-
3
22
219
189
-
4
193
26
5
Goodwill£000
23,335
5
41,649
-
64,989
2,659
4
1,904
4,567
60,422
20,676
Fenner PLC 37

11 Tangible fixed assets
GROUP
Cost or valuation
1 September 2004
Exchange adjustments
Additions
Subsidiaries acquired
Disposals
Reclassifications
31 August 2005
Accumulated depreciation
1 September 2004
Exchange adjustments
Charge for year
Reclassifications
Disposals
31 August 2005
Net book value
31 August 2005
31 August 2004
Cost or valuation comprises
Cost
Valuation - 1997
- 1998
- 1999
Freehold land and buildings includes land at cost or valuation of £6,534,000 (2004 £6,444,000), which is not subject to depreciation.
The net book value of tangible fixed assets includes an amount of £618,000 (2004 £15,000) in respect of plant, machinery and equipment held
under finance leases.
Total£000
130,571
1,885
8,235
4,703
(849)
-
144,545
73,058
957
8,248
-
(569)
81,694
62,851
57,513
134,593
2,160
2,697
5,095
144,545
Plantmachinery &
equipment£000
100,452
1,500
7,652
3,608
(829)
(590)
111,793
66,873
884
6,768
(17)
(565)
73,943
37,850
33,579
111,793
-
-
-
111,793
Leasehold land &
buildings£000
621
16
463
249
-
-
1,349
93
4
15
-
-
112
1,237
528
1,349
-
-
-
1,349
Freeholdland &
buildings£000
29,498
369
120
846
(20)
590
31,403
6,092
69
1,465
17
(4)
7,639
23,764
23,406
21,451
2,160
2,697
5,095
31,403
Notes continued
38 Fenner PLC
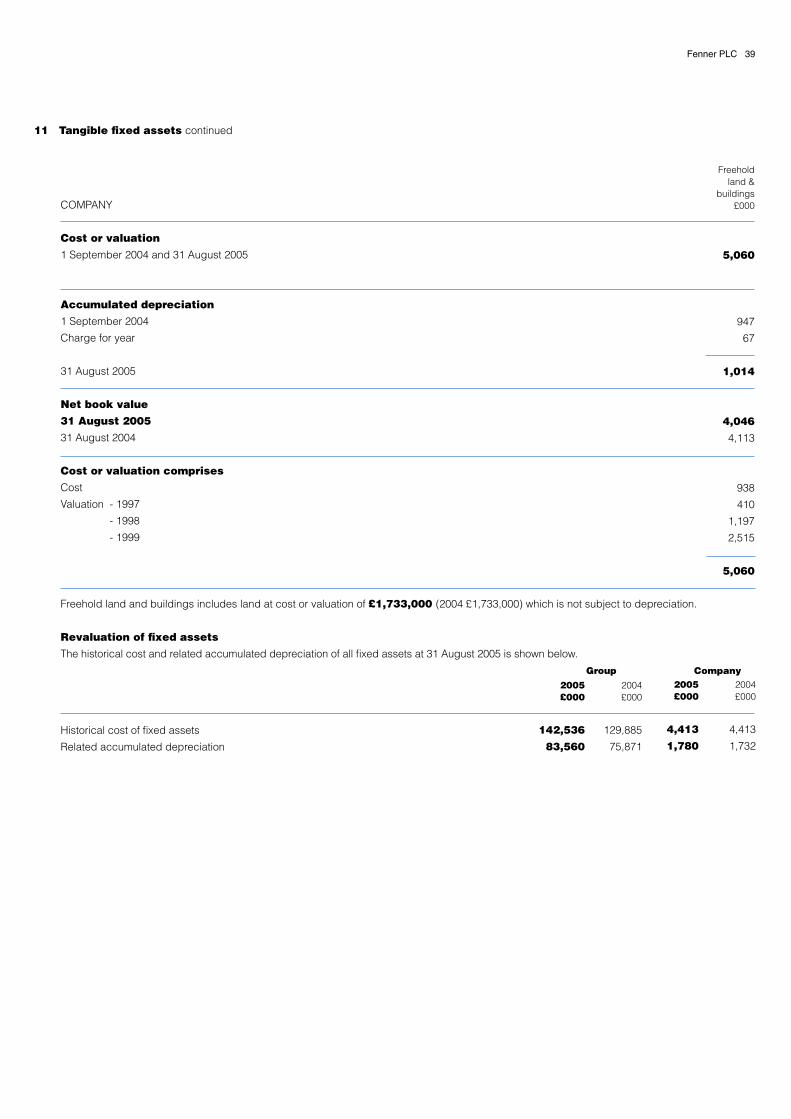
11 Tangible fixed assets continued
COMPANY
Cost or valuation
1 September 2004 and 31 August 2005
Accumulated depreciation
1 September 2004
Charge for year
31 August 2005
Net book value
31 August 2005
31 August 2004
Cost or valuation comprises
Cost
Valuation - 1997
- 1998
- 1999
Freehold land and buildings includes land at cost or valuation of £1,733,000 (2004 £1,733,000) which is not subject to depreciation.
Revaluation of fixed assets
The historical cost and related accumulated depreciation of all fixed assets at 31 August 2005 is shown below.
Historical cost of fixed assets
Related accumulated depreciation
2004£000
129,885
75,871
Freeholdland &
buildings£000
5,060
947
67
1,014
4,046
4,113
938
410
1,197
2,515
5,060
Group Company2005£000
4,413
1,780
2004£000
4,413
1,732
2005£000
142,536
83,560
Fenner PLC 39

12 Fixed asset investments
GROUP
Cost or valuation
1 September
Exchange adjustments
Share of retained loss
31 August 2005
Goodwill
1 September 2004
Amortisation
31 August 2005
Loans
1 September 2004
Movements
31 August 2005
Net book value
31 August 2005
31 August 2004
Notes continued
Other£000
262
-
-
262
-
-
-
-
-
-
262
262
Associate£000
46
21
(49)
18
119
(14)
105
179
(69)
110
233
344
Total£000
308
21
(49)
280
119
(14)
105
179
(69)
110
495
606
Details of interests in other investments are set out in note 31.
Company investments in Group undertakings of £114,697,000 (2004 £69,641,000) represent the value of shares in subsidiary undertakings (see
note 31).
40 Fenner PLC
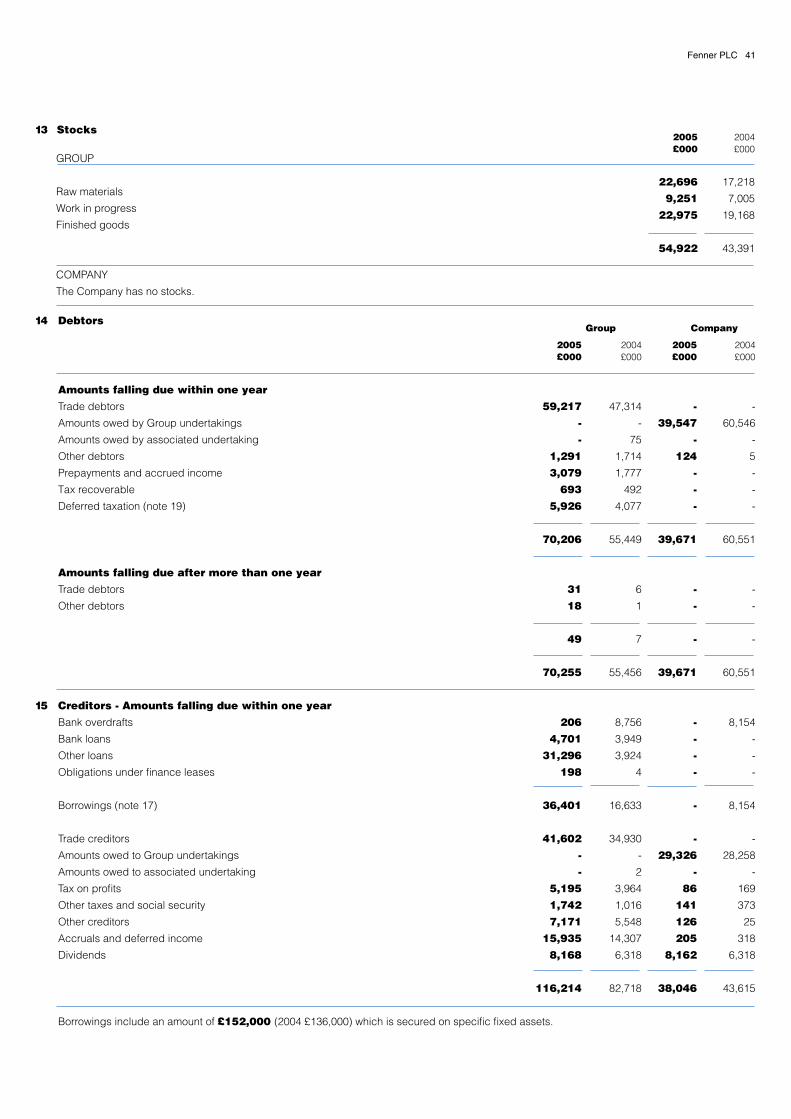
14 Debtors
Amounts falling due within one year
Trade debtors
Amounts owed by Group undertakings
Amounts owed by associated undertaking
Other debtors
Prepayments and accrued income
Tax recoverable
Deferred taxation (note 19)
Amounts falling due after more than one year
Trade debtors
Other debtors
15 Creditors - Amounts falling due within one year
Bank overdrafts
Bank loans
Other loans
Obligations under finance leases
Borrowings (note 17)
Trade creditors
Amounts owed to Group undertakings
Amounts owed to associated undertaking
Tax on profits
Other taxes and social security
Other creditors
Accruals and deferred income
Dividends
Borrowings include an amount of £152,000 (2004 £136,000) which is secured on specific fixed assets.
2004£000
-
60,546
-
5
-
-
-
60,551
-
-
-
60,551
8,154
-
-
-
8,154
-
28,258
-
169
373
25
318
6,318
43,615
2005£000
-
39,547
-
124
-
-
-
39,671
-
-
-
39,671
-
-
-
-
-
-
29,326
-
86
141
126
205
8,162
38,046
2004£000
47,314
-
75
1,714
1,777
492
4,077
55,449
6
1
7
55,456
8,756
3,949
3,924
4
16,633
34,930
-
2
3,964
1,016
5,548
14,307
6,318
82,718
2005£000
59,217
-
-
1,291
3,079
693
5,926
70,206
31
18
49
70,255
206
4,701
31,296
198
36,401
41,602
-
-
5,195
1,742
7,171
15,935
8,168
116,214
Group Company
13 Stocks
GROUP
Raw materials
Work in progress
Finished goods
COMPANY
The Company has no stocks.
2004£000
17,218
7,005
19,168
43,391
2005£000
22,696
9,251
22,975
54,922
Fenner PLC 41

Notes continued
16 Creditors - Amounts falling due after more than one year
Other loans
Long and medium term bank loans
Obligations under finance leases
Borrowings (note 17)
Other creditors
Other loans include amounts due after more than five years repayable wholly or partly
by instalments
Other loans principally comprise US dollar private placements, the terms of which are disclosed in note 17.
Other loans amounting to £828,000 (2004 £719,000) are secured on specific fixed assets.
17 Financial assets and liabilities
The Treasury Policy section in the Group Finance Director’s Review on page 11 gives details of the Group’s policies in respect of foreign exchange
and interest rate risk management and the related use of financial instruments. The numerical disclosures in this note deal with financial assets and
liabilities as defined in FRS13, Derivatives and Other Financial Instruments: Disclosures. As permitted by FRS13, short term debtors and creditors
have been excluded from the disclosures, other than the currency risk disclosures.
Analysis of net financial assets and liabilities
Borrowings falling due within one year (note 15)
Borrowings falling due after more than one year (note 16)
Total borrowings
Cash at bank and in hand
Net debt
Other financial assets
Other financial liabilities
Net financial liabilities
Maturity of financial liabilities
Within one year
Between one and two years
Between two and five years
In more than five years
Total borrowings and other financial liabilities
The Group had undrawn committed borrowing facilities at 31 August 2005 of £37.0m (2004 nil).
2005£000
36,401
49,597
85,998
(52,091)
33,907
(311)
144
33,740
36,401
4,360
37,654
7,727
86,142
2004£000
16,633
55,012
71,645
(32,229)
39,416
(270)
25
39,171
16,633
31,726
11,772
11,539
71,670
2005£000
-
-
-
-
-
-
-
2005£000
23,310
26,034
253
49,597
144
49,741
7,727
2004£000
-
-
-
-
25
25
-
2004£000
55,012
-
-
55,012
25
55,037
11,539
Group Company
42 Fenner PLC

17 Financial assets and liabilities continued
Currency and interest rate analysis of financial assets and liabilities
31 August 2005
Financial liabilities
Sterling
US dollar
Other currencies
Total borrowings and other financial liabilities
Financial assets
Sterling
US dollar
Euro
Australian dollars
Other currencies
Total financial assets
Net financial liabilities
46
32,700
11,787
44,533
23,788
14,900
1,828
6,531
5,044
52,091
(7,558)
46
73,104
12,992
86,142
24,099
14,900
1,828
6,531
5,044
52,402
33,740
31 August 2004
Financial liabilities
Sterling
US dollar
Other currencies
Total borrowings and other financial liabilities
Financial assets
Sterling
US dollar
Euro
Other currencies
Total financial assets
Net financial liabilities
Weightedaverage time
for which rate is fixed
Years
Weightedaverage
fixedinterest
rate %
Fixedrate
£000
Floatingrate
£000
NonInterestBearing
£000Total£000
3.397.1%
2.637.2%
-
44,192
-
44,192
-
-
-
-
-
44,192
-
23,042
4,411
27,453
12,824
8,690
2,046
8,669
32,229
(4,776)
25
-
-
25
262
-
-
8
270
(245)
-
-
144
144
311
-
-
-
-
311
(167)
-
40,404
1,061
41,465
-
-
-
-
-
-
41,465
25
67,234
4,411
71,670
13,086
8,690
2,046
8,677
32,499
39,171
Fenner PLC 43

Notes continued
44 Fenner PLC
Fair values of financial assets and liabilities
Primary financial instruments held or issued to finance the Group’s operations
Cash at bank and in hand
Other financial assets - equity investments
Other financial assets - trade and other debtors
Other financial liabilities
Borrowings due within one year
Borrowings due after more than one year
Derivative financial instruments held to manage interest rate or currency profiles
Foreign currency forward contracts and options
Interest rate swap
Fair value method and assumptions
Cash at bank and in hand, trade and other debtors,
and other financial liabilities Approximates to book value in view of the short maturity of these assets or liabilities.
Equity investments Approximates to book value.
Floating rate borrowings Approximates to book value where rates are reset to market rates at intervals of less
than one year.
Fixed rate borrowings Represents the value of replacing the existing fixed rate liabilities at the balance sheet
date with borrowings with similar terms to the remaining life of the loans.
Forward foreign currency contracts Based on the contracts being terminated at the balance sheet date at spot exchange
rates.
Interest rate swap and currency options Market value of comparable instruments at the balance sheet date.
17 Financial assets and liabilities continued
The table above takes into account any derivatives used to hedge financial assets and liabilities.
Financial assets of £262,000 (2004 £262,000) represent equity investments and £49,000 (2004 £8,000) trade and other debtors and as
such are not interest bearing. Sterling financial liabilities of £144,000 (2004 £25,000) represent other creditors falling due after more than
one year and are non interest bearing. The fixed rate debt relates to two US dollar private placements. The first is $50,000,000 of Senior
Notes which bear interest at 6.6% per annum and is repayable on 1 March 2006. The second relates to $47,727,272 (2004 $54,545,454)
of Senior Notes which bear interest at 7.29% per annum. $6,818,182 is repayable on June 1 each year until 2012. Interest on $25,000,000 of
this debt was swapped to a floating rate liability.
The interest rate on floating rate assets and liabilities is principally linked to either the local currency base rate or LIBOR.
Gains and losses on hedges
The Group enters into forward foreign exchange currency contracts to reduce the currency exposures that arise on sales and purchases
denominated in foreign currencies. It also enters into interest rate swaps to manage exposures to changes in interest rates. Changes in the
fair value of instruments used as hedges are not recognised in the financial statements until the hedged position matures. An analysis of
these unrecognised gains and losses is as follows
Unrecognised gains and losses on hedges at 1 September 2004
Gains and losses arising in previous years which were recognised in 2005
Gains and losses arising before 1 September 2004 which were not recognised in 2005
Gains and losses arising in 2005 which were not recognised in 2005
Unrecognised gains and losses on hedges at 31 August 2005
Of which: Gains and losses expected to be recognised in the year to 31 August 2006
Gains and losses expected to be recognised in the year to 31 August 2007 or later
Net£000
646
(413)
233
(216)
17
34
(17)
Losses£000
(67)
67
-
(146)
(146)
(129)
(17)
Gains£000
713
(480)
233
(70)
163
163
-
Fairvalue£000
32,229
262
8
(25)
(16,717)
(59,032)
(52)
698
Fairvalue£000
52,091
262
49
(144)
(36,610)
(51,388)
(131)
148
Bookvalue£000
32,229
262
8
(25)
(16,633)
(55,012)
-
-
Bookvalue£000
52,091
262
49
(144)
(36,401)
(49,597)
-
-
31 August 2005 31 August 2004

18 Provisions for liabilities and charges
GROUP
1 September 2004
Exchange adjustments
Profit and loss account - created
Profit and loss account - released
Utilised
New subsidiaries - Acquisitions
Other balance sheet movements
31 August 2005
Provisions for liabilities and charges represent the best estimate of obligations at the balance sheet date. The majority, with the exception of
the amount relating to Pensions and similar obligations, are expected to be utilised within 10 years.
COMPANY
1 September 2004
Profit and loss account - released
31 August 2005
Total£000
7,670
70
2,950
(175)
(1,407)
2,887
(47)
11,948
Property andenvironmental
costs£000
2,785
3
1,331
(26)
-
-
-
4,093
Total£000
401
(20)
381
Restructuringcosts£000
574
30
1,474
(84)
(1,190)
-
-
804
Pensionsand similarobligations
£000
2,651
23
145
-
(217)
2,105
-
4,707
Deferredtaxation
£000
1,660
14
-
(65)
-
782
(47)
2,344
Deferredtaxation
£000
401
(20)
381
17 Financial assets and liabilities continued
Currency exposures
The information below represents the Group’s currency exposures at 31 August 2005 and comprises the net monetary assets or liabilities that
are not denominated in the functional currency of the operating unit involved, other than borrowings treated as hedges of net investments in
overseas operations. These exposures give rise to net currency gains and losses recognised in the profit and loss account. The amounts
below take into account the effect of any hedging instruments used to manage the exposures. Non-monetary assets and liabilities are
excluded.
Functional currency of operating unit
31 August 2005
Sterling
US dollar
Other
31 August 2004
Sterling
US dollar
Other
Total£000
683
175
(2,992)
(2,134)
Other£000
291
155
(9)
437
Euro£000
522
2
(73)
451
US Dollar£000
(130)
-
(3,277)
(3,407)
Sterling£000
-
18
367
385
1,372
(348)
(1,540)
(516)
580
(353)
(27)
200
(73)
5
-
(68)
865
-
(1,918)
(1,053)
-
-
405
405
Net foreign currency monetary assets/(liabilities)
Fenner PLC 45
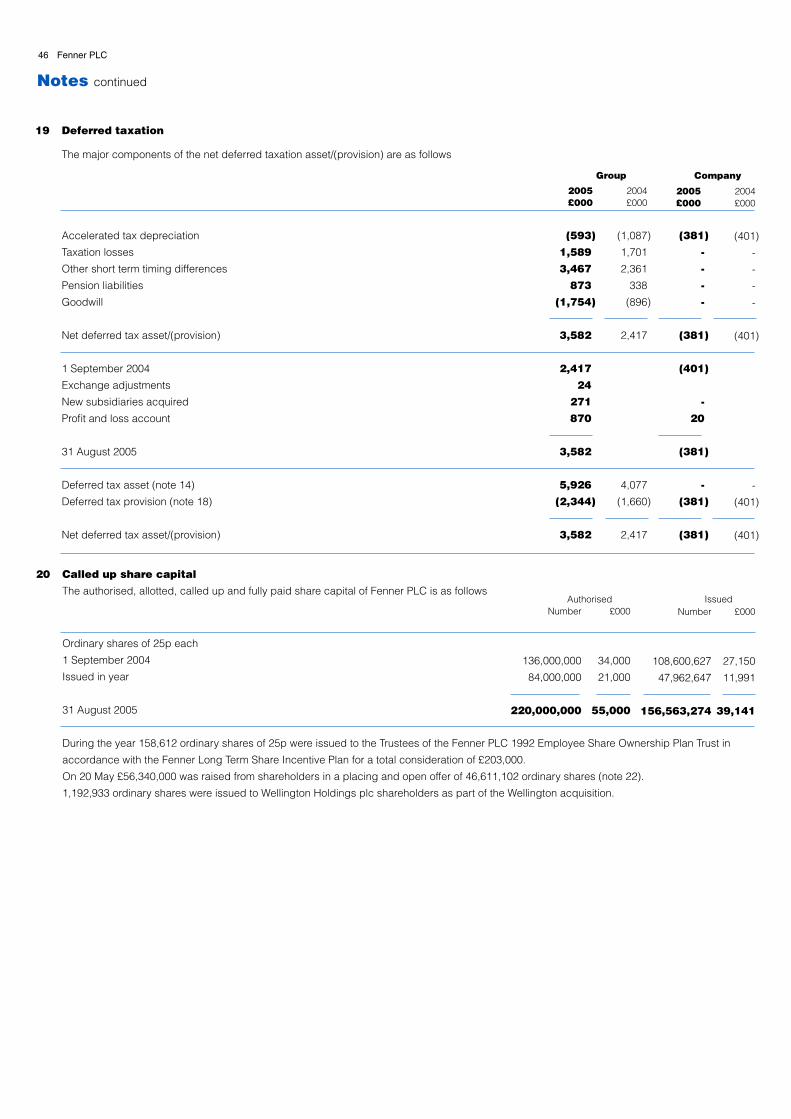
(593)
1,589
3,467
873
(1,754)
3,582
2,417
24
271
870
3,582
5,926
(2,344)
3,582
19 Deferred taxation
The major components of the net deferred taxation asset/(provision) are as follows
Accelerated tax depreciation
Taxation losses
Other short term timing differences
Pension liabilities
Goodwill
Net deferred tax asset/(provision)
1 September 2004
Exchange adjustments
New subsidiaries acquired
Profit and loss account
31 August 2005
Deferred tax asset (note 14)
Deferred tax provision (note 18)
Net deferred tax asset/(provision)
2004£000
(1,087)
1,701
2,361
338
(896)
2,417
4,077
(1,660)
2,417
(381)
-
-
-
-
(381)
(401)
-
20
(381)
-
(381)
(381)
20 Called up share capital
The authorised, allotted, called up and fully paid share capital of Fenner PLC is as follows
Ordinary shares of 25p each
1 September 2004
Issued in year
31 August 2005
During the year 158,612 ordinary shares of 25p were issued to the Trustees of the Fenner PLC 1992 Employee Share Ownership Plan Trust in
accordance with the Fenner Long Term Share Incentive Plan for a total consideration of £203,000.
On 20 May £56,340,000 was raised from shareholders in a placing and open offer of 46,611,102 ordinary shares (note 22).
1,192,933 ordinary shares were issued to Wellington Holdings plc shareholders as part of the Wellington acquisition.
Number
108,600,627
47,962,647
156,563,274
Authorised£000
34,000
21,000
55,000
Notes continued
46 Fenner PLC
£000
27,150
11,991
39,141
Number
136,000,000
84,000,000
220,000,000
2004£000
(401)
-
-
-
-
(401)
-
(401)
(401)
2005£000
2005£000
Group Company
Issued

20 Called up share capital continued
Options over ordinary shares of 25p each
The following share options were outstanding at 31 August 2005
The Fenner PLC 1996 Executive Share Option Scheme
i) Exercisable between 1999 and 2006
ii) Exercisable between 2001 and 2008
iii) Exercisable between 2001 and 2008
iv) Exercisable between 2002 and 2009
v) Exercisable between 2004 and 2011
vi) Exercisable between 2005 and 2012
vii) Exercisable between 2006 and 2013
viii)Exercisable between 2007 and 2014
In addition the following provisional allocations of ordinary shares have been made through the Fenner Long Term Share Incentive Plan
Date provisionally allocated
6 November 2002
5 November 2003
10 November 2004
Three years after the provisional allocation, at the discretion of the Trustees of the Fenner PLC 1992 Employee Share Ownership Plan Trust,
some or all of these shares may be awarded to the employees concerned if performance targets are met by the Company.
The number and price of share options outstanding under the Fenner PLC 1996 Executive Share Option Scheme and the provisional
allocation of ordinary shares made through the Fenner Long Term Share Incentive Plan have been adjusted following the Share Placing and
Open Offer.
21 Reserves
GROUP
1 September 2004
Exchange adjustments (includes tax on exchange in reserves)
Share capital issued
UITF17 share award
UITF17 share award accrual
Retained loss for the year
Transfers
31 August 2005
At 31 August 2005 cumulative goodwill written off directly to reserves prior to 1 September 1998 on the acquisition of subsidiary undertakings
still held by the Group amounted to £40,877,000 (2004 £40,877,000).
Exchange gains arising on foreign currency borrowings used to hedge equity investments in foreign currencies amounted to £391,000
(2004 £288,000) and have been added to reserves.
Subsequent to the placing and open offer on 20 May 2005, £16,758,000 has been transferred from the Other reserve to the Profit and Loss
reserve on the basis that this amount is now distributable.
Total£000
33,589
1,715
45,972
(203)
254
(1,643)
-
79,684
Profit andloss
£000
8,602
1,702
-
(203)
254
(1,643)
16,777
25,489
Other£000
16,758
-
1,122
-
-
-
(16,758)
1,122
Revaluation£000
3,991
13
-
-
-
-
(19)
3,985
Sharepremium
£000
4,238
-
44,850
-
-
-
-
49,088
Option price
143.10p
190.46p
99.80p
89.18p
100.95p
87.23p
83.30p
123.49p
Number of shares
858,850
920,094
626,050
Number of shares
211,708
127,132
306,089
81,623
45,913
204,060
61,218
158,146
Fenner PLC 47
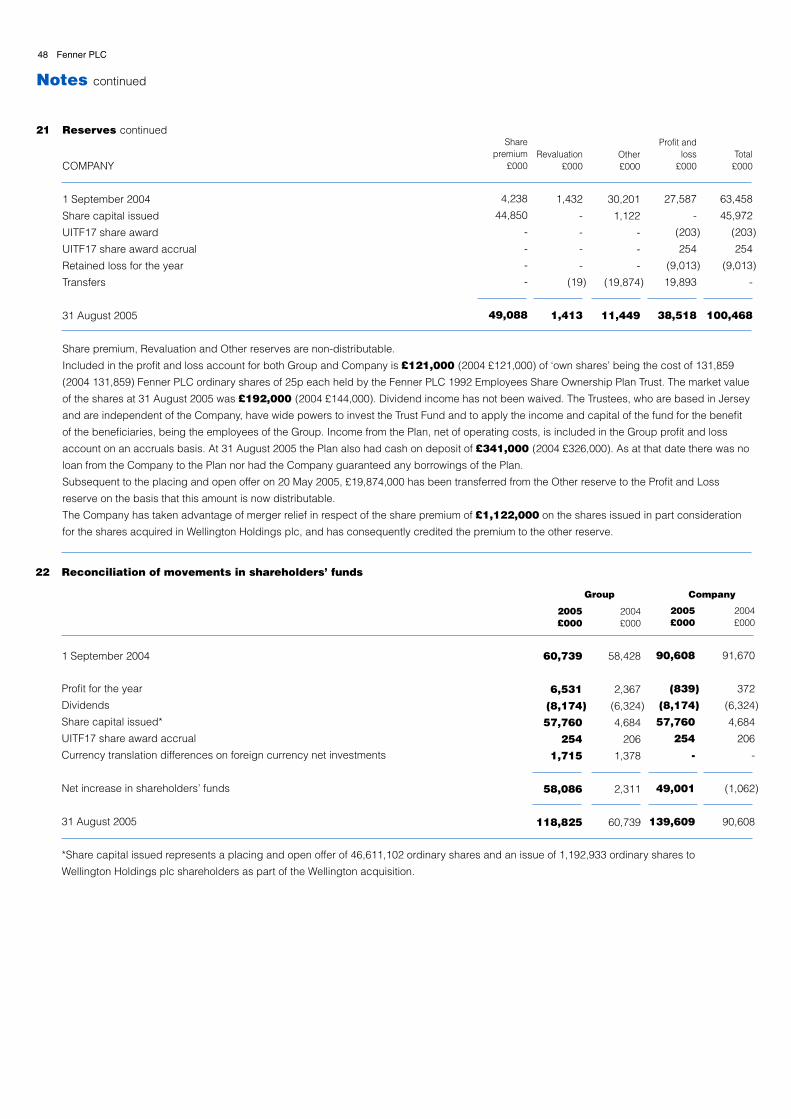
Notes continued
48 Fenner PLC
22 Reconciliation of movements in shareholders’ funds
1 September 2004
Profit for the year
Dividends
Share capital issued*
UITF17 share award accrual
Currency translation differences on foreign currency net investments
Net increase in shareholders’ funds
31 August 2005
*Share capital issued represents a placing and open offer of 46,611,102 ordinary shares and an issue of 1,192,933 ordinary shares to
Wellington Holdings plc shareholders as part of the Wellington acquisition.
2005£000
90,608
(839)
(8,174)
57,760
254
-
49,001
139,609
2004£000
91,670
372
(6,324)
4,684
206
-
(1,062)
90,608
2005£000
60,739
6,531
(8,174)
57,760
254
1,715
58,086
118,825
2004£000
58,428
2,367
(6,324)
4,684
206
1,378
2,311
60,739
Group Company
21 Reserves continued
COMPANY
1 September 2004
Share capital issued
UITF17 share award
UITF17 share award accrual
Retained loss for the year
Transfers
31 August 2005
Share premium, Revaluation and Other reserves are non-distributable.
Included in the profit and loss account for both Group and Company is £121,000 (2004 £121,000) of ‘own shares’ being the cost of 131,859
(2004 131,859) Fenner PLC ordinary shares of 25p each held by the Fenner PLC 1992 Employees Share Ownership Plan Trust. The market value
of the shares at 31 August 2005 was £192,000 (2004 £144,000). Dividend income has not been waived. The Trustees, who are based in Jersey
and are independent of the Company, have wide powers to invest the Trust Fund and to apply the income and capital of the fund for the benefit
of the beneficiaries, being the employees of the Group. Income from the Plan, net of operating costs, is included in the Group profit and loss
account on an accruals basis. At 31 August 2005 the Plan also had cash on deposit of £341,000 (2004 £326,000). As at that date there was no
loan from the Company to the Plan nor had the Company guaranteed any borrowings of the Plan.
Subsequent to the placing and open offer on 20 May 2005, £19,874,000 has been transferred from the Other reserve to the Profit and Loss
reserve on the basis that this amount is now distributable.
The Company has taken advantage of merger relief in respect of the share premium of £1,122,000 on the shares issued in part consideration
for the shares acquired in Wellington Holdings plc, and has consequently credited the premium to the other reserve.
Total£000
63,458
45,972
(203)
254
(9,013)
-
100,468
Profit andloss
£000
27,587
-
(203)
254
(9,013)
19,893
38,518
Other£000
30,201
1,122
-
-
-
(19,874)
11,449
Revaluation£000
1,432
-
-
-
-
(19)
1,413
Sharepremium
£000
4,238
44,850
-
-
-
-
49,088

24 Analysis of changes in net debt
Cash at bank and in hand
Bank overdrafts
Bank loans
Other loans
Obligations under finance leases
31 August2005£000
52,091
(206)
51,885
(30,735)
(54,606)
(451)
(33,907)
1 September2004£000
32,229
(8,756)
23,473
(3,949)
(58,936)
(4)
(39,416)
Acquisitions£000
-
-
-
(3,965)
-
(487)
(4,452)
Non cash£000
-
-
-
-
-
(55)
(55)
Exchangemovements
£000
(179)
19
(160)
(108)
513
(11)
234
25 Contingent assets and liabilities
The Group has disposed of certain businesses in prior years, which included obligations under certain property leases and grants. Should the
purchasers of the businesses default on these commitments, the future obligation could revert to the Group.
In the normal course of business the Group has given guarantees and counter indemnities in respect of commercial transactions and has entered
into forward contracts for the sale and purchase of foreign currencies by reference to its forecast requirements.
Proceedings have continued against the Welsh Development Agency (“WDA”), claiming substantial damages in relation to the provision by the
WDA of defective manufacturing facilities. The proceedings are now the subject of litigation.
The Group is involved as defendant in a number of potential and actual litigation cases in connection with its business, primarily in North
America. The directors believe that the likelihood of a material liability arising from these cases is remote.
In early October 2004, our conveyor belt operations in Charlotte and Atlanta received notification from the Anti Trust Division of the US
Department of Justice of their intention to enquire into possible anti trust violations by Fenner. Every co-operation is being given in order to
clarify and expedite the process.
The Company has guaranteed the borrowings of certain subsidiary undertakings which at 31 August 2005 amounted to £89,229,000
(2004 £71,641,000).
Cashflows£000
20,041
8,531
28,572
(22,713)
3,817
106
9,782
23 Reconciliation of operating profit to net cash inflow from operating activities
Operating profit
Non cash items
Depreciation and amortisation
Others including the effect of foreign exchange rate changes
Working capital movements
Stocks
Debtors
Creditors
Provisions
Net cash inflow from operating activities
2004£000
8,738
7,097
1,040
(119)
(1,898)
1,885
(2,552)
14,191
2005£000
15,849
10,156
278
(6,356)
(3,353)
3,259
1,482
21,315
Fenner PLC 49

50 Fenner PLC
Notes continued
26 Acquisitions
a) Acquisition of Wellington Holdings plc
Wellington Holdings plc was acquired during the year through the acquisition of its entire share capital for a total cash consideration of
£44,312,000 together with shares issued valued at £1,420,000. The acquisition was completed on 20 May 2005. The total provisional
adjustments required to the book values of the assets and liabilities of the operations acquired in order to present the net assets of the
companies at a fair value in accordance with Group accounting bases were £3,469,000, details of which are set out below together with the
amount of goodwill arising. This purchase has been accounted for as an acquisition.
The acquisition had the following effect on the Group’s cash flow in the year
Net cash inflow from operating activities
Purchase of tangible fixed assets
Net cash inflow
From the date of acquisition to 31 August 2005 the acquired operations contributed £10,819,000 to turnover and £1,074,000 to operating profit.
The consolidated results of Wellington in the period before acquisition in accordance with UK GAAP were as follows
Turnover
Operating profit
Interest
Profit before taxation
The profit before taxation in the previous financial year to 31 December 2004 was £5,051,000 after exceptional costs of £848,000 in respect
of the Hampton site re-development project and a profit on the sale of the freehold land site of £1,594,000.
1 Januaryto 20 May
2005£000
14,356
201
(105)
96
£000
1,279
(723)
556
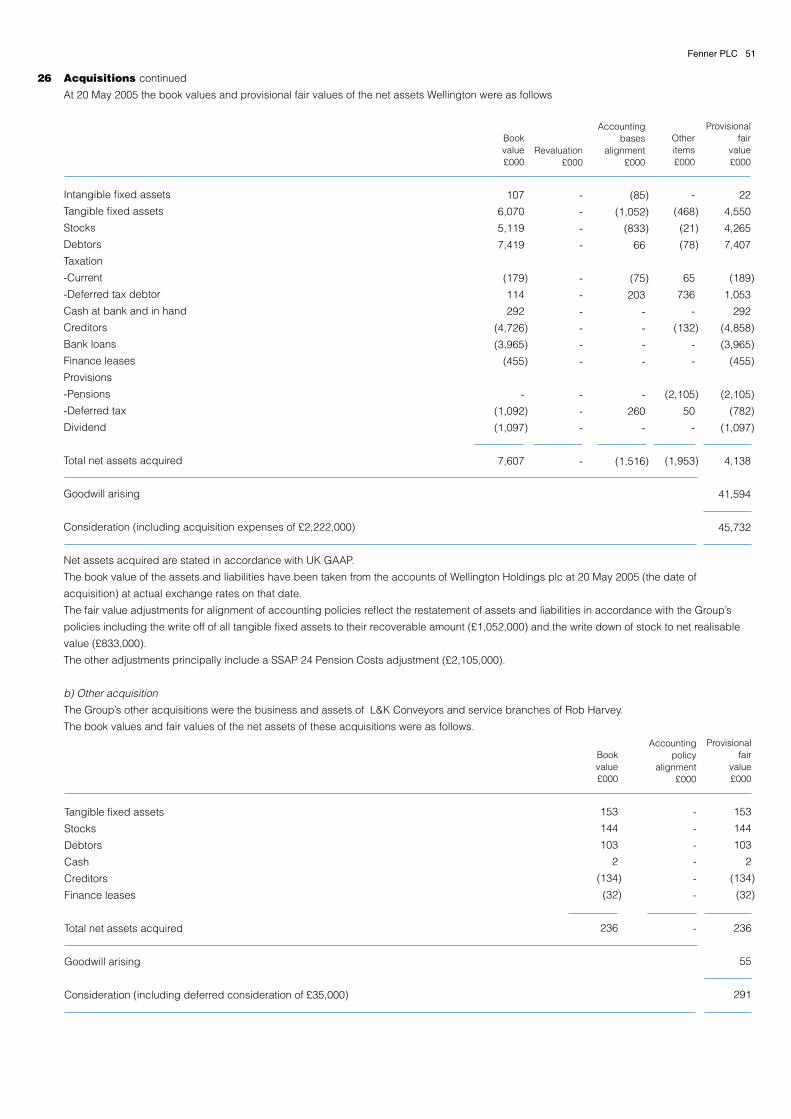
26 Acquisitions continued
At 20 May 2005 the book values and provisional fair values of the net assets Wellington were as follows
Intangible fixed assets
Tangible fixed assets
Stocks
Debtors
Taxation
-Current
-Deferred tax debtor
Cash at bank and in hand
Creditors
Bank loans
Finance leases
Provisions
-Pensions
-Deferred tax
Dividend
Total net assets acquired
Goodwill arising
Consideration (including acquisition expenses of £2,222,000)
Net assets acquired are stated in accordance with UK GAAP.
The book value of the assets and liabilities have been taken from the accounts of Wellington Holdings plc at 20 May 2005 (the date of
acquisition) at actual exchange rates on that date.
The fair value adjustments for alignment of accounting policies reflect the restatement of assets and liabilities in accordance with the Group’s
policies including the write off of all tangible fixed assets to their recoverable amount (£1,052,000) and the write down of stock to net realisable
value (£833,000).
The other adjustments principally include a SSAP 24 Pension Costs adjustment (£2,105,000).
b) Other acquisition
The Group’s other acquisitions were the business and assets of L&K Conveyors and service branches of Rob Harvey.
The book values and fair values of the net assets of these acquisitions were as follows.
Bookvalue£000
107
6,070
5,119
7,419
(179)
114
292
(4,726)
(3,965)
(455)
-
(1,092)
(1,097)
7,607
Revaluation£000
-
-
-
-
-
-
-
-
-
-
-
-
-
-
Fenner PLC 51
Provisionalfair
value£000
22
4,550
4,265
7,407
(189)
1,053
292
(4,858)
(3,965)
(455)
(2,105)
(782)
(1,097)
4,138
41,594
45,732
Otheritems£000
-
(468)
(21)
(78)
65
736
-
(132)
-
-
(2,105)
50
-
(1,953)
Accountingbases
alignment£000
(85)
(1,052)
(833)
66
(75)
203
-
-
-
-
-
260
-
(1,516)
Tangible fixed assets
Stocks
Debtors
Cash
Creditors
Finance leases
Total net assets acquired
Goodwill arising
Consideration (including deferred consideration of £35,000)
Provisionalfair
value£000
153
144
103
2
(134)
(32)
236
55
291
Accountingpolicy
alignment£000
-
-
-
-
-
-
-
Bookvalue£000
153
144
103
2
(134)
(32)
236

The combined impact of these acquisitions and the substantial acquisition (Wellington Holdings plc) noted above was as follows
Intangible fixed assets
Tangible fixed assets
Stocks
Debtors
Taxation
Deferred tax debtor
Cash at bank and in hand
Bank loans
Creditors
Finance leases
Provisions
-Pensions
-Deferred tax
Dividend
Total net assets acquired
Goodwill arising
Consideration (including deferred consideration and acquisition expenses)
Deferred consideration
Accrued costs
Shares issued
Cash consideration
Cash at bank and in hand of operations acquired
Deferred consideration in respect of previous acquisitions
Cash outflow in respect of the acquisition of subsidiary undertakings
Total£000
22
4,703
4,409
7,510
(189)
1,053
294
(3,965)
(4,992)
(487)
(2,105)
(782)
(1,097)
4,374
41,649
46,023
(35)
(101)
(1,420)
44,467
(294)
26
44,199
Other£000
-
153
144
103
-
-
2
-
(134)
(32)
-
-
-
236
55
291
52 Fenner PLC
Substantialacquisition
£000
22
4,550
4,265
7,407
(189)
1,053
292
(3,965)
(4,858)
(455)
(2,105)
(782)
(1,097)
4,138
41,594
45,732
Provisional fair value
26 Acquisitions continued
Notes continued

b) The valuation on which the FRS17 disclosures are set out below, has been prepared by a qualified actuary and is based on the most
recent actuarial valuations of the UK schemes. Scheme assets are stated at their market value at 31 August 2005. During the year ended
31 August 2005, the Group paid contributions to the Fenner Scheme at the rate of 12% of the pensionable salaries together with an additional
payment of £1.25m and members contributed at the rate of 8.0% of pensionable salaries. In addition, contributions were paid to the Wellington
Scheme of £0.3m.
The main financial assumptions used to calculate the UK schemes liabilities under FRS17 were as follows
Price inflation
Rate of increase in salaries
Rate of increase of pensions in payment subject to Limited Price Indexation increases*
Rate of increase for deferred pensioners subject to statutory revaluation
Discount rate
* Some elements of pension increase at either 0% pa or 3% pa
The assets in the UK scheme and the expected rates of return were
Equities
Bonds
Cash
Total (excluding defined contribution)
Defined contribution section
Total†
†There are also some policies relating to insured pensioners which are excluded from this disclosure.
% pa
8.5
4.9
4.5
2003% pa
2.7
3.7
2.7
2.7
5.5
2004% pa
3.0
4.0
2.9
3.0
5.6
2005% pa
2.7
3.7
2.7
2.7
5.0
2003
£000
53,606
15,296
2,684
71,586
1,680
73,266
£000
50,880
14,408
2,006
67,294
1,308
68,602
% pa
8.5
4.7
3.5
2004
£000
66,866
16,895
7,787
91,548
3,423
94,971
% pa
8.0%
4.2%
4.5%
2005
27 Pensions and other post-retirement benefits
The Group has continued to account for pensions in accordance with Statement of Standard Accounting Practice 24 and the disclosures given in
a) below are those required by that accounting standard. The transitional disclosures required for FRS17, Retirement Benefits, to the extent not
given in a) are, for the UK pension schemes (the Group’s only significant defined benefit arrangements), set out in b) below.
a) The Group operates a number of post-retirement defined benefit arrangements, including pension schemes and post-retirement medical
plans, around the world. Some of the arrangements are funded and some are unfunded. The assets of these schemes are held in
separate trustee administered funds. Since the overseas arrangements are all relatively small compared with the UK pension schemes detailed
below, a more limited disclosure has been included.
The total pension cost for the Group in the year ended 31 August 2005 was £5,801,000 (2004 £5,407,000).
The pension cost relating to the UK amounted to £2,517,000 (2004 £2,460,000).
Following the acquisition of Wellington Holdings, there are now two UK defined benefit schemes - the Fenner Pension Scheme and the Wellington
Pension Scheme. The cost of these schemes is assessed in accordance with the advice of a qualified actuary, who is not an employee of the
Group, using the Projected Unit Credit method. The last actuarial valuations of the UK schemes were carried out as at 31 March 2005 and 5 April
2005.
The assumptions that have the most significant effect on the results of the valuation are those relating to the rate of return on investments and the
rates of increase in salaries and pensions. It was assumed that the investment return would on average exceed both salary increases by 2.05%
p.a. and future pensions, which are entitled to increases, by 3.8% p.a.
At the dates of the latest full actuarial valuations, the combined value of the assets of the UK schemes (excluding insured pensions and the
defined contribution section) was £89,800,000 and on the assumptions above, was sufficient to cover 87% of the benefits that had accrued to
members, after allowing for expected future increases in earnings.
The element of the total pension cost in the year ended 31 August 2005 relating to foreign schemes amounted to £3,284,000 (2004 £2,947,000).
This charge has been determined in accordance with local best practice and regulations.
Fenner PLC 53
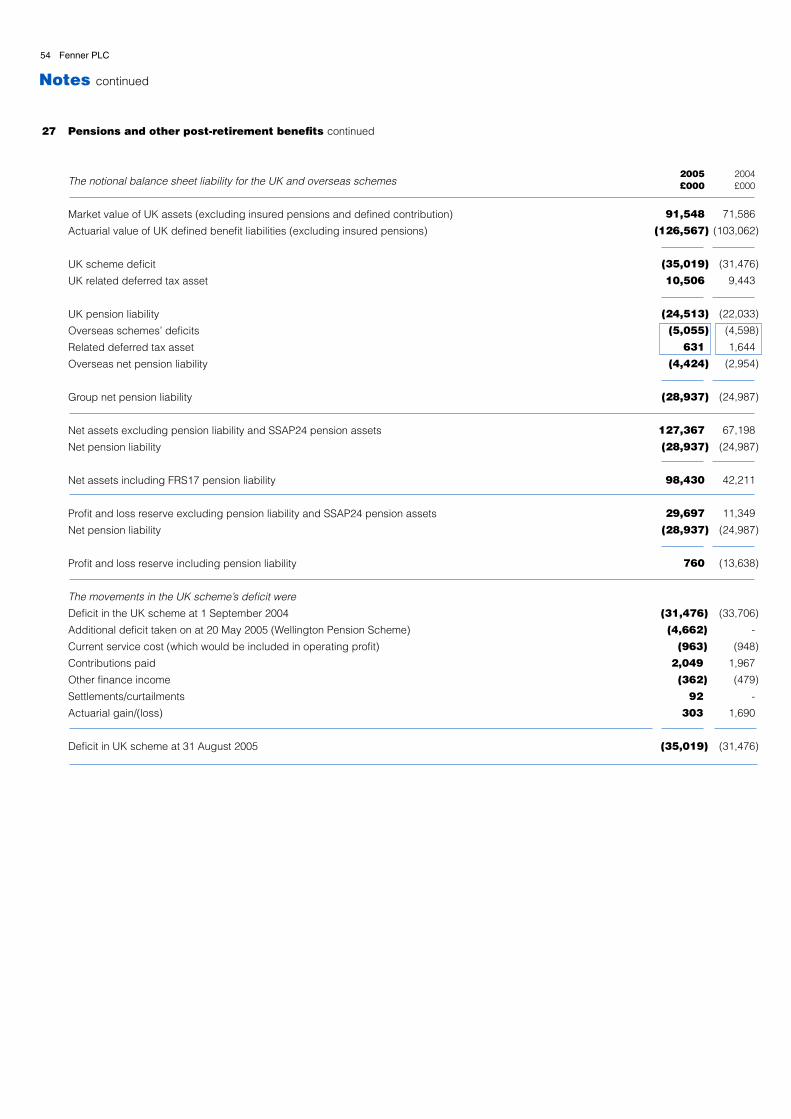
27 Pensions and other post-retirement benefits continued
The notional balance sheet liability for the UK and overseas schemes
Market value of UK assets (excluding insured pensions and defined contribution)
Actuarial value of UK defined benefit liabilities (excluding insured pensions)
UK scheme deficit
UK related deferred tax asset
UK pension liability
Overseas schemes’ deficits
Related deferred tax asset
Overseas net pension liability
Group net pension liability
Net assets excluding pension liability and SSAP24 pension assets
Net pension liability
Net assets including FRS17 pension liability
Profit and loss reserve excluding pension liability and SSAP24 pension assets
Net pension liability
Profit and loss reserve including pension liability
The movements in the UK scheme’s deficit were
Deficit in the UK scheme at 1 September 2004
Additional deficit taken on at 20 May 2005 (Wellington Pension Scheme)
Current service cost (which would be included in operating profit)
Contributions paid
Other finance income
Settlements/curtailments
Actuarial gain/(loss)
Deficit in UK scheme at 31 August 2005
2005£000
91,548
(126,567)
(35,019)
10,506
(24,513)
(5,055)
631
(4,424)
(28,937)
127,367
(28,937)
98,430
29,697
(28,937)
760
54 Fenner PLC
Notes continued
2004£000
71,586
(103,062)
(31,476)
9,443
(22,033)
(4,598)
1,644
(2,954)
(24,987)
67,198
(24,987)
42,211
11,349
(24,987)
(13,638)
(33,706)
-
(948)
1,967
(479)
-
1,690
(31,476)
(31,476)
(4,662)
(963)
2,049
(362)
92
303
(35,019)
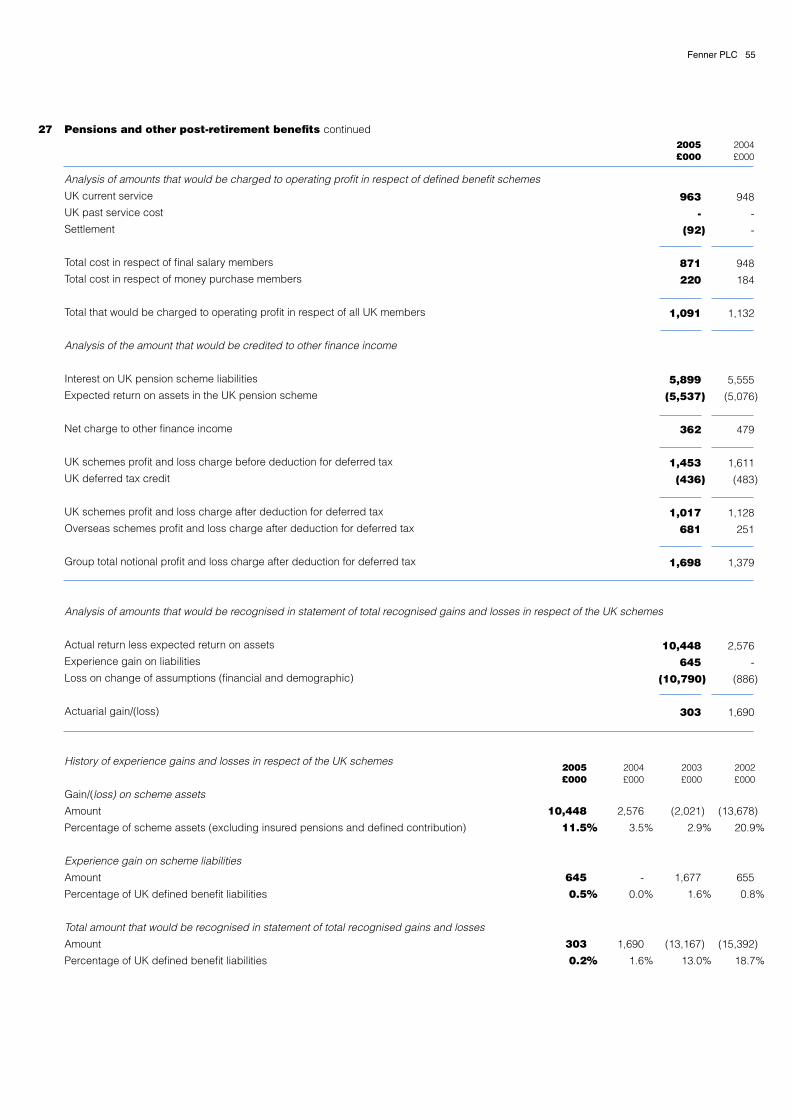
(13,678)
655
(15,392)
20.9%
0.8%
18.7%
27 Pensions and other post-retirement benefits continued
Analysis of amounts that would be charged to operating profit in respect of defined benefit schemes
UK current service
UK past service cost
Settlement
Total cost in respect of final salary members
Total cost in respect of money purchase members
Total that would be charged to operating profit in respect of all UK members
Analysis of the amount that would be credited to other finance income
Interest on UK pension scheme liabilities
Expected return on assets in the UK pension scheme
Net charge to other finance income
UK schemes profit and loss charge before deduction for deferred tax
UK deferred tax credit
UK schemes profit and loss charge after deduction for deferred tax
Overseas schemes profit and loss charge after deduction for deferred tax
Group total notional profit and loss charge after deduction for deferred tax
Analysis of amounts that would be recognised in statement of total recognised gains and losses in respect of the UK schemes
Actual return less expected return on assets
Experience gain on liabilities
Loss on change of assumptions (financial and demographic)
Actuarial gain/(loss)
History of experience gains and losses in respect of the UK schemes
Gain/(loss) on scheme assets
Amount
Percentage of scheme assets (excluding insured pensions and defined contribution)
Experience gain on scheme liabilities
Amount
Percentage of UK defined benefit liabilities
Total amount that would be recognised in statement of total recognised gains and losses
Amount
Percentage of UK defined benefit liabilities
2004£000
948
-
-
948
184
1,132
5,555
(5,076)
479
1,611
(483)
1,128
251
1,379
2,576
-
(886)
1,690
2005£000
963
-
(92)
871
220
1,091
5,899
(5,537)
362
1,453
(436)
1,017
681
1,698
10,448
645
(10,790)
303
Fenner PLC 55
2,576
3.5%
-
0.0%
1,690
1.6%
(2,021)
1,677
(13,167)
2.9%
1.6%
13.0%
2003£000
2002£000
2004£000
10,448
11.5%
645
0.5%
303
0.2%
2005£000
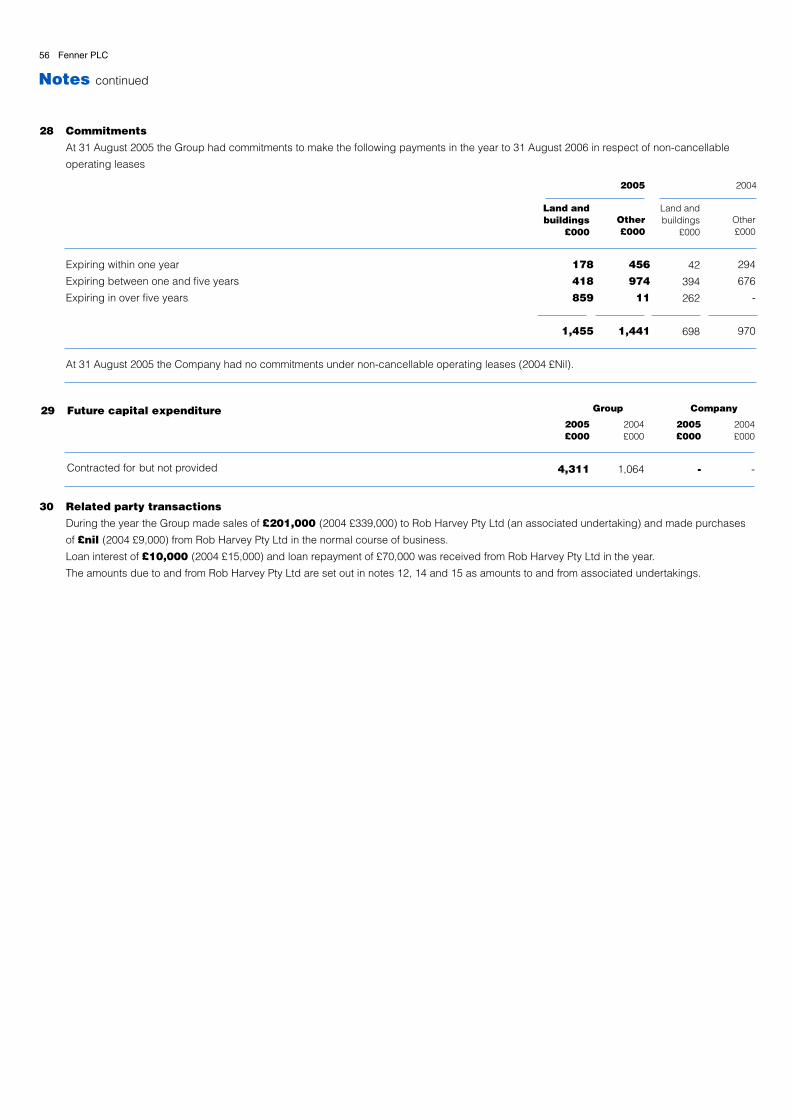
28 Commitments
At 31 August 2005 the Group had commitments to make the following payments in the year to 31 August 2006 in respect of non-cancellable
operating leases
Expiring within one year 178 456
Expiring between one and five years 418 974
Expiring in over five years 859 11
1,455 1,441
At 31 August 2005 the Company had no commitments under non-cancellable operating leases (2004 £Nil).
56 Fenner PLC
Notes continued
30 Related party transactions
During the year the Group made sales of £201,000 (2004 £339,000) to Rob Harvey Pty Ltd (an associated undertaking) and made purchases
of £nil (2004 £9,000) from Rob Harvey Pty Ltd in the normal course of business.
Loan interest of £10,000 (2004 £15,000) and loan repayment of £70,000 was received from Rob Harvey Pty Ltd in the year.
The amounts due to and from Rob Harvey Pty Ltd are set out in notes 12, 14 and 15 as amounts to and from associated undertakings.
29 Future capital expenditure
Contracted for but not provided
2005£000
4,311
2004£000
1,064
2004£000
-
2005£000
-
Group Company
Other£000
Land andbuildings
£000Other£000
294
676
-
970
Land andbuildings
£000
42
394
262
698
2005 2004
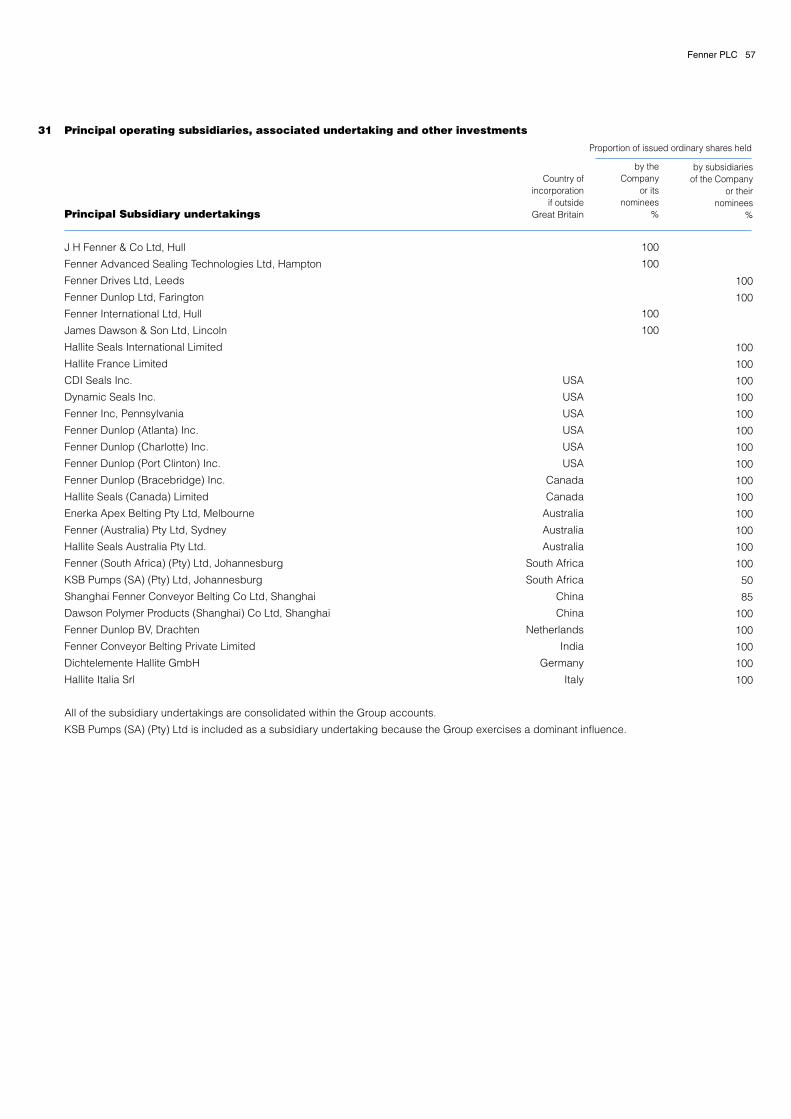
Fenner PLC 57
31 Principal operating subsidiaries, associated undertaking and other investments
Principal Subsidiary undertakings
J H Fenner & Co Ltd, Hull
Fenner Advanced Sealing Technologies Ltd, Hampton
Fenner Drives Ltd, Leeds
Fenner Dunlop Ltd, Farington
Fenner International Ltd, Hull
James Dawson & Son Ltd, Lincoln
Hallite Seals International Limited
Hallite France Limited
CDI Seals Inc.
Dynamic Seals Inc.
Fenner Inc, Pennsylvania
Fenner Dunlop (Atlanta) Inc.
Fenner Dunlop (Charlotte) Inc.
Fenner Dunlop (Port Clinton) Inc.
Fenner Dunlop (Bracebridge) Inc.
Hallite Seals (Canada) Limited
Enerka Apex Belting Pty Ltd, Melbourne
Fenner (Australia) Pty Ltd, Sydney
Hallite Seals Australia Pty Ltd.
Fenner (South Africa) (Pty) Ltd, Johannesburg
KSB Pumps (SA) (Pty) Ltd, Johannesburg
Shanghai Fenner Conveyor Belting Co Ltd, Shanghai
Dawson Polymer Products (Shanghai) Co Ltd, Shanghai
Fenner Dunlop BV, Drachten
Fenner Conveyor Belting Private Limited
Dichtelemente Hallite GmbH
Hallite Italia Srl
All of the subsidiary undertakings are consolidated within the Group accounts.
KSB Pumps (SA) (Pty) Ltd is included as a subsidiary undertaking because the Group exercises a dominant influence.
by subsidiariesof the Company
or theirnominees
%
100
100
100
100
100
100
100
100
100
100
100
100
100
100
100
100
50
85
100
100
100
100
100
by theCompany
or itsnominees
%
100
100
100
100
Country ofincorporation
if outsideGreat Britain
USA
USA
USA
USA
USA
USA
Canada
Canada
Australia
Australia
Australia
South Africa
South Africa
China
China
Netherlands
India
Germany
Italy
Proportion of issued ordinary shares held

58 Fenner PLC
Notes continued
Other investment
Outils Pneumatiques Globe SA, Paris
Proportion of issuedordinary shares held
by subsidiariesof the Company
%
12.2
Country ofincorporation
France
Associated undertaking
Rob Harvey Pty Ltd, Brisbane(Year end 30 June)
The result for Rob Harvey Pty Ltd included in the Group Results for the year to 31 August 2005 is based on the accounts of Rob Harvey Pty Ltd to
30 June 2005 and the management accounts for the subsequent period to 31 August 2005. Rob Harvey Pty Ltd is included as an associate
undertaking because the Group does not exercise a dominant influence. The Group’s share of the capital commitments was £nil. There were
£nil contingent liabilities at 31 August 2005.
All the above subsidiary and associated undertakings are involved directly or indirectly in the Group’s principal activities except for KSB Pumps
(SA) (Pty) Ltd, which is involved in the manufacture and distribution of pumps and valves.
Each of the subsidiary and associated undertakings operates principally in the country of incorporation.
A full list of the Company’s interests in subsidiary and associated undertakings is filed with the annual return to the Registrar of Companies.
Issuedordinary share
capital000
1,200
Currency
Australian dollar
Proportion ofissued ordinary
shares heldby subsidiaries
of the Company%
50
Country ofincorporation
Australia
31 Principal operating subsidiaries, associated undertaking and other investments continued

Fenner PLC 59
Turnover
Operating profit before goodwill amortisation
and exceptional items
Goodwill amortisation
Exceptional items
Operating profit/(loss)
Share of operating (loss)/profit in associated undertakings
Profit on sale and termination of operations
Profit/(loss) on ordinary activities before interest
Net interest payable
Share of net interest payable in associated undertakings
Profit/(loss) on ordinary activities before taxation
Taxation on profit on ordinary activities
Minority equity interests
Earnings
Dividends
Retained loss
Earnings per share
Adjusted – before goodwill amortisation, exceptional items and profit on
sale of operations
Basic – after goodwill amortisation, exceptional items and profit on
sale of operations
Dividends per ordinary share
Capital expenditure
Shareholders’ funds – Equity interest
Net debt
Gearing
Average number of employees
Where applicable prior years have been restated following the adoption of FRS19 Deferred Tax, the implementation of UITF abstract 38, Accounting for
ESOP Trusts, the discounted share placement in 2004 and the placing and open offer in 2005.
2001£000
166,402
14,055
-
(849)
13,206
575
-
13,781
(1,415)
(58)
12,308
(3,449)
(273)
8,586
(5,801)
2,785
8.74p
8.22p
5.675p
3,431
70,059
9,706
-
1,840
2003£000
248,533
12,012
(993)
(12,470)
(1,451)
451
-
(1,000)
(4,139)
(33)
(5,172)
(1,074)
(631)
(6,877)
(6,025)
(12,902)
4.94p
(6.53)p
5.825p
6,500
58,428
(44,496)
76.2%
2,667
2004£000
260,595
16,101
(1,149)
(6,214)
8,738
489
695
9,922
(3,458)
(69)
6,395
(3,052)
(976)
2,367
(6,324)
(3,957)
7.67p
2.19p
5.825p
7,858
60,739
(39,416)
64.9%
2,662
2005£000
313,012
21,255
(1,904)
(3,502)
15,849
(20)
-
15,829
(3,761)
(43)
12,025
(4,514)
(980)
6,531
(8,174)
(1,643)
9.34
5.28
5.825p
8,235
118,825
(33,907)
28.5%
2,949
2002£000
232,187
16,563
(588)
(6,665)
9,310
467
-
9,777
(4,249)
(44)
5,484
(1,539)
(399)
3,546
(5,997)
(2,451)
8.40p
3.38p
5.825p
4,806
67,654
(39,981)
59.1%
2,545
Five Year Summary

60 Fenner PLC
Fenner, Fenner Drives, Hallite, BTL, Fenaplast and Powertwist are Registered Trademarks of the Fenner Group.
CDI, T-Max and SigmaSeal are trademarks of the Fenner Group.
KSB is a Registered Trademark of the KSB Group
Annual General Meeting
The sixty-ninth Annual General Meeting of the Company will be held at Marlborough Room, Oxford & Cambridge Club, Pall Mall, London
SW1Y 5HD, on 11th January 2006 at 10.30 am when the following business will be proposed:
Ordinary Business
1 To receive the directors’ report and financial statements of the Group for the financial year ended 31 August 2005 together with the
auditor’s report.
2 To approve the Board Remuneration Report contained in the Company’s Annual Report for 2005.
3 To declare a dividend.
4 Election of directors.
5 To re-appoint the auditors and to authorise the directors to determine their remuneration.
6 To transact any other ordinary business of an annual general meeting.
Special Business
7 To authorise the directors to allot shares.
8 To empower the directors to allot shares for cash.
9 To authorise the Company to buy back its own shares.
Note
This is a summary of the Notice of Meeting and shareholders should refer to the enclosed document which contains the full
text of the Notice of Meeting together with an explanatory letter from the Chairman of the Company.
Advisors
Registrars
Capita Registrars, Beckenham
Principal Solicitors
Addleshaw Goddard, Leeds
Nabarro Nathanson, London
Rollits, Hull
Shumaker, Loop & Kendrick, Charlotte, USA
Independent Auditors
PricewaterhouseCoopers LLP, Hull
Brokers
Collins Stewart Limited, London
Principal Bankers
Barclays Bank PLC, Leeds
Lloyds TSB Bank plc, Leeds
Bank of Scotland, Leeds
Wachovia Bank NA, Charlotte, USA
Merchant Bankers
N.M. Rothschild & Sons Limited, Leeds
Financial Calendar
Annual General Meeting – January
Half Year End – February
Half Year Announcement – May
Year End – August
Preliminary Announcement – November
Health and SafetyPlease note that in some of the illustrations featured in this annual report, safety guards have been removed for photographic purposes.

AnnualReport2003
AnnualReport2005
Growing Partnerships WorldwideRegistered office: Hesslewood Country Office Park,Hessle, East Yorkshire HU13 0PW, Telephone 01482 626511 Fax: 01482 626512Registered Number: 329377 www.fenner.com
Fe
nn
er P
LC
Annual R
eport 2005
Fenner is a world leader in reinforced polymertechnology.
Our strategy is to increase market share andtarget new value added product areas. We willcontinue to concentrate on growing thosebusinesses where we already demonstrateleadership through our skills in applications,design, materials technology and dedication tocustomer service as well as by carefully plannedacquisitions.
Advanced Sealing TechnologiesAdvanced Sealing Technologies
CHARLOTTETel: (1) 704 334 5353Fax: (1) 704 334 1733www.scandura.net
Tel: (44) 1482 781234Fax: (44) 1482 785438www.fennerdunlop.com/europe
Tel: (31) 512 585 555Fax: (31) 512 585 511www.fennerdunlop.com/europe
Tel: (86) 21 599 369 89Fax: (86) 21 599 367 34www.fennerdunlop.com/shanghai
Tel: (61) 3 9680 4500Fax: (61) 3 9689 9191www.apexfenner.com.au
Tel: (44) 1522 781800Fax: (44) 1522 510029www.james-dawson.com
Tel: (44) 113 249 3486Fax: (44) 113 248 9656www.fennerdrives.com
Tel: (44) 20 8941 2244Fax: (44) 20 8783 1669www.hallite.com
Tel: (49) 40 73 47 480Fax: (49) 40 73 47 48 49www.hallite.de
Tel: (27) 11 974 1902Fax: (27) 11 974 1900www.fenner.co.za
Tel: (27) 11 828 8950Fax: (27) 11 822 2013www. ksbpumps.co.za
ATLANTATel: (1) 404 294 5272Fax: (1) 404 296 5165www.gaduck.com
Tel: (1) 717 665 2421Fax: (1) 717 665 2649www.fennerdrives.com
DETROITTel: 248 362 0170Fax: 248 362 4246www.hallite.com
HOUSTONTel: 281 446 6662Fax: 281 446 7034www.cdipolytek.com
Advanced Sealing Technologies
JamesD wsonaPANTONE 28060% TINT 280
Tel: (86) 21 599 369 89Fax: (86) 21 599 367 34www.james-dawson.com
JamesD wsonaPANTONE 28060% TINT 280
C O N V E Y O R B E L T I N G E U R O P E
C O N V E Y O R B E L T I N G E U R O P E
Tel: (91) 452 2464201Fax: (91) 452 2464204
C O N V E Y O R B E L T I N G A M E R I C A S
C O N V E Y O R B E L T I N G A U S T R A L I A
C O N V E Y O R B E L T I N G
C O N V E Y O R B E L T I N G
Tel: (1) 705 645 4431Fax: (1) 705 645 3112www.scandura.net
C O N V E Y O R B E L T I N G A M E R I C A S


