30
Disclosure Statement For the six months ended 30 June 2014 Rabobank Nederland

Disclosure Statement For the six months ended 30 June 2014
Rabobank Nederland
Contents
General Disclosures
1
Directors’ and New Zealand Chief Executive Officer’s Statements
5
Statement of Comprehensive Income
6
Statement of Financial Position
7
Statement of Changes in Equity
8
Condensed Statement of Cash Flows
9
Notes to the Financial Statements
1
Reporting entity
10
2
Basis of preparation
10
3
Other income
11
4
Other operating gains / (losses)
11
5
Impairment losses
11
6
Available-for-sale (AFS) financial assets
11
7
Loans and advances
12
8
Due from related entities
12
9
Deposits
12
10
Due to related entities
12
11
Credit quality, impaired assets and provision for impairment
13
12
Asset quality of Registered Bank’s Overseas Banking Group
14
13
Contributed equity, reserves and capital management
14
14
Priority of financial liabilities in the event of a liquidation
15
15
Contingent liabilities
15
16
Expenditure commitments
16
17
Risks arising from financial instruments
17
18
Credit and market risk exposures and capital adequacy
20
19
Concentration of funding
22
20
Additional information on statement of financial position 22
21
Fair value of financial instruments 23
22
Additional information for Registered Bank’s Overseas Banking Group 25
23
Reconciliation of profit after income tax to net cash flow from operating activities 25
24
Related party disclosures
25
25
Subsequent events
26
26
Dividend
26
Auditor’s Independent Review Report 27

General Disclosures
Rabobank Nederland Disclosure Statement | 1
General information and definitions
The information contained in this Disclosure Statement is as required by section 81 of the Reserve
Bank of New Zealand Act 1989 and the Registered Bank Disclosure Statement s (Overseas
Incorporated Registered Banks) Order 2014 (as amended) (“Order”).
In this Disclosure Statement:
“Registered Bank” refers to Coöperatieve Centrale Raiffeisen -Boerenleenbank B.A.,
incorporated in The Netherlands and trading as Rabobank Nederland.
“Branch” refers to the New Zealand business of the Registered Bank.
“Banking Group” refers to:
(a) the Branch; and
(b) the Registered Bank’s New Zealand incorporated subsidiaries , namely Rabobank
New Zealand Limited and Rabo Capital Securities Limited.
“Overseas Banking Group” refers to the total worldwide business of the Registered Bank,
including its world-wide subsidiary entities.
Directors
There have been the following changes to the Registered Bank’s Board of Directors since 31
December 2013:
Jan van Nieuwenhuizen was appointed to the Executive Board effective 24 March 2014.
Louise Fresco ceased to be a member of the Supervisory Board effective 19 June 2014.
Antoon Vermeer ceased to be a member of the Supervisory Board effective 19 June
2014.
The directors of the Executive and Supervisory Boards, on whose behalf the New Zealand Chief
Executive Officer has signed this Disclosure Statement, are listed as follows:
Executive Board
M. Minderhoud (Marinus), chairman
A. Bruggink (Bert), chief financial officer
B.J. Marttin (Berry), member
R.J. Dekker (Ralf), member
H. Nagel (Rien), member
J.L. van Nieuwenhuizen (Jan), member
Supervisory Board
W. Dekker (Wout), chairman
I.P. Asscher-Vonk (Irene), member
C.P. Veerman (Cees), member
S.L.J. Graafsma, (Leo), member
E.A.J. van de Merwe, (Erik), member
L.N. Degle (Leionard), member
R. Teerlink (Ron), member
C.H. van Dalen (Henk), member
No subordination of claims of creditors
There are no material legislative or regulatory restrictions in The Netherlands that, in a liquidation
of the Registered Bank, subordinate the claims of any class of unsecured creditors of the Branch
on the assets of the Registered Bank to those of any other class of unsecured creditors of the
Registered Bank.

General Disclosures
2 | Rabobank Nederland Disclosure Statement
Requirement to maintain sufficient assets to cover ongoing
obligation to pay deposit liabilities
The Registered Bank is not subject to any regulatory or legislative requirement in The
Netherlands to maintain sufficient assets in The Netherlands to cover an ongoing
obligation to pay deposit liabilities in that country. However, the “Financial Supervision
Act” requires the Overseas Banking Group to maintain certain liquid assets in order to
cover an ongoing obligation to pay liabilities of the Overseas Banking Group. The
requirement is based on the consolidated position of the Overseas Banking Group and
any liquidity requirements of the Banking Group will form part of the Overseas Banking
Group’s consolidated position. This requirement has the potential to impact on the
management of the liquidity of the Branch.
Auditors for the Banking Group
Mr Andrew Harmer
C/- Ernst & Young
680 George Street
Sydney NSW 2000
Australia
Credit ratings
The Registered Bank has a general credit rating applicable to its long term senior
unsecured obligations payable in any country or currency, including obligations payable
in New Zealand and in New Zealand dollars.
Rating Agency Current Credit Rating
Standard & Poor’s AA- (negative outlook)
Moody’s Aa2 (negative outlook)
Fitch AA- (negative outlook)
Guarantee arrangements
Material obligations of the Registered Bank that relate to the Branch are guaranteed as at
the date its directors and New Zealand Chief Executive Officer signed this Disclosure
Statement.
Material cross guarantees
Through their mutual financial association, various legal entities within the Overseas
Banking Group together make up a single organisation. An internal liability relationship
exists between these legal entities, as referred to in Section 3:111 of the Dutch Financial
Supervision Act (Wet financieel toezicht). This relationship is formalised in an internal
‘cross-guarantee’ system, which stipulates that if a participating institution has insufficient
funds to meet its obligations towards its creditors, the other participants must
supplement that institution’s funds in order to enable it to fulfil those obligations. There
are no limits on the amount of obligations guaranteed and no material conditions on the
guarantees other than insufficiency of funds to meet a participating institution’s
obligations towards its creditors.
Nor are there any material or other legislative or regulatory restrictions in The Netherlands
that, in a liquidation of a participating institution, would have the effect of limiting the
claims under the cross-guarantee system of any creditors of the Registered Bank on the
assets of the participating institution to other claims on the participating institution.
Neither a single nor a standard representative cross-guarantee contract exists.

General Disclosures
Rabobank Nederland Disclosure Statement | 3
Guarantee arrangements (continued)
Material cross guarantees (continued)
Participating institutions within the Overseas Banking Group are:
Coöperatieve Centrale Raiffeisen-Boerenleenbank B.A. (Rabobank Nederland)
The local Rabobank Member banks
De Lage Landen International B.V.
De Lage Landen Financiering B.V.
De Lage Landen Trade Finance B.V.
De Lage Landen Financial Services B.V.
Schretlen & Co. N.V.
Rabohypotheekbank N.V.
Raiffeisenhypotheekbank N.V.
For regulatory and financial reporting purposes, the Registered Bank and the local Rabobank
member banks in The Netherlands, as well as the participating subsidiaries, are treated as one
consolidated entity.
Insurance business
The Banking Group does not conduct any insurance business.
Non-consolidated activities
The Registered Bank does not conduct any insurance business or non-financial activities in New
Zealand that are outside the Banking Group.
Risk management policies
Since 31 March 2014:
there has been no material change in the Banking Group’s policies for managing credit,
currency, interest rate, liquidity, operational , and other material business risks (the Banking
Group does not take any equity risk); and
the Banking Group has not become exposed to a new category of risk to which the Banking
Group was not previously exposed.
Securitisation, funds management, other fiduciary activities and
marketing and distribution of insurance products
The Banking Group has no involvement in the origination of securitised assets, the marketing or
servicing of securitisation schemes or the marketing and distribution of insurance products.
Except as set out below, the Banking Group has no involvement in trust, custodial, funds
management, or other fiduciary activities established, marketed or sponsored by a member of the
Banking Group.
On 14 February 2006 Rabobank New Zealand Limited launched RaboDirect (originally known as
“RaboPlus”), an online banking and investment service offering access to third party managed
funds. RaboDirect distributes managed fund investments to New Zealand residents. Distribution
agreements are in place with selected unrelated fund managers and, on the basis of those
agreements and with the exception of the Cash Advantage Fund, RaboDirect is entitled to
distribution fees from the fund managers and entry fees from investors.

General Disclosures
4 | Rabobank Nederland Disclosure Statement
Securitisation, funds management, other fiduciary activities and
marketing and distribution of insurance products (continued)
Rabobank New Zealand Limited and its directors are promoters of a managed fund known
as the “Cash Advantage Fund”. AMP Capital Investors (New Zealand) Limited and its
directors are also promoters of the Cash Advantage Fund and AMP Investment
Management (NZ) is the Cash Advantage Fund’s manager. All amounts invested in the
Cash Advantage Fund are held in an interest-bearing deposit account with the Registered
Bank. The Cash Advantage Fund is offered through RaboDirect and other distribution
channels and was opened to investments from the public on 27 November 2007.
Since 31 March 2014 there have been no material changes in the Banking Group’s:
involvement in the establishment, marketing, or sponsorship of trust, custodial,
funds management, or other fiduciary activities (as set out above); or
arrangements to ensure that difficulties arising from those activities would not
impact adversely on the Banking Group.
Requirement to hold excess assets over deposit liabilities
The Registered Bank is not required to hold in New Zealand an excess of assets over
deposit liabilities.
Conditions of registration
With effect on and after 1 July 2014, the Conditions of Registration were changed to put
into effect changes to ‘Framework for Restrictions on High-LVR Residential Mortgage
Lending’ (BS19), including certain defined terms relating to loan -to-valuation restrictions
and to add clauses on anti-avoidance.
Other material matters
There are no matters relating to the business or affairs of the Registered Bank and/or the
Banking Group that:
(a) are not contained elsewhere in this Disclosure Statement; and
(b) would, if disclosed, materially affect the decision of a person to subscribe for debt
securities of which the Registered Bank or any member of the Banking Group is the
issuer.
Financial Statements of Registered Bank and Overseas Banking Group
The most recent publicly available financial statements of the Registered Bank and the
Overseas Banking Group are available at the internet address
https://www.rabobank.com/en/about-rabobank/annual-reports/index.html


6 | Rabobank Nederland Disclosure Statement
Statement of Comprehensive Income
Unaudited Unaudited Audited
6 months to 6 months to Year to
In thousands of NZD Notes 30/06/2014 30/06/2013 31/12/2013
Income statement
339,733 327,484 662,146
(174,805) (169,045) (345,389)
Net interest income 164,928 158,439 316,757
3 1,878 1,482 1,888
4 (12,248) 14,277 24,813
Operating income 154,558 174,198 343,458
(49,609) (49,656) (101,051)
5 (1,735) (2,827) (1,053)
Profit before income tax 103,214 121,715 241,354
(30,958) (32,001) (68,800)
72,256 89,714 172,554
Other comprehensive income for the period / year
13 (311) 1,649 1,967
1387 (462) (551)
(224) 1,187 1,416
Other reserves - - -
- - -
(224) 1,187 1,416
72,032 90,901 173,970
Banking Group
Items that may be reclassified subsequently to profit or loss
Items that will not be reclassified to profit or loss
Total items that may be reclassified subsequently to profit or loss
Total items that will not be reclassified to profit or loss
Impairment losses
Interest income
Income tax expense
Income tax credit / (expense) relating to changes in AFS revaluation reserve
Changes in AFS revaluation reserve
The above statement of comprehensive income should be read in conjunction with the accompanying notes.
Total comprehensive income attributable to members of theBanking Group
Profit after income tax
Interest expense
Other income
Other operating gains / (losses)
Operating expenses
Total other comprehensive income for the period / year

Rabobank Nederland Disclosure Statement | 7
Statement of Financial Position
Unaudited Unaudited Audited
In thousands of NZD Notes At 30/06/2014 At 30/06/2013 At 31/12/2013
Assets
Due from other financial institutions 200,497 230 37,063
Derivative financial instruments 130,802 200,457 111,210
Available-for-sale financial assets 6 535,095 557,107 585,555
Loans and advances 7 9,805,454 9,857,065 9,989,431
Due from related entities 8 1,504,081 1,239,418 1,392,997
Other assets 15,711 20,041 20,169
Net deferred tax assets 48,936 63,691 49,768
Property, plant and equipment 4,749 4,481 5,188
Intangible assets 68 3 2
Total assets 12,245,393 11,942,493 12,191,383
Liabilities
Due to other financial institutions - 34,330 -
Debt securities in issue 3,081,187 2,724,908 3,028,862
Derivative financial instruments 140,733 140,788 116,878
Deposits 9 4,417,425 4,267,881 4,332,808
Preference shares 280,000 280,000 280,000
Due to related entities 10 2,997,075 3,322,827 3,172,306
Other liabilities 62,106 60,486 66,000
Provisions 2,398 1,905 2,092
Head office account 150,956 184,521 128,420
Total liabilities 11,131,880 11,017,646 11,127,366
Net assets 1,113,513 924,847 1,064,017
Equity
Contributed equity 13 551,201 451,201 551,201
Reserves 13 (750) (755) (526)
Retained earnings 563,062 474,401 513,342
Total equity 1,113,513 924,847 1,064,017
The above statement of financial position should be read in conjunction with the accompanying notes.
Banking Group

8 | Rabobank Nederland Disclosure Statement
Statement of Changes in Equity
In thousands of NZDContributed
equityRetained earnings Reserves Total
At 1 January 2013 451,201 420,359 (1,942) 869,618
- 54,042 - 54,042
- - 1,187 1,187
At 30 June 2013 (Unaudited) 451,201 474,401 (755) 924,847
At 1 January 2013 451,201 420,359 (1,942) 869,618
Ordinary share capital issued during the year 100,000 - - 100,000
- 92,983 - 92,983
- - 1,416 1,416
At 31 December 2013 (Audited) 551,201 513,342 (526) 1,064,017
At 1 January 2014 551,201 513,342 (526) 1,064,017
- 49,720 - 49,720
- - (224) (224)
At 30 June 2014 (Unaudited) 551,201 563,062 (750) 1,113,513
The above statement of changes in equity should be read in conjunction with the accompanying notes.
* Statement of changes in equity excludes current year and cumulative surpluses of the Branch. The net surplus / loss of theBranch is disclosed as head office account under liabilities in the statement of financial position.
Profit after income tax (excluding Branch*)
Profit after income tax (excluding Branch*)
Profit after income tax (excluding Branch*)
Banking Group
Total other comprehensive income:
Total other comprehensive income:
Revaluation reserve - Available-for-sale financial assets
Total other comprehensive income:
Revaluation reserve - Available-for-sale financial assets
Revaluation reserve - Available-for-sale financial assets

Rabobank Nederland Disclosure Statement | 9
Condensed Statement of Cash Flows
Unaudited Unaudited Audited
6 months to 6 months to Year to
In thousands of NZD Notes 30/06/2014 30/06/2013 31/12/2013
Cash flows from operating activities
Interest received 335,621 318,768 652,912
Interest paid (177,377) (168,797) (343,758)
Other cash inflows provided by operating activities 1,882 1,628 2,042
Other cash outflows used in operating activities (84,078) (133,275) (157,106)
76,048 18,324 154,090
Net changes in operating assets and liabilities (46,470) (577,822) (887,848)
23 29,578 (559,498) (733,758)
Cash flows from investing activities
Cash inflows provided by investing activities - - -
Cash outflows used in investing activities (118) - (1,206)
(118) - (1,206)
Cash flows from financing activities
Issuance of ordinary shares - - 100,000
Head office account - - (100,000)
Net changes in financing liabilities (37,768) 478,325 724,954
(37,768) 478,325 724,954
(8,308) (81,173) (10,010)
37,063 47,073 47,073
28,755 (34,100) 37,063
Cash and cash equivalents at end of the period / year comprise of:
Cash at bank and on hand 28,755 230 37,063
Bank overdraft - (34,330) -
28,755 (34,100) 37,063
The above statement of cashflows should be read in conjunction with the accompanying notes.
Net cash flow from operating activities
Net cash flow from investing activities
Net cash flows from financing activities
Cash and cash equivalents at beginning of the period / year
Cash and cash equivalents at end of the period / year
Cash and cash equivalents at end of the period / year
Cash flows from operating profits before changes in operatingassets and liabilities
Net change in cash and cash equivalents for the period / year
Banking Group

Notes to the Financial Statements
10 | Rabobank Nederland Disclosure Statement
1 Reporting entity
The Banking Group (the “Banking Group”) consists of Rabobank Nederland New Zealand Branch (the “Branch”), Rabobank New
Zealand Limited (the “Bank” or “RNZL”) and Rabo Capital Securities Limited (“RCSL”). RNZL and RCSL are registered under the
Companies Act 1993.
These interim financial statements as at and for the six months ended 30 June 2014 are a combination of the interim financial
statements of the above entities which comprise all the activities of Coöperatieve Centrale Raiffeisen-Boerenleenbank B.A.
(Rabobank Nederland) in New Zealand, but does not include the New Zealand business of De Lage Landen Limited and AGCO
Finance Limited in accordance with the conditions for registration as issued by the Reserve Bank of New Zealand.
2 Basis of preparation
2.1 Statement of compliance
The interim financial statements have been prepared and presented in accordance with the Order, the Financial Reporting Act 1993,
and the Reserve Bank of New Zealand Act 1989. For this purpose the Banking Group comprises entities and operations as required
by the RBNZ but it does not constitute a group in accordance with NZ IAS 27 Consolidated and Separate Financial Statements.
These interim financial statements have been prepared in accordance with the requirements of the New Zealand equivalent to
International Accounting Standard ('NZ IAS') 34 Interim Financial Reporting and should be read in conjunction with the Banking
Group's financial statements for the year ended 31 December 2013.
2.2 Basis of measurement
These interim financial statements have been prepared under the historical cost convention, except for derivative financial
instruments and available for sale financial assets, which have been measured at fair value. The going concern assumption and the
accrual basis of accounting have been adopted.
The carrying values of recognised assets and liabilities that are hedged items in fair value hedges, and otherwise carried at amortised
cost, are adjusted to record changes in the fair values attributable to the risks that are being hedged.
2.3 Estimates
The preparation of interim financial statements requires management to make judgements, estimates and assumptions that affect
the application of accounting policies. In preparing these interim financial statements, the significant judgements made by
management in applying the Banking Group's accounting policies and the key sources of estimation of uncertainty were the same
as those applied to the consolidated financial statements as at and for the year ended 31 December 2013.
2.4 Principal accounting policies
There have been no material changes in accounting policies during the interim financial period. The accounting policies used in the
preparation of these interim financial statements are consistent with the accounting policies used in the preparation of the annual
financial statements for the year ended 31 December 2013.
We have not early adopted any NZ equivalents to International Financial Reporting Standards (‘NZ IFRS’) that are not yet in effect.
2.5 Functional and presentation currency
Unless otherwise indicated, all amounts are expressed in New Zealand dollars (NZD), the functional and presentation currency of the
operations of the entities in the Banking Group, as this currency best reflects the economic substance of the underlying events and
circumstances relevant to the Banking Group.
All financial information presented in NZD has been rounded to the nearest thousand unless otherwise stated.
2.6 Principles of consolidation
The basis of aggregation incorporates the assets and liabilities of all entities within the Banking Group and the results of those
entities. The effects of transactions as well as balances between entities in the Banking Group have been eliminated.
2.7 Comparative figures
Comparative information has been revised where appropriate to enhance comparability. Where necessary, comparative figures have
been adjusted to conform with changes in presentation in the current year.

Rabobank Nederland Disclosure Statement | 11
Notes to the Financial Statements3 Other income
Unaudited Unaudited Audited6 months to 6 months to Year to
In thousands of NZD 30/06/2014 30/06/2013 31/12/2013
Lending and credit facility related fee income 1,438 1,352 1,754
Other income 440 130 134
Total other income 1,878 1,482 1,888
4 Other operating gains / (losses)
Unaudited Unaudited Audited6 months to 6 months to Year to
In thousands of NZD 30/06/2014 30/06/2013 31/12/2013
Gains / (losses) arising from:
- hedging instruments 806 (28,086) (49,797)
- hedged items attributable to hedged risks (839) 34,523 61,986
- net trading gains / (losses) on derivatives* (12,194) 7,852 12,634
Foreign exchange gains / (losses) (21) (12) (10)
Total other operating gains / (losses) (12,248) 14,277 24,813
5 Impairment losses
Unaudited Unaudited Audited6 months to 6 months to Year to
In thousands of NZD 30/06/2014 30/06/2013 31/12/2013
Collective provisions / (releases) (2,602) 269 (998)
Specific provisions 4,341 2,704 2,205
Bad debt recovery (4) (146) (154)
Total impairment losses 1,735 2,827 1,053
6 Available-for-sale (AFS) financial assets
Unaudited Unaudited AuditedIn thousands of NZD At 30/06/2014 At 30/06/2013 At 31/12/2013
535,095 557,107 585,555
Total available-for-sale financial assets 535,095 557,107 585,555
Additional information on liquidity portfolio
Banking Group
*Within the balance of $12.2 million loss, there is a balance of $1.5 million loss (2013: $8.0 million loss) which relates to the ReserveBank of New Zealand requiring the NZ Banking Group to produce a set of financial accounts that notionally consolidates a branchtogether with locally incorporated subsidiaries, resulting in hedges that are ordinarily effective to become ineffective. The notionalconsolidation of branches with locally incorporated subsidiaries does not constitute a group in accordance with NZ IAS 27Consolidated and Separate Financial Statements. The loss on consolidation is not required to be tax effected.
New Zealand Government Securities
Banking Group
Banking Group
Banking Group
The Banking Group holds a portfolio of high quality liquid securities to support liquidity risk management. The size of the BankingGroup's liquidity portfolio is based on the amount required to meet its liquidity requirements.

12 | Rabobank Nederland Disclosure Statement
Notes to the Financial Statements7 Loans and advances
Unaudited Unaudited AuditedIn thousands of NZD At 30/06/2014 At 30/06/2013 At 31/12/2013Lending 9,855,095 9,971,626 10,042,164
Finance leases 59,132 42,417 58,434
Gross loans and advances 9,914,227 10,014,043 10,100,598
Provisions for doubtful debts:
Collective (14,292) (18,161) (16,894)
Specific (94,481) (138,817) (94,273)
Net loans and advances 9,805,454 9,857,065 9,989,431
8 Due from related entities
Unaudited Unaudited AuditedIn thousands of NZD At 30/06/2014 At 30/06/2013 At 31/12/2013
Current account balances - wholly owned group* 102,966 1,286 1,230
Advances - wholly owned group* 1,114,993 952,861 1,106,192
Capital securities - wholly owned group* 280,000 280,000 280,000
Accrued interest receivable - wholly owned group* 6,122 5,271 5,575
Total due from related entities 1,504,081 1,239,418 1,392,997
9 Deposits
Unaudited Unaudited AuditedIn thousands of NZD At 30/06/2014 At 30/06/2013 At 31/12/2013
Call deposits 2,318,097 2,275,999 2,255,281
Term deposits 2,099,328 1,991,882 2,077,527
Total deposits 4,417,425 4,267,881 4,332,808
10 Due to related entities
Unaudited Unaudited AuditedIn thousands of NZD At 30/06/2014 At 30/06/2013 At 31/12/2013Current account balances - wholly owned group* 1,102 223,217 243,311
Advances - wholly owned group* 2,989,853 3,091,325 2,921,516
Accrued interest payable - wholly owned group* 6,120 8,285 7,479
Total due to related entities 2,997,075 3,322,827 3,172,306
* The wholly owned group refers to Rabobank Nederland related entities. Refer to note 24 for further information on related party disclosures.
* The wholly owned group refers to Rabobank Nederland related entities. Refer to note 24 for further information on related partydisclosures.
Banking Group
Banking Group
Banking Group
Banking Group

Rabobank Nederland Disclosure Statement | 13
Notes to the Financial Statements11 Credit quality, impaired assets and provision for impairment(a) Individually impaired assets
ResidentialIn thousands of NZD mortgages Corporate Retail* TotalOpening balance - 119,999 284,397 404,396
Additions 263 30,677 1,415 32,355
Amounts written off - - (905) (905)
Returned to performing or repaid - (32,485) (27,427) (59,912)
Closing balance 263 118,191 257,480 375,934
- 15,344 21,317 36,661
(b) Past due assets
ResidentialIn thousands of NZD mortgages Corporate Retail* TotalLess than 30 days past due - - 26,662 26,662
At least 30 days but less than 60 days past due - - 332 332
At least 60 days but less than 90 days past due - - 3,647 3,647
At least 90 days past due - - 40,552 40,552
Total past due assets - - 71,193 71,193
(c) Provision for credit impairment
ResidentialIn thousands of NZD mortgages Corporate Retail* TotalCollective provisionOpening balance - - 16,894 16,894
Charge / (credit) to statement of comprehensive income (note 5) - - (2,602) (2,602)
- - - -
Closing balance - - 14,292 14,292 Specific provisionOpening balance - - 94,273 94,273
Charge / (credit) to statement of comprehensive income (note 5) 63 - 4,278 4,341
Amounts written off - - (712) (712)
Recoveries - - - -
Reversals - - - -
Other movements - - 66 66
Discount unwind** - - (3,487) (3,487)
Closing balance 63 - 94,418 94,481
* Retail exposures include lending to rural clients together with all other lending to small and medium size businesses.
(d) Other assets under administration
There are no other assets under administration as at 30 June 2014 (2013: Nil).
Other movements
Banking Group
Banking Group
** The impairment loss on an impaired asset is calculated as the difference between the asset's carrying amount and the estimatedfuture cash flows discounted to its present value using the original effective interest rate for the asset. The discount unwinds overthe period the asset is held as interest income.
Aggregate amount of undrawn balances on lending commitmentson impaired assets
At 30/06/2014 (Unaudited)
At 30/06/2014 (Unaudited)
Banking GroupAt 30/06/2014 (Unaudited)

14 | Rabobank Nederland Disclosure Statement
Notes to the Financial Statements12 Asset quality of Registered Bank’s Overseas Banking Group
2013
At as 31 December (Audited) EURm
12,809
1.9%
3,454
27.0%
381
13 Contributed equity, Reserves and Capital management(a) Contributed equity
Unaudited Unaudited Audited
In thousands of NZD At 30/06/2014 At 30/06/2013 At 31/12/2013
Paid up capital in Rabobank New Zealand Limited 551,200 451,200 551,200
Paid up capital Rabo Capital Securities Limited 1 1 1
551,201 451,201 551,201
(b) Reserves
Unaudited Unaudited Audited
In thousands of NZD At 30/06/2014 At 30/06/2013 At 31/12/2013
AFS reserve
Opening balance (526) (1,942) (1,942)
Changes in AFS revaluation reserve (gross) (311) 1,649 1,967
Changes in AFS revaluation reserve (deferred tax) 87 (462) (551)
(750) (755) (526)
Total collective credit impairment allowance
Total individually impaired assets as a percentage of total assets (%)
Total individual credit impairment allowance
Total individual credit impairment allowance as a percentage of total individually impaired assets (%)
Total individually impaired assets (before allowances for credit impairment loss and net of interest held in suspense)
Banking Group
Total authorised and paid up capital comprises 275,600,000 ordinary shares fully paid ranking equally as to dividends, voting rightsand rights to share in any surplus on winding up (31 December 2013 275,600,000 - 30 June 2013: 225,600,000). Each share wasissued at $2 and has no par value. There was a capital injection on the 20th of September 2013, whereby the Bank issued 50,000,000ordinary shares at a value of $2 per share.
The nature and purpose of AFS reserve is to record the unrealised gains or losses arising from changes in the fair value of AFSfinancial assets.
Total authorised and paid up capital comprises 1,000 ordinary shares fully paid ranking equally as to voting rights but are notentitled to receive or participate in any dividend or distribution made by the Company. Each share was issued at $1 and has no parvalue.
Total equity
Banking Group
Total AFS reserve
Rabobank Nederland Disclosure Statement | 15
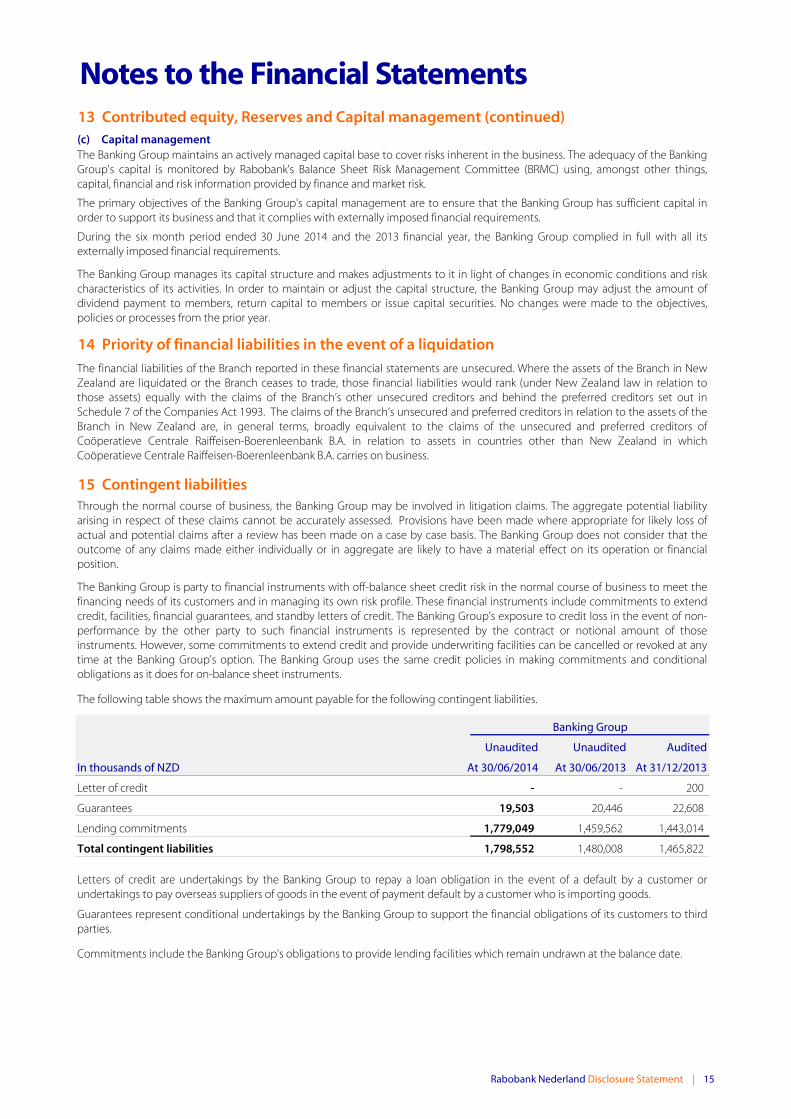
Notes to the Financial Statements13 Contributed equity, Reserves and Capital management (continued)(c) Capital management
14 Priority of financial liabilities in the event of a liquidation
15 Contingent liabilities
Unaudited Unaudited Audited
In thousands of NZD At 30/06/2014 At 30/06/2013 At 31/12/2013
Letter of credit - - 200
Guarantees 19,503 20,446 22,608
Lending commitments 1,779,049 1,459,562 1,443,014
Total contingent liabilities 1,798,552 1,480,008 1,465,822
Commitments include the Banking Group's obligations to provide lending facilities which remain undrawn at the balance date.
Through the normal course of business, the Banking Group may be involved in litigation claims. The aggregate potential liabilityarising in respect of these claims cannot be accurately assessed. Provisions have been made where appropriate for likely loss ofactual and potential claims after a review has been made on a case by case basis. The Banking Group does not consider that theoutcome of any claims made either individually or in aggregate are likely to have a material effect on its operation or financialposition.
The Banking Group is party to financial instruments with off-balance sheet credit risk in the normal course of business to meet thefinancing needs of its customers and in managing its own risk profile. These financial instruments include commitments to extendcredit, facilities, financial guarantees, and standby letters of credit. The Banking Group's exposure to credit loss in the event of non-performance by the other party to such financial instruments is represented by the contract or notional amount of thoseinstruments. However, some commitments to extend credit and provide underwriting facilities can be cancelled or revoked at anytime at the Banking Group's option. The Banking Group uses the same credit policies in making commitments and conditionalobligations as it does for on-balance sheet instruments.
Guarantees represent conditional undertakings by the Banking Group to support the financial obligations of its customers to thirdparties.
The following table shows the maximum amount payable for the following contingent liabilities.
Banking Group
Letters of credit are undertakings by the Banking Group to repay a loan obligation in the event of a default by a customer orundertakings to pay overseas suppliers of goods in the event of payment default by a customer who is importing goods.
The Banking Group maintains an actively managed capital base to cover risks inherent in the business. The adequacy of the BankingGroup's capital is monitored by Rabobank's Balance Sheet Risk Management Committee (BRMC) using, amongst other things,capital, financial and risk information provided by finance and market risk.
The financial liabilities of the Branch reported in these financial statements are unsecured. Where the assets of the Branch in NewZealand are liquidated or the Branch ceases to trade, those financial liabilities would rank (under New Zealand law in relation tothose assets) equally with the claims of the Branch’s other unsecured creditors and behind the preferred creditors set out inSchedule 7 of the Companies Act 1993. The claims of the Branch’s unsecured and preferred creditors in relation to the assets of theBranch in New Zealand are, in general terms, broadly equivalent to the claims of the unsecured and preferred creditors ofCoöperatieve Centrale Raiffeisen-Boerenleenbank B.A. in relation to assets in countries other than New Zealand in whichCoöperatieve Centrale Raiffeisen-Boerenleenbank B.A. carries on business.
The primary objectives of the Banking Group's capital management are to ensure that the Banking Group has sufficient capital inorder to support its business and that it complies with externally imposed financial requirements.
During the six month period ended 30 June 2014 and the 2013 financial year, the Banking Group complied in full with all itsexternally imposed financial requirements.
The Banking Group manages its capital structure and makes adjustments to it in light of changes in economic conditions and riskcharacteristics of its activities. In order to maintain or adjust the capital structure, the Banking Group may adjust the amount ofdividend payment to members, return capital to members or issue capital securities. No changes were made to the objectives,policies or processes from the prior year.

16 | Rabobank Nederland Disclosure Statement
Notes to the Financial Statements16 Expenditure commitments(a) Capital expenditure commitments
Unaudited Unaudited Audited
In thousands of NZD At 30/06/2014 At 30/06/2013 At 31/12/2013
One year or less 601 1,293 2,177
Total capital expenditure commitments 601 1,293 2,177
(b) Operating lease commitments
Unaudited Unaudited Audited
In thousands of NZD At 30/06/2014 At 30/06/2013 At 31/12/2013
One year or less 4,247 3,697 3,900
Between one and two years 3,596 2,507 2,948
Between two and five years 6,913 5,112 6,292
Over five years 4,270 2,657 3,132
Total operating lease commitments 19,026 13,973 16,272
Lease arrangements entered into by the Banking Group are for the purpose of accommodating the Banking Group's needs. Theseinclude operating leases arrangements over premises, motor vehicles used by staff in conducting business and office equipmentsuch as photocopiers and printers.
Leases may be over commercial and residential premises and reflect the needs of the occupying business and market conditions. Allleases are negotiated with external professional property advisors acting for the Banking Group. Rental payments are determined interms of the relevant lease requirements, usually reflecting market rentals as described by standard valuation practice. The BankingGroup as lessee has no purchase options over premises occupied. There are no restrictions imposed on the Banking Group's lease ofspace other than those forming part of the negotiated lease arrangements for each specific premises.
Banking Group
Estimated capital expenditure contracted at balance date, but not provided for, or payable:
Banking Group

Rabobank Nederland Disclosure Statement | 17
Notes to the Financial Statements17 Risks arising from financial instruments
(a) Liquidity risk
On Less than 6 6-12 12-24 24-60 Over 60
In thousands of NZD Total Demand Months Months Months Months MonthsAt 30/06/2014 (Unaudited)
Financial assets
200,608 28,755 171,853 - - - -
Derivative financial instruments 130,802 - 55,497 14,575 24,865 35,238 627
543,756 - 439,529 104,227 - - -
Loans and advances 13,760,618 15,000 1,831,692 1,102,169 559,109 1,805,039 8,447,609
Due from related entities 2,283,499 193,129 200,590 41,474 533,174 561,212 753,920
Other financial assets 13,770 - 13,770 - - - -
16,933,053 236,884 2,712,931 1,262,445 1,117,148 2,401,489 9,202,156
Financial liabilities
3,329,774 - 1,036,405 345,005 866,769 1,081,595 -
Derivative financial instruments 140,733 - 82,965 8,238 19,724 29,179 627
Deposits 4,459,272 2,318,097 1,621,588 250,286 135,906 133,395 -
Preference shares 700,138 - 8,409 8,409 16,818 50,455 616,047
Due to related entities 3,173,760 81,571 2,468,295 209,879 17,992 396,023 -
Other liabilities 62,106 - 62,106 - - - -
Head office account 150,956 - 150,956 - - - -
12,016,739 2,399,668 5,430,724 821,817 1,057,209 1,690,647 616,674
Contingent liabilities
Guarantees 19,503 14,850 2,600 415 1,195 443 -
Lending commitments 1,779,049 1,250,775 33,516 101,957 64,918 304,073 23,810
1,798,552 1,265,625 36,116 102,372 66,113 304,516 23,810
Total financial liabilities
Due from other financial institutions
Debt securities in issue
Total financial assets
The following maturity analysis for financial assets and financial liabilities and contingent liabilities presents the contractualundiscounted cash flows receivable and payable, and is based on the remaining period as at the reporting date to the contractualmaturity.
Available-for-sale financial assets
The major types of risks the Banking Group is exposed to are liquidity, market and credit risks.
Total contingent liabilities
The total balance in the table below may not agree to the statement of financial position as the table incorporates all cash flows onan undiscounted basis, which include both principal and associated future interest income/expense accruals.
Maturity analysis of financial assets and financial liabilities and contingent liabilities by contractual maturity based on undiscounted cash flows (principal and interest)
Banking Group

18 | Rabobank Nederland Disclosure Statement
Notes to the Financial Statements17 Risks arising from financial instruments (continued)(b) Market risk
(i) Repricing analysis
Call-3 3-6 6-12 12-24 Over 24 Non-Interest
In thousands of NZD Total Months Months Months Months Months bearingAt 30/06/2014 (Unaudited)
Financial assets
Due from other financial institutions 200,497 200,497 - - - - -
Derivative financial instruments 130,802 - - - - - 130,802
Available-for-sale financial assets 535,095 48,660 384,492 101,943 - - -
Loans and advances 9,805,454 4,933,575 1,050,680 1,351,482 1,285,543 1,184,174 -
Due from related entities 1,504,081 945,253 1,532 287,325 50,933 212,747 6,291
Other financial assets 13,770 - - - - - 13,770
12,189,699 6,127,985 1,436,704 1,740,750 1,336,476 1,396,921 150,863
Financial liabilities
Debt securities in issue 3,081,187 1,532,642 246,659 299,945 249,887 752,054 -
Derivative financial instruments 140,733 - - - - - 140,733
Deposits 4,417,425 3,144,178 543,134 376,733 208,036 145,344 -
Preference shares 280,000 - - - - 280,000 -
Due to related entities 2,997,075 2,613,749 372,109 - - - 11,217
Other liabilities 62,106 - - - - - 62,106
Head office account 150,956 - - - - - 150,956
11,129,482 7,290,569 1,161,902 676,678 457,923 1,177,398 365,012
Interest rate derivatives
Swaps - 739,000 107,000 (420,000) (366,500) (59,500)
1,274,366 (423,584) 381,802 644,072 512,053 160,023
1,274,366 (423,584) (41,782) 602,290 1,114,343 1,274,366
The table below shows the repricing of assets and liabilities based on the earlier of repricing or contractual maturity date.
Banking Group
Repricing gap (interest bearing assets and liabilities)
Total financial assets
Total financial liabilities
Cumulative mismatch

Rabobank Nederland Disclosure Statement | 19
Notes to the Financial Statements17 Risks arising from financial instruments (continued)(c) Credit risk
(i) Maximum exposure to credit risk without taking account of any collateral and other credit enhancements
Credit exposures consist of: Banking GroupUnaudited
In thousands of NZD At 30/06/2014
Due from other financial institutions 200,497
Derivative financial instruments 130,802
Available-for-sale financial assets 535,095
Loans and advances 9,805,454
Due from related entities 1,504,081
Other financial assets 13,770
Commitments and guarantees 1,798,552
Total credit exposures 13,988,251
Analysis of credit exposures by industry: Banking GroupUnaudited
In thousands of NZD At 30/06/2014
Agriculture 10,126,113
Finance and insurance 1,815,513
Forestry and fishery 291,812
Government 535,542
Manufacturing 641,142
Property and business services 112,418
Wholesale trade 349,742
Other 115,969
Total credit exposures 13,988,251
Analysis of credit exposures by geographical areas: Banking GroupUnaudited
In thousands of NZD At 30/06/2014
Australia 247,876
The Netherlands 1,046,745
New Zealand 12,675,082
United States of America 18,548
Total credit exposures 13,988,251
(ii) Concentration of credit exposures to individual counterparties
At 30/06/2014
Peak for the quarter
Number of bank counterparties:
Percentage of shareholders' equity
10-15% - -
Number of non-bank counterparties:
Percentage of shareholders' equity
10-15% - -
Credit risk arises from the potential inability of a debtor or counterparty to meet their contractual obligations.Concentration of credit risk is determined by management to be by industry sector. Industry sectors are determined by referenceto the Australia and New Zealand Standard Industrial Classification (ANZSIC) Codes.
No material changes were made to the objectives, policies or processes from the prior year.
The following tables show the maximum exposure to credit risk for the components of the balance sheet and off balance sheet,including derivatives and commitments and guarantees by industry and geography.
Banking Group

20 | Rabobank Nederland Disclosure Statement
Notes to the Financial Statements
17 Risks arising from financial instruments (continued)(c) Credit risk (continued)
(ii) Concentration of credit exposures to individual counterparties (continued)
All non-bank counterparties included in the preceding table do not have a long-term credit rating.
(iii) Credit quality per class of financial assets
Past due
In thousands of NZD R0-R7 R8-R10 R11-R14 R15-R20 but not
impairedIndividually
impairedAt 30/06/2014 (Unaudited)
200,497 - - - - - 200,497
535,095 - - - - - 535,095
84,788 1,006,804 6,362,630 2,012,878 71,193 375,934 9,914,227
Total 820,380 1,006,804 6,362,630 2,012,878 71,193 375,934 10,649,819
Credit rating descriptionR0-R7
R8-R10
R11-R14R15-R20
18 Credit and market risk exposures and capital adequacy(a) Residential mortgagesResidential mortgages by loan-to-valuation ratio ("LVR") range
In thousands of NZDDrawn
amountsUndrawn amounts Total
At 30/06/2014 (Unaudited)LVR rangeDo not exceed 80% 33,790 8,504 42,294 Exceeds 80% and not 90% 12,108 1,762 13,870 Exceeds 90% 789 8 797 Total 46,687 10,274 56,961
Banking Group
Due from other financial institutions
Gross loans and advances (note 7)*
Available-for-sale financial assets (note 6)
Counterparties that currently have the capacity to meet financial commitments but are vulnerable to adversebusiness, financial or economic conditions. The higher the rating the more sensitive the counterparty is to adversechanges in business, financial or economic conditions.
The credit quality of financial assets is managed by the Banking Group using internal credit ratings. The table below shows thecredit quality by class of asset for all financial assets exposed to credit risk, based on the Banking Group's internal credit ratingsystem. The amounts presented are gross of impairment provisions.
Banking Group
Counterparties that have adequate capacity to meet current financial commitments to the Banking Group.
Neither past due nor impaired
Counterparties that are strong to extremely strong in meeting current and future financial commitments to theBanking Group.Counterparties that have adequate capacity to meet current and future financial commitments to the BankingGroup.
The peak end-of-day credit exposure is measured by taking the maximum end-of-day aggregate amount of credit exposure anddividing it by the Overseas Banking Group's equity.
Credit exposure is calculated on the basis of actual exposure net of individual credit impairment provision; and excludes creditexposures to Connected Persons; credit exposures to the central government of any country with a long-term credit rating of A- orA3 or above, or its equivalent; credit exposures to any bank with a long-term credit rating of A- or A3 or above, or its equivalent; andcredit exposures to an individual counterparty or a group of closely related counterparties if they are booked outside New Zealand.
The credit exposure is measured over the Overseas Banking Group's equity as at 31 December 2013.
Total
*Gross loans and advances exclude provisions for doubtful debts.

Rabobank Nederland Disclosure Statement | 21
Notes to the Financial Statements18 Credit and market risk exposures and capital adequacy (continued)(a) Residential mortgages (continued)
Reconciliation of mortgage related amounts Banking Group
Unaudited
In thousands of NZD At 30/06/2014
Loans and advances - residential mortgages 46,687
Plus: short term residential mortgages classified as overdrafts -
On-balance sheet residential mortgages exposures 46,687
Off-balance sheet residential mortgages exposures 10,274
Total residential mortgages exposures (as per LVR analysis) 56,961
(b) Market risk end-of-period notional capital charges
In thousands of NZD
At 30/06/2014 (Unaudited)
Interest rate risk 327,000 26,160
Foreign currency risk 33,250 2,660
Total 360,250 28,820
The Banking Group does not take any equity risk.
(c) Market risk peak end-of-day notional capital charges
In thousands of NZD
At 30/06/2014 (Unaudited)
Interest rate risk 453,500 36,280
Foreign currency risk 72,875 5,830
Total 526,375 42,110
The Banking Group does not take any equity risk.
(d) Method for deriving peak end-of-day notional capital charge
(e) Capital Ratios of Overseas Banking Group - Rabobank Nederland
2013 2012
At 31 December (Audited) % %
13.50% 13.10%
16.60% 17.20%
19.80% 19.00%
Minimum Capital Requirements
Rabobank Nederland's Capital Adequacy and Risk Management Report (pillar 3) are publicly available on: https://www.rabobank.com/en/images/Capital-Adequacy-and-Risk-Management-Report-2013.pdf
Tier one capital ratio
Total capital ratio
Rabobank Group is required by De Nederlandsche Bank (Dutch Central Bank) to hold minimum capital at least equal to that specified under Basel framework and those requirements imposed on it by the Dutch Central Bank have been met as at the reporting date.The Dutch Central Bank has granted Rabobank Group permission to determine the Basel II equity requirements in accordance withthe most advanced methods, i.e. the Advanced Internal Ratings Based approach. For this purpose, Rabobank Group has developedits own risk models over the past few years.
Banking Group
Core tier 1 capital ratio
The market risk information above has been derived in accordance with the "Capital Adequacy Framework" (Standardised Approach)(BS2A).
Notional capital charges
Implied risk weighted exposure
Banking GroupImplied risk weighted
exposureNotional capital
charges

22 | Rabobank Nederland Disclosure Statement
Notes to the Financial Statements19 Concentration of funding Total funding comprised:
Banking GroupUnaudited
In thousands of NZD At 30/06/2014Debt securities in issue 3,081,187
Deposits 4,417,425
Preference shares 280,000
Due to related entities 2,997,075
Other liabilities 62,106
Head office account 150,956
Total funding 10,988,749
Analysis of funding by industry:Banking Group
UnauditedIn thousands of NZD At 30/06/2014Agriculture 327,114
Finance and insurance 7,301,452
Personal and other services 3,322,777
Other 37,406
Total funding 10,988,749
Analysis of funding concentration by geographical areas:Banking Group
UnauditedIn thousands of NZD At 30/06/2014Australia 2,148,610
The Netherlands 1,461,505
New Zealand 7,378,045
United States of America 184
All other countries 405
Total funding 10,988,749
20 Additional information on statement of financial positionBanking Group
UnauditedIn thousands of NZD At 30/06/2014
12,038,836
10,764,470
-
BranchUnaudited
In thousands of NZD At 30/06/20144,154,687
Retail deposits of the Registered Bank in New Zealand -
Total interest earning and discount bearing assets
Total interest and discount bearing liabilities
Liabilities of the Registered Bank in New Zealand, net of amounts due to related entities
Financial assets pledged as collateral for liabilities or contingent liabilities

Rabobank Nederland Disclosure Statement | 23
Notes to the Financial Statements21 Fair value of financial instruments
Carrying Fair Carrying Fair Carrying FairIn thousands of NZD amount value amount value amount valueFinancial assetsDue from other financial institutions 200,497 200,497 230 230 37,063 37,063
Derivative financial instruments 130,802 130,802 200,457 200,457 111,210 111,210
Available-for-sale financial assets 535,095 535,095 557,107 557,107 585,555 585,555
Loans and advances 9,805,454 9,989,881 9,857,065 9,928,867 9,989,431 10,129,412
Due from related entities 1,504,081 1,528,765 1,239,418 1,279,273 1,392,997 1,434,563
Other financial assets 13,770 13,770 15,830 15,830 14,311 14,311
Total financial assets 12,189,699 12,398,810 11,870,107 11,981,764 12,130,567 12,312,114
Financial liabilitiesDue to other financial institutions - - 34,330 34,330 - -
Debt securities in issue 3,081,187 3,140,129 2,724,908 2,812,584 3,028,862 3,086,234
Derivative financial instruments 140,733 140,733 140,788 140,788 116,878 116,878
Deposits 4,417,425 4,434,986 4,267,881 4,300,882 4,332,808 4,363,492
Preference shares 280,000 303,800 280,000 295,680 280,000 301,000
Due to related entities 2,997,075 3,011,600 3,322,827 3,339,152 3,172,306 3,185,758
Other financial liabilities 62,106 62,106 60,486 60,486 61,287 61,287
Head office account 150,956 150,956 184,521 184,521 128,420 128,420
Total financial liabilities 11,129,482 11,244,310 11,015,741 11,168,423 11,120,561 11,243,069
At 30/06/2013 (Unaudited) At 31/12/2013 (Audited)Banking Group
The carrying value of due from other financial institutions, loans and advances and due from related entities is net of collective andspecific provisons. Fair values were calculated using discounted cash flow models using a discount rate reflecting market rates offeredfor loans of similar remaining maturities.
Due to other financial institutions, Debt securities in issue, Deposits and Due to related entities
Valuation methodology
At 30/06/2014 (Unaudited)
Other financial assets and Other financial liabilities
For all other financial assets and liabilities fair value approximates carrying value due to their short term nature, frequent repricing orhigh credit rating.
The estimated fair value of the financial assets and liabilities are:
Fair value of term deposits / debt securities are estimated using discounted cash flows, applying market rates offered for deposits /debt securities of similar remaining maturities.
For the following financial liabilities carried at amortised cost, an estimate of the fair value has been derived using the Level 1 hierarchy as follows:
Preference shares
The fair values are based on the NZDX closing prices of the preference shares at each period / year end.
Fair value of non-interest bearing, call and variable rate deposits / debt securities approximate their carrying value as they are shortterm in nature or payable on demand.
For the following financial assets and liabilities carried at amortised cost, an estimate of the fair value has been derived using the Level 3 hierarchy as follows:
Due from other financial institutions, Loans and advances and Due from related entities

24 | Rabobank Nederland Disclosure Statement
Notes to the Financial Statements21 Fair value of financial instruments (continued)
In thousands of NZD Level 1 Level 2 Level 3 TotalAt 30 June 2014 (Unaudited)Financial assetsDerivative financial instruments - 130,802 - 130,802
Available-for-sale financial assets 535,095 - - 535,095
Financial liabilitiesDerivative financial instruments - 140,733 - 140,733
In thousands of NZD Level 1 Level 2 Level 3 TotalAt 30 June 2013 (Unaudited)Financial assetsDerivative financial instruments - 200,457 - 200,457
Available-for-sale financial assets 557,107 - - 557,107
Financial liabilitiesDerivative financial instruments - 140,788 - 140,788
In thousands of NZD Level 1 Level 2 Level 3 TotalAt 31 December 2013 (Audited)Financial assetsDerivative financial instruments - 111,210 - 111,210
Available-for-sale financial assets 585,555 - - 585,555
Financial liabilitiesDerivative financial instruments - 116,878 - 116,878
Banking Group
Banking Group
Derivative financial instruments and Available-for-sale financial assets
Banking Group
Fair values are based on quoted market prices. Where a quoted price is not available, fair values are estimated using quoted marketprices for securities with similar credit, maturity and yield characteristics, or market accepted valuation models as appropriate(including discounted cash flow models) based on current market yields for similar types of instruments and the maturity of eachinstrument.
A Credit Valuation Adjustment (CVA) is applied to the Banking Group's over-the-counter derivative exposures to take into account thecounterparty’s risk of default when measuring the fair value of the derivative. The Banking Group uses a Bilateral Credit ValuationAdjustment (BCVA) methodology to calculate the expected future credit exposure for all derivative exposures including inputsregarding probabilities of default (PD) and loss given default (LGD).
Fair value hierarchy
The Banking Group uses the following hierarchy for determining and disclosing the fair value of financial assets and liabilities:Level 1: quoted prices in active markets for the same instrument. Level 2: quoted prices in active markets for similar assets or liabilities or other valuation techniques (i.e. discounted cash flows) forwhich all significant inputs are based on observable market data; andLevel 3: valuation techniques for which any significant input is not based on observable market data.
The following table categorise financial assets and liabilities that are recognised and measured at fair value, and the valuationmethodology according to the 3 levels of hierarchy.
For financial assets and liabilities carried at fair value, fair value has been derived using the Level 1 and Level 2 hierarchy as follows:

Rabobank Nederland Disclosure Statement | 25
Notes to the Financial Statements22 Additional information for Registered Bank’s Overseas Banking Group
2013 2012For the year ended 31 December (Audited) EURm EURmNet profit after income tax 2,012 2,058
Percentage (on a twelve month rolling basis) of average total assets 0.3% 0.3%
2013 2012At 31 December (Audited) EURm EURmTotal assets 674,139 750,710
% change over the previous twelve months -10.2% 2.6%
23 Reconciliation of profit after income tax to net cash flow from operating activities
Unaudited Unaudited Audited6 months to 6 months to Year to
In thousands of NZD 30/06/2014 30/06/2013 31/12/2013
Profit after income tax 72,256 89,714 172,554
Non-cash items 2,865 (29,882) (58,384)
Deferrals or accruals of past or future operating cash receipts or payments (45,543) (619,330) (847,928)
29,578 (559,498) (733,758)
24 Related party disclosures
(a) Transactions with related parties
(i) Guarantees
The first period
The second period
The third period
The fourth period
Whilst the Second Guarantee expired on 17 February 2010 all obligations incurred by RNZL during the Second Period will continueto be covered by the Second Guarantee until those obligations are repaid.
For the period 18 February 2010 to 17 February 2012 (“the Third Period”), the obligations of RNZL were guaranteed pursuant to adeed of guarantee dated 1 September 2009 by Rabobank Nederland in favour of the creditors of RNZL (the “Third Guarantee”).
Whilst the Third Guarantee expired on 17 February 2012 and all obligations incurred by RNZL during the Third Period will continueto be covered by the Third Guarantee until those obligations are repaid.
Whilst the Fourth Guarantee expired on 17 February 2013 and all obligations incurred by RNZL during the Fourth Period willcontinue to be covered by the Fourth Guarantee until those obligations are repaid.
Banking Group
Net cash flow provided by / (used in) operating activities
For the period 18 February 2012 to 17 February 2013 (“the Fourth Period”), the obligations of RNZL were guaranteed pursuant to adeed of guarantee dated 10 October 2011 by Rabobank Nederland in favour of the creditors of RNZL (the “Fourth Guarantee”).
For the period 18 February 2008 to 17 February 2010 (“the Second Period”), the obligations of RNZL were guaranteed pursuant to adeed of guarantee dated 6 February 2008 by Rabobank Nederland in favour of the creditors of RNZL (the “Second Guarantee”).
The Banking Group consists of RNZL, a wholly owned subsidiary of Rabobank International Holdings B.V. whose ultimate parent isRabobank Nederland; the Branch which is the New Zealand operations of Rabobank Nederland and RCSL. De Lage Landen Limitedand AGCO Finance Limited are related entities of the Banking Group, but are not included in the financial statements pursuant tothe conditions of registration as issued by the Reserve Bank of New Zealand. Dealings with the parent and ultimate controllingentity include funding, deposits and derivative transactions.
For the period 18 February 1998 to 17 February 2008 (“the First Period”), the obligations of RNZL were guaranteed pursuant to adeed of guarantee dated 18 February 1998 (as amended by an amending deed dated 19 February 1998) by Rabobank Nederland infavour of Permanent Trustee Company Limited (the “Trustee”) as trustee for the creditors of RNZL (the “First Guarantee”).
Whilst the First Guarantee expired on 17 February 2008 all obligations incurred by RNZL during the First Period will continue to becovered by the First Guarantee until those obligations are repaid.

26 | Rabobank Nederland Disclosure Statement
Notes to the Financial Statements24 Related party disclosures (continued)(a) Transactions with related parties (continued)
(i) Guarantees (continued)The fifth period
The current period
(ii) Management fees
(iii) Other transactions
(iv) Capital securities
(b) Terms and conditions of transactions with related parties
(c) Provision for impairment on due from related entities
25 Subsequent events
26 DividendNo dividend was proposed or paid by the Banking Group for the six month period ended 30 June 2014 (2013: Nil).
The Directors are not aware of any event or circumstance since the end of the period not otherwise dealt with in this report thathas or may significantly affect the operations of the Banking Group, the results of those operations or the state of affairs of theBanking Group in subsequent financial years.
For the period 18 February 2014 to 17 February 2015 (“the Current Period”), the obligations of RNZL are guaranteed pursuant to adeed of guarantee dated 20 August 2013 by Rabobank Nederland in favour of the creditors of RNZL (the “Current Guarantee”).
Except for the guarantees noted in note 24(a) above, all transactions with related parties are made in the ordinary course ofbusiness on normal terms and conditions.
For the period ended 30 June 2014, the Banking Group has not made any provision for impairment relating to amounts owed byrelated parties as the payment history has been excellent (2013: Nil). An impairment assessment is undertaken each financial year byexamining the financial position of the related party and the market in which the related party operates to determine whetherthere is objective evidence that a related party receivable is impaired. When such objective evidence exists, the Banking Grouprecognises a provision for impairment.
RCSL held $280 million capital securities which are debt obligations of Rabobank Nederland. The capital securities carry the rights toa quarterly distribution, which equals the five-year swap interest plus an annual 3.75% mark-up and was set at 8.7864% per annumon 25 May 2009. As from the issue date (27 May 2009), the distribution was made payable every quarter in arrears, for the first timeon 18 June 2009 (short first interest period). From 18 June 2014, the distribution is made payable every quarter based on five-yearswap interest plus an annual 3.75% mark-up and was set at 8.3425% per annum. From 18 June 2019, the distribution will be madepayable every quarter based on the 90-day bank bill swap interest rate plus an annual 3.75% mark-up. The capital securities are nottransferable and the scheduled repayment date is 18 June 2039. They are unsecured. All interest payments have been made on thedue date and there is no observable data that would indicate that an allowance for impairment is required.
The Banking Group enters into a number of transactions with other related entities within the Overseas Banking Group. Theseinclude funding, deposits and derivative transactions. The interest income earned on related entities transactions was $32.6 million(June 2013: $26.7 million - December 2013: $57.7million) , and the interest expense paid on related entities transactions was $24.8million (June 2013: $26.5 million - December 2013: $56.1 million). The principal amounts of due from and due to the parent andultimate controlling entity are separately disclosed in the statement of financial position and the accompanying notes to thefinancial statements.
Management fees were charged to the Banking Group by the Australian Branch of Rabobank Nederland $16.2 million (June 2013:$17.6 million - December 2013: $33.4million); Rabobank Nederland $4.3 million (June 2013: $5.0 million - December 2013: $9.5million); and DLL $0.02 million (June 2013: $0.07 million - December 2013: $0.1 million) for the provision of administrative andmanagement services.
For the period 18 February 2013 to 17 February 2014 (“the Fifth Period”), the obligations of RNZL are guaranteed pursuant to a deedof guarantee dated 9 July 2012 by Rabobank Nederland in favour of the creditors of RNZL (the “Fifth Guarantee”).
Whilst the Fifth Guarantee expired on 17 February 2014, all obligations incurred by RNZL during the Fifth Period will be covered bythe Fifth Guarantee until those obligations are repaid.

A member firm of Ernst & Young Global LimitedLiability limited by a scheme approved under Professional Standards Legislation
Ernst & Young680 George StreetSydney NSW 2000 AustraliaGPO Box 2646 Sydney NSW 2001
Tel: +61 2 9248 5555Fax: +61 2 9248 5959ey.com/au
Auditor’s Independent Review ReportTo the Shareholders/Members and Directors of Rabobank Nederland
We have reviewed pages1 to 26 of the Disclosure Statement for the six months ended 30 June 2014 of the NewZealand branch of Rabobank Nederland (the “Bank”), Rabobank New Zealand Limited and Rabo Capital SecuritiesLimited (together the “Banking Group”) which consists of the interim financial statements required by Clause 26of the Registered Bank Disclosure Statements (Overseas Incorporated Registered Banks) Order 2014 (asamended) (the ‘Order) and the supplementary information required by Schedules 3, 5, 7, 9, 10, 12 and 14 of theOrder. The interim financial statements comprise the statement of financial position as at 30 June 2014, thestatement of comprehensive income, statement of changes in equity and statement of cash flows for the sixmonths then ended, and a statement of accounting policies and other explanatory information for the Bankinggroup.
This report is made solely to the Bank’s Shareholders/Members and Directors. Our review has been undertaken sothat we might state to the Bank’s Shareholders/Members and Directors those matters we are required to state tothem in an independent auditor's review report and for no other purpose. To the fullest extent permitted by law,we do not accept or assume responsibility to anyone other than the Bank and the Bank’s Shareholders/Membersand Directors, for our review work, for this report, or for our findings.
Directors' ResponsibilitiesThe Directors of Rabobank Nederland (the “Directors”) are responsible for the Disclosure Statement whichincludes interim financial statements prepared in accordance with Clause 26 of the Order and that fairly presentthe financial position of the Banking Group as at 30 June 2014, and its financial performance and cash flows forthe six months ended on that date. The Directors are also responsible for such internal controls as they determineare necessary to enable the preparation of interim financial statements that are free from material misstatementwhether due to fraud or error.
In addition, the Directors are responsible for including supplementary information in the Disclosure Statementwhich complies with Schedules 3, 5, 7, 9, 10, 12 and 14 of the Order.
Reviewer’s ResponsibilitiesWe are responsible for reviewing the interim financial statements and the supplementary information, disclosed inaccordance with Clause 26, Schedules 3, 5, 7, 9, 10, 12 and 14 of the Order and presented to us by theShareholders/Members and Directors.
We are responsible for reviewing the interim financial statements (excluding the supplementary information) inorder to report to you whether, in our opinion on the basis of the procedures performed by us, anything has cometo our attention that would cause us to believe that the interim financial statements have not been prepared, inall material respects, in accordance with New Zealand Equivalent to International Accounting Standard 34:Interim Financial Reporting (“NZ IAS 34”) and do not fairly present the financial position of the Banking Group asat 30 June 2014 and its financial performance and cash flows for the six months ended on that date.
We are responsible for reviewing the supplementary information (excluding the supplementary informationrelating to credit and market risk exposures and capital adequacy) in order to report to you whether, in ouropinion on the basis of the procedures performed by us, anything has come to our attention that would cause usto believe that the supplementary information does not fairly state the matters to which it relates in accordancewith Schedules 3, 5, 7, 10, 12 and 14 of the Order.
We are responsible for reviewing the supplementary information relating to credit and market risk exposures andcapital adequacy in order to report to you whether, in our opinion on the basis of procedures performed by us,anything has come to our attention that would cause us to believe that the supplementary information relating tocredit and market risk exposures and capital adequacy is not in all material respects:
a) prepared in accordance with Capital Adequacy Framework (Standardised Approach) (BS2A); and
b) disclosed in accordance with Schedule 9 of the Order.

A member firm of Ernst & Young Global LimitedLiability limited by a scheme approved under Professional Standards Legislation
Page 2
Basis of Review OpinionA review is limited primarily to enquiries of the Banking Group’s personnel and analytical review proceduresapplied to financial data, and thus provides less assurance than an audit. We have not performed an audit on theinterim financial statements and, accordingly, we do not express an audit opinion.
We have reviewed the interim financial statements, and the supplementary information required by Schedules 3,5, 7, 9, 10, 12 and 14 of the Order, of the NZ Banking Group for the six months ended 30 June 2014 inaccordance with the Review Engagement Standards issued by the New Zealand Institute of CharteredAccountants. These standards require that we plan and perform the review to obtain moderate assurance as towhether the interim financial statements are free of material misstatement whether caused by fraud or error. Wealso evaluated the overall adequacy of the presentation of information in the interim financial statements.
Ernst & Young provides regulatory audit and other assurance related services to the Bank and Banking Group. Wehave no other relationship with, or interest in, the Bank and the Banking Group.
Partners and employees of our firm deal with the Banking Group on normal terms within the ordinary course oftrading activities of the business of the Banking Group. These matters have not impaired our independence asauditors of the Banking Group.
Statement of Review FindingsBased on our review, nothing has come to our attention that causes us to believe that:· the interim financial statements on pages 6 to 26 (excluding the supplementary information), which have
been prepared in all material respects in accordance with NZ IAS 34, do not fairly present the financialposition of the Banking Group as at 30 June 2014 and its financial performance and cash flows for the sixmonth period ended on that date;
· the supplementary information (excluding the supplementary information relating to credit and market riskexposures and capital adequacy) prescribed by Schedules 3, 5, 7, 10, 12 and 14 of the Order, does notfairly state the matters to which it relates in accordance with those Schedules; and
· the supplementary information relating to credit and market risk exposures and capital adequacy prescribedin Schedule 9 of the Order, is not, in all material respects:
o prepared in accordance with Capital Adequacy Framework (Standardised Approach) (BS2A);and
o disclosed in accordance with Schedule 9 of the Order.
Our review was completed on 22 August 2014 and our findings are expressed as at that date.
Ernst & Young22 August 2014Sydney


