253
Race and entRepReneuRial SucceSS Black- Asian- and White-Owned Businesses in the United States Robert W. Fairlie and Alicia M. Robb
| Date post: | 01-Jun-2018 |
| Category: |
Documents |
| Upload: | apmendez317 |
| View: | 216 times |
| Download: | 0 times |

8/9/2019 Race and Entrepreneurial Success - Black , Asian, And White Owned Business in the United States
http://slidepdf.com/reader/full/race-and-entrepreneurial-success-black-asian-and-white-owned-business 1/253
Race and
entRepReneuRial
SucceSS
Black-
Asian-and
White-Owned
Businesses
in the
United States
Robert W. Fairlie and Alicia M. Robb

8/9/2019 Race and Entrepreneurial Success - Black , Asian, And White Owned Business in the United States
http://slidepdf.com/reader/full/race-and-entrepreneurial-success-black-asian-and-white-owned-business 2/253
Race and Entrepreneurial Success

8/9/2019 Race and Entrepreneurial Success - Black , Asian, And White Owned Business in the United States
http://slidepdf.com/reader/full/race-and-entrepreneurial-success-black-asian-and-white-owned-business 3/253

8/9/2019 Race and Entrepreneurial Success - Black , Asian, And White Owned Business in the United States
http://slidepdf.com/reader/full/race-and-entrepreneurial-success-black-asian-and-white-owned-business 4/253
Race and Entrepreneurial Success
Black-, Asian-, and White-Owned Businesses in the United States
Robert W. Fairlie and Alicia M. Robb
The MIT Press
Cambridge, Massachusetts
London, England

8/9/2019 Race and Entrepreneurial Success - Black , Asian, And White Owned Business in the United States
http://slidepdf.com/reader/full/race-and-entrepreneurial-success-black-asian-and-white-owned-business 5/253
( 2008 Massachusetts Institute of Technology
All rights reserved. No part of this book may be reproduced in any form by any elec-tronic or mechanical means (including photocopying, recording, or information storageand retrieval) without permission in writing from the publisher.
For information about special quantity discounts, please e-mail [email protected].
This book was set in Palatino on 3B2 by Asco Typesetters, Hong Kong.Printed and bound in the United States of America.
Library of Congress Cataloging-in-Publication Data
Fairlie, Robert W.Race and entrepreneurial success : Black-, Asian-, and white-owned businesses in theUnited States / Robert W. Fairlie and Alicia M. Robb.
p. cm.Includes bibliographical references and index.ISBN 978-0-262-06281-7 (hardcover : alk. paper)1. Minority business enterprises—United States. 2. African American business
enterprises. 3. Asian American business enterprises. 4. Entrepreneurship—UnitedStates. 5. Small business—United States. 6. Success in business—United States. I. Robb,Alicia M. II. Title.HD2358.5.U6F35 2008338.6 0420890973—dc22 2008005535
10 9 8 7 6 5 4 3 2 1

8/9/2019 Race and Entrepreneurial Success - Black , Asian, And White Owned Business in the United States
http://slidepdf.com/reader/full/race-and-entrepreneurial-success-black-asian-and-white-owned-business 6/253
Contents
Preface ix
1 Introduction 1
Racial Patterns in Business Outcomes 1
Outline of This Book 7
Main Findings of the Research 9
2 Racial Disparities in Business Ownership and Outcomes 13
Racial Differences in Business Ownership 14Recent Trends in Business Ownership 15
Racial Trends over the Twentieth Century 20
Explanations for Racial Differences in Business Ownership 21
Trends in the Number of Minority-Owned Businesses 27
Comparison of SBO/SMOBE and CPS Estimates 29
Racial Patterns and Trends in Business Outcomes 33
Racial Differences in Business Outcomes: Evidence from the CBO 41
Estimates from Other Business-Level Data Sources 45
Differences across Asian and Latino Groups 45
Conclusions 47
3 The Determinants of Small Business Success 49
Education 51
Family-Business Background 53
Evidence from the CBO on Intergenerational Links in Business
Ownership 54
Work Experience in Family Businesses 56Business Inheritances 56
Intergenerational Links, Family-Business Backgrounds, and Business
Success 58

8/9/2019 Race and Entrepreneurial Success - Black , Asian, And White Owned Business in the United States
http://slidepdf.com/reader/full/race-and-entrepreneurial-success-black-asian-and-white-owned-business 7/253
Other Forms of Business Human Capital 59
Identifying the Determinants of Business Outcomes: Regression
Results 61
Educational Effects 66
The Effects of Family-Business Background on Outcomes 67
Other Forms of Business Human Capital 69
Profits 70
Gender Issues 71
Examining the Sensitivity of Results to Alternative Sample
Definitions 77
Correcting for Missing Data: Multiple Imputation 80
Startup Capital 81
Industry 84
Startup Capital and Industry Estimates 87
Age of the Business 90
Conclusions 91
Appendixes 93
Estimating the Intergenerational Transmission in Business
Ownership 93
4 Why Are African American-Owned Businesses Less
Successful? 97
Racial Differences in Education 99
Family-Business Background 101
Racial Differences in Family-Business Experience 103
Racial Differences in Business Human Capital 106
Financial Capital 107
Black/White Differences in Wealth 108
Family Wealth 112
Lending Discrimination 113
Differential Types of Financing 114
Racial Differences in Startup Capital 117
Industry Differences 119
Identifying the Causes of Black/White Differences in Business
Outcomes 121
Differences between Male and Female Business Owners 125
Contributions from Startup Capital and Industry Differences 130Other Potential Explanations: Consumer Discrimination 132
Networks 133
vi Contents

8/9/2019 Race and Entrepreneurial Success - Black , Asian, And White Owned Business in the United States
http://slidepdf.com/reader/full/race-and-entrepreneurial-success-black-asian-and-white-owned-business 8/253
Conclusions 136
Appendixes 138
Nonlinear Decomposition Method 138
5 Why Are Asian-Owned Businesses More Successful? 145
Social Capital and Ethnic Resources 147
Human, Financial, and Other Types of Capital 149
Educational Differences 149
Family-Business Experience 151
Differences in Business Human Capital 153
Wealth Differences 155
Types of Financing 155Startup Capital 158
Industry Differences 159
Hours Worked 161
Asian Subgroups 163
Identifying the Causes of Asian/White Differences in Business
Outcomes 167
Conclusions 172
Appendix 173
6 Conclusions and Implications 175
Financial Capital 177
Family-Business Experience 179
Human Capital 181
Policy Implications 182
New Policy Ideas 185
Data Appendix 189The Survey of Business Owners (SBO) and the Survey of Minority-
Owned Business Enterprises (SMOBE) 190
The Characteristics of Business Owners (CBO) 197
The Current Population Survey (CPS) 199
Individual- versus Business-Level Data 201
Additional Data Sources for Studying Minority-Owned Businesses 203
Summary 204
Notes 207
References 215
Index 231
Contents vii

8/9/2019 Race and Entrepreneurial Success - Black , Asian, And White Owned Business in the United States
http://slidepdf.com/reader/full/race-and-entrepreneurial-success-black-asian-and-white-owned-business 9/253
8/9/2019 Race and Entrepreneurial Success - Black , Asian, And White Owned Business in the United States
http://slidepdf.com/reader/full/race-and-entrepreneurial-success-black-asian-and-white-owned-business 10/253
Preface
Interest in entrepreneurship is growing around the world. Althoughour understanding of what leads to entrepreneurial success has
improved, we know less about why some racial groups succeed in
business while others struggle. In writing this book, we were interested
in figuring out why Asian American-owned businesses perform rela-
tively well on average and the businesses owned by African Americans
typically do not perform as well. An important concern is whether
these racial patterns in business performance are both a symptom and
cause of broader racial inequalities in the United States. Along theway, we also became very interested in exploring the more general
question of why some small businesses succeed and others fail and
how success is related to the human-capital, financial-capital, and
family-business background of the entrepreneur.
The main goal of the book is to provide a comprehensive com-
parative analysis of the performance of African American-, Asian
American-, and white-owned businesses in the United States. We hope
that it will serve as a useful informational source for policymakers and business leaders as well as a valuable research and instructional tool
for professors and students. In researching the book, we were sur-
prised to learn that there were no studies or reports in the literature
that provided thorough information on recent trends in minority-
business ownership rates and outcomes. We present a new compila-
tion of data on minority entrepreneurship over the past few decades
as well as a detailed analysis of confidential data from the U.S. Census
Bureau. We hope that anyone interested in learning more about racial
trends in business ownership and outcomes, the determinants of suc-cessful entrepreneurship, and the causes of racial disparities in busi-
ness performance will find what they need in this book.

8/9/2019 Race and Entrepreneurial Success - Black , Asian, And White Owned Business in the United States
http://slidepdf.com/reader/full/race-and-entrepreneurial-success-black-asian-and-white-owned-business 11/253
We started this research project many years ago when we applied to
the Center for Economic Studies to use the confidential and restricted-
access Characteristics of Business Owners data. Given a project of this
length, there are many people to thank for providing comments, sug-
gestions, and criticisms. We thank Timothy Bates, Ken Brevoort,
Anthony Caruso, Ken Couch, Mark Doms, Tom Dunn, Lingxin Hao,
Brian Headd, James Jarzabkowski, Leora Klapper, Lori Kletzer,
Rebecca London, Ying Lowrey, Justin Marion, Kevin Moore, Richard
Moore, Chad Moutray, Charles Ou, Robert Strom, Valerie Strang,
Kathryn Tobias, John Wolken, and Donald Wittman.
We also thank participants at the numerous conferences, workshops,
and seminars at which we presented the research discussed in this book. They include the American Economic Association Meetings;
Baruch College; Board of Governors of the Federal Reserve System;
California State University Moss Landing Marine Laboratory; Con-
sulate General of Sweden at the University of Southern California;
Dartmouth College; Federal Reserve System’s Community Affairs Re-
search Conference; Harvard University; National Academy of Sciences
Panel on Measuring Business Formation, Dynamics, and Performance;
National Bureau of Economic Research Workshop on Entrepreneurship;United States Association for Small Business and Entrepreneurship
Meetings; RAND; United States Small Business Administration; SBA
and the Kauffmann Foundation Conference on Entrepreneurship in
the Twenty-first Century; University of Amsterdam Entrepreneurship
and Human Capital Conference; University of California at Santa
Barbara; University of California at Santa Cruz; University of Mary-
land; University of North Carolina Minority Entrepreneurship Boot
Camp; University of North Carolina Research Conference on Entrepre-
neurship among Minorities and Women; University of Washington
Business Diversity Conference; Urban Institute; Yale University.
We thank Bill Koch, Garima Vasishtha, Oded Gurantz, and Matt Jen-
nings for providing excellent research assistance. We are also grateful
for funding from the Russell Sage Foundation and Kauffman Founda-
tion. The views expressed here are solely ours and do not necessarily
reflect the views of either foundation. Finally, we thank Rebecca Lon-
don, Zoe and Jessica Fairlie, and Mark Doms for their patience and
support during the past several years of writing this book.
x Preface

8/9/2019 Race and Entrepreneurial Success - Black , Asian, And White Owned Business in the United States
http://slidepdf.com/reader/full/race-and-entrepreneurial-success-black-asian-and-white-owned-business 12/253
Race and Entrepreneurial Success

8/9/2019 Race and Entrepreneurial Success - Black , Asian, And White Owned Business in the United States
http://slidepdf.com/reader/full/race-and-entrepreneurial-success-black-asian-and-white-owned-business 13/253
8/9/2019 Race and Entrepreneurial Success - Black , Asian, And White Owned Business in the United States
http://slidepdf.com/reader/full/race-and-entrepreneurial-success-black-asian-and-white-owned-business 14/253
1 Introduction
Racial inequality in education, income, and wealth are well known.Less understood are the large and persistent racial disparities in busi-
ness ownership and performance in the United States. The lack of at-
tention is surprising, given the magnitude of these racial differences
and the importance of business ownership as a way to make a living
for many Americans. More than one in ten workers, or 13 million peo-
ple, in the United States are self-employed business owners. These 13
million business owners hold an amazing 37.4 percent of total U.S.
wealth (Bucks, Kennickell, and Moore 2006). Yet only 5.1 percent of African American workers and 7.5 percent of Latino workers own
businesses compared with more than 11 percent of white and Asian
workers. Low rates of business ownership among African Americans
have also persisted over the entire twentieth century, and recent trends
indicate that racial disparities in business-ownership rates will not dis-
appear in the near future.
Racial Patterns in Business Outcomes
Although racial disparities in business ownership are troubling, per-
haps a more important concern is that businesses owned by dis-
advantaged minorities tend to be smaller and less successful than
nonminority-owned businesses. On average, black- and Latino-owned
businesses have lower sales, hire fewer employees, and have smaller
payrolls than white-owned businesses (U.S. Census Bureau 2006b).
Firms owned by African Americans also have lower profits and higher
closure rates than those owned by whites (U.S. Census Bureau 1997).For most outcomes, these disparities are large. For example, white-
owned firms have average annual sales of $439,579, compared with
only $74,018 for black-owned firms (U.S. Census Bureau 2006b). There

8/9/2019 Race and Entrepreneurial Success - Black , Asian, And White Owned Business in the United States
http://slidepdf.com/reader/full/race-and-entrepreneurial-success-black-asian-and-white-owned-business 15/253
certainly are a large number of very successful black-owned businesses
in the United States, many with revenues of more than $250,000 per
year.1 But a substantial proportion of black firms are less successful,
leading to average outcomes that are worse than for white firms. In
contrast to these patterns, Asian American-owned firms have average
outcomes more similar to—and in some cases better than—those of
white-owned firms. Overall, these racial patterns in business outcomes
have remained roughly unchanged over the past two decades.
Improving the performance of minority-owned businesses in the
United States is a major concern among policymakers. Although they
are sometimes controversial, various federal, state, and local govern-
ment programs offer contracting set-asides, price discounts, and loansto businesses owned by minorities, women, and other disadvan-
taged groups (Boston 1999b; Joint Center for Political and Economic
Studies 1994). One of the goals of these programs is to foster minority-
business development, which may have implications for reducing
earnings and wealth inequalities (Bradford 2003). Self-employed busi-
ness owners earn more on average than wage and salary workers
(Borjas 1999), and disadvantaged business owners have more upward
income mobility and experience faster earnings growth than disadvan-taged wage and salary workers (Holtz-Eakin, Rosen, and Weathers
2000; Fairlie 2004b). It has also been argued that some disadvantaged
groups facing discrimination or blocked opportunities in the wage and
salary sector—such as Chinese, Japanese, Jewish, Italian, and Greek
immigrants—have used business ownership as a source of economic
advancement.2 More recently, the economic mobility of Koreans has
been linked to business ownership (Min 1996).3
Another concern, which is often overlooked, is the loss in economicefficiency resulting from blocked opportunities for minorities to start
and grow businesses. Business formation has been associated with the
creation of new industries, innovation, job creation, improvement in
sector productivity, and economic growth (Reynolds 2005). If minority
entrepreneurs face liquidity constraints, discrimination, or other bar-
riers to creating new businesses or expanding current businesses, there
is some loss of efficiency in the economy.4 Although it is difficult to
determine the value of these losses, barriers to entry and expansion
that minority-owned businesses face are potentially costly to U.S. pro-ductivity, especially as minorities represent an increasing share of the
total population. Barriers to business growth may be especially dam-
aging for job creation in poor neighborhoods (Boston 1999b, 2006b).
2 Chapter 1
8/9/2019 Race and Entrepreneurial Success - Black , Asian, And White Owned Business in the United States
http://slidepdf.com/reader/full/race-and-entrepreneurial-success-black-asian-and-white-owned-business 16/253
Minority firms in the United States hire more than 4.7 million employ-
ees, a disproportionate share of them minorities (U.S. Census Bureau
1997, 2006b), and many of these jobs are located in disadvantaged
communities.
A growing body of literature attempts to address these concerns
by exploring the causes of racial disparities in business ownership.
Human, financial, and social capital appear to be the main driving
forces behind racial differences in rates of business ownership. For
example, previous research focusing on blacks indicates that rela-
tively low levels of education, assets, and parental self-employment
are partly responsible for their low rates of business ownership (Bates
1997; Fairlie 1999; Hout and Rosen 2000). Less is known about theunderlying causes of racial differences in business outcomes such as
profits, sales, and employment. The lack of evidence is surprising
given that the benefits of improving minority-business performance
are unambiguous compared with the benefits of simply increasing
rates of business ownership among minority businesses.5 The limited
previous research on the topic indicates that the owner’s education
level and startup capital have been found to contribute to racial differ-
ences in business closures and profits (Bates 1997).To get an idea of the potential importance of access to financial capi-
tal in contributing to racial disparities in business ownership and out-
comes, one only has to look at the alarming levels of wealth inequality
that exist in the United States (U.S. Census Bureau 2005a). Half of all
blacks have less than $6,200 in wealth. Wealth levels among whites
and Asians are 11 times higher. Low levels of wealth among disadvan-
taged minorities are likely to translate into less successful businesses
because the owner’s wealth can be invested directly in the business
or used as collateral to obtain business loans. Lending discrimination
can exacerbate this problem by further restricting access to capital
(Blanchflower, Levine, and Zimmerman 2003; Cavalluzzo, Cavalluzzo,
and Wolken 2002).
Another contributing factor is racial disparities in education. Fewer
than 20 percent of blacks have a college education, compared with
nearly 30 percent of whites. Asians have even higher levels of educa-
tion: nearly 50 percent of Asians, whether born abroad or in the United
States, are college educated. The general and specific knowledge andskills acquired through formal education may be useful for running a
successful business. If this is the case, racial differences in the education
levels of the owners will lead to racial disparities in business outcomes.
Introduction 3
8/9/2019 Race and Entrepreneurial Success - Black , Asian, And White Owned Business in the United States
http://slidepdf.com/reader/full/race-and-entrepreneurial-success-black-asian-and-white-owned-business 17/253
The legacy of slavery and historical discrimination underlies another
concern about current disparities in the performance of black- and
white-owned firms. Blacks made scant progress in rates of business
ownership throughout the twentieth century, even in light of their sub-
stantial gains in education, earnings, and civil rights. The ratio of white
to black self-employment rates remained roughly constant at 3 to 1
over the twentieth century (Fairlie and Meyer 2000) with only slight
improvements shown in the past several years. Why was there no con-
vergence in racial self-employment rates over the twentieth century?
Early researchers emphasized the role that past inexperience in busi-
ness played in creating low rates of business ownership among blacks.
Du Bois (1899) and later Myrdal (1944), Cayton and Drake (1946), andFrazier (1957) identify the lack of black traditions in business enter-
prise as a major cause of low levels of black business ownership at the
time of their analyses.
The argument for the importance of black traditions in business
relies on evidence of a strong intergenerational link in business owner-
ship; that is, the children of business owners are more likely than those
of nonbusiness owners to own businesses. We might expect the inter-
generational link to be strong because working in a family business isan excellent way to acquire general business or managerial experience
that is later useful for starting and running a successful business. Chil-
dren who choose to work in an industry similar to that of their family’s
business may also acquire industry- or firm-specific expertise (learning
how to run a restaurant by working in their parents’ restaurant, for
example). The inheritance of a family-owned business and correlations
among family members in entrepreneurial preferences may also con-
tribute to intergenerational links in business ownership. Indeed, a
few recent studies find that the likelihood of being a self-employed
business owner is substantially higher among the children of business
owners than among the children of nonbusiness owners (Lentz and
Laband 1990; Fairlie 1999; Dunn and Holtz-Eakin 2000; Hout and
Rosen 2000). Current racial patterns in self-employment rates are also
in part determined by racial patterns of self-employment rates in the
previous generation (Fairlie 1999; Hout and Rosen 2000).
Although the previous literature provides evidence that racial dis-
parities in financial-capital, human-capital, and family-business back-grounds contribute to the likelihood that some minority groups will
not own businesses, less is known about whether these factors also
contribute to racial differences in business performance. The standard
4 Chapter 1

8/9/2019 Race and Entrepreneurial Success - Black , Asian, And White Owned Business in the United States
http://slidepdf.com/reader/full/race-and-entrepreneurial-success-black-asian-and-white-owned-business 18/253
theoretical model of entrepreneurship posits that human capital and
access to financial capital are two of the most important determinants
of the entrepreneurial decision (Evans and Jovanovic 1989), and these
types of capital are clearly inputs in the production process potentially
affecting performance. But we know little about the business conse-
quences of racial disparities in these factors. Although owner’s educa-
tion and access to financial capital have been identified as contributing
to racial differences in closure rates and profits, the relative importance
of these factors is unknown. Ideally, one would like an estimate of how
much of the racial differences in several business outcomes can be
explained by each factor and whether, for example, racial differences
in access to startup capital are more detrimental to business successthan are racial differences in human capital.
Knowledge about the importance of family-business backgrounds is
especially lacking. In particular, the intergenerational transmission of
business ownership is found to contribute to racial disparities in rates
of business ownership, but whether it also contributes to racial dispar-
ities in business outcomes conditioning on ownership is unknown. For
example, can differences in family-business backgrounds explain why
black-owned businesses underperform white-owned firms on average?Can they explain why Asian-owned firms have better outcomes than
other racial groups? If they do contribute to racial disparities in out-
comes, how do they contribute? Do family businesses primarily pro-
vide an opportunity for would-be entrepreneurs to acquire general
and specific business human capital, or are inheritances and correlated
preferences more important? Very little is currently known about the
exact mechanisms that drive the intergenerational relationship in busi-
ness ownership and outcomes.
The previous literature has not explored these questions in depth
partly because of the lack of available data. The primary difficulty is
finding a nationally representative dataset that includes a large enough
sample of minority-owned businesses, information on business out-
comes, and the family-business background of the owner. An excep-
tion is the Characteristics of Business Owners (CBO), conducted by the
U.S. Census Bureau, which contains detailed information on the char-
acteristics of owners and firms. To our knowledge, it is the only dataset
that includes large samples of minority-owned firms and informationon family-business ownership, prior work experience in family busi-
nesses, prior work experience in similar businesses, and business
inheritances.
Introduction 5

8/9/2019 Race and Entrepreneurial Success - Black , Asian, And White Owned Business in the United States
http://slidepdf.com/reader/full/race-and-entrepreneurial-success-black-asian-and-white-owned-business 19/253
In this study, we use CBO data to explore the role that racial differ-
ences in financial-capital, human-capital, and family-business back-
grounds play in contributing to racial disparities in small business
outcomes, such as closure rates, profits, employment, and sales. Low
levels of education and wealth may limit the ability of disadvantaged
minorities to start successful businesses. The inability of minorities to
acquire general and specific business human capital through exposure
to businesses owned by family members may also contribute to their
limited success in business ownership. The richness of these data
allows us to examine the contributions of many additional owner and
business characteristics in racial disparities in business outcomes. Un-
like individual-level datasets, such as the Census of Population andthe Current Population Survey, the CBO contains detailed information
on both business and owner, allowing us to explore the determinants
of several different business outcomes.
Although the CBO provides an excellent dataset for exploring the
underlying causes of racial differences in business outcomes, it has
been used by only a handful of researchers. The lack of use appears to
be due primarily to difficulties in obtaining access, using, and report-
ing results from these confidential and restricted-access data. All re-search using the CBO must be conducted in a Census Research Data
Center or at the Center for Economic Studies (CES) after approval by
the CES and the Internal Revenue Service (IRS), and all output must
pass strict disclosure regulations.
Another contribution of the study is to provide a new compilation of
estimates of racial patterns of business-ownership rates and business
outcomes. Surprisingly, there is no comprehensive source of informa-
tion on recent trends in minority businesses in the literature. Combin-
ing estimates from the most widely used and respected sources of
government data, we provide an assessment of the state of minority
business in the United States. Estimates of business-ownership rates
and performance are generated from public-use and restricted-access
microdata taken from published sources and obtained from special
tabulations prepared for us by the U.S. Census Bureau.
The focus of the analysis is on African American- and Asian
American-owned businesses. Estimates presented later in this study in-
dicate that Asian American-owned businesses have the best averageoutcomes of all major racial groups. In contrast, the average outcomes
of businesses owned by African Americans are at the low end of all
groups. Although a sizeable body of research has focused on why
6 Chapter 1

8/9/2019 Race and Entrepreneurial Success - Black , Asian, And White Owned Business in the United States
http://slidepdf.com/reader/full/race-and-entrepreneurial-success-black-asian-and-white-owned-business 20/253
there are few black-owned businesses, very little research focuses on
the causes of their relative underperformance. Furthermore, relatively
little research using business-level data focuses on the performance
of Asian American-owned firms. We also present statistics on recent
trends in business outcomes for Latino-owned businesses but do not
explore the causes of differences between firms owned by Latinos and
those owned by whites because we do not find notable differences in
average outcomes in the CBO data used. Thus, the analysis of CBO
microdata focuses on identifying why Asian-owned businesses have
the best and black-owned businesses have the worst average outcomes
of all major racial and ethnic groups. The answers to these questions
have important policy implications, given the importance of successful business ownership for income generation, wealth accumulation, job
creation, and economic development.
Outline of This Book
The main goals of this book are to (1) document recent trends in busi-
ness ownership and outcomes by race using the most up-to-date and
respected sources of government data, (2) identify the owner and busi-ness characteristics associated with business success, (3) explore poten-
tial explanations for the relative underperformance of black-owned
businesses, and (4) explore potential explanations for the relative suc-
cess of Asian-owned businesses. The findings from this analysis of
racial differences in business outcomes are useful for characterizing the
state of minority-owned businesses in the United States.
Chapter 2 documents recent trends in racial patterns in business
ownership and performance using the most up-to-date and widely
used government data on minority-owned businesses, the Survey of
Minority-Owned Business Enterprises (SMOBE) and the Survey of
Business Owners (SBO), and on self-employed business owners, the
Current Population Survey (CPS). These datasets are described in
detail in the book’s data appendix. We first provide new estimates of
recent trends in business ownership rates by race and ethnicity from
the CPS and a brief review of previous literature examining the causes
of racial differences in business ownership. Estimates from CPS micro-
data improve on published estimates from the same source by theU.S. Bureau of Labor Statistics that do not include incorporated busi-
ness owners. Using the SMOBE, SBO, and CBO, we provide estimates
of recent trends in business outcomes by race. Racial differences in
Introduction 7

8/9/2019 Race and Entrepreneurial Success - Black , Asian, And White Owned Business in the United States
http://slidepdf.com/reader/full/race-and-entrepreneurial-success-black-asian-and-white-owned-business 21/253
sales, profits, employment, payroll, and closure rates are documented
and discussed. Estimates from published sources, public-use and
restricted-access microdata, and special tabulations created for us by
the Census Bureau are combined to provide a comprehensive picture
of the performance of minority-owned businesses in the United States.
The compilation of estimates of business outcomes by race over the
past two decades presented here is new and makes definitions as com-
parable as possible over time.
Although a large body of literature examines the causes of racial dif-
ferences in rates of business ownership, much less is known about the
causes of racial differences in business outcomes, such as survivability,
profits, employment, and sales. Examining the factors associated withsuccessful businesses is the first step in identifying the causes of racial
differences in business outcomes outlined in chapter 2. Chapter 3 pro-
vides a detailed analysis of the determinants of small business success
using confidential and restricted-access CBO microdata. We examine
the owner and business characteristics associated with higher sales
and profits, more employment, and a lower likelihood of closure
among small businesses. In addition to examining more traditional
determinants, such as owner’s education and financial capital, weexamine whether family-business backgrounds are important in pre-
dicting business success. We estimate the independent effects for small
business outcomes of having a self-employed family member, of hav-
ing prior work experience in that family member’s business, and of
inheriting a business. The results have implications for the importance
to business success of general and specific business human capital and
of correlations in entrepreneurial preferences across family members.
To identify measurable and causal factors affecting business success,
we focus on parsimonious models for business outcomes common in
the economics literature.
Building on the findings from chapter 3 on the determinants of busi-
ness success, chapter 4 employs a special decomposition technique to
identify the underlying causes of differences in business outcomes be-
tween African American- and white-owned firms. The decomposition
technique provides estimates of how much each factor explains of the
racial gaps in business outcomes. Black-owned businesses are found to
have lower revenues and profits, to hire fewer employees, and to bemore likely to close than white-owned businesses. We explore the role
that owner’s education, financial capital, family-business backgrounds,
and other owner and firm characteristics play in creating racial dis-
8 Chapter 1

8/9/2019 Race and Entrepreneurial Success - Black , Asian, And White Owned Business in the United States
http://slidepdf.com/reader/full/race-and-entrepreneurial-success-black-asian-and-white-owned-business 22/253
parities in small business outcomes. Do black business owners have
limited opportunities to acquire general and specific business human
capital by working in a family-owned business or inheriting a busi-
ness, in addition to having less education and less access to financial
capital?
Estimates from CBO microdata indicate that Asian-owned busi-
nesses have better outcomes, on average, than white-owned busi-
nesses. Chapter 5 explores why Asian-owned firms have higher sales
and profits, are more likely to hire employees, and are less likely to
close than white-owned firms. The oversample of Asian-owned firms
in the CBO allows us to explore whether the relative success of these
firms is because of higher levels of human and financial capital, advan-taged family-business backgrounds, or other factors. We use estimates
of the determinants of small business outcomes identified in chapter 3
and the decomposition technique described in chapter 4 for this analy-
sis. The results for Asian Americans are important because only a few
previous studies in the literature explore business outcomes for this
group using nationally representative business-level data.
Chapter 6 concludes by reviewing the findings from our analysis of
racial patterns in business outcomes from CBO, SMOBE, SBO, andCPS data. Policy implications of the results are also briefly discussed.
Main Findings of the Research
The main findings from our analysis of racial differences in business
outcomes are as follows.
1. African Americans and Latinos are substantially less likely to own a
business than are whites and Asian Americans. Estimates from 2006CPS microdata indicate that 11.1 percent of white workers and 11.8
percent of Asian workers are self-employed business owners, whereas
only 5.1 percent of black workers and 7.5 percent of Latino workers
are business owners. In the past few years, however, there is some evi-
dence of rising black and Latino business-ownership rates.
2. Black-owned businesses have lower sales and profits, hire fewer
employees, have smaller payrolls, and have higher closure rates than
white-owned businesses. For most outcomes, the disparities are ex-tremely large. For example, estimates from the 2002 SBO indicate that
white-owned firms have average sales of $439,579 compared with only
$74,018 for those owned by blacks.
Introduction 9

8/9/2019 Race and Entrepreneurial Success - Black , Asian, And White Owned Business in the United States
http://slidepdf.com/reader/full/race-and-entrepreneurial-success-black-asian-and-white-owned-business 23/253
3. Although white firms generally outperform Asian firms when
examining data for all businesses, Asian firms clearly have the
strongest performance among all major racial and ethnic groups after
removing small-scale businesses. Estimates from 1992 CBO microdata
indicate that Asian-owned firms have higher sales and profits, are
more likely to hire employees, and are less likely to close than white-
owned firms.
4. Estimates from the SBO/SMOBE data also indicate substantially
worse outcomes among Latino-owned firms than white-owned firms.
Latino-owned businesses have lower average sales, are less likely to
hire employees, and hire fewer employees than white-owned busi-
nesses. Estimates from our CBO sample, however, do not reveal large
disparities in business outcomes between Latino-owned firms and
white-owned firms.
5. Trends in minority business outcomes do not indicate improvement
relative to white business outcomes in the past two decades.
6. Intergenerational links in business ownership are strong. Estimates
from the CBO indicate that more than half of all business owners had
a self-employed family member prior to starting their business. Wherethere was a self-employed family member, fewer than half of small
business owners worked in that family member’s business. On the
other hand, only a very small percentage of all small businesses were
inherited.
7. Estimates from regression models for small business outcomes con-
ditioning on business ownership indicate that having a self-employed
family member plays only a minor role. In contrast, prior work experi-
ence in that family member’s business has a large positive effect on
business outcomes. Working in a family member’s business may pro-
vide opportunities for acquiring valuable specific and general business
human capital. Regression estimates also indicate that inherited busi-
nesses are more successful on average than noninherited businesses,
but their limited representation in the population of small businesses
suggests that they are not a major determinant of business outcomes.
8. We also find evidence that other forms of human capital and busi-
ness human capital—the owner’s education level and prior work expe-
rience in a business whose goods and services were similar to those
provided by the owner’s business—are important determinants of
business outcomes.
10 Chapter 1

8/9/2019 Race and Entrepreneurial Success - Black , Asian, And White Owned Business in the United States
http://slidepdf.com/reader/full/race-and-entrepreneurial-success-black-asian-and-white-owned-business 24/253
9. Estimates from the CBO indicate a strong positive relationship be-
tween startup capital and business outcomes. Firms with higher levels
of startup capital are less likely to close and are more likely to have
higher profits and sales and to hire employees. The estimated positive
relationship is consistent with the inability of some entrepreneurs
to obtain the optimal level of startup capital because of liquidity
constraints.
10. The median level of wealth for blacks is $6,166, compared with
$67,000 for whites. We find that black-owned businesses start with
substantially lower levels of financial capital than white-owned firms.
Using a nonlinear decomposition technique, we find that the black/
white disparity in startup capital is the largest single factor contribu-
ting to racial disparities in closure rates, profits, employment, and
sales.
11. Estimates from the CBO indicate that black business owners have a
relatively disadvantaged family-business background compared with
white business owners. Black business owners are much less likely
than white business owners to have had a self-employed family mem-
ber owner prior to starting their business and are less likely to have
worked in that family member’s business. We do not find sizeable ra-
cial differences in the inheritance of businesses.
12. We find that the relatively low probability of having a self-
employed family member prior to business startup among blacks does
not generally contribute to racial differences in small business out-
comes. Instead, the lack of prior work experience in a family business
among black business owners, perhaps by limiting their acquisition of
general and specific business human capital, negatively affects black
business outcomes. We also find that limited opportunities for acquir-ing specific business human capital through work experience in busi-
nesses providing similar goods and services contribute to worse
business outcomes among blacks.
13. Only 17.6 percent of blacks have a college education compared
with 28.2 percent of whites. Black business owners are also found to
have lower levels of education than white business owners, on aver-
age. Estimates from our decomposition technique indicate that these
racial differences in education contribute significantly to the observedracial disparities in business outcomes.
14. The most important factor in the higher survival rates, profits, em-
ployment, and sales of Asian-owned firms is that Asian Americans
Introduction 11

8/9/2019 Race and Entrepreneurial Success - Black , Asian, And White Owned Business in the United States
http://slidepdf.com/reader/full/race-and-entrepreneurial-success-black-asian-and-white-owned-business 25/253
invest more startup capital in their firms than whites. This factor alone
explains 57 to 100 percent of the difference in outcomes between Asian
and white firms.
15. Nearly half of all Asian American business owners are college edu-
cated, which follows the pattern of high levels of education in the
Asian American population more generally. Higher levels of education
among Asian business owners, who are 80 percent foreign born, ex-
plain a large fraction of the better outcomes in Asian- compared with
white-owned businesses.
16. The relative success of Asian-owned businesses is not due to hav-
ing advantaged family-business backgrounds. In fact, Asian businessowners are less likely than white business owners to have a self-
employed family member prior to business startup and are less likely
to work in that family business.
Overall, our findings indicate that large racial disparities exist in
business ownership and business outcomes in the United States. There
is also no evidence suggesting that these patterns will disappear in the
near future. Our analysis of the confidential and restricted-access CBO
reveals several important determinants of success in small businessownership. The analysis focuses on the business and owner character-
istics that are likely to be the most important inputs into the firm’s pro-
duction process as suggested by economic theory. In addition to more
traditional explanations, such as the owner’s education level and
access to financial capital, we find evidence suggesting that family-
business backgrounds are important. In particular, prior work experi-
ence in a family business has a positive effect on business outcomes,
possibly through the acquisition of specific and general business
human capital.
Turning to explanations for disparities in business outcomes, we
find that racial differences in these factors are important. The relative
lack of success among black-owned businesses is attributable in part
to owners who have less startup capital, disadvantaged family back-
grounds, and less education. Conversely, the relative success of Asian
American-owned businesses in the United States appears to be
mainly due to their relatively high levels of startup capital and owner’s
education.
12 Chapter 1

8/9/2019 Race and Entrepreneurial Success - Black , Asian, And White Owned Business in the United States
http://slidepdf.com/reader/full/race-and-entrepreneurial-success-black-asian-and-white-owned-business 26/253
2 Racial Disparities in Business Ownership andOutcomes
In the United States, African Americans and Latinos are less likely toown businesses than whites, and the businesses that they own are
less successful on average. In contrast, Asian Americans have similar
business-ownership rates as whites, and Asian-owned businesses out-
perform white-owned businesses for most outcome measures. In this
chapter, we lay out the facts about business ownership and perfor-
mance among minorities.
We create new estimates of racial patterns of business-ownership
rates using the most recently available microdata. Estimates of recenttrends in minority business ownership are also generated and dis-
cussed. To explore recent trends in minority business outcomes, we
put together a new compilation of estimates that are as comparable
over time as possible. Our goal is to provide a comprehensive picture
of the state of minority business in the United States based on esti-
mates from the most widely used and respected sources of government
data. Estimates of recent trends in business ownership and outcomes
from these sources that are presented here are generated from public-use and restricted-access microdata, taken from published sources,
and obtained from special tabulations prepared for us by the U.S. Cen-
sus Bureau.
To examine current levels and trends in business-ownership patterns
by race, we use microdata from the 1979 to 2006 Outgoing Rotation
Group Files of the Current Population Survey (CPS). The survey, con-
ducted by the U.S. Census Bureau and the Bureau of Labor Statistics,
is representative of the entire U.S. population and interviews approxi-
mately 50,000 households and more than 130,000 people per month.The CPS provides the most up-to-date estimates of the rate of busi-
ness ownership in the United States. The new estimates of minority
business-ownership rates from CPS microdata presented here also

8/9/2019 Race and Entrepreneurial Success - Black , Asian, And White Owned Business in the United States
http://slidepdf.com/reader/full/race-and-entrepreneurial-success-black-asian-and-white-owned-business 27/253
improve on published estimates from the CPS by the U.S. Bureau of
Labor Statistics (BLS) because these latter data do not include incorpo-
rated business owners. More details about the CPS microdata are pro-
vided in the book’s data appendix.
After examining racial differences in business ownership, we pro-
vide estimates of racial differences in business outcomes. Trends from
the past two decades are presented. A detailed comparison of several
measures of performance among white, black, Asian, and Latino busi-
nesses sets the stage for the analyses contained in the later chapters.
Estimates of business outcomes are taken from the 2002 Survey of
Business Owners (SBO) and the Surveys of Minority-Owned Business
Enterprises (SMOBE) from 1982, 1987, 1992, and 1997. We also presentestimates from our sample of businesses taken from the confidential
and restricted-access 1992 Characteristics of Business Owners (CBO)
Survey and published estimates from the same source. The SBO/
SMOBE is considered the most up-to-date, comprehensive dataset on
minority businesses. The CBO, which is a more detailed subsample of
the SMOBE, is used in later chapters to analyze the determinants of
business success and causes of racial differences in business outcomes.
The book’s data appendix includes a detailed discussion of all thesedatasets.
Racial Differences in Business Ownership
Although the focus of this study is on explaining racial disparities
in business performance, it is useful to first discuss racial business-
ownership patterns and briefly review the literature on potential ex-
planations. Microdata from the 2006 Outgoing Rotation Group File to
the CPS are used to examine racial patterns of business ownership.
These are the latest available national data on business ownership in
the United States. Estimates of nonagricultural self-employed business-
ownership rates are reported in table 2.1. The self-employed business-
ownership rate is the ratio of the number of self-employed business
owners to the total number of workers. Business ownership in the CPS
captures all types of businesses including incorporated, unincorpo-
rated, employer, and nonemployer businesses.1 Agricultural industries
are excluded, but they represent only 6 percent of all business owners.The owners of side and small-scale businesses are also excluded be-
cause self-employment status is defined for the main job activity and
14 Chapter 2

8/9/2019 Race and Entrepreneurial Success - Black , Asian, And White Owned Business in the United States
http://slidepdf.com/reader/full/race-and-entrepreneurial-success-black-asian-and-white-owned-business 28/253
only workers with at least fifteen hours worked in the survey week are
included in the sample.
A clear ordering of self-employment propensities across ethnic andracial groups emerges.2 Asians and white non-Latinos have the highest
self-employment rates, Latinos have the next highest rates, and blacks
have the lowest rates. Among whites, 11.1 percent of the workforce is
a business owner. The Asian self-employment rate is slightly higher at
11.8 percent, but it varies from year to year, as noted below. In the past
few years, the Asian self-employment rate has been roughly similar to
the white rate. The rate of business ownership among Latinos is 7.5
percent, which is only 68 percent of the white rate. The black self-employment rate is even lower at 5.1 percent, which is 46 percent of
the white rate.3 The ordering and general levels of self-employment
rates across ethnic or racial groups are similar to those reported in pre-
vious studies using alternative data sources and years.4
Recent Trends in Business Ownership
We now turn to an analysis of the major trends in minority business
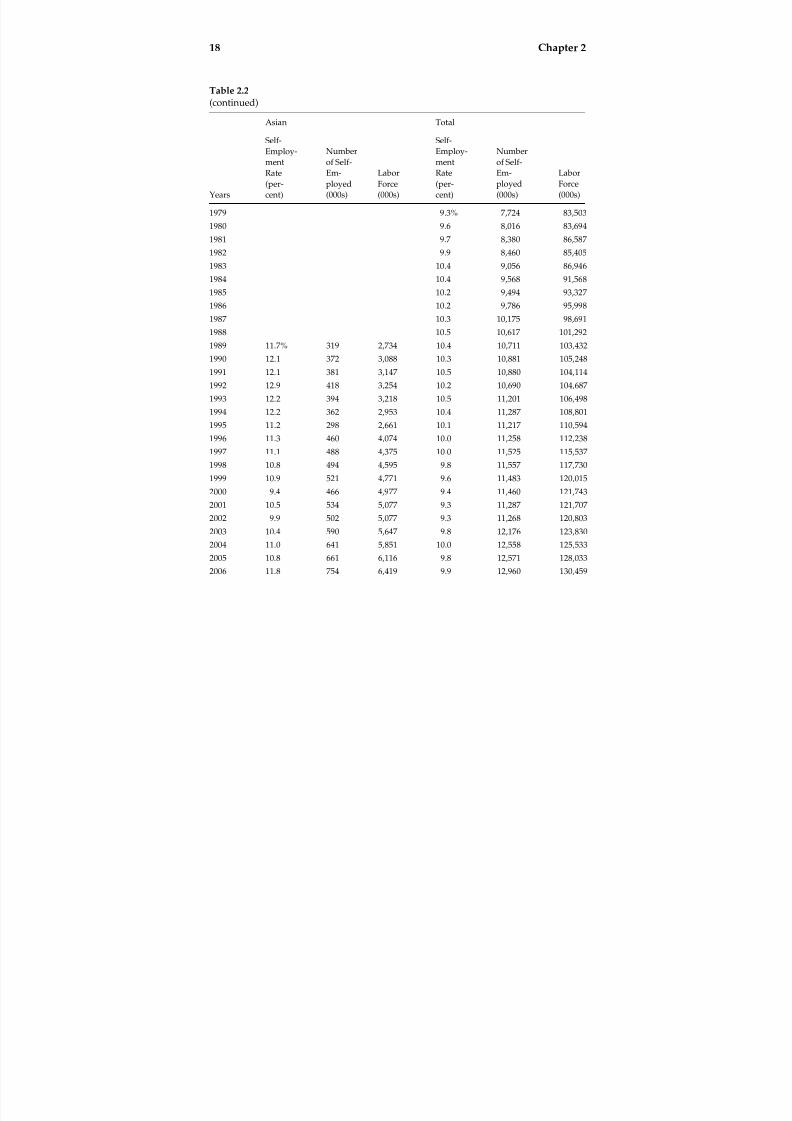
ownership that have occurred in the past few decades. Figure 2.1 and
table 2.2 provide estimates of self-employed business-ownership rates
by race from 1979 to 2006. The white non-Latino self-employment rate
Table 2.1
Self-employment rates by ethnicity or race, Current Population Survey, Outgoing Rota-tion Group Files (2006)
Self-Employment
Rate (percent) Sample Size
White non-Latino 11.1% 132,786
African American 5.1 15,988
Latino 7.5 19,357
Asian 11.8 8,206
Total 9.9% 181,071
Notes: (1) The sample consists of individuals age sixteen and over who work fifteen ormore hours during the survey week. (2) Self-employment status is based on the worker’smain job activity and includes owners of both unincorporated and incorporated busi-nesses. (3) Agricultural industries are defined using the North American Industry Classi-fication System classifications and are excluded. (4) Estimates include only individualsreporting one race. (5) All estimates are calculated using sample weights provided bythe Current Population Survey.
Racial Disparities in Business Ownership and Outcomes 15

8/9/2019 Race and Entrepreneurial Success - Black , Asian, And White Owned Business in the United States
http://slidepdf.com/reader/full/race-and-entrepreneurial-success-black-asian-and-white-owned-business 29/253
rose by just over one and a half percentage points from 1979 (10.1 per-
cent) to 1993 (11.7 percent).5
It then started a downward trend, whichdid not end until 2001 (10.5 percent).6 Since then, the self-employment
rate has risen by slightly more than a half percentage point and has
remained steady around 11.2 percent over the last few years. Over
the entire period from 1979 to 2006, the white non-Latino business-
ownership rate increased by one percentage point.
The estimates displayed in figure 2.1 indicate that the black self-
employment rate remained roughly constant in the 1980s and early
1990s. The self-employment rate was slightly higher in the middle to
late 1990s and rose to 4.9 percent in 2000. The black self-employment
rate then fell, rose to a high of 5.2 percent in 2003, and has remained at
5.1 to 5.2 percent in recent years. The current rate of business owner-
ship for blacks is substantially higher than it was only two and a half
decades ago. The percentage of black workers who are business own-
ers increased by 1.3 percentage points over the past twenty-five years.
These trends indicate that business ownership for blacks is rising at a
faster rate than for whites, suggesting that the racial gap is closing if
measured as a ratio. The black/white ratio in self-employment ratesincreased from 0.38 in 1979 to 0.46 in 2006. At the same time, however,
it is clear from figure 2.1 that blacks had lower self-employment rates
than any other group for the entire period and have a long way to go
Figure 2.1
Self-employed business ownership rates for all workers, Current Population Survey, Out-going Rotation Group Files (1979 to 2006)
16 Chapter 2

8/9/2019 Race and Entrepreneurial Success - Black , Asian, And White Owned Business in the United States
http://slidepdf.com/reader/full/race-and-entrepreneurial-success-black-asian-and-white-owned-business 30/253
Table 2.2
Trends in self-employed business ownership rates by race, Current Population Survey,Outgoing Rotation Group Files (1979 to 2006)
White non-Latino Black Latino
Years
Self-
Employ-
ment
Rate
(per-
cent)
Number
of Self-
Em-
ployed
(000s)
Labor
Force
(000s)
Self-
Employ-
ment
Rate
(per-
cent)
Number
of Self-
Em-
ployed
(000s)
Labor
Force
(000s)
Self-
Employ-
ment
Rate
(per-
cent)
Number
of Self-
Em-
ployed
(000s)
Labor
Force
(000s)
1979 10.1% 7,066 70,168 3.8% 297 7,907 6.1% 241 3,956
1980 10.4 7,298 69,988 3.8 300 7,960 6.4 270 4,205
1981 10.6 7,589 71,827 3.8 309 8,203 5.9 269 4,533
1982 10.8 7,663 70,896 3.8 300 7,960 6.6 292 4,430
1983 11.4 8,220 71,953 3.6 298 8,213 6.2 281 4,515
1984 11.4 8,608 75,386 4.0 352 8,908 6.9 337 4,868
1985 11.2 8,497 75,697 3.8 357 9,285 6.3 362 5,774
1986 11.2 8,670 77,401 3.9 374 9,627 7.2 450 6,248
1987 11.4 8,949 78,818 3.8 388 10,179 7.4 496 6,743
1988 11.5 9,294 80,533 4.1 429 10,446 7.4 533 7,203
1989 11.4 9,376 81,915 3.8 406 10,711 7.5 562 7,454
1990 11.5 9,374 81,822 4.3 471 11,040 7.0 600 8,627
1991 11.7 9,405 80,675 4.1 451 10,976 6.7 574 8,614
1992 11.4 9,210 80,993 3.9 424 11,007 6.7 581 8,723
1993 11.7 9,653 82,164 3.8 431 11,322 7.2 652 9,032
1994 11.6 9,687 83,826 4.3 507 11,704 6.9 659 9,522
1995 11.4 9,732 85,336 4.3 526 12,134 6.1 592 9,645
1996 11.2 9,550 85,032 4.3 538 12,386 6.6 661 9,953
1997 11.3 9,738 86,490 4.1 530 12,828 6.4 697 10,935
1998 11.1 9,710 87,353 4.1 544 13,407 6.4 734 11,466
1999 10.8 9,545 88,536 4.3 602 13,999 6.4 759 11,819
2000 10.7 9,510 89,108 4.9 697 14,220 5.9 732 12,490
2001 10.5 9,273 88,560 4.4 629 14,251 6.1 785 12,848
2002 10.6 9,290 87,788 4.4 621 14,062 6.1 782 12,842
2003 11.1 9,658 87,305 5.2 710 13,717 7.0 1,032 14,777
2004 11.2 9,880 87,919 5.1 705 13,926 7.4 1,135 15,348
2005 11.1 9,842 89,065 5.2 751 14,308 7.0 1,115 15,900
2006 11.1 9,955 89,833 5.1 745 14,635 7.5 1,275 16,958
Notes: (1) The sample includes individuals age sixteen and over who work fifteen or more hours
during the survey week. (2) Self-employment status is based on the worker’s main job activity and
includes owners of both unincorporated and incorporated businesses. (3) Agricultural industries are
defined using the North American Industry Classification System classifications and are excluded.
Estimates for 1979 to 1991 also exclude veterinary services. (4) Race and Spanish codes changed in
1989, 1996, and 2003, and the Current Population Survey was redesigned in 1994. Estimates startingin 2003 include only individuals reporting one race. (5) All estimates are calculated using sample
weights provided by the CPS.
Racial Disparities in Business Ownership and Outcomes 17
8/9/2019 Race and Entrepreneurial Success - Black , Asian, And White Owned Business in the United States
http://slidepdf.com/reader/full/race-and-entrepreneurial-success-black-asian-and-white-owned-business 31/253
Table 2.2
(continued)
Asian Total
Years
Self-
Employ-
ment
Rate
(per-
cent)
Number
of Self-
Em-
ployed
(000s)
Labor
Force
(000s)
Self-
Employ-
ment
Rate
(per-
cent)
Number
of Self-
Em-
ployed
(000s)
Labor
Force
(000s)
1979 9.3% 7,724 83,503
1980 9.6 8,016 83,694
1981 9.7 8,380 86,587
1982 9.9 8,460 85,405
1983 10.4 9,056 86,946
1984 10.4 9,568 91,568
1985 10.2 9,494 93,327
1986 10.2 9,786 95,998
1987 10.3 10,175 98,691
1988 10.5 10,617 101,292
1989 11.7% 319 2,734 10.4 10,711 103,432
1990 12.1 372 3,088 10.3 10,881 105,248
1991 12.1 381 3,147 10.5 10,880 104,114
1992 12.9 418 3,254 10.2 10,690 104,687
1993 12.2 394 3,218 10.5 11,201 106,498
1994 12.2 362 2,953 10.4 11,287 108,801
1995 11.2 298 2,661 10.1 11,217 110,594
1996 11.3 460 4,074 10.0 11,258 112,238
1997 11.1 488 4,375 10.0 11,525 115,537
1998 10.8 494 4,595 9.8 11,557 117,730
1999 10.9 521 4,771 9.6 11,483 120,015
2000 9.4 466 4,977 9.4 11,460 121,743
2001 10.5 534 5,077 9.3 11,287 121,707
2002 9.9 502 5,077 9.3 11,268 120,8032003 10.4 590 5,647 9.8 12,176 123,830
2004 11.0 641 5,851 10.0 12,558 125,533
2005 10.8 661 6,116 9.8 12,571 128,033
2006 11.8 754 6,419 9.9 12,960 130,459
18 Chapter 2

8/9/2019 Race and Entrepreneurial Success - Black , Asian, And White Owned Business in the United States
http://slidepdf.com/reader/full/race-and-entrepreneurial-success-black-asian-and-white-owned-business 32/253
before catching up with white levels. Furthermore, the gap in percent-
age points or as a difference between the two rates decreased only
slightly (from 6.3 to 6.0 percentage points).
The Latino rate of business ownership increased dramatically over
the 1980s. The rate was 6.1 percent in 1979 and rose to 7.5 percent by
1989. The Latino self-employment rate then fell over the next decade.
In the early 2000s, roughly 6 percent of Latinos were self-employed
business owners. In the past few years, however, the rate of business
ownership has increased sharply. The Latino self-employment rate is
now 7.5 percent, which is 1.4 percentage points higher than it was
twenty-five years earlier. Similar to the trends for blacks, Latino
business-ownership rates are rising faster than for whites, indicatingthat the ratio of Latino to white self-employment is rising over time.
Estimates of business-ownership rates for Asians fluctuated more
than for other groups from 1989 to 2006. Unfortunately, the CPS does
not allow identification of Asians prior to 1989. The fluctuation in the
self-employment rates is party driven by smaller sample sizes for
Asians than for other groups. Although the group’s self-employment
rate has declined somewhat from the early 1990s to the current period,
Asians continue to have the highest rate of business ownership amongminority groups and have rates that are roughly comparable to white
rates. More than one out of every ten Asian workers is a self-employed
business owner.
Although there is little evidence in the literature on what has con-
tributed to these trends in recent years, there is some evidence that
suggests the causes of racial differences in earlier periods. Using a dy-
namic decomposition technique, Fairlie (2004b) explores the causes of
racial differences in trends in self-employment rates from 1979 to 1998.
Several interesting patterns are revealed. For example, increasing levels
of education among black men relative to white men contributed to the
narrowing of the white/black self-employment rate gap from 1979–
1981 to 1996–1998. In contrast, Latino men did not experience gains in
education relative to white men over this period, and the white/Latino
gap increased. Differential trends in the age distribution of the work-
force across racial groups also contributed to relative trends in self-
employment rates. For all minority groups, the workforce aged less
rapidly than for whites, reducing the self-employment rates of thesegroups relative to the white self-employment rate.
Examining trends in business ownership among black and white
men for a limited set of cities, Chay, Fairlie, and Chatterji (2005) find
Racial Disparities in Business Ownership and Outcomes 19
8/9/2019 Race and Entrepreneurial Success - Black , Asian, And White Owned Business in the United States
http://slidepdf.com/reader/full/race-and-entrepreneurial-success-black-asian-and-white-owned-business 33/253
evidence of increasing rates for blacks in the mid-1980s that are likely
due to the creation of affirmative action contracting programs. The
staggered introduction of set-aside programs across U.S. cities during
the 1980s is used to estimate their impact on minority self-employment
rates. Large increases in black self-employment rates relative to white
self-employment rates are found soon after program implementation
concentrated in those industries, such as construction, that were most
heavily affected by contract set-asides from city governments. Boston
(1998) also examines the growth rate in the number of black-owned
businesses in cities that implemented affirmative action programs in
the 1980s relative to cities that did not and finds weaker results. He
finds that the average growth rate from 1982 to 1992 was 65 percent incities with programs and 61 percent in cities without programs but that
the difference was not statistically significant.
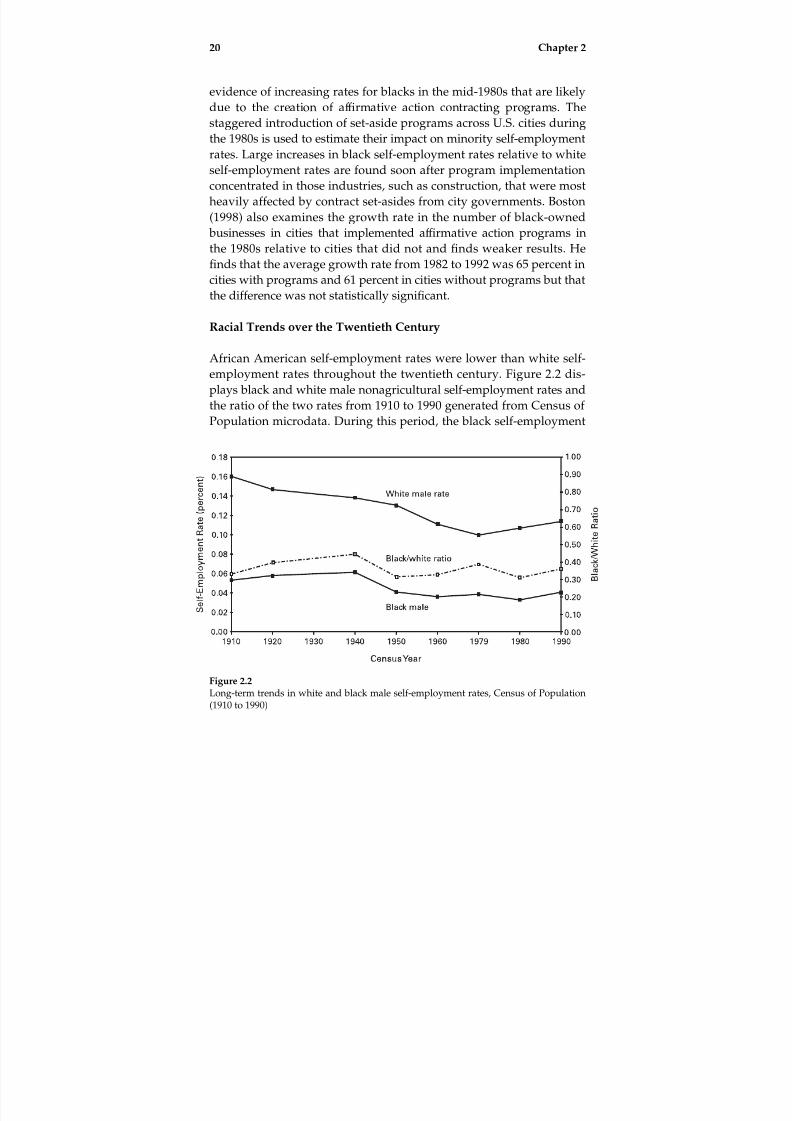
Racial Trends over the Twentieth Century
African American self-employment rates were lower than white self-
employment rates throughout the twentieth century. Figure 2.2 dis-
plays black and white male nonagricultural self-employment rates andthe ratio of the two rates from 1910 to 1990 generated from Census of
Population microdata. During this period, the black self-employment
Figure 2.2
Long-term trends in white and black male self-employment rates, Census of Population(1910 to 1990)
20 Chapter 2

8/9/2019 Race and Entrepreneurial Success - Black , Asian, And White Owned Business in the United States
http://slidepdf.com/reader/full/race-and-entrepreneurial-success-black-asian-and-white-owned-business 34/253
rate generally followed the same time pattern as the white self-
employment rate. The main difference was that the decline in black
self-employment continued until 1980 and reversed only after 1980.
The similar trends in the racial self-employment rates resulted in a
roughly constant black/white ratio during most of the twentieth
century.7
Examining these long-term trends in racial self-employment rates,
Fairlie and Meyer (2000) find that the large gap between the black and
the white self-employment rates is due to the lower self-employment
rates of blacks in all industries and not due to the concentration of
blacks in low-self-employment-rate industries.8 Another finding was
that major demographic changes that occurred during the twentiethcentury, such as the great black migration out of the U.S. south (1914
to 1950) and the racial convergence in educational attainment, did not
have large effects on the racial self-employment rate gap. Furthermore,
relative self-employment rates among more recent cohorts of black
men are not found to be higher than among older cohorts, suggesting
that business-ownership patterns are not changing rapidly across
generations.
Explanations for Racial Differences in Business Ownership
A large body of research investigates the causes of current racial differ-
ences in business-ownership rates using individual-level datasets, such
as the CPS and Census of Population.9 Given the large size of this liter-
ature, we do not provide a comprehensive review. Instead, we provide
a brief review of the main findings focusing on previous studies that
provide estimates of the relative importance of explanatory factors be-
fore turning to the focus on this study on racial differences in business
performance.10 Previous studies focusing on the causes of low rates of
business ownership among blacks and Latinos are discussed here,
leaving a more detailed discussion of the Asian self-employment litera-
ture to chapter 5.
The standard economic model of the self-employment decision pos-
its that individuals choose the work sector that provides the highest
utility—wage and salary work or self-employment (Kihlstrom and
Laffont 1979; Evans and Jovanovic 1989). The main component of thiscomparison is potential earnings in the two sectors. Blacks and Latinos
may be less likely to choose self-employment than whites and Asians
due to the perceived lower relative earnings in the self-employment
Racial Disparities in Business Ownership and Outcomes 21

8/9/2019 Race and Entrepreneurial Success - Black , Asian, And White Owned Business in the United States
http://slidepdf.com/reader/full/race-and-entrepreneurial-success-black-asian-and-white-owned-business 35/253
sector. A comparison of earnings in self-employment and the wage
and salary sector, however, does not provide evidence that blacks and
Latinos have lower relative self-employment earnings than whites and
Asians (Fairlie 2006).
Although the earnings comparison is a key component of the stan-
dard theoretical model of entrepreneurship, the decision between
wage and salary work and self-employment is actually based on a
comparison of utility in the two sectors, suggesting that the character-
istics of the type of work may be important (Rees and Shah 1986;
Blanchflower and Oswald 1998). A potential explanation for low rates
of business ownership may be that minorities have less of a prefer-
ence for entrepreneurship. Available data on preferences for self-employment among young blacks, however, indicate a strong interest
in self-employment. More than 75 percent of young blacks report being
interested in starting their own business (Walstad and Kourilsky 1998).
For comparison, 63 percent of young whites are interested in starting a
business.11 These findings suggest that blacks may have a stronger de-
sire for entrepreneurship than whites, at least when they are young.
Evidently, the simple economic model of entrepreneurship does not
explain basic differences in business-ownership rates between racialgroups. Racial differences in business-ownership rates appear to be
driven by factors other than just differences in earnings differentials
and preferences. Thus, much of the previous literature has focused on
analyzing potential constraints limiting the ability of minorities to start
businesses.
The importance of personal wealth has taken center stage in the lit-
erature on the determinants of self-employment. Numerous studies
using various methodologies and measures of wealth explore the rela-
tionship between wealth and self-employment for different countries.
Most studies find that asset levels (such as net worth) measured in one
year increase the probability of entering self-employment by the fol-
lowing year.12 The finding has generally been interpreted as providing
evidence that entrepreneurs face liquidity constraints, although there
is some recent evidence against this interpretation (Hurst and Lusardi
2004). Several previous studies also show that blacks have substan-
tially lower levels of wealth than whites.13 Although less research
focuses on Latinos, disparities in asset levels are also large (see Wolff 2001; Cobb-Clark and Hildebrand 2006). Estimates from the Survey of
Income and Program Participation (SIPP), discussed more thoroughly
in chapter 4, indicate that median levels of net worth are $6,166 for
22 Chapter 2
8/9/2019 Race and Entrepreneurial Success - Black , Asian, And White Owned Business in the United States
http://slidepdf.com/reader/full/race-and-entrepreneurial-success-black-asian-and-white-owned-business 36/253
blacks and $6,766 for Latinos. In contrast, the median net worth for
white non-Latinos is $67,000 (U.S. Census Bureau 2005b). Asians are
found to have wealth levels that are roughly similar to those of whites
(Hao 2007).
These findings from the previous literature suggest that relatively
low levels of wealth among blacks and Latinos and relatively high
levels of wealth among Asians may be a source of racial differences
in rates of business ownership. Indeed, recent research using statistical
decomposition techniques provides evidence supporting this hypothe-
sis. Using matched CPS Annual Demographic Files (ADF) data from
1998 to 2003, Fairlie (2006) finds that the largest single factor explain-
ing racial disparities in business-creation rates are differences in assetlevels. Lower levels of assets among blacks account for 15.5 percent of
the difference between the rates of business creation among whites and
blacks. This finding is consistent with the presence of liquidity con-
straints and low levels of assets limiting opportunities for blacks to
start businesses. The finding is very similar to estimates reported in
Fairlie (1999) for men using the Panel Study of Income Dynamics
(PSID). Estimates from the PSID indicate that 13.9 to 15.2 percent of
the black/white gap in business start rates can be explained by differ-ences in assets.14
Fairlie and Woodruff (2007) examine the causes of low rates of busi-
ness formation among Mexican Americans. One of the most important
factors in explaining the gaps between Mexican Americans and non-
Latino whites in rates of business creation is also assets. Relatively low
levels of assets explain roughly one quarter of the business entry rate
gap for Mexican Americans. Lofstrom and Wang (2006) using SIPP
data also find that low levels of wealth for Mexican Americans and
other Latinos work to lower self-employment entry rates. Apparently,
low levels of personal wealth limit opportunities for Mexican Ameri-
cans and other Latinos to start businesses.
Education has also been found in the literature to be a major deter-
minant of business ownership. Low levels of education obtained by
blacks and Latinos are partly responsible for their lower business-
ownership rates. Using CPS data, Fairlie (2006) finds that 6.0 percent
of the black/white gap in self-employment entry rates is explained by
racial differences in education levels. Similar estimates from the PSIDare reported in Fairlie (1999). Mexican Americans have even lower
levels of education than blacks, which translates into a limiting factor
for business creation. Estimates from the CPS indicate that education
Racial Disparities in Business Ownership and Outcomes 23

8/9/2019 Race and Entrepreneurial Success - Black , Asian, And White Owned Business in the United States
http://slidepdf.com/reader/full/race-and-entrepreneurial-success-black-asian-and-white-owned-business 37/253
differences account for 32.8 to 37.9 percent of the entry-rate gap for
Mexican Americans (Fairlie and Woodruff 2007). Lofstrom and Wang
(2006) find that education is important in explaining differences in
business-creation rates between Mexican Americans and whites, as
well as the types of businesses entrepreneurs are likely to pursue. The
high rate of business ownership by Asians is in part due to their rela-
tively high levels of education (Fairlie 2006).
Another measure of human capital relevant for Latinos and Asians is
language ability. Limited English-language ability may make it diffi-
cult to communicate with potential customers and suppliers and learn
about regulations. On the other hand, lack of fluency in English may
limit opportunities in the wage and salary sector, resulting in an in-creased likelihood of becoming self-employed. Previous studies pro-
vide some evidence that a better command of the English language is
associated with more self-employment (Fairlie and Meyer 1996; Fairlie
and Woodruff 2007). But there is also a literature that points to blocked
opportunities in the wage and salary sector because of language bar-
riers increasing self-employment among Asian immigrants (Kassoudji
1988; Min 1989, 1993; Bates 1997).
Research also indicates that the probability of self-employment issubstantially higher among the children of the self-employed (Lentz
and Laband 1990; Fairlie 1999; Dunn and Holtz-Eakin 2000; Hout and
Rosen 2000).15 These studies generally find that an individual who
had a self-employed parent is roughly two to three times as likely to
be self-employed as someone who did not have a self-employed par-
ent. There is evidence that this strong intergenerational link in business
ownership is detrimental to disadvantaged minorities. Hout and Rosen
(2000) note a ‘‘triple disadvantage’’ faced by black men in terms of
business ownership. They are less likely than white men to have self-
employed fathers, to become self-employed if their fathers were not
self-employed, and to follow their father in self-employment. Fairlie
(1999) provides evidence from the PSID that current racial patterns of
self-employment are in part determined by racial patterns of self-
employment in the previous generation.
Previous research also indicates that the size and composition of
social networks are associated with self-employment (Allen 2000). If
minority firms have limited access to business, social, or family net-works or have smaller networks, then they may be less likely to enter
business and create successful businesses. These networks may be es-
pecially important in providing financing, customers, technical assis-
24 Chapter 2
8/9/2019 Race and Entrepreneurial Success - Black , Asian, And White Owned Business in the United States
http://slidepdf.com/reader/full/race-and-entrepreneurial-success-black-asian-and-white-owned-business 38/253
tance, role models, and contracts. These same networks, however, are
also likely to be useful for finding employment in the wage and salary
sector, creating a dampening effect on self-employment.
Ethnic enclaves represent one method for creating and facilitating
entry into networks. Of particular importance is that locating in an
ethnic enclave may provide a market for special products and ser-
vices and access to coethnic labor.16 Using a measure of enclave at the
Standard Metropolitan Statistical Area (SMSA) level, Borjas (1986) finds
that self-employment among Mexicans, Cubans, and ‘‘other Hispanics’’
is increasing in the percentage of Hispanics in an SMSA. The effect is
larger among the immigrant population than among the population
born in the United States. Using 2000 U.S. Census data, Fairlie andWoodruff (2007) find that Mexican-immigrant self-employment rates
are higher in ethnic enclaves. The evidence is more mixed on whether
black self-employment is higher in areas with larger concentrations of
blacks (Boyd 1990; Dawkins 2007). Ethnic enclaves may explain why
some ethnic groups have high rates of business ownership, but en-
claves can also dampen opportunities for entrepreneurs by creating
intense competition among coethnics (Aldrich and Waldinger 1990;
Razin and Langlois 1996).Additional factors that might explain differing rates of business
ownership across ethnic and racial groups are labor-market, lending,
and consumer discrimination. Labor-market discrimination may in-
crease business entry for some minority groups. Wage and employ-
ment discrimination represent disadvantages in the labor market,
causing some groups to favor self-employment (Light 1972, 1979;
Sowell 1981; Moore 1983). On the other hand, Coate and Tennyson
(1992) present a theoretical model positing that labor-market dis-
crimination can reduce the incentive for minorities to enter self-
employment. This happens because lenders provide less favorable
terms in the credit market, such as higher interest rates, to the discrimi-
nated group because of the difficulty in observing entrepreneurial abil-
ity. Empirical evidence for sixty detailed ethnic or racial groups
presented in Fairlie and Meyer (1996) indicates that more advantaged
ethnic or racial groups (measured by wage and salary earnings, self-
employment earnings, and unearned income), not the more disad-
vantaged groups, have the highest self-employment rates. Finally,discrimination may occur directly in self-employment through limited
opportunities to penetrate networks, such as those in construction
(Bates 1993a; Feagin and Imani 1994; Bates and Howell 1997).
Racial Disparities in Business Ownership and Outcomes 25
8/9/2019 Race and Entrepreneurial Success - Black , Asian, And White Owned Business in the United States
http://slidepdf.com/reader/full/race-and-entrepreneurial-success-black-asian-and-white-owned-business 39/253
Using microdata from the 1980 U.S. Census, Borjas and Bronars
(1989) explore whether the large observed variances in self-employment
rates across racial groups are partly due to consumer discrimination.
They find that minorities negatively select into self-employment, with
the most able minorities remaining in the wage and salary sector,
whereas whites positively select into self-employment and negatively
select into wage and salary work. These findings are consistent with
the most able minority businesses avoiding self-employment because
of white consumers’ distaste for purchasing goods and services from
minority businesses. Using recent panel data from the CPS, Kawaguchi
(2004) finds that among African Americans low earners are the most
likely to enter into business ownership, whereas both low- and high-earning whites are the most likely to enter self-employment. He notes
that this finding is consistent with the theoretical predictions of con-
sumer and credit-market discrimination against blacks. In contrast to
these results, Meyer (1990) does not find evidence supporting the con-
sumer-discrimination hypothesis. Using data from the 1987 Character-
istics of Business Owners (CBO), he finds that black businesses are
relatively more common in industries in which white customers more
frequently patronize black businesses.Several previous studies use data from the Federal Reserve’s Survey
of Small Business Finances (SSBF) to study lending discrimination and
find that minority-owned businesses experience higher loan-denial
probabilities and pay higher interest rates than white-owned busi-
nesses, even after controlling for differences in creditworthiness and
other factors (Blanchard, Yinger, and Zhao 2004; Blanchflower, Levine,
and Zimmerman 2003; Cavalluzzo, Cavalluzzo, and Wolken 2002;
Cavalluzzo and Wolken 2005; Coleman 2002, 2003; Robb and Fairlie
2006). We discuss these results more fully in chapter 4. Although this
empirical evidence is focused on more established businesses, lending
discrimination is likely to deter business creation among minorities be-
cause of the effect on startup loans.
Related to the issue of discrimination, government jobs have been
very attractive to black workers because of stricter antidiscrimination
policies, universal hiring standards, and affirmative action. Previous
research indicates that black self-employment is lower in areas in
which higher percentages of blacks are employed in the public sector(Boyd 1990). Although would-be black entrepreneurs may have gone
into the public sector instead of starting businesses, the total impact
has to be relatively low because only 6.4 percent of the black workforce
26 Chapter 2

8/9/2019 Race and Entrepreneurial Success - Black , Asian, And White Owned Business in the United States
http://slidepdf.com/reader/full/race-and-entrepreneurial-success-black-asian-and-white-owned-business 40/253
is employed in the public sector compared with 4.3 percent of the
white workforce. Even if the entire difference in public-sector employ-
ment rates was added to the black self-employment rate, a substantial
gap in self-employment rates would remain between blacks and
whites.
To summarize, the previous literature identifies several explanations
for racial disparities in business-ownership rates. These include racial
differences in wealth, education, and parental self-employment. Con-
sumer and lending discrimination against some minority businesses
may also limit business-ownership rates. Ethnic enclaves, language
ability, and networks may also contribute to ethnic and racial dispar-
ities in business-ownership rates. Although the determinants of busi-ness ownership might differ from those for business performance,
these factors are a good place to start looking for explanations.
Trends in the Number of Minority-Owned Businesses
We now turn to examining business-level data on minority-owned
businesses in the United States. We present results from the most com-
monly used sources of data on minority-owned businesses—the SBO,SMOBE, and CBO. All of these surveys are conducted by the U.S. Cen-
sus Bureau. Estimates reported here are taken from government publi-
cations, special tabulations prepared for us by U.S. Census Bureau
staff, and generated from restricted-access microdata (see the book’s
data appendix).17 The data provide information on the number of mi-
nority businesses and on business outcomes (such as closures, profits,
employment, and sales) that are not typically found in household sur-
vey data, such as the CPS.
Estimates of the number of minority businesses from the SMOBE
and SBO are discussed first. The SMOBE and SBO are considered the
most up-to-date and comprehensive data on minority-owned busi-
nesses. These data have experienced several changes in sample criteria
and definitions, however, making them not directly comparable over
time (see more details in the book’s data appendix). Estimates were
also revised in many cases by the Census Bureau, and we attempted to
find the most recently available data.18 With these concerns in mind,
the analysis focuses on relative trends.Estimates from the SMOBE and SBO indicate that the number of mi-
nority businesses grew rapidly over the past two decades (see table
2.3). In 1982, there were 308,260 black-owned businesses. By 2002, the
Racial Disparities in Business Ownership and Outcomes 27
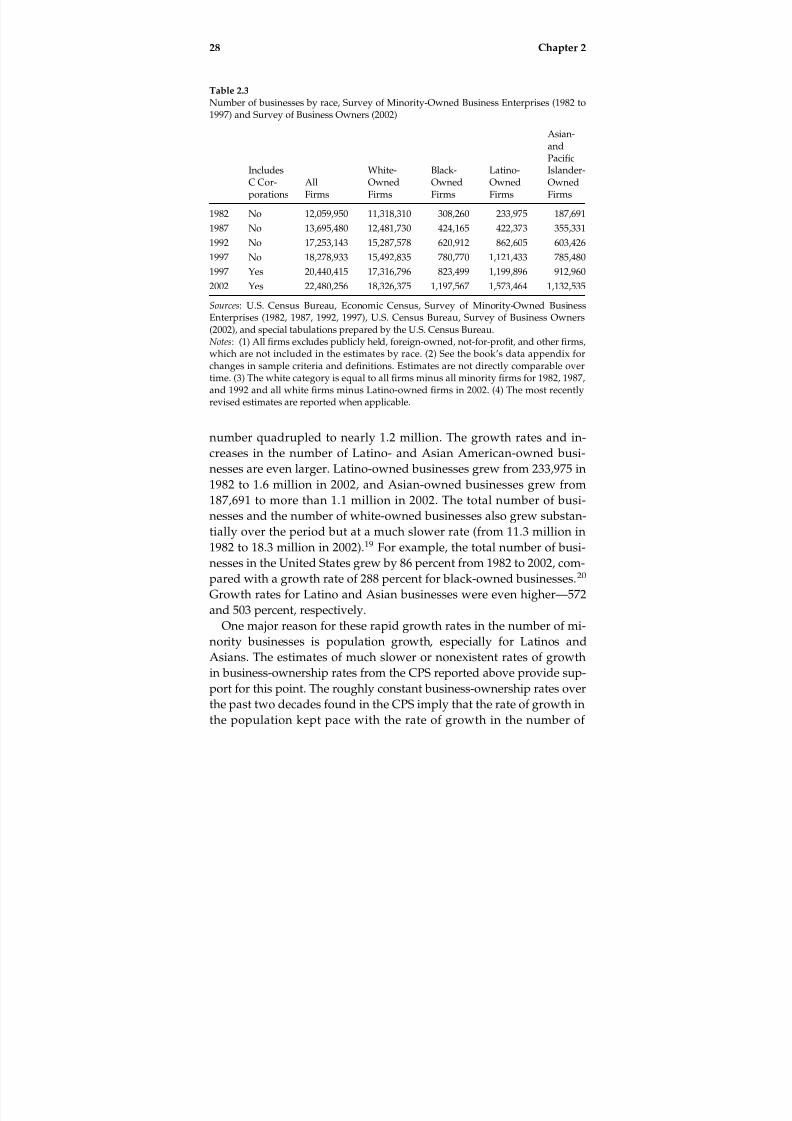
8/9/2019 Race and Entrepreneurial Success - Black , Asian, And White Owned Business in the United States
http://slidepdf.com/reader/full/race-and-entrepreneurial-success-black-asian-and-white-owned-business 41/253
number quadrupled to nearly 1.2 million. The growth rates and in-
creases in the number of Latino- and Asian American-owned busi-
nesses are even larger. Latino-owned businesses grew from 233,975 in
1982 to 1.6 million in 2002, and Asian-owned businesses grew from
187,691 to more than 1.1 million in 2002. The total number of busi-
nesses and the number of white-owned businesses also grew substan-tially over the period but at a much slower rate (from 11.3 million in
1982 to 18.3 million in 2002).19 For example, the total number of busi-
nesses in the United States grew by 86 percent from 1982 to 2002, com-
pared with a growth rate of 288 percent for black-owned businesses.20
Growth rates for Latino and Asian businesses were even higher—572
and 503 percent, respectively.
One major reason for these rapid growth rates in the number of mi-
nority businesses is population growth, especially for Latinos and
Asians. The estimates of much slower or nonexistent rates of growthin business-ownership rates from the CPS reported above provide sup-
port for this point. The roughly constant business-ownership rates over
the past two decades found in the CPS imply that the rate of growth in
the population kept pace with the rate of growth in the number of
Table 2.3
Number of businesses by race, Survey of Minority-Owned Business Enterprises (1982 to1997) and Survey of Business Owners (2002)
IncludesC Cor-porations
AllFirms
White-OwnedFirms
Black-OwnedFirms
Latino-OwnedFirms
Asian-andPacificIslander-OwnedFirms
1982 No 12,059,950 11,318,310 308,260 233,975 187,691
1987 No 13,695,480 12,481,730 424,165 422,373 355,331
1992 No 17,253,143 15,287,578 620,912 862,605 603,426
1997 No 18,278,933 15,492,835 780,770 1,121,433 785,4801997 Yes 20,440,415 17,316,796 823,499 1,199,896 912,960
2002 Yes 22,480,256 18,326,375 1,197,567 1,573,464 1,132,535
Sources: U.S. Census Bureau, Economic Census, Survey of Minority-Owned BusinessEnterprises (1982, 1987, 1992, 1997), U.S. Census Bureau, Survey of Business Owners(2002), and special tabulations prepared by the U.S. Census Bureau.Notes: (1) All firms excludes publicly held, foreign-owned, not-for-profit, and other firms,which are not included in the estimates by race. (2) See the book’s data appendix forchanges in sample criteria and definitions. Estimates are not directly comparable overtime. (3) The white category is equal to all firms minus all minority firms for 1982, 1987,
and 1992 and all white firms minus Latino-owned firms in 2002. (4) The most recentlyrevised estimates are reported when applicable.
28 Chapter 2

8/9/2019 Race and Entrepreneurial Success - Black , Asian, And White Owned Business in the United States
http://slidepdf.com/reader/full/race-and-entrepreneurial-success-black-asian-and-white-owned-business 42/253
business owners over this period. Trends in the number of businesses
to population ratios from 1997 to 2002 also indicate low growth rates
for Asians and Latinos but not for blacks (U.S. Small Business Admin-
istration 2007a).
Growth rates in the reported number of minority-owned businesses
are also partly due to changes in the sample universe of included busi-
nesses in the SMOBE and SBO data (see table A.1 in the book’s data
appendix). The biggest change over this period is that the SMOBE be-
gan including C corporations in 1997. Thus, part of the growth in the
number of firms from 1982 to 2002 is due to the addition of these cor-
porations. This change, however, does not have a substantial effect on
trends in the number of black- and Latino-owned firms. Table 2.3reports two separate estimates of the number of businesses by race in
1997, which exclude or include C corporations. The exclusion of C cor-
porations is consistent with the sample criteria used in earlier years,
and the inclusion of C corporations is consistent with 2002.21 The dif-
ference in reported estimates implies that only 5.2 percent of black
firms and 6.5 percent of Latino firms were C corporations in 1997, indi-
cating that the addition of C corporations contributed only slightly to
the estimated growth rates over the past two decades. A larger shareof Asian firms are C corporations (14.0 percent), but they also repre-
sent only a small fraction of the growth in the reported number of
Asian-owned businesses from 1982 to 2002.
Focusing on the most recent period, 1997 to 2002, estimates of the
total number of businesses including C corporations indicate rapid
growth rates in the number of minority-owned businesses. The num-
ber of black-owned businesses grew by 45.4 percent from 1997 to 2002.
The number of Latino and Asian businesses also grew at rapid rates of
31.1 percent and 24.1 percent, respectively. In contrast, the number of
white businesses grew by 5.8 percent from 1997 to 2002.
But are these estimates of phenomenal rates of growth for the num-
ber of minority-owned businesses reasonable? The CPS estimates of
the rates of business ownership showed more modest rates of growth
over the past several years. In fact, the recent growth in minority
business-ownership rates shown in the CPS data occurred primarily
after 2002.
Comparison of SBO/SMOBE and CPS Estimates
We next compare estimates of the number of minority businesses to
the number of minority self-employed business owners. Estimates of
Racial Disparities in Business Ownership and Outcomes 29

8/9/2019 Race and Entrepreneurial Success - Black , Asian, And White Owned Business in the United States
http://slidepdf.com/reader/full/race-and-entrepreneurial-success-black-asian-and-white-owned-business 43/253
the number of businesses from SBO/SMOBE data and the number of
self-employed business owners from the CPS reveal different levels
and trends in minority business activity in the United States. Differ-
ences between the current number of businesses and number of busi-
ness owners are expected, but large differences in trends for the two
measures are unexpected. The CPS estimates indicate much slower re-
cent growth rates in the number of minority business owners than the
SBO/SMOBE estimates.
Table 2.4 reports estimates of the number of businesses from the SBO
and SMOBE and the number of business owners from the CPS by race
for comparable years. The CPS estimates indicate that there were 11.3
million self-employed business owners in the United States in 2002. Incontrast, estimates from the SBO indicate that that there were 22.5 mil-
lion businesses in the United States in 2002. The large discrepancy be-
tween the number of businesses and business owners from the two
sources holds for each racial group in almost every year. Discrepancies
between the two measures of business activity are due to the inclusion
or exclusion of small businesses, side businesses owned by wage and
salary workers, multiple owners of businesses, individuals who own
multiple businesses, and workers in occupations such as sales and realestate agents (see the book’s data appendix for more details).22 The
measurement of business ownership at the survey date in the CPS and
at any time during the year in the SBO/SMOBE also creates a discrep-
ancy in estimates.
To address the issue of whether the difference in treatment of smaller
businesses account for the difference in estimates, we remove the
hours-worked restriction imposed in the CPS estimates of the number
of business owners. In the bottom panel of table 2.4, we report esti-
mates of the number of business owners who report self-employment
as their main job activity and have any number of hours worked in the
survey week. This includes many but not all smaller-scale business
activities. Individuals who report working at a wage or salary job for
more hours than they worked in their business (that is, a side busi-
ness), however, will not be classified as self-employed business own-
ers. Thus, the estimates are still not fully comparable to the SBO and
SMOBE estimates.23 The modified CPS estimate of the total number of
business owners in the United States is 12.9 million in 2002, which re-mains substantially lower than the estimate of 22.5 million businesses
from the 2002 SBO. Estimates of the number of minority businesses are
more similar, but large differences remain in the past few years.
30 Chapter 2

8/9/2019 Race and Entrepreneurial Success - Black , Asian, And White Owned Business in the United States
http://slidepdf.com/reader/full/race-and-entrepreneurial-success-black-asian-and-white-owned-business 44/253
Table 2.4
Comparison of number of businesses and business owners by race, Survey of BusinessOwners (2002), Survey of Minority-Owned Business Enterprises (1982 to 1997), and Cur-
rent Population Survey (1982 to 2002)IncludesC Corpo-rations All White Black Latino Asian
Total number of businesses, SBO and SMOBE:
1982 No 12,059,950 11,318,310 308,260 233,975 187,691
1987 No 13,695,480 12,481,730 424,165 422,373 355,331
1992 No 17,253,143 15,287,578 620,912 862,605 603,426
1997 No 18,278,933 15,492,835 780,770 1,121,433 785,480
1997 Yes 20,440,415 17,316,796 823,499 1,199,896 912,9602002 Yes 22,480,256 18,326,375 1,197,567 1,573,464 1,132,535
Total number of business owners, CPS (15þ hours worked in survey week):
1982 Yes 8,459,840 7,662,950 300,470 291,610
1987 Yes 10,175,150 8,949,320 387,800 496,120
1992 Yes 10,689,690 9,209,860 423,790 581,030 418,200
1997 Yes 11,525,030 9,737,880 530,120 697,200 487,620
2002 Yes 11,268,230 9,290,020 620,840 782,160 501,700
Total number of business owners, CPS (no hours restriction):
1982 Yes 10,060,270 9,104,320 379,280 344,660
1987 Yes 11,696,510 10,303,410 470,180 552,900
1992 Yes 12,379,770 10,676,570 517,320 654,880 463,320
1997 Yes 13,462,580 11,453,560 615,220 779,500 526,610
2002 Yes 12,932,580 10,693,920 719,160 880,590 546,980
Sources: U.S. Census Bureau, Economic Census, Survey of Minority-Owned BusinessEnterprises (1982, 1987, 1992, 1997), U.S. Census Bureau, Survey of Business Owners(2002), special tabulations prepared by the U.S. Census Bureau, and authors calculationsusing the Current Population Survey.
Notes: (1) All firms excludes publicly held, foreign-owned, not-for-profit, and other firms,which are not included in the estimates by race. (2) See the book’s data appendix forchanges in sample criteria and definitions. Estimates are not directly comparable overtime. (3) The white category is equal to all firms minus all minority firms for 1982, 1987,and 1992 and all white firms minus Latino-owned firms in 2002. (4) The most recentlyrevised estimates are reported when applicable. (5) The CPS samples consist of individu-als age 16 and over. Only self-employed business owners working fifteen or more hoursin the survey week are included in the second panel. The third panel does not impose thehours worked restriction. (6) Self-employment status is based on the worker’s main jobactivity and includes owners of both unincorporated and incorporated businesses. (7)All estimates are calculated using sample weights provided by the CPS.
Racial Disparities in Business Ownership and Outcomes 31

8/9/2019 Race and Entrepreneurial Success - Black , Asian, And White Owned Business in the United States
http://slidepdf.com/reader/full/race-and-entrepreneurial-success-black-asian-and-white-owned-business 45/253
Estimates from the CPS indicate rapid growth rates for the number
of minority business owners over the past two decades but not nearly
as rapid as the estimated growth rates in the number of minority-
owned businesses from SBO/SMOBE data.24 The CPS estimates indi-
cate that the number of black business owners roughly doubled from
1982 to 2002, compared with a threefold increase in the number of
black-owned businesses estimated from the SBO/SMOBE data. The
number of Latino business owners increased by 155 percent from 1982
to 2002, and the number of Asian business owners increased by 18 per-
cent from 1992 to 2002. Estimates from SBO/SMOBE indicate much
faster growth rates for the number of Latino and Asian firms over com-
parable time periods.The recent release of the 2002 SBO data received a lot of attention in
the press and among policymakers. The press release by the U.S. Cen-
sus Bureau noted the 45 percent increase in the number of black-
owned businesses since 1997, the 31 percent increase in the number of
Latino-owned businesses, and the 24 percent increase in the number of
Asian-owned businesses (U.S. Census Bureau 2006b). These estimates
were viewed as positive news for the state of minority business, espe-
cially in light of the much slower growth rate in the number of all busi-nesses of 10 percent. Estimates of the number of minority business
owners from the CPS, however, provide evidence of more modest
growth in minority business activity over this five-year period. CPS
estimates indicate that the number of black business owners grew by
17 percent, the number of Latino business owners grew by 12 percent,
and the number of Asian business owners grew by 3 percent from 1997
to 2002.
Although focusing on businesses that represent the owners’ main
work activity reduces the absolute growth rates in the number of
minority-owned businesses, the CPS estimates also indicate rapid
growth rates relative to all business owners or white business owners.
From 1982 to 2002, the total number of business owners increased by
only 33 percent and actually decreased by 2 percent from 1997 to 2002.
The rates of growth in the number of minority business owners are
substantially higher over similar time periods. Thus, both estimates of
business owners in the CPS and businesses in the SBO/SMOBE indi-
cate that the number of minority businesses increased much fasterthan the number of white businesses over the past two decades.
32 Chapter 2

8/9/2019 Race and Entrepreneurial Success - Black , Asian, And White Owned Business in the United States
http://slidepdf.com/reader/full/race-and-entrepreneurial-success-black-asian-and-white-owned-business 46/253
Racial Patterns and Trends in Business Outcomes
Table 2.5 reports estimates of sales and receipts by race from the 2002
SBO and prior SMOBE surveys (1982 to 1997) for minority-owned,
white-owned, and all firms. These data provide the most up-to-date
and commonly used sources of information on minority business per-
formance. The tables reported here represent a new compilation of esti-
mates of recent trends in business outcomes by race. We report
separate estimates for 1997 that both include and exclude C corpora-
tions, but there were other changes over that time period that make
estimates not directly comparable as noted above and in the book’s
data appendix.The 2002 SBO data provide the most recent estimates of annual firm
sales for minority-owned firms. Black-owned firms have much lower
average sales than white-owned firms. Average annual sales and
receipts are $74,018 for black-owned firms compared with $439,579 for
white-owned firms.
Latino firms also have lower average sales than white-owned firms.
Average annual sales are $141,044 for Latino-owned firms in 2002, 32
percent of average annual sales of white-owned firms. Asian-ownedfirms have lower average sales than white-owned firms, but the differ-
ence is much smaller. Average annual sales and receipts are $292,214
for Asian-owned businesses.
Racial disparities in annual sales are not new. Throughout the past
two decades, black- and Latino-owned firms have had substantially
lower average sales than white- and Asian-owned firms. In every year
reported in table 2.5, black and Latino firms had lower sales than
white-owned firms. Asian firms also had lower average sales than
white firms, but the differences were notably smaller.
Trends in annual sales for black- and Latino-owned firms also do not
indicate recent improvements when compared with trends in average
sales for white-owned firms. Average sales of black firms were 25 per-
cent of white average sales in 1992 and dropped to less than 20 percent
in 1997 and 2002. The decline also does not appear to be due to the in-
clusion of C corporations in which black firms are underrepresented.
Average sales for black-owned firms drop from $86,478 to $54,652 in
1997 after excluding C corporations, but average sales for white firmsdrop by a similar percentage. The result is that black average sales are
roughly 20 percent of white average sales with or without C corpora-
tions in 1997.
Racial Disparities in Business Ownership and Outcomes 33

8/9/2019 Race and Entrepreneurial Success - Black , Asian, And White Owned Business in the United States
http://slidepdf.com/reader/full/race-and-entrepreneurial-success-black-asian-and-white-owned-business 47/253
Table 2.5
Sales and receipts by race, Survey of Minority-Owned Business Enterprises (1982 to 1997)and Survey of Business Owners (2002)
Includes CCorporations All Firms
White-OwnedFirms
Total number of firms:
1982 No 12,059,950 11,318,310
1987 No 13,695,480 12,481,730
1992 No 17,253,143 15,287,578
1997 No 18,278,933 15,492,835
1997 Yes 20,440,415 17,316,796
2002 Yes 22,480,256 18,326,375
Total sales and receipts:
1982 No $967,450,721 $932,996,721
1987 No $1,994,808,000 $1,916,968,057
1992 No $3,324,200,000 $3,122,188,579
1997 No $4,239,708,305 $3,904,392,106
1997 Yes $8,392,001,261 $7,763,010,611
2002 Yes $8,783,541,146 $8,055,884,659
Mean sales and receipts:
1982 No $80,220 $82,4331987 No $145,654 $153,582
1992 No $192,672 $204,230
1997 No $231,945 $252,013
1997 Yes $410,559 $448,294
2002 Yes $390,722 $439,579
Sources: U.S. Census Bureau, Economic Census, Survey of Minority-Owned BusinessEnterprises (1982, 1987, 1992, 1997), U.S. Census Bureau, Survey of Business Owners(2002), and special tabulations prepared by the U.S. Census Bureau.Notes: (1) All firms excludes publicly held, foreign-owned, not-for-profit, and other firms,which are not included in the estimates by race. (2) See the book’s data appendix forchanges in sample criteria and definitions. Estimates are not directly comparable overtime. (3) The white category is equal to all firms minus all minority firms for 1982, 1987,and 1992 and all white firms minus Latino-owned firms in 2002. (4) The most recentlyrevised estimates are reported when applicable.
34 Chapter 2

8/9/2019 Race and Entrepreneurial Success - Black , Asian, And White Owned Business in the United States
http://slidepdf.com/reader/full/race-and-entrepreneurial-success-black-asian-and-white-owned-business 48/253
The same finding holds for Latino-owned businesses, except that the
disadvantage and relative decline are smaller. In 1992, average salesfor Latino-owned firms were 44 percent of the average sales for white
firms. In 1997, average sales for Latinos dropped to 35 percent of white
average sales if C corporations are included or 40 percent if C corpora-
tions are excluded.
For both black and Latino firms, these trends represent disappoint-
ing news. Although there has been substantial growth in the number
of businesses relative to white businesses, the average sales of these
firms relative to all firms have not improved over time and, in fact,
have actually lost ground. From 1992 to 2002, average sales among
Asian firms also fell relative to average sales among white firms, al-
though this is partly due to the inclusion of larger C corporations. On
Black-OwnedFirms
Latino-OwnedFirms
Asian- and PacificIslander-Owned Firms
Total number of firms:
1982 308,260 233,975 187,691
1987 424,165 422,373 355,331
1992 620,912 862,605 603,426
1997 780,770 1,121,433 785,480
1997 823,499 1,199,896 912,960
2002 1,197,567 1,573,464 1,132,535
Total sales and receipts:
1982 $9,619,055 $11,759,133 $12,653,315
1987 $19,762,876 $24,731,600 $33,124,326
1992 $32,197,361 $76,842,000 $95,713,613
1997 $42,670,785 $114,430,852 $161,141,634
1997 $71,214,662 $186,274,581 $306,932,982
2002 $88,641,608 $221,927,425 $330,943,036
Mean sales and receipts:
1982 $31,204 $50,258 $67,4161987 $46,592 $58,554 $93,221
1992 $51,855 $89,081 $158,617
1997 $54,652 $102,040 $205,151
1997 $86,478 $155,242 $336,195
2002 $74,018 $141,044 $292,214
Racial Disparities in Business Ownership and Outcomes 35
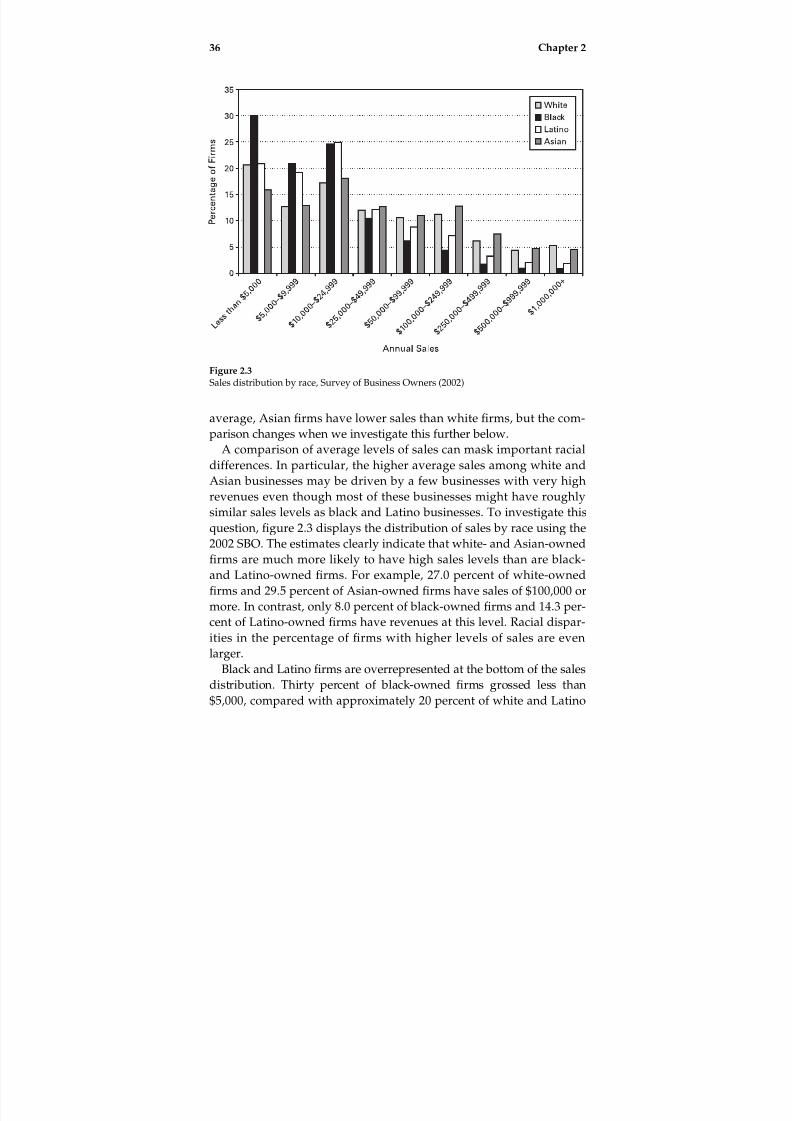
8/9/2019 Race and Entrepreneurial Success - Black , Asian, And White Owned Business in the United States
http://slidepdf.com/reader/full/race-and-entrepreneurial-success-black-asian-and-white-owned-business 49/253
average, Asian firms have lower sales than white firms, but the com-
parison changes when we investigate this further below.
A comparison of average levels of sales can mask important racial
differences. In particular, the higher average sales among white and
Asian businesses may be driven by a few businesses with very high
revenues even though most of these businesses might have roughly
similar sales levels as black and Latino businesses. To investigate this
question, figure 2.3 displays the distribution of sales by race using the
2002 SBO. The estimates clearly indicate that white- and Asian-owned
firms are much more likely to have high sales levels than are black-
and Latino-owned firms. For example, 27.0 percent of white-owned
firms and 29.5 percent of Asian-owned firms have sales of $100,000 or
more. In contrast, only 8.0 percent of black-owned firms and 14.3 per-
cent of Latino-owned firms have revenues at this level. Racial dispar-
ities in the percentage of firms with higher levels of sales are even
larger.Black and Latino firms are overrepresented at the bottom of the sales
distribution. Thirty percent of black-owned firms grossed less than
$5,000, compared with approximately 20 percent of white and Latino
Figure 2.3
Sales distribution by race, Survey of Business Owners (2002)
36 Chapter 2

8/9/2019 Race and Entrepreneurial Success - Black , Asian, And White Owned Business in the United States
http://slidepdf.com/reader/full/race-and-entrepreneurial-success-black-asian-and-white-owned-business 50/253
firms and just over 15 percent of Asian-owned firms. More than 85 per-
cent of black-owned firms grossed less than $50,000. Black firms make
up the largest group in each of the smallest revenue-size classes. Latino
firms are also overrepresented in the lower sales classes except for the
similar percentage of Latino and white firms with less than $5,000 in
sales and receipts.
Overall, white and Asian firms have substantially higher sales and
receipts than do black and Latino firms. Large racial disparities are
revealed when comparing either average levels or the entire distribu-
tion of sales. Asian firms do not have higher average sales than white-
owned firms, but this appears to be driven by a small percentage of
white firms that have extremely high sales. In comparing the distribu-tion of sales, a larger percentage of Asian firms can be found in each of
the largest revenue classes except the $1 million and more level.
Estimates from the SBO and SMOBE also indicate that black- and
Latino-owned firms are less likely to hire employees and hire fewer
employees on average than white- or Asian-owned firms (see table
2.6). Most businesses in the United States do not hire any employees—
slightly less than one quarter of firms had employees in 2002. Whether
or not a firm has employees, however, varies substantially by race.25
Only 7.9 percent of black-owned firms have paid employees, com-
pared with 12.7 percent of Latino-owned firms and 28.5 percent of
Asian-owned firms. Just under one quarter of white-owned firms have
employees with a mean employment level of 2.8. In 2002, black-owned
firms averaged under one employee, and Latino-owned firms aver-
aged only one employee. Asian businesses hired an average of two
employees.
Racial disparities in employment levels are evident throughout the
period covered by the SBO and SMOBE data. Black and Latino firms
are less likely to hire any employees and hire fewer employees on aver-
age than white or Asian firms in every year with available data. The
differences exist even after the inclusion of C corporations in 1997.
Conditioning on employment, racial patterns differ somewhat, and
there is evidence that black- and Latino-employer firms have gained
some ground on white-employer firms. Table 2.7 reports estimates of
mean annual payroll and payroll per employee by race for the sub-
sample of employer firms. It is important to keep in mind, however,that these are larger, more successful firms to begin with and repre-
sent only a small fraction of all businesses in the United States. Black-,
Latino-, and Asian-employer firms have made some gains relative
Racial Disparities in Business Ownership and Outcomes 37

8/9/2019 Race and Entrepreneurial Success - Black , Asian, And White Owned Business in the United States
http://slidepdf.com/reader/full/race-and-entrepreneurial-success-black-asian-and-white-owned-business 51/253
Table 2.6
Employment statistics by race, Survey of Minority-Owned Business Enterprises (1982 to1997) and Survey of Business Owners (2002)
IncludesC Cor-porations
AllFirms
White-OwnedFirms
Black-OwnedFirms
Latino-OwnedFirms
Asian-andPacificIslander-OwnedFirms
Total number of firms:
1982 No 12,059,950 11,318,310 308,260 233,975 187,691
1987 No 13,695,480 12,481,730 424,165 422,373 355,331
1992 No 17,253,143 15,287,578 620,912 862,605 603,4261997 No 18,278,933 15,492,835 780,770 1,121,433 785,480
1997 Yes 20,440,415 17,316,796 823,499 1,199,896 912,960
2002 Yes 22,480,256 18,326,375 1,197,567 1,573,464 1,132,535
Percentage of firms with paid employees:
1982 No N/A N/A 12.3% 16.8% N/A
1987 No 25.5% 26.0% 16.7% 19.6% 26.1%
1992 No 18.2% 18.5% 10.4% 13.4% N/A
1997 No 17.9% 18.5% 8.1% 13.5% 23.6%
1997 Yes 24.6% 25.3% 11.3% 17.7% 31.8%2002 Yes 23.0% 24.6% 7.9% 12.7% 28.5%
Mean number of paid employees:
1982 No N/A N/A 0.4 0.7 N/A
1987 No 1.4 1.5 0.5 0.6 1.0
1992 No 1.6 1.7 0.6 0.8 N/A
1997 No 1.6 1.8 0.5 0.7 1.6
1997 Yes 2.9 3.1 0.9 1.2 2.4
2002 Yes 2.5 2.8 0.6 1.0 2.0
Sources: U.S. Census Bureau, Economic Census, Survey of Minority-Owned BusinessEnterprises (1982, 1987, 1992, 1997), U.S. Census Bureau, Survey of Business Owners(2002), and special tabulations prepared by the U.S. Census Bureau.Notes: (1) All firms excludes publicly held, foreign-owned, not-for-profit, and other firms,which are not included in the estimates by race. (2) See the book’s data appendix forchanges in sample criteria and definitions. Estimates are not directly comparable overtime. (3) The white category is equal to all firms minus all minority firms for 1982, 1987,and 1992, and all white firms minus Latino-owned firms in 2002. (4) The most recentlyrevised estimates are reported when applicable.
38 Chapter 2

8/9/2019 Race and Entrepreneurial Success - Black , Asian, And White Owned Business in the United States
http://slidepdf.com/reader/full/race-and-entrepreneurial-success-black-asian-and-white-owned-business 52/253
Table 2.7
Employment statistics by race for employer firms only, Survey of Minority-Owned Busi-ness Enterprises (1992 to 1997) and Survey of Business Owners (2002)
IncludesC Cor-porations
AllFirms
White-OwnedFirms
Black-OwnedFirms
Latino-OwnedFirms
Asian-andPacificIslander-OwnedFirms
Total number of employer firms:
1982 No N/A N/A 37,841 39,272 N/A
1987 No 3,487,454 3,239,305 70,815 82,908 92,718
1992 No 3,134,959 2,823,264 64,478 115,364 N/A1997 No 3,277,510 2,860,580 63,010 151,571 185,357
1997 Yes 5,027,208 4,372,817 93,235 211,884 289,999
2002 Yes 5,172,064 4,512,577 94,518 199,542 323,161
Mean annual payroll for employer firms:
1982 No N/A N/A $25,055 $31,573 N/A
1987 No $85,786 $89,423 $38,990 $39,120 $37,770
1992 No $167,011 $175,342 $74,547 $93,340 N/A
1997 No $206,087 $219,711 $103,673 $101,540 $116,642
1997 Yes $298,237 $319,051 $153,615 $140,785 $159,2402002 Yes $314,533 $333,494 $185,680 $183,980 $175,984
Payroll per employee for employer firms:
1982 No N/A N/A $7,812 $8,010 N/A
1987 No $15,069 $15,232 $12,524 $12,246 $9,967
1992 No $19,106 $19,390 $13,924 $15,582 N/A
1997 No $22,739 $23,173 $17,266 $18,350 $17,653
1997 Yes $25,454 $25,796 $19,938 $21,480 $20,961
2002 Yes $29,381 $29,842 $23,277 $23,888 $25,352
Sources: U.S. Census Bureau, Economic Census, Survey of Minority-Owned BusinessEnterprises (1982, 1987, 1992, 1997), U.S. Census Bureau, Survey of Business Owners(2002), and special tabulations prepared by the U.S. Census Bureau.Notes: (1) All firms excludes publicly held, foreign-owned, not-for-profit, and other firms,which are not included in the estimates by race. (2) See the book’s data appendix forchanges in sample criteria and definitions. Estimates are not directly comparable overtime. (3) The white category is equal to all firms minus all minority firms for 1982, 1987,and 1992, and all white firms minus Latino-owned firms in 2002. (4) The most recentlyrevised estimates are reported when applicable.
Racial Disparities in Business Ownership and Outcomes 39
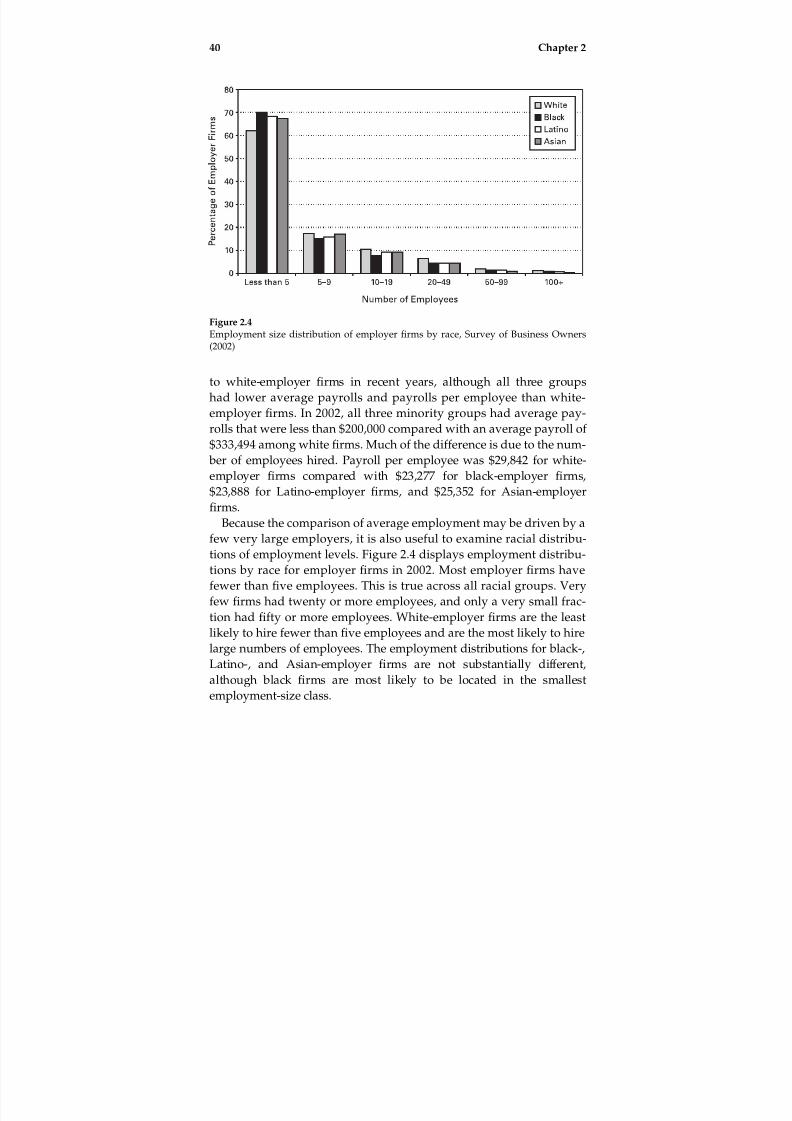
8/9/2019 Race and Entrepreneurial Success - Black , Asian, And White Owned Business in the United States
http://slidepdf.com/reader/full/race-and-entrepreneurial-success-black-asian-and-white-owned-business 53/253
to white-employer firms in recent years, although all three groups
had lower average payrolls and payrolls per employee than white-
employer firms. In 2002, all three minority groups had average pay-
rolls that were less than $200,000 compared with an average payroll of
$333,494 among white firms. Much of the difference is due to the num-
ber of employees hired. Payroll per employee was $29,842 for white-
employer firms compared with $23,277 for black-employer firms,
$23,888 for Latino-employer firms, and $25,352 for Asian-employer
firms.
Because the comparison of average employment may be driven by afew very large employers, it is also useful to examine racial distribu-
tions of employment levels. Figure 2.4 displays employment distribu-
tions by race for employer firms in 2002. Most employer firms have
fewer than five employees. This is true across all racial groups. Very
few firms had twenty or more employees, and only a very small frac-
tion had fifty or more employees. White-employer firms are the least
likely to hire fewer than five employees and are the most likely to hire
large numbers of employees. The employment distributions for black-,Latino-, and Asian-employer firms are not substantially different,
although black firms are most likely to be located in the smallest
employment-size class.
Figure 2.4
Employment size distribution of employer firms by race, Survey of Business Owners(2002)
40 Chapter 2
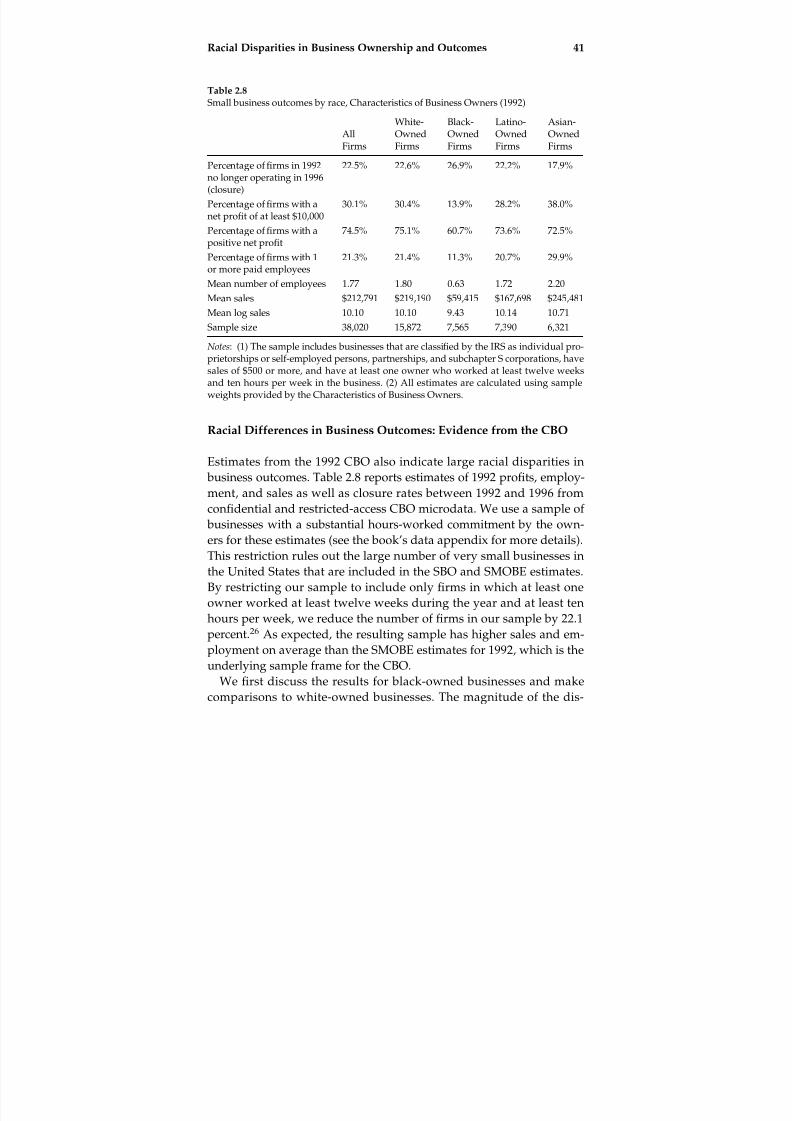
8/9/2019 Race and Entrepreneurial Success - Black , Asian, And White Owned Business in the United States
http://slidepdf.com/reader/full/race-and-entrepreneurial-success-black-asian-and-white-owned-business 54/253
Racial Differences in Business Outcomes: Evidence from the CBO
Estimates from the 1992 CBO also indicate large racial disparities in
business outcomes. Table 2.8 reports estimates of 1992 profits, employ-
ment, and sales as well as closure rates between 1992 and 1996 from
confidential and restricted-access CBO microdata. We use a sample of
businesses with a substantial hours-worked commitment by the own-ers for these estimates (see the book’s data appendix for more details).
This restriction rules out the large number of very small businesses in
the United States that are included in the SBO and SMOBE estimates.
By restricting our sample to include only firms in which at least one
owner worked at least twelve weeks during the year and at least ten
hours per week, we reduce the number of firms in our sample by 22.1
percent.26 As expected, the resulting sample has higher sales and em-
ployment on average than the SMOBE estimates for 1992, which is theunderlying sample frame for the CBO.
We first discuss the results for black-owned businesses and make
comparisons to white-owned businesses. The magnitude of the dis-
Table 2.8
Small business outcomes by race, Characteristics of Business Owners (1992)
AllFirms
White-
OwnedFirms
Black-
OwnedFirms
Latino-
OwnedFirms
Asian-
OwnedFirms
Percentage of firms in 1992no longer operating in 1996(closure)
22.5% 22.6% 26.9% 22.2% 17.9%
Percentage of firms with anet profit of at least $10,000
30.1% 30.4% 13.9% 28.2% 38.0%
Percentage of firms with apositive net profit
74.5% 75.1% 60.7% 73.6% 72.5%
Percentage of firms with 1or more paid employees 21.3% 21.4% 11.3% 20.7% 29.9%
Mean number of employees 1.77 1.80 0.63 1.72 2.20
Mean sales $212,791 $219,190 $59,415 $167,698 $245,481
Mean log sales 10.10 10.10 9.43 10.14 10.71
Sample size 38,020 15,872 7,565 7,390 6,321
Notes: (1) The sample includes businesses that are classified by the IRS as individual pro-prietorships or self-employed persons, partnerships, and subchapter S corporations, havesales of $500 or more, and have at least one owner who worked at least twelve weeksand ten hours per week in the business. (2) All estimates are calculated using sample
weights provided by the Characteristics of Business Owners.
Racial Disparities in Business Ownership and Outcomes 41

8/9/2019 Race and Entrepreneurial Success - Black , Asian, And White Owned Business in the United States
http://slidepdf.com/reader/full/race-and-entrepreneurial-success-black-asian-and-white-owned-business 55/253
parities in business outcomes found in our CBO sample is striking.
For example, only 13.9 percent of black-owned firms have annual prof-
its of $10,000 or more, compared with 30.4 percent of white-owned
firms. In fact, the entire distribution of business net profits before taxes
for black-owned firms is to the left of the distribution for white-owned
firms (with the exception of the largest loss categories).27 Surprisingly,
nearly 40 percent of all black-owned firms have negative profits. Black-
owned firms also have lower survival rates than white-owned firms.
The average probability of business closure between 1992 and 1996 is
26.9 percent for black-owned firms, compared with 22.6 percent for
white-owned firms.28
Estimates from CBO microdata confirm the findings from SMOBEdata on black/white differences in sales and employment. Black-owned
firms are substantially smaller on average than are white-owned firms.
Mean sales among black-owned firms were $59,415 in 1992. Average
sales among white-owned firms were nearly four times larger. The dif-
ference is due not simply to a few very large white firms influencing
the mean. Median sales for black firms were one half that of white
firms, and the percentage of black firms with sales of $100,000 or more
was less than half the percentage of white firms. Estimates from theCBO also indicate that black-owned firms hire fewer employees than
white-owned firms. In 1992, they averaged only 0.63 employees,
whereas white-owned firms hired 1.80 employees. Only 11.3 percent of
black-owned firms hired any employees. In comparison, 21.4 percent
of white-owned firms hired at least one employee. As was shown
earlier, these trends have continued through the more recent surveys.
Unexpectedly, estimates from our CBO sample do not reveal large
disparities in business outcomes for Latino-owned firms. We find very
similar rates of closure, profits, employment, and mean log sales as
white firms. The only business outcome showing a nonnegligible dif-
ference is average sales. We do not have an explanation for these pat-
terns, as the outcomes for Latino-owned businesses presented above
from the SBO and SMOBE data clearly indicate worse outcomes than
for white-owned businesses. One potential explanation for the discrep-
ancy in results is that the two sets of estimates differ in their treatment
of businesses with low hours-worked commitments by the owners.
This appears to be part but not all of the reason for the discrepancy.Published estimates from the 1992 CBO, which do not exclude
smaller-scale businesses, indicate that Latino firms have lower sales,
are less likely to hire employees than are white-owned firms, but have
42 Chapter 2

8/9/2019 Race and Entrepreneurial Success - Black , Asian, And White Owned Business in the United States
http://slidepdf.com/reader/full/race-and-entrepreneurial-success-black-asian-and-white-owned-business 56/253
only slightly lower profit levels and slightly higher closure rates than
white-owned firms (U.S. Census Bureau 1997).
To follow up on this question, we estimate business outcomes from
the 2003 Survey of Small Business Finances (SSBF) and 2000 U.S.
Census. Estimates from the 2003 SSBF indicate that Latino firms have
lower sales, profits, and employment levels than white firms. Latino
business owners are also found to have lower earnings than white
business owners using data from the 2000 census. These results are dif-
ferent than those from our CBO microdata but are consistent with the
SMOBE/SBO estimates.
Robb (2000) also found evidence that the CBO may have problems
capturing Latino firms. While her research showed statistically signifi-cant differences between survival rates of Hispanic- and white-owned
firms using the SMOBE data, those differences did not appear in the
CBO data, which is problematic because the CBO is a representative
subsample of the SMOBE. Although there is uncertainty over whether
the lack of differences in business outcomes that we report from our
CBO sample is real, we cannot explain gaps that do not exist in
our data. Thus, we do not focus on explaining the causes of differences
in business outcomes between Latino and white firms in our analysisof CBO microdata in the following chapters. Instead, we focus on iden-
tifying the causes of differences in outcomes between black-, Asian-,
and white-owned businesses.
Although estimates from the SBO and SMOBE provide mixed results
on the performance of Asian firms relative to white firms, the evidence
from our CBO sample of more active businesses is clear. Asian firms
outperform white firms on every business outcome measure reported
in table 2.8. Asian-owned firms are 16.9 percent less likely to close,
20.6 percent more likely to have profits of at least $10,000, and 27.2
percent more likely to hire employees than white-owned firms. Asian
firms have mean annual sales that are also higher than the mean an-
nual sales of white firms. The difference in log annual sales, which less-
ens the influence of large outliers, implies that Asian firms have annual
sales that are roughly 60 percent higher than the mean sales of white
firms. The exclusion of smaller businesses in which the owner is pro-
viding only a minimal hours- and weeks-worked commitment leaves
little doubt about whether Asian businesses perform better on averagethan white firms.
Using the published CBO results, we can also examine the distribu-
tion of profits by race. Unlike estimates that we generate from CBO
Racial Disparities in Business Ownership and Outcomes 43

8/9/2019 Race and Entrepreneurial Success - Black , Asian, And White Owned Business in the United States
http://slidepdf.com/reader/full/race-and-entrepreneurial-success-black-asian-and-white-owned-business 57/253
microdata, published CBO estimates include all businesses and do not
rule out ones with low hours or weeks worked by the owner. Figure
2.5 displays racial distributions of firm profits. We do not report sepa-
rate estimates for Asians because in the published CBO data they are
grouped with Native Americans.29 The distribution of profits indicates
that the majority of firms (about half in each race category) receivedpositive profits up to $10,000. The next-largest category, again across
all race groups, was a loss of up to $10,000. Black firms are clearly
overrepresented in the less-than-$10,000-loss category and underrepre-
sented in the large-profit categories relative to white firms. On the
other hand, the profit distribution for Latino businesses does not differ
substantially from the white profit distribution.
Estimates from previous waves of the CBO generally indicate similar
racial patterns in business outcomes. For example, using the 1987 CBO,Bates (1997) found that closure rates were higher among black-owned
firms compared with other minority-owned businesses and white-
owned businesses. Bates also found that Asian-owned firms have
Figure 2.5
Firm profit distribution by race, published estimates from the Characteristics of BusinessOwners (1992)
44 Chapter 2

8/9/2019 Race and Entrepreneurial Success - Black , Asian, And White Owned Business in the United States
http://slidepdf.com/reader/full/race-and-entrepreneurial-success-black-asian-and-white-owned-business 58/253
somewhat lower average sales than white-owned firms but slightly
higher survival rates and profits than white-owned firms.
Estimates from Other Business-Level Data Sources
Focusing on employer firms, two recent studies use special adminis-
trative longitudinal data on minority-owned businesses to examine
survival and other dynamic outcomes. Robb (2002) links Business In-
formation Tracking Series (BITS) data from 1992 to 1996 to SMOBE
microdata from 1992 and examines new firm-survival rates by race.
Estimates from the linked data indicate that 48.7 percent of new white-
employer firms and 51.7 percent of new Asian-employer firms survivefrom 1992 to 1996. In contrast, only 34.8 percent of new black-
employer firms and 43.7 percent of new Latino-employer firms survive
over this period. Boden and Headd (2002) also used this matched data-
set and find similar results.
Lowrey (2005) uses a special U.S. Census dataset that tracks 1997
SMOBE respondents over time to examine racial differences in sur-
vival, contraction, and expansion among employer establishments
from 1997 to 2001. She finds lower survival rates among black- andLatino-owned establishments than among nonminority and Asian-
owned establishments. In contrast to these results, however, she finds
that Latino establishments had a higher expansion rate and that black
and Latino establishments had lower contraction rates than white
establishments. Asian establishments had a higher expansion rate but
a slightly higher contraction rate than white firms.
Estimates from the 2003 Survey of Small Business Finances (SSBF),
which is conducted by the Federal Reserve and is known to include a
larger share of more established firms than the SBO, indicate similar
racial patterns for business outcomes. Asian firms have much higher
sales, profits, and employment levels than white firms. Black and Lat-
ino firms have substantially lower business outcomes. Similar patterns
for black and Latino firms are found using the 1998 SSBF (Robb 2005).
These results confirm the rankings of business performance by race
generally found in the CBO and SBO/SMOBE data.
Differences across Asian and Latino Groups
We briefly discuss the differences within the Asian and Latino groups.
Table 2.9 reports estimates of the number of firms, average sales, and
Racial Disparities in Business Ownership and Outcomes 45
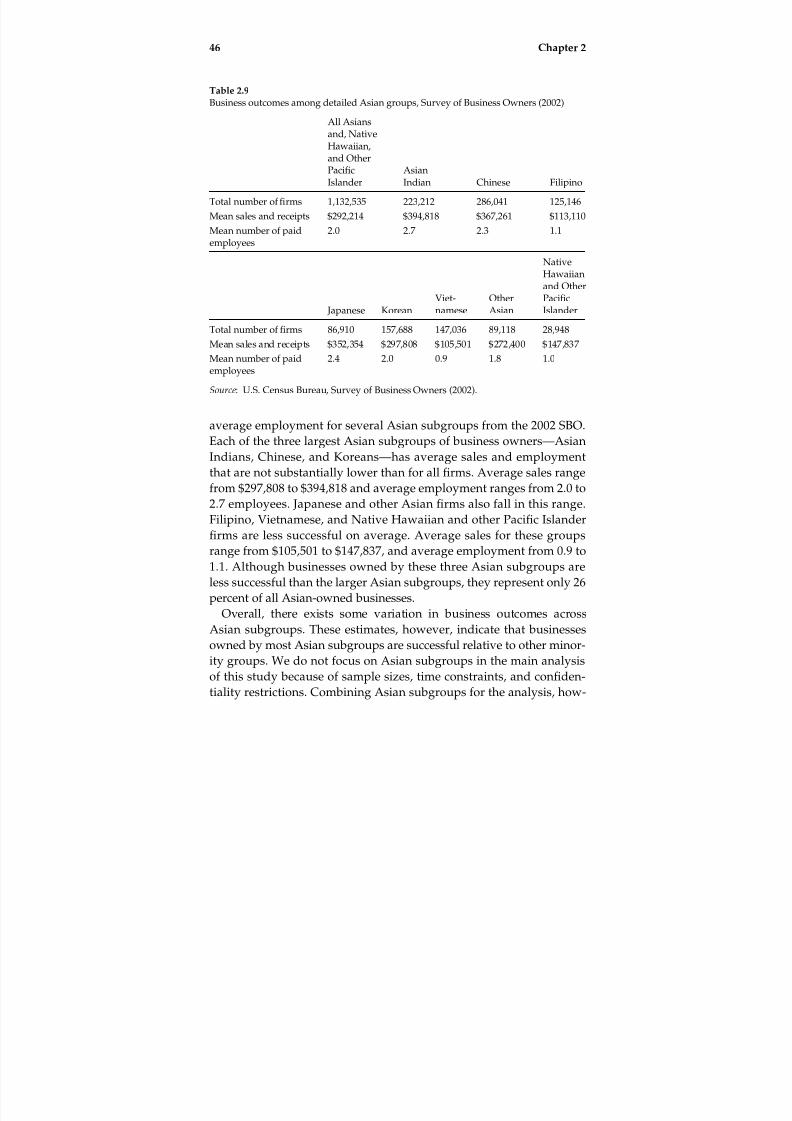
8/9/2019 Race and Entrepreneurial Success - Black , Asian, And White Owned Business in the United States
http://slidepdf.com/reader/full/race-and-entrepreneurial-success-black-asian-and-white-owned-business 59/253
average employment for several Asian subgroups from the 2002 SBO.
Each of the three largest Asian subgroups of business owners—Asian
Indians, Chinese, and Koreans—has average sales and employment
that are not substantially lower than for all firms. Average sales range
from $297,808 to $394,818 and average employment ranges from 2.0 to
2.7 employees. Japanese and other Asian firms also fall in this range.
Filipino, Vietnamese, and Native Hawaiian and other Pacific Islanderfirms are less successful on average. Average sales for these groups
range from $105,501 to $147,837, and average employment from 0.9 to
1.1. Although businesses owned by these three Asian subgroups are
less successful than the larger Asian subgroups, they represent only 26
percent of all Asian-owned businesses.
Overall, there exists some variation in business outcomes across
Asian subgroups. These estimates, however, indicate that businesses
owned by most Asian subgroups are successful relative to other minor-
ity groups. We do not focus on Asian subgroups in the main analysis
of this study because of sample sizes, time constraints, and confiden-
tiality restrictions. Combining Asian subgroups for the analysis, how-
Table 2.9
Business outcomes among detailed Asian groups, Survey of Business Owners (2002)
All Asians
and, NativeHawaiian,and OtherPacificIslander
AsianIndian Chinese Filipino
Total number of firms 1,132,535 223,212 286,041 125,146
Mean sales and receipts $292,214 $394,818 $367,261 $113,110
Mean number of paidemployees
2.0 2.7 2.3 1.1
Japanese KoreanViet-namese
OtherAsian
NativeHawaiianand OtherPacificIslander
Total number of firms 86,910 157,688 147,036 89,118 28,948
Mean sales and receipts $352,354 $297,808 $105,501 $272,400 $147,837
Mean number of paidemployees
2.4 2.0 0.9 1.8 1.0
Source: U.S. Census Bureau, Survey of Business Owners (2002).
46 Chapter 2

8/9/2019 Race and Entrepreneurial Success - Black , Asian, And White Owned Business in the United States
http://slidepdf.com/reader/full/race-and-entrepreneurial-success-black-asian-and-white-owned-business 60/253
ever, is not likely to create serious problems based on this comparison
of outcomes.Examining business outcomes for more detailed Latino groups, we
find a few differences (table 2.10). Puerto Ricans have the lowest aver-
age sales ($112,723), whereas Cubans have the highest average sales
($233,660). The largest Latino subgroup, Mexican Americans, have av-
erage sales that are very similar to the Latino total. Employment pat-
terns also differ somewhat across Latino subgroups ranging from a
low of 0.7 mean employees for Puerto Rican firms to a high of 1.4
mean employees for Cuban firms. Mexican American firms hire an av-erage of one employee.
Overall, there is some variation in business outcomes across Latino
subgroups, but these differences are small relative to the difference
between Latinos and non-Latino whites. For all Latino subgroups, av-
erage sales and employment are substantially lower than for white-
owned businesses.
Conclusions
In this chapter, we provide evidence on recent trends in business own-
ership and business outcomes by race from the CPS, SBO/SMOBE,
and CBO. The CPS microdata provide the most up-to-date estimates
of the rate of business ownership in the United States, and the SBO/
SMOBE provide the most up-to-date national estimates of business
outcomes by race. The 1992 CBO microdata, which are used in follow-
ing chapters, provide evidence for additional business outcomes and
allow for the exclusion of businesses in which the owner provides onlya minimal work effort. We generate and collect estimates from several
sources to create a comprehensive picture of the state of minority busi-
nesses in the United States over the past two and a half decades.
Table 2.10
Business outcomes among detailed Latino groups, Survey of Business Owners (2002)
All
Latinos
Mexican
American
Puerto
Rican Cuban
Other
Latino
Total number of firms 1,573,464 701,078 109,475 151,688 596,125
Mean sales and receipts $141,044 $137,980 $112,723 $233,660 $124,503
Mean number of paidemployees
1.0 1.0 0.7 1.4 0.8
Source: U.S. Census Bureau, Survey of Business Owners (2002).
Racial Disparities in Business Ownership and Outcomes 47

8/9/2019 Race and Entrepreneurial Success - Black , Asian, And White Owned Business in the United States
http://slidepdf.com/reader/full/race-and-entrepreneurial-success-black-asian-and-white-owned-business 61/253
A clear ordering of business success exists across racial groups in
the United States. Whites and Asians have the highest rates of busi-
ness ownership and own the most successful businesses. Among all
businesses, white firms generally outperform Asian firms slightly;
however, after removing small-scale and side businesses, Asian firms
outperform white firms. Estimates from 1992 CBO microdata indicate
that Asian-owned firms are 16.9 percent less likely to close, 20.6 per-
cent more likely to have profits of at least $10,000, and 27.2 percent
more likely to hire employees than white-owned firms. Furthermore,
they have mean annual sales that are roughly 60 percent higher than
the mean sales of white-owned firms.
African American firms have the lowest rates of business owner-ship and the worst outcomes of all major ethnic and racial groups. The
low rate of business ownership among blacks relative to whites—
approximately one third the rate—held for most of the twentieth cen-
tury. In the past few years, however, there is some evidence of rising
black self-employment rates. Estimates from the SBO, SMOBE, and
CBO also indicate that black-owned firms have substantially worse
outcomes than white- and Asian-owned firms. Black-owned firms
have lower revenues and profits, hire fewer employees, and are morelikely to close than white- and Asian-owned businesses.
Finally, Latinos have the second lowest rate of business ownership
of the four major ethnic and racial groups. Their rate of business own-
ership is only two thirds the rate of business ownership among white
non-Latinos. Estimates from the SBO/SMOBE data also indicate sub-
stantially worse outcomes among Latino-owned firms than white- or
Asian-owned firms. Latino-owned businesses have lower average
sales, are less likely to hire employees, and hire fewer employees than
white-owned businesses. Unexpectedly, however, estimates from our
CBO sample do not reveal large disparities in business outcomes for
Latino-owned firms. We find very similar rates of closure, profits, em-
ployment, and mean log sales. The lack of large disparities between
white and Latino firms, however, appears to be peculiar to the CBO.
Estimates from other sources, such as the SSBF and U.S. Census, in ad-
dition to the SBO/SMOBE indicate that Latino-owned businesses have
worse average outcomes than white-owned businesses.
48 Chapter 2
8/9/2019 Race and Entrepreneurial Success - Black , Asian, And White Owned Business in the United States
http://slidepdf.com/reader/full/race-and-entrepreneurial-success-black-asian-and-white-owned-business 62/253
3 The Determinants of Small Business Success
In the previous chapter, we reviewed the main findings from the rap-idly growing literature on minority business ownership. The findings
from this literature indicate that racial differences in access to financial
capital, human capital, and parental self-employment contribute to ra-
cial disparities in business-ownership rates. A much smaller literature,
however, focuses on the related question of why there are such large
racial differences in business outcomes, especially using business-level
datasets. The lack of research is unfortunate given that racial dispar-
ities in many business outcomes are much larger than disparities in business-ownership rates. For example, the average sales of white-
owned businesses is more than five times the average sales of black-
owned businesses, whereas white rates of business ownership are two
to three times larger than black business-ownership rates. We know
relatively little about what factors explain the substantial disparities in
survival prospects, profits, sales, and employment across businesses
owned by different racial groups.
Before examining the causes of racial disparities in business out-comes, however, we first need to identify the determinants of business
success. Once these factors are identified, we can make comparisons
across racial groups. Of particular interest is determining which owner
and firm characteristics are important inputs in the production process
and thus are associated with success in business. How important are
human capital and financial capital in creating successful businesses?
Is the owner’s family-business background an important determinant
of success, relative to these more well-known factors? How important
are prior work experience in a family business, similar type of busi-ness, and managerial capacity for business success? We investigate
these questions and examine whether additional characteristics of the
owner and firm are linked to operating successful businesses using the

8/9/2019 Race and Entrepreneurial Success - Black , Asian, And White Owned Business in the United States
http://slidepdf.com/reader/full/race-and-entrepreneurial-success-black-asian-and-white-owned-business 63/253
confidential and restricted-access Characteristics of Business Owners
(CBO) microdata.
The owner’s education level is likely to be one of the most important
determinants of business success. Education is generally found to in-
crease the likelihood of owning a business in the United States even
though the returns to education in the labor market are substantial.1
Perhaps even more important to the success of the business is adequate
access to financial capital. As noted in the previous chapter, a large lit-
erature finds that an owner’s personal wealth is positively associated
with business ownership, which has often been interpreted as evidence
of liquidity constraints. If some entrepreneurs can obtain only limited
amounts of startup capital because they do not have collateral for loansor because they experience lending discrimination, then their newly
created businesses may grow more slowly or not perform as well as
firms started by entrepreneurs who have access to the optimal levels
of startup capital. Thus, access to startup capital is likely to be critical
to business success.
The owner’s family-business background may also be an important
factor in creating and operating successful businesses. The children of
business owners are much more likely to own businesses than are thechildren of nonbusiness owners (Lentz and Laband 1990; Fairlie 1999;
Dunn and Holtz-Eakin 2000; Hout and Rosen 2000). Although the
intergenerational transmission of business ownership is strong, the
effects on small business outcomes conditioning on ownership are es-
sentially unknown. An interesting question is whether children of
business owners also start more successful firms than children of non-
business owners. Furthermore, the underlying causes of intergenera-
tional links in business ownership have not been identified in the
literature. These links may be due to the acquisition of general business
or managerial experience from working in family-owned businesses,
the acquisition of industry- or firm-specific business experience work-
ing in family-owned businesses, inheritances of businesses, or a cor-
relation among family members in preferences for entrepreneurial
activities.
The previous literature has not analyzed the owner and firm charac-
teristics that are associated with business success in detail because only
a few datasets contain sufficient information to thoroughly investigatethis issue. Individual-level datasets, such as the U.S. Census or the
Current Population Survey (CPS), contain detailed information on the
demographic characteristics of self-employed business owners but con-
50 Chapter 3
8/9/2019 Race and Entrepreneurial Success - Black , Asian, And White Owned Business in the United States
http://slidepdf.com/reader/full/race-and-entrepreneurial-success-black-asian-and-white-owned-business 64/253
tain very little information on the characteristics of the business. On the
other hand, business-level datasets contain detailed information on the
business but generally have few, if any, measures of owner characteris-
tics (see the book’s data appendix for more details). Furthermore, only
a few nationally representative datasets contain information on paren-
tal and family self-employment and business inheritances. To our
knowledge, the CBO is the only nationally representative dataset that
contains information on prior work experience in businesses owned by
family members and prior work experience in businesses providing
similar goods and services. The confidential and restricted-access CBO
data are ideally suited for examining the effects of family background,
human capital, business human capital, and other factors on businessoutcomes because they include detailed characteristics of both the
owner and the firm. The CBO data also include information on several
business outcomes.
We first identify some of the key factors and discuss why they might
be important determinants of business success. We provide evidence
on the simple relationships between several owner and firm character-
istics and two measures of business success—sales and employment.
Next, we estimate the effects of owner and business characteristics onseveral business outcomes using multivariate regression models. The
use of multivariate regressions allows us to identify the separate and
independent effects of these characteristics on the success of the busi-
ness. Many owner and business characteristics (such as education,
family-business ownership, and startup capital) are likely to be corre-
lated. As measures of business success, we use closure rates, profits,
employment, and sales. Although none of these is a perfect measure of
business success, the results from all four outcomes provide a decent
overall picture of business performance.
Education
The success of a business is likely to be linked to the education level of
the owner. One reason is that the general and specific knowledge and
skills acquired through formal education may be useful for running a
successful business. For example, general skills (such as learning how
to read, write, and communicate through coursework) or specific skills(such as learning accounting and marketing) increase the ability of the
owner to find customers, create new products, and manage the firm.
The owner’s level of education may also serve as a proxy for his or her
The Determinants of Small Business Success 51

8/9/2019 Race and Entrepreneurial Success - Black , Asian, And White Owned Business in the United States
http://slidepdf.com/reader/full/race-and-entrepreneurial-success-black-asian-and-white-owned-business 65/253
overall ability or as a positive signal to potential customers, lenders,
and business suppliers. For all of these reasons, we expect to find that
more educated owners have more successful firms.
Published estimates from the 1992 CBO reveal a clear positive rela-tionship between owner’s education and business outcomes (U.S. Cen-
sus Bureau 1997).2 Table 3.1 reports estimates of the percentage of
business owners in five major education levels who have sales of
$50,000 and $100,000 or more and hire employees. The percentage
of owners who have high average sales generally increases with each
education level and the differences are large. For example, 28.0 percent
of firms with owners who are college graduates have sales of $50,000
or more compared with 21.3 percent of firms with owners that arehigh school dropouts. The difference is even larger for firms with own-
ers who have graduate degrees. These firms are 13.9 percentage points
(or 65 percent) more likely to have sales of $50,000 or more than are
firms owned by high school dropouts. These patterns are consistent
across education groups for sales of $100,000 or more as well. The
owner’s education level is also related to the employment level of the
firm. We find that firms with more educated owners are generally
more likely to hire employees. Nearly 19 percent of firms owned bycollege graduates have paid employees compared with 14.1 percent of
firms owned by high school dropouts. Overall, the owner’s education
level is clearly associated with better business outcomes. A multivari-
ate regression analysis is used later to examine the statistical strength
Table 3.1
Small business outcomes by owner’s education level, Characteristics of Business Owners(1992)
Percentage
Sales of $50,000þ
Sales of $100,000þ
PaidEmployees
AllFirms
High school dropout 21.3% 13.2% 14.1% 10.0%
High school graduate 24.3 15.0 16.8 24.1
Some college 23.6 15.0 16.8 28.9
College graduate 28.0 18.0 18.7 21.5
Graduate school 35.2 23.8 23.7 15.7
All firms 26.4 17.1 18.2Source: U.S. Bureau of the Census (1997).Note: The sample includes businesses that are classified by the IRS as individual proprie-torships or self-employed persons, partnerships, and subchapter S corporations and thathave sales of $500 or more.
52 Chapter 3

8/9/2019 Race and Entrepreneurial Success - Black , Asian, And White Owned Business in the United States
http://slidepdf.com/reader/full/race-and-entrepreneurial-success-black-asian-and-white-owned-business 66/253
of the relationship and its presence after controlling for additional fac-
tors that might be correlated with education, such as management ex-
perience and startup capital.
Family-Business Background
Another potentially important determinant of business success is the
owner’s family-business background. The owner’s family-business
background can be characterized by whether he or she has a parent
who was a self-employed business owner, worked for a family busi-
ness, or inherited a business. All of these factors may influence the like-
lihood that an individual becomes a business owner and that the business is successful. Indeed, an important finding in the previous
literature is that an individual who had a self-employed parent is
roughly two to three times more likely to be self-employed than some-
one who did not have a self-employed parent (Lentz and Laband 1990;
Fairlie 1999; Dunn and Holtz-Eakin 2000; Hout and Rosen 2000).3
Before exploring whether family-business backgrounds are also im-
portant for business success, we review the potential explanations for
intergenerational links in business ownership. Several explanationsfor the intergenerational transmission of business ownership have
been offered in the previous literature. First, the informal learning or
apprenticeship-type training that occurs in growing up in the context
of a family business may provide an important opportunity for future
owners to acquire human capital related to operating a successful
business (Lentz and Laband 1990). Family-business experience can be
classified into two types, which we term general business human capital
and specific business human capital. General business human capital
includes ‘‘general administrative and personnel management skills’’
and ‘‘general managerial expertise’’ (Lentz and Laband 1990; Dunn
and Holtz-Eakin 2000). Specific business human capital includes
‘‘enterprise-specific skills, ‘‘information specific to the firm’s produc-
tion,’’ and ‘‘job- or industry-specific knowledge.’’ Dunn and Holtz-Eakin
(2000) find that self-employed sons follow their father’s occupation in
only 32 percent of cases, suggesting that the business expertise being
passed within families is not only specific to the types of business
chosen by these sons.Another explanation is that intergenerational links in self-
employment may be caused by a correlation among family members
in preferences or ability for entrepreneurial activities. The correlation
The Determinants of Small Business Success 53

8/9/2019 Race and Entrepreneurial Success - Black , Asian, And White Owned Business in the United States
http://slidepdf.com/reader/full/race-and-entrepreneurial-success-black-asian-and-white-owned-business 67/253
may be due simply to similarities among family members in prefer-
ences for being one’s own boss or entrepreneurship or similarities in
other personal characteristics that are associated with self-employment,
such as entrepreneurial ability and attitudes towards risk (Fairlie
2002).4 Using the National Longitudinal Surveys (NLS), however,
Dunn and Holtz-Eakin (2000) find that the intergenerational correla-
tion in self-employment is strongest for successfully self-employed
parents, suggesting that it is the transmission of business skills rather
than similarities in tastes for the self-employed lifestyle that drives the
relationship between parents’ and children’s self-employment propen-
sities. Related to the issue of correlated preferences and ability, inter-
generational links may also be created by self-employed parents bycreating role models for their children to become business owners.
Observing a successfully self-employed parent may improve a child’s
assessment of his or her own entrepreneurial ability.
Intergenerational links may also be created directly when the chil-
dren of self-employed business owners become partners with their
parents or directly inherit businesses. Forming a partnership with a
child may represent a less expensive method of helping a child to
become a business owner. Also, partnerships and inheritances mayrepresent an efficient form of transmitting reputation capital or an
established clientele from one generation to the next. Related to this
issue, successful business owners may be more likely to transfer finan-
cial wealth to their children, potentially making it easier for them to
become self-employed. Dunn and Holtz-Eakin (2000), however, pro-
vide estimates suggesting that wealth transfers play only a modest
role. We also find that financial transfers from parents to children are
not a common source of startup capital among small business owners.
Only 6.4 percent of owners borrowed capital from their families.
Evidence from the CBO on Intergenerational Links in Business
Ownership
The CBO contains information on having a self-employed family mem-
ber, prior work experience in that family member’s business, and busi-
ness inheritances, which allows us to disentangle some of the potential
explanations offered in the previous literature. If most business ownershave self-employed family members but do not have prior work expe-
rience in these family businesses, then we can infer that the correla-
tion in entrepreneurial preferences or ability is more important than
54 Chapter 3

8/9/2019 Race and Entrepreneurial Success - Black , Asian, And White Owned Business in the United States
http://slidepdf.com/reader/full/race-and-entrepreneurial-success-black-asian-and-white-owned-business 68/253
acquiring general and specific business human capital in creating the
intergenerational link in self-employment. In addition, if very few busi-
nesses are inherited, then we can infer that business inheritances play
only a minor role in establishing the intergenerational link in business
ownership.Table 3.2 reports the percentage of small business owners who had a
family member who was a business owner, the percentage of owners
who worked for that family member, and other measures related to
family-business background.5 More than half of all business owners
had a self-employed family member prior to starting their business.
Conditional on having a self-employed family member, nearly 45 per-
cent of all small business owners worked in that family member’s busi-
ness. Overall, 22.5 percent of small business owners worked in a family business prior to starting or acquiring their business.6
The finding that more than 50 percent of all small business owners
had a family member who was a self-employed business owner is
nearly identical to a National Federation of Independent Business
(NFIB) survey that found that 52.2 percent of independent business-
men had parents who were business owners (Lentz and Laband 1990).
Although we do not have a comparison group of nonbusiness owners
and family members may include spouses and siblings in addition to
parents, the finding that half of business owners have a self-employed
family member suggests a high level of intergenerational transmission
of business ownership. Under reasonable assumptions, it is easy to
show that these estimates imply that the children of self-employed
Table 3.2
Family business background measures, Characteristics of Business Owners (1992)
All Firms
(percent)
Sample
Size
Had a self-employed family member prior to starting the firm 51.6% 37,740
Worked in that family member’s business (conditional) 43.6 36,575
Worked in a family member’s business (unconditional) 22.5 36,575
Worked at a business with similar goods or services 50.1 37,238
Inherited their businesses 1.6 37,619
Received their businesses as a transfer of ownership or a gift 6.6 37,707
Notes: (1) The sample includes businesses that are classified by the IRS as individual pro-
prietorships or self-employed persons, partnerships, and subchapter S corporations, havesales of $500 or more, and have at least one owner who worked at least twelve weeksand ten hours per week in the business. (2) All estimates are calculated using sampleweights provided by the Characteristics of Business Owners.
The Determinants of Small Business Success 55
8/9/2019 Race and Entrepreneurial Success - Black , Asian, And White Owned Business in the United States
http://slidepdf.com/reader/full/race-and-entrepreneurial-success-black-asian-and-white-owned-business 69/253
parents are three times more likely to be self-employed than are the
children of non-self-employed parents, which is consistent with previ-
ous findings in the literature (see the appendix to this chapter for more
details). Another interesting finding is that more than half of all busi-
ness owners who have a self-employed family member did not work
for that family member’s business. This finding suggests that intergen-
erational links in self-employment are not due solely to the acquisition
of general and specific business capital. Thus, part of the reason that
the children of business owners are more likely to own businesses
appears to be similarities between family members in entrepreneurial
preferences and ability.
Work Experience in Family Businesses
The CBO also contains information on whether the owner previously
worked in a similar business prior to starting this business.7 An exam-
ple of this type of work experience would be a restaurant owner who
works in a restaurant prior to starting his or her business. Similar busi-
ness work experience undoubtedly provides opportunities for acquir-
ing job- or industry-specific business human capital in addition to moregeneral business human capital. About half of all small business owners
report working in a similar business prior to starting their business.
Among owners who worked in a family member’s business, 55.8
percent report working in a business that provided similar goods and
services. Unfortunately, however, we cannot identify whether the fam-
ily member’s business is the same as the business providing similar
goods and services. Therefore, our estimate provides only an ‘‘upper
bound’’ estimate of the percentage of owners who acquired specific
business human capital from working in a family member’s business.
Nevertheless, the estimate of roughly 50 percent suggests that family
businesses are providing opportunities to acquire general business
human capital and not just specific business human capital. This find-
ing is consistent with the finding in Dunn and Holtz-Eakin (2000) that
self-employed sons follow their father’s occupation in only 32 percent
of cases.
Business Inheritances
Another explanation is that the children of self-employed business
owners become partners with their parents or directly inherit busi-
56 Chapter 3

8/9/2019 Race and Entrepreneurial Success - Black , Asian, And White Owned Business in the United States
http://slidepdf.com/reader/full/race-and-entrepreneurial-success-black-asian-and-white-owned-business 70/253
nesses. In contrast to the large percentage of owners who have a self-
employed family member and prior work experience in that family
business, very few small businesses are inherited. Estimates from the
CBO indicate that only 1.6 percent of all small businesses are inherited.
This finding suggests that the role of business inheritances in determin-
ing intergenerational links in self-employment is limited at best.
For comparison, the Federal Reserve’s Survey of Small Business
Finances (SSBF) includes information on business inheritances and
gifts. Estimates from the SSBF indicate that 4.0 percent of firms are
inherited or acquired as gifts. Estimates of the percentage of firms that
are inherited from the Federal Reserve’s Survey of Consumer Finances
(SCF) indicate that 3.5 percent of businesses are inherited or acquiredas gifts. Unfortunately, both the SSBF and SCF questionnaires do not
distinguish between inheritances and gifts.
Lentz and Laband (1990) also provide estimates of business inheri-
tances from a sample of independent businessmen from the NFIB.
They find a much higher rate of business inheritances in their sample
(14.2 percent). The discrepancy may be due to the much larger scale
of businesses included in the NFIB. These firms had average sales of
approximately $2 million in 1979, compared with slightly more than$200,000 in the CBO sample.
The CBO also includes information on whether the owner acquired
the business through a ‘‘transfer of ownership/gift.’’ This form of re-
ceipt of ownership may capture parents who give firms to their chil-
dren. It may also contain many other forms of business transfers and
is not limited to family members. Even with this concern, we find that
only 6.6 percent of owners received their business through a transfer
of ownership or gift, suggesting that direct parent-to-child transfers of
businesses cannot represent a large percentage of all small businesses.
In fact, if we remove owners who did not have a self-employed family
member prior to starting the business, only 4.0 percent of owners
received a transfer of ownership or gift. Thus, the maximum number
of owners in the CBO inheriting a business or receiving one as a gift is
5.6 percent. This probably greatly overstates the total, however, as only
4.0 percent of business owners in the SSBF (which includes larger,
more established businesses than the CBO) inherited or received their
business as a gift. If large corporations other than S corporations areremoved, the percentage of businesses that are inherited or acquired
as a gift drops to 3.5 percent in the SSBF. There is the possibility, how-
ever, that businesses are sold at below-market prices from parents to
The Determinants of Small Business Success 57

8/9/2019 Race and Entrepreneurial Success - Black , Asian, And White Owned Business in the United States
http://slidepdf.com/reader/full/race-and-entrepreneurial-success-black-asian-and-white-owned-business 71/253
children. Unfortunately, there is no information available on this type
of transfer.
Related to business inheritances, we also find that financial transfers
from parents to children are not a common source of startup capital
among small business owners. Only 6.4 percent of owners borrowed
capital from their family. This finding is consistent with the finding in
Dunn and Holtz-Eakin (2000) that financial transfers from parents to
children do not appear to be responsible for the intergenerational
transmission of business ownership.
Intergenerational Links, Family-Business Backgrounds, and Business
Success
Although there is uncertainty over the correspondence between family
members and parents on the CBO questionnaire, the estimates re-
ported in table 3.2 provide some suggestive evidence on the causes of
intergenerational links in self-employment. These links appear to be
partly but not entirely driven by opportunities to acquire both general
and specific business human capital from working in family members’
businesses. Business inheritances and partnerships with family mem- bers appear to play only a minor role. We next examine whether these
factors are important in determining small business outcomes.
We first examine the relationship between two family-business back-
ground measures and success in small business using published esti-
mates from the CBO. Table 3.3 reports estimates of the percentage of
business owners with and without a family-business background who
have sales of $50,000 and $100,000 or more and hire employees. The
percentage of business owners who have high average sales and hire
employees is higher for those who had a self-employed family mem-
ber. We also find that owners who have prior work experience in a
family member’s business have better outcomes than owners who do
not have this work experience. The differences in outcomes, however,
are much larger for having prior work experience. For example, firms
with owners who have prior work experience in family member’s busi-
ness are 7.2 percentage points more likely to have sales of $50,000 or
more, whereas firms with owners who have a self-employed family
member prior to starting the firm are 3.9 percentage points more likelyto have sales of $50,000 or more. These findings suggest that the gen-
eral and specific business human capital acquired from working in a
family member’s business may have a strong effect on business suc-
58 Chapter 3
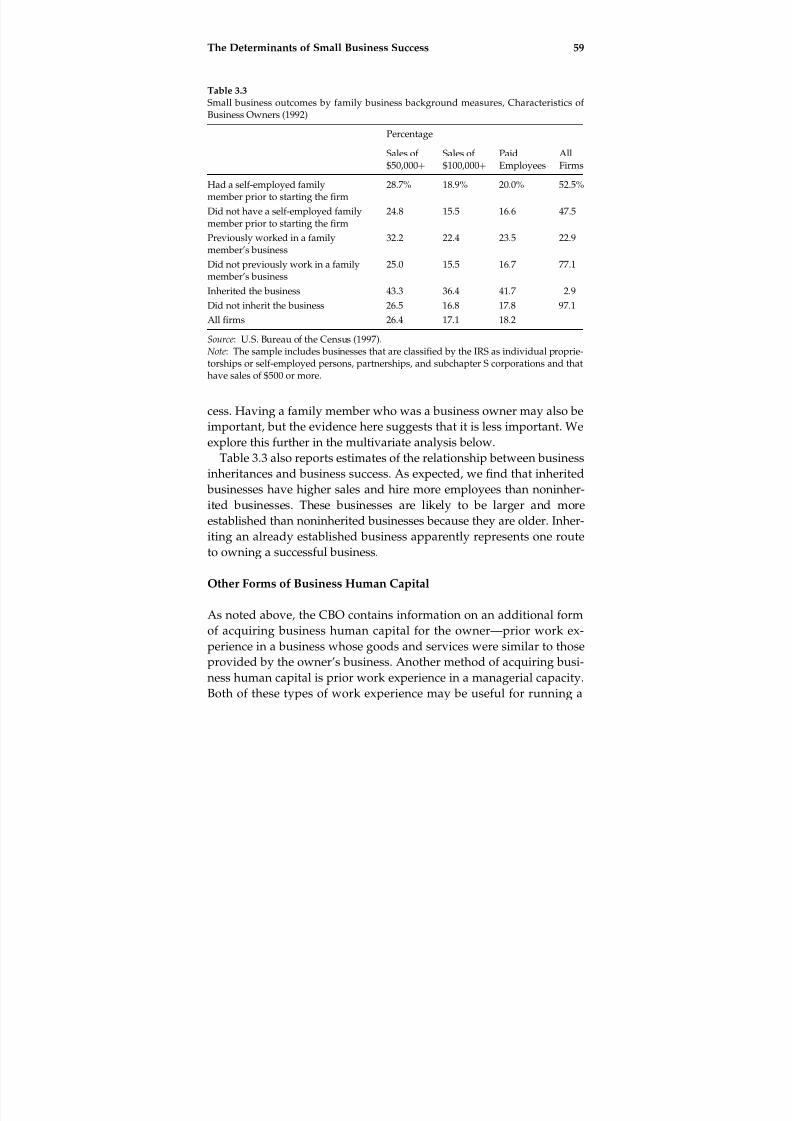
8/9/2019 Race and Entrepreneurial Success - Black , Asian, And White Owned Business in the United States
http://slidepdf.com/reader/full/race-and-entrepreneurial-success-black-asian-and-white-owned-business 72/253
cess. Having a family member who was a business owner may also be
important, but the evidence here suggests that it is less important. We
explore this further in the multivariate analysis below.
Table 3.3 also reports estimates of the relationship between business
inheritances and business success. As expected, we find that inherited
businesses have higher sales and hire more employees than noninher-
ited businesses. These businesses are likely to be larger and more
established than noninherited businesses because they are older. Inher-iting an already established business apparently represents one route
to owning a successful business.
Other Forms of Business Human Capital
As noted above, the CBO contains information on an additional form
of acquiring business human capital for the owner—prior work ex-
perience in a business whose goods and services were similar to thoseprovided by the owner’s business. Another method of acquiring busi-
ness human capital is prior work experience in a managerial capacity.
Both of these types of work experience may be useful for running a
Table 3.3
Small business outcomes by family business background measures, Characteristics of Business Owners (1992)
Percentage
Sales of $50,000þ
Sales of $100,000þ
PaidEmployees
AllFirms
Had a self-employed familymember prior to starting the firm
28.7% 18.9% 20.0% 52.5%
Did not have a self-employed familymember prior to starting the firm
24.8 15.5 16.6 47.5
Previously worked in a familymember’s business
32.2 22.4 23.5 22.9
Did not previously work in a familymember’s business
25.0 15.5 16.7 77.1
Inherited the business 43.3 36.4 41.7 2.9
Did not inherit the business 26.5 16.8 17.8 97.1
All firms 26.4 17.1 18.2
Source: U.S. Bureau of the Census (1997).Note: The sample includes businesses that are classified by the IRS as individual proprie-torships or self-employed persons, partnerships, and subchapter S corporations and thathave sales of $500 or more.
The Determinants of Small Business Success 59

8/9/2019 Race and Entrepreneurial Success - Black , Asian, And White Owned Business in the United States
http://slidepdf.com/reader/full/race-and-entrepreneurial-success-black-asian-and-white-owned-business 73/253
successful business, but they differ in the types of skills that they are
likely to provide the owner. Prior managerial experience is likely to
provide the owner with general business human capital. By working
in a managerial capacity, the owner may have acquired very useful
administrative, management, and human resources skills. These man-
agement skills may also be useful for the owner in securing financing.8
Prior work experience at a firm providing similar goods and ser-
vices, on the other hand, is likely to provide the owner with specific
business human capital. The owner may have acquired skills that are
specific to a type of work or industry that are useful for starting andrunning a successful business. For example, previous work experience
at a restaurant is likely to provide an owner with valuable skills for
operating a successful restaurant, and working in a construction trade
is likely to impart skills useful for operating a business in that trade.
In both cases, the relationship between these forms of acquiring busi-
ness human capital and business outcomes are strong (see table 3.4).
Small businesses with owners who have prior managerial experience
and prior work experience in a similar business have higher sales andare more likely to hire employees. These two types of work experience
may provide future business owners with business human capital that
is valuable for running successful businesses.
Table 3.4
Small business outcomes by types of prior work experience, Characteristics of BusinessOwners (1992)
Percentage
Sales of $50,000þ
Sales of $100,000þ
PaidEmployees
AllFirms
Had previous work experience in amanagerial capacity
30.5% 20.3% 21.2% 54.8%
Did not have previous work experiencein a managerial capacity
22.3 13.6 14.9 45.2
Previously worked in a business withsimilar goods or services
30.9 19.8 21.8 44.7
Did not previously work in a businesswith similar goods or services
23.5 15.2 15.6 55.3
All firms 26.4 17.1 18.2
Source: U.S. Bureau of the Census (1997).Note: The sample includes businesses that are classified by the IRS as individual proprie-torships or self-employed persons, partnerships, and subchapter S corporations and thathave sales of $500 or more.
60 Chapter 3

8/9/2019 Race and Entrepreneurial Success - Black , Asian, And White Owned Business in the United States
http://slidepdf.com/reader/full/race-and-entrepreneurial-success-black-asian-and-white-owned-business 74/253
Identifying the Determinants of Business Outcomes: Regression
Results
We now turn to estimating the effects of human capital, business
human capital, family-business background, and additional owner and
business characteristics on several business outcomes. To identify the
independent effects of these factors, we conduct a multivariate regres-
sion analysis. We are particularly interested in identifying the indepen-
dent effects on small business outcomes of education, a self-employed
family member, prior work experience in that family member’s busi-
ness, and prior work experience in a similar business. The results will
have implications for the roles played by general and specific businesshuman capital and by the correlation across family members in entre-
preneurial preferences in determining business success. We also exam-
ine the relationships between financial capital, industry, and business
outcomes.
As mentioned previously, the CBO data contain information on four
major business outcomes—closure, profits, employment, and sales. Al-
though none of these measures alone represents a perfect, universally
agreed on measure of business success, taken together they provide afairly comprehensive picture of what it means to be successful in busi-
ness. We estimate regressions for these probabilities—that a business
closes over the period from 1992 to 1996, that it has profits of at least
$10,000 per year, and that it has employees.9 For all of these regres-
sions, we use logit models because the dependent variable takes on
only two values—yes ¼ 1 or no ¼ 0. We estimate a linear regression
for log sales.10 Estimates from our CBO sample of businesses indicate
that nearly one quarter of small businesses existing in 1992 were notoperating by 1996 and that slightly less than 30 percent of businesses
report a net profit of at least $10,000. Approximately 20 percent of
firms hire any employees, and businesses have average log sales of
10.07.
In addition to the human-capital and family-business-background
variables noted above, we include the race, sex, region, and urban sta-
tus of the firm and the marital status and previous work experience of
the owner in the regressions (mean values are reported in table 3.A).
The specific family-business background and related business human-capital variables included are dummy variables (that is, equal to 0 or
1) for whether the owner had a family member who was a business
owner, worked for that family member’s business, had previous work
The Determinants of Small Business Success 61

8/9/2019 Race and Entrepreneurial Success - Black , Asian, And White Owned Business in the United States
http://slidepdf.com/reader/full/race-and-entrepreneurial-success-black-asian-and-white-owned-business 75/253
experience in a managerial capacity, worked in a business providing
similar goods and services, and inherited the business.
Because of concerns regarding potential endogeneity, we follow the
approach taken in many previous studies of self-employment report-
ing estimates from separate sets of regression models that exclude and
include startup capital and industry controls. The concern is that the
level of startup capital and industry do not cause business success and
instead capture the effects of something else. Even with these added
variables, we estimate relatively parsimonious specifications to focus
on more exogenous owner and firm characteristics that predict busi-
ness success. We do not include, for example, the owner’s hours
worked in the business as an additional variable because we are con-cerned that owners who work less than full-time may not be doing so
because they choose to. Instead, they may work less than full-time be-
cause of a lack of demand for their products and services or because
they had to remain employed at a wage and salary job.11 For similar
reasons, we are also concerned about using hours worked to create
adjusted outcome measures such as firm profits or sales per hour.12 If
we control for or adjust outcomes by hours worked, then we are
implicitly assuming that all business owners work their desiredamount of hours, which is unlikely to be the case. We wanted to err on
the conservative side by excluding this variable, which partly captures
business success, from the regressions. As an alternative, we experi-
ment with tighter hours-worked restrictions for the sample and note
these results below.
Specifications that do not include controls for startup capital and in-
dustry are estimated first. Table 3.5 reports results from regression
models for each of the business outcomes. To ease the interpretation of
coefficient estimates, we report marginal effects and their standard
errors for the logit regressions. The marginal effects provide an esti-
mate of the effect of a one-unit change in a variable on the probability
of a business closure, large profits, or employment.13
Race and ethnicity are important determinants of small business out-
comes. In the regressions, white is the excluded race category, and the
included dummy variables are black, Hispanic, Native American, and
Asian. Thus, the interpretation of the coefficient on each variable is the
remaining difference between whites and that minority group in the business outcome. For example, the coefficient on the black-owned
business variable in specification 3 implies that black-owned firms
are 9.51 percentage points less likely to hire an employee than are
62 Chapter 3

8/9/2019 Race and Entrepreneurial Success - Black , Asian, And White Owned Business in the United States
http://slidepdf.com/reader/full/race-and-entrepreneurial-success-black-asian-and-white-owned-business 76/253
Table 3.5
Logit, linear, and ordered probit regressions for small business outcomes, Characteristicsof Business Owners (1992)
Specification
(1) (2) (3) (4) (5)
Dependent variable Closure
(1992–1996)
Profits
$10,000þ
Employer
Firm
Ln
Sales
Profits
Ordered
Black-owned business 0.0212
(0.0130)
0.1786
(0.0207)
0.0951
(0.0166)
0.4636
(0.0554)
0.4160
(0.0376)
Latino-owned business 0.0138
(0.0121)
0.0443
(0.0144)
0.0231
(0.0116)
0.0660
(0.0490)
0.0966
(0.0318)
Native American-owned
business
0.1176
(0.0554)
0.0422
(0.0530)
0.0717
(0.0415)
0.3991
(0.1879)
0.0654
(0.1207)
Asian-owned business 0.0457
(0.0145)
0.0259
(0.0145)
0.0728
(0.0115)
0.4709
(0.0539)
0.0004
(0.0340)
Female-owned business 0.0247
(0.0050)
0.2107
(0.0066)
0.0616
(0.0051)
0.6941
(0.0206)
0.3968
(0.0135)
Married 0.0313
(0.0068)
0.1013
(0.0091)
0.0659
(0.0074)
0.2251
(0.0286)
0.1445
(0.0189)
Never married 0.0429
(0.0081)
0.0363
(0.0101)
0.0379
(0.0085)
0.3563
(0.0338)
0.0492
(0.0220)
High school graduate 0.0209
(0.0085)
0.0624
(0.0112)
0.0447
(0.0092)
0.1534
(0.0351)
0.0209
(0.0234)
Some college 0.0101
(0.0084)
0.0724
(0.0111)
0.0471
(0.0091)
0.0570
(0.0351)
0.1038
(0.0232)
College graduate 0.0553
(0.0093)
0.1133
(0.0118)
0.0606
(0.0097)
0.2397
(0.0383)
0.1632
(0.0252)
Graduate school 0.1491
(0.0107)
0.2127
(0.0122)
0.1650
(0.0097)
0.6115
(0.0404)
0.5130
(0.0267)
Urban 0.0164
(0.0058)
0.0447
(0.0069)
0.0343
(0.0055)
0.1008
(0.0234)
0.1134
(0.0150)
Prior work experience in a
managerial capacity
0.0655
(0.0054)
0.0265
(0.0063)
0.0513
(0.0052)
0.2089
(0.0217)
0.0055
(0.0141)
Prior work experience in a
similar business
0.0425
(0.0049)
0.1024
(0.0059)
0.0432
(0.0048)
0.4087
(0.0202)
0.2484
(0.0131)Have a self-employed family
member
0.0200
(0.0055)
0.0113
(0.0067)
0.0022
(0.0055)
0.0356
(0.0227)
0.0092
(0.0148)
Prior work experience in a
family member’s business
0.0419
(0.0069)
0.0322
(0.0079)
0.0552
(0.0063)
0.3784
(0.0273)
0.0471
(0.0178)
Inherited business 0.1007
(0.0237)
0.1097
(0.0217)
0.2006
(0.0157)
1.3144
(0.0800)
0.3524
(0.0506)
Mean of dependent variable 0.2280 0.2980 0.2070 10.0725 1.2391
Log likelihood/R-square 17,466.46 16,957.14 16,542.74 0.1119 40,045.16
Sample size 33,485 30,500 34,179 34,179 30,500
Notes: (1) See notes to table 3.2. (2) Logit models are used for specifications 1 to 3, OLS is used forspecification 4, and an ordered probit is used for specification 5. The log likelihood value is reported
for the logit and ordered probit regressions and R-squared is reported for the OLS model. (3) Mar-
ginal effects and their standard errors (in parentheses) are reported for the logit regressions. (4) All
specifications also include a constant and dummy variables for region and work experience of the pri-
mary owner.
The Determinants of Small Business Success 63
8/9/2019 Race and Entrepreneurial Success - Black , Asian, And White Owned Business in the United States
http://slidepdf.com/reader/full/race-and-entrepreneurial-success-black-asian-and-white-owned-business 77/253
white-owned firms, even after controlling for differences in other vari-
ables included in the regressions. After controlling for numerous owner
and business characteristics, black-owned businesses continue to lag
behind white-owned businesses. In all specifications except the closure-
probability equation, the coefficient estimate on the black-owned busi-
ness dummy variable is large, positive, and statistically significant. In
the closure-probability equation, the coefficient estimate is positive but
statistically insignificant. The results are more mixed for Latino-owned
firms. They have a lower probability of having large profits but have a
higher probability of hiring employees than white-owned firms. The
coefficient estimates in the other two specifications are statistically in-
significant. On the other hand, Asian- and Native American-owned businesses generally have better outcomes than white-owned busi-
nesses after controlling for the included variables. However, in the
next set of regressions, which include startup capital and industry con-
trols, the positive Asian coefficients essentially disappear. The black
coefficients also become noticeably smaller after the inclusion of these
additional variables.
The finding of relatively large and statistically significant coefficients
on some of the race variables indicates that the included controls foreducation, family background, work experience, and other owner and
firm characteristics cannot entirely explain racial differences in busi-
ness outcomes. By comparing these to the original racial differences in
business outcomes reported in chapter 2, we can get a sense of how
much of the racial disparities in business outcomes are explained by
racial differences in all of the included owner and business character-
istics. However, these comparisons are difficult to make because of
differences in the samples, and we are interested primarily in the ex-
planatory power of individual variables. In other words, the current
estimates do not reveal the relative importance of each of the owner
and business characteristics in explaining racial differences in business
outcomes. For example, do differences in education explain more of the
racial disparities in business outcomes than differences in startup capi-
tal? For now, we continue the general discussion of identifying the
determinants of business outcomes and explore this other question fur-
ther in the next two chapters.
In investigating differences in business outcomes by gender, we findthat female-owned businesses have lower measures of business out-
comes than male-owned businesses after controlling for the included
owner and business characteristics. This finding is consistent with the
64 Chapter 3

8/9/2019 Race and Entrepreneurial Success - Black , Asian, And White Owned Business in the United States
http://slidepdf.com/reader/full/race-and-entrepreneurial-success-black-asian-and-white-owned-business 78/253
previous literature. For example, Srinivasan, Woo, and Cooper (1994)
use data from the NFIB and find that female-owned firms have a
higher probability of closure and a lower probability of growth than
male-owned firms. Using 1992 SMOBE and CBO data, Robb (2000)
finds that women own just over one quarter of businesses with em-
ployees and generate less than 20 percent of employer firm receipts.
Female-owned firms are also found to have lower survival rates than
male-owned firms. Using earlier CBO data, Boden and Nucci (2000)
find that businesses owned by women are less likely to survive than
businesses owned by men in both years.14
Differences between male- and female-owned businesses in closure
rates, profits, employment, and sales may be related to barriers to suc-cess for female-owned businesses. For example, Brush et al. (2004) note
that female entrepreneurs have access to different business and invest-
ment social networks than male entrepreneurs.15 Differences in busi-
ness outcomes, however, may also be related to gender differences in
the goals and types of businesses and preferences for level of work
activity. Previous research indicates that women who are married to
self-employed men are more likely to be self-employed or enter self-
employment and that the choice of self-employment is partly driven by the desire for flexible schedules and other family-related reasons
for women relative to men (Bruce 1999; Robb 2000; Boden 1996, 1999;
Carr 1996; Devine 1994; Lombard 2001; Lohmann 2001).16 Given these
alternative explanations, some caution is warranted in interpreting
the female coefficient estimates because they may not solely capture
differences in business success. Although the disparities in outcomes
between male- and female-owned businesses are important, they are
beyond the scope of the current analysis. We do, however, investigate
whether the determinants of small business success differ between
men and women, which is an important issue for our analysis because
we include both male and female firms in the sample.
Following previous research, we also include marital status in the
regressions. We specifically include indicators for whether the owner
is married, is divorced or separated, or has never been married. Mar-
ried business owners have the best outcomes, whereas never-married
owners have the worst outcomes out of the three groups. Spouses may
provide financial assistance, paid or unpaid labor for the business,health insurance coverage, and other types of assistance that are useful
for running a business. There may also be positive knowledge transfers
between married couples that improve business performance (Parker
The Determinants of Small Business Success 65
8/9/2019 Race and Entrepreneurial Success - Black , Asian, And White Owned Business in the United States
http://slidepdf.com/reader/full/race-and-entrepreneurial-success-black-asian-and-white-owned-business 79/253
2005), and businesses owned by married couples may be more success-
ful on average.
Business location affects both the supply of services a firm provides
and the demand it faces, both of which can affect business outcomes.
Robb (2000) found that firm location in a central city or inner suburb
had a negative effect on the probability of firm survival. Because of
possible effects of location, we include a measure of whether the busi-
ness is located in an urban area. Our results are mixed on whether
urban location matters for business success. Firms located in urban
areas are more likely to close, less likely to have employees, more likely
to have large profits, and more likely to have higher sales than firms
located in nonurban areas. Although not reported, we also includecontrols for the region of the country where the business is located.
While there is no consistent pattern of business success by region, we
find some evidence that businesses located in New England and the
Pacific regions generally have better outcomes and that businesses
located in the West South Central region have worse outcomes.
Another variable that is included in the regressions but is not
reported in the table is the number of years of work experience prior
to starting or acquiring ownership of the business. We include severaldummy variables that indicate years of previous work experience. The
estimated effects of prior work experience vary somewhat across out-
come measures, although we find some evidence suggesting that indi-
viduals with twenty or more years of prior work experience and
owners with very little previous work experience have worse out-
comes, on average. Older owners with long prior work experience
may have moved into business ownership as a response to job loss
(Farber 1999; Fairlie and Krashinsky 2005), and younger owners with
very little experience may encounter difficulties identifying good busi-
ness opportunities.
Educational Effects
We now discuss the results from our main human-capital and family-
background variables. Previous research provides evidence that the
owner’s education level increases the chance of survival for the busi-
ness. For example, estimates from earlier waves of the CBO indicatethat small business closures generally decrease with the education
level of the owner (Bates 1990b, 1997; Astebro and Berhardt 2003).
66 Chapter 3
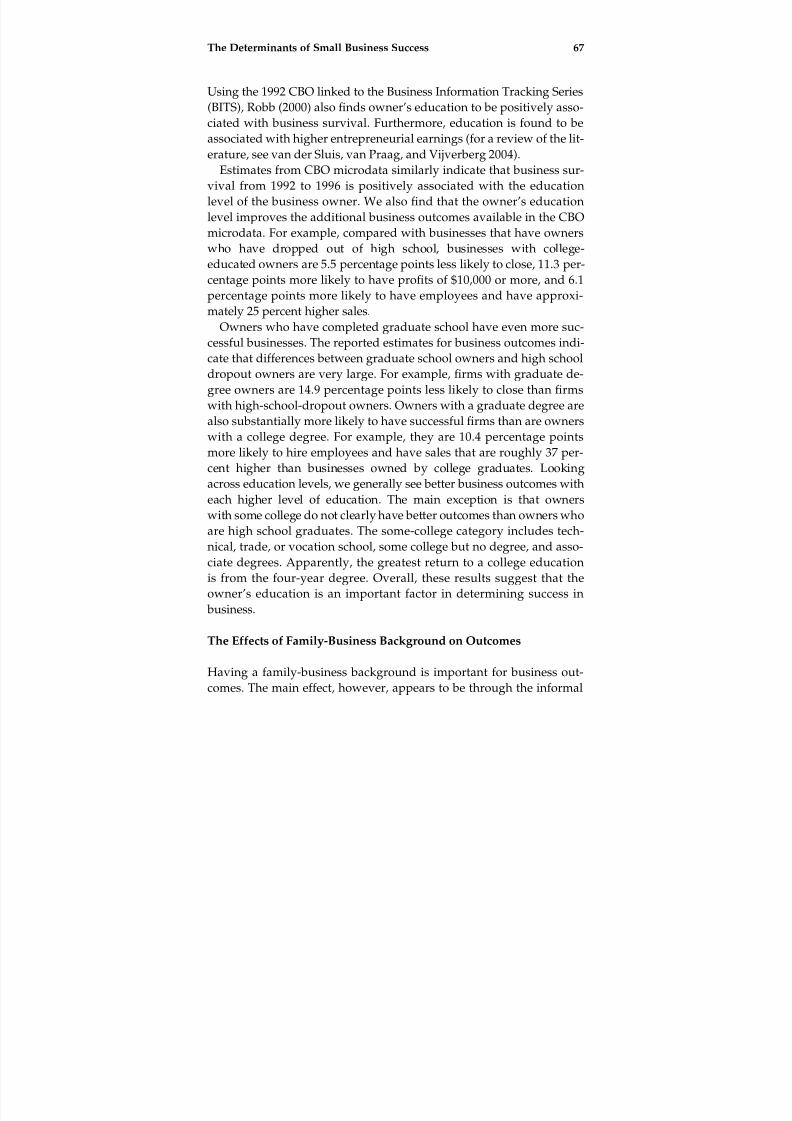
8/9/2019 Race and Entrepreneurial Success - Black , Asian, And White Owned Business in the United States
http://slidepdf.com/reader/full/race-and-entrepreneurial-success-black-asian-and-white-owned-business 80/253
Using the 1992 CBO linked to the Business Information Tracking Series
(BITS), Robb (2000) also finds owner’s education to be positively asso-
ciated with business survival. Furthermore, education is found to be
associated with higher entrepreneurial earnings (for a review of the lit-
erature, see van der Sluis, van Praag, and Vijverberg 2004).
Estimates from CBO microdata similarly indicate that business sur-
vival from 1992 to 1996 is positively associated with the education
level of the business owner. We also find that the owner’s education
level improves the additional business outcomes available in the CBO
microdata. For example, compared with businesses that have owners
who have dropped out of high school, businesses with college-
educated owners are 5.5 percentage points less likely to close, 11.3 per-centage points more likely to have profits of $10,000 or more, and 6.1
percentage points more likely to have employees and have approxi-
mately 25 percent higher sales.
Owners who have completed graduate school have even more suc-
cessful businesses. The reported estimates for business outcomes indi-
cate that differences between graduate school owners and high school
dropout owners are very large. For example, firms with graduate de-
gree owners are 14.9 percentage points less likely to close than firmswith high-school-dropout owners. Owners with a graduate degree are
also substantially more likely to have successful firms than are owners
with a college degree. For example, they are 10.4 percentage points
more likely to hire employees and have sales that are roughly 37 per-
cent higher than businesses owned by college graduates. Looking
across education levels, we generally see better business outcomes with
each higher level of education. The main exception is that owners
with some college do not clearly have better outcomes than owners who
are high school graduates. The some-college category includes tech-
nical, trade, or vocation school, some college but no degree, and asso-
ciate degrees. Apparently, the greatest return to a college education
is from the four-year degree. Overall, these results suggest that the
owner’s education is an important factor in determining success in
business.
The Effects of Family-Business Background on Outcomes
Having a family-business background is important for business out-
comes. The main effect, however, appears to be through the informal
The Determinants of Small Business Success 67
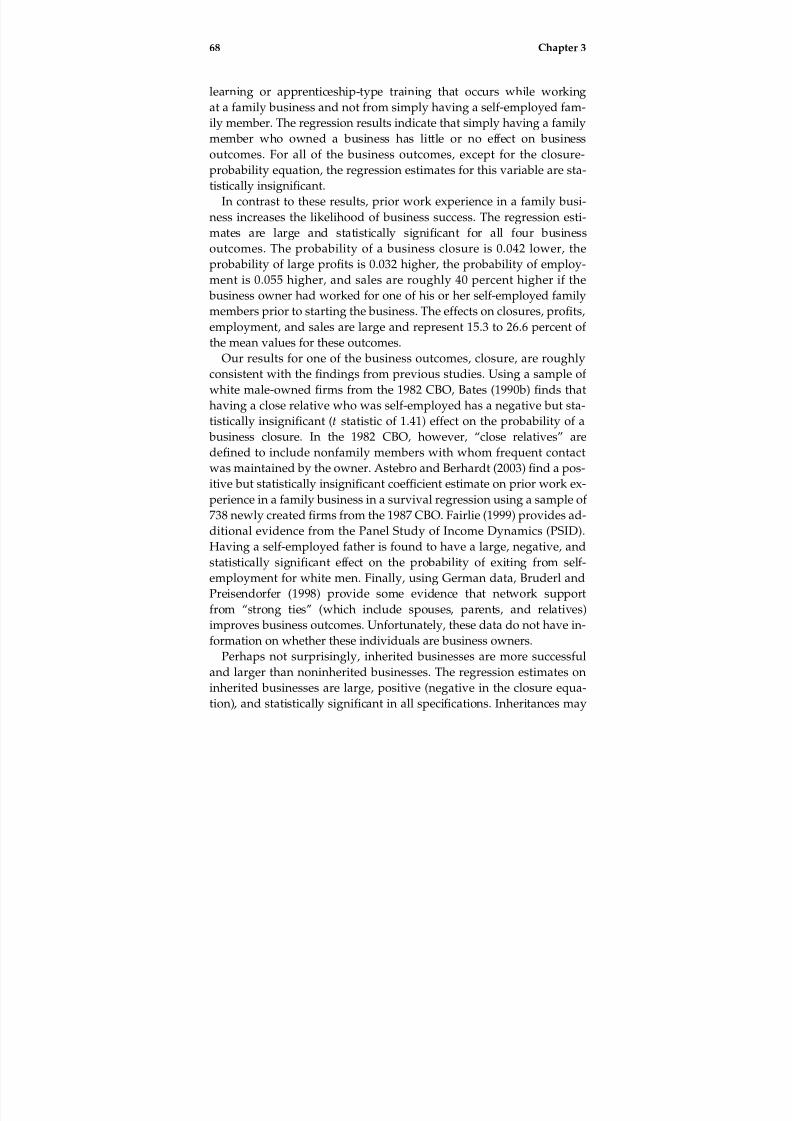
8/9/2019 Race and Entrepreneurial Success - Black , Asian, And White Owned Business in the United States
http://slidepdf.com/reader/full/race-and-entrepreneurial-success-black-asian-and-white-owned-business 81/253
learning or apprenticeship-type training that occurs while working
at a family business and not from simply having a self-employed fam-
ily member. The regression results indicate that simply having a family
member who owned a business has little or no effect on business
outcomes. For all of the business outcomes, except for the closure-
probability equation, the regression estimates for this variable are sta-
tistically insignificant.
In contrast to these results, prior work experience in a family busi-
ness increases the likelihood of business success. The regression esti-
mates are large and statistically significant for all four business
outcomes. The probability of a business closure is 0.042 lower, the
probability of large profits is 0.032 higher, the probability of employ-ment is 0.055 higher, and sales are roughly 40 percent higher if the
business owner had worked for one of his or her self-employed family
members prior to starting the business. The effects on closures, profits,
employment, and sales are large and represent 15.3 to 26.6 percent of
the mean values for these outcomes.
Our results for one of the business outcomes, closure, are roughly
consistent with the findings from previous studies. Using a sample of
white male-owned firms from the 1982 CBO, Bates (1990b) finds thathaving a close relative who was self-employed has a negative but sta-
tistically insignificant (t statistic of 1.41) effect on the probability of a
business closure. In the 1982 CBO, however, ‘‘close relatives’’ are
defined to include nonfamily members with whom frequent contact
was maintained by the owner. Astebro and Berhardt (2003) find a pos-
itive but statistically insignificant coefficient estimate on prior work ex-
perience in a family business in a survival regression using a sample of
738 newly created firms from the 1987 CBO. Fairlie (1999) provides ad-
ditional evidence from the Panel Study of Income Dynamics (PSID).
Having a self-employed father is found to have a large, negative, and
statistically significant effect on the probability of exiting from self-
employment for white men. Finally, using German data, Bruderl and
Preisendorfer (1998) provide some evidence that network support
from ‘‘strong ties’’ (which include spouses, parents, and relatives)
improves business outcomes. Unfortunately, these data do not have in-
formation on whether these individuals are business owners.
Perhaps not surprisingly, inherited businesses are more successfuland larger than noninherited businesses. The regression estimates on
inherited businesses are large, positive (negative in the closure equa-
tion), and statistically significant in all specifications. Inheritances may
68 Chapter 3

8/9/2019 Race and Entrepreneurial Success - Black , Asian, And White Owned Business in the United States
http://slidepdf.com/reader/full/race-and-entrepreneurial-success-black-asian-and-white-owned-business 82/253
represent a form of transferring successful businesses across genera-
tions, but their overall importance in determining small business out-
comes is slight at best. Although the coefficient estimates are large in
the small business outcome equations, the relative absence of inherited
businesses (only 1.6 percent of all small businesses) suggests that they
play only a minor role in establishing an intergenerational link in
self-employment.17
The strong effect of previous work experience in a family member’s
business on small business outcomes suggests that family businesses
provide an important opportunity for family members to acquire
human capital related to operating a business. The general lack of sig-
nificance of having a self-employed family member may indicate thatcorrelations across family members in entrepreneurial preferences and
role models are less important in contributing to the intergenerational
link in business success conditioning on business ownership than in
contributing to the intergenerational link in business ownership. These
results suggest that it is not enough to have a parent who is a business
owner for children to create successful businesses. Instead, working
in a family business appears to be the more important factor contribu-
ting to the success of the firm. Finally, inherited businesses may bemore successful on average than noninherited businesses, but their
limited representation among all small businesses in the United States
suggests that they are only a minor determinant of small business
outcomes.
Other Forms of Business Human Capital
The regression estimates provide evidence of the effects of the two ad-
ditional methods for owners to acquire business human capital—prior
work experience in a managerial capacity and prior work experience in
a business whose goods and services were similar to those provided by
the owner’s business.
The effects of previous work experience in a managerial capacity on
small business outcomes are not consistently strong. Management ex-
perience has a large effect in the employer probability equation, but
has a much smaller effect on log sales, and a positive and statistically
significant effect on business closures. Management experience prior tostarting or acquiring a business generally improves business outcomes
but has a less consistent effect than experience working for a close rela-
tive. It appears as though acquiring general business human capital
The Determinants of Small Business Success 69

8/9/2019 Race and Entrepreneurial Success - Black , Asian, And White Owned Business in the United States
http://slidepdf.com/reader/full/race-and-entrepreneurial-success-black-asian-and-white-owned-business 83/253
through management experience is somewhat important for business
success, but the evidence is not entirely consistent.
The effects of prior work experience in a business whose goods and
services were similar to those provided by his or her business are
clearer. This method of acquiring specific business human capital
appears to be very important. In fact, the coefficient estimates on a
dummy variable for whether the owner had work experience in a
similar business are comparable in size to the coefficient estimates on
prior work experience in a family member’s business in the closure-
probability and log-sales equations. The coefficient estimate is smaller
in the employer-probability equation but larger in the profits equation.
In all specifications, the coefficient estimates are large and statisticallysignificant. These findings are consistent with the hypothesis that the
acquisition of specific business human capital improves the likelihood
of business success. Owners may acquire valuable skills that are spe-
cific to starting different types of businesses, which eventually helps
them run successful businesses.
Another important point to be taken from these results is that the
multivariate regressions control for prior managerial experience and
similar business experience. This implies that the large positive esti-mated effects of working for a self-employed family member are not
simply capturing the effects of management experience or specific busi-
ness human capital on small business outcomes. Instead, prior work
experience in a family member’s business has an independent effect on
small business outcomes, which may in part be due to the acquisition
of less specific, general business human capital. But it appears as
though the family business might be providing a better opportunity
to acquire business human capital or higher-quality business human
capital than being a manager at a nonfamily member’s business.
Family members may impart more trust and give more responsibil-
ities to their workers, which in turn leads to successful future business
ventures.
Profits
The CBO does not include a continuous measure of profits in dollars.
Instead, a categorical measure of profits is available in which profitsare grouped in increments such as $10,000 to $24,999 and $25,000 to
$100,000. This makes it difficult to estimate a regression model using
profits as a dependent variable. As a baseline, we estimated a standard
70 Chapter 3

8/9/2019 Race and Entrepreneurial Success - Black , Asian, And White Owned Business in the United States
http://slidepdf.com/reader/full/race-and-entrepreneurial-success-black-asian-and-white-owned-business 84/253
logit model for profits of $10,000 or more as noted above. Another pos-
sibility, however, is to estimate an ordered probit in which all of the
categories are taken into account. The model is more complicated as is
the interpretation of the resulting coefficients, but this more complex
model is useful for checking the sensitivity of our use of profits of
$10,000 or more as a dependent variable in addition to the other busi-
ness outcome measures.
Specification 5 of table 3.5 reports estimates from an ordered probit
for the categorical measure of profits available in the CBO.18 The
results are similar to those for the logit model for profits of $10,000 or
more. For example, we find a positive and statistically significant rela-
tionship between owner’s education and profits. We also find that hav-ing a self-employed family member has no effect on profits, but prior
work experience in a family business and prior work experience in a
similar type of business have positive and statistically significant ef-
fects on profits. Although not reported, we also estimated a profit
equation using $25,000 as the cutoff level and find similar estimates.
Apparently, our original use of profits of $10,000 is a reasonable mea-
sure of business success in this context.
Gender Issues
Approximately one third of the small businesses analyzed in our study
are female-owned. As discussed above, the regression estimates indi-
cate that survival rates, profits, employment, and sales are lower for
female-owned firms than male-owned firms after controlling for other
factors. Do the determinants of small business outcomes also differ be-
tween male- and female-owned businesses, or are they roughly simi-
lar? This has implications for the question of whether male- and
female-owned businesses should be combined in the same sample
used in the regressions.
Before discussing the separate regression estimates, we compare sev-
eral owner characteristics. Owner’s education by sex is shown in figure
3.1. It appears that male and female business owners do not differ sub-
stantially in their levels of education. Male owners are slightly more
likely to have graduate degrees and not to finish high school. Female
owners are slightly more likely to have attended some college or havecollege degrees. But these differences are relatively small.
Table 3.6 reports estimates of the family-business-background mea-
sures by sex. Male and female business owners are similarly likely to
The Determinants of Small Business Success 71

8/9/2019 Race and Entrepreneurial Success - Black , Asian, And White Owned Business in the United States
http://slidepdf.com/reader/full/race-and-entrepreneurial-success-black-asian-and-white-owned-business 85/253
Figure 3.1
Owner’s education level by gender, Characteristics of Business Owners (1992)
Table 3.6
Family-business background measures by gender, Characteristics of Business Owners(1992)
Female Male
FemaleSampleSize
MaleSampleSize
Had a self-employed familymember prior to starting firm
50.6% 52.0% 13,818 23,922
Worked in that family member’s business (conditional)
38.3% 46.2% 13,380 23,195
Worked in a family member’s business (unconditional)
19.4% 24.0% 13,380 23,195
Worked at a business with similargoods/services
42.5% 53.8% 13,656 23,582
Inherited their businesses 1.4% 1.7% 13,760 23,859
Notes: (1) The sample includes businesses that are classified by the IRS as individual pro-prietorships or self-employed persons, partnerships, and subchapter S corporations, havesales of $500 or more, and have at least one owner who worked at least twelve weeksand ten hours per week in the business. (2) All estimates are calculated using sampleweights provided by the Characteristics of Business Owners.
72 Chapter 3

8/9/2019 Race and Entrepreneurial Success - Black , Asian, And White Owned Business in the United States
http://slidepdf.com/reader/full/race-and-entrepreneurial-success-black-asian-and-white-owned-business 86/253
Table 3.7
Means of analysis variables by gender, Characteristics of Business Owners (1992)
Male-
OwnedFirms
Female-
OwnedFirms
Firm no longer operating in 1996 (closure) 21.6% 24.4%
Net profit of at least $10,000 36.4% 17.3%
One or more paid employees 23.7% 16.4%
Log sales 10.36 9.57
Married 78.1% 73.0%
Never married 10.9% 9.1%
High school graduate 25.6% 25.3%
Some college 29.8% 33.7%
College graduate 18.2% 21.4%
Graduate school 14.8% 11.4%
New England 6.1% 5.3%
Middle Atlantic 14.7% 14.1%
East North Central 15.7% 15.1%
West North Central 8.0% 7.5%
South Atlantic 15.4% 18.3%
East South Central 5.0% 4.9%
West South Central 11.0% 9.9%
Mountain 6.4% 6.9%
Urban 74.7% 77.7%
Prior work experience: 1 year 7.1% 7.7%
Prior work experience: 2 to 5 years 16.6% 16.2%
Prior work experience: 6 to 9 years 15.4% 14.6%
Prior work experience: 10 to 19 years 28.9% 30.3%
Prior work experience: 20 years or more 26.0% 23.9%
Prior work experience in a managerial capacity 56.6% 52.3%
Prior work experience in a similar business 53.8% 42.5%
Have a self-employed family member 52.0% 50.6%
Prior work experience in a family member’s business 24.0% 19.4%
Inherited business 1.7% 1.4%
Startup capital: $5,000 to $24,999 25.5% 19.3%
Startup capital: $25,000 to $99,999 12.3% 9.2%
Startup capital: $100,000 and over 5.5% 4.1%
Agricultural services 3.2% 1.7%
Construction 16.3% 3.3%
Manufacturing 3.5% 2.9%
Wholesale 3.8% 3.0%
Finance, insurance, and real estate 9.3% 10.5%
The Determinants of Small Business Success 73

8/9/2019 Race and Entrepreneurial Success - Black , Asian, And White Owned Business in the United States
http://slidepdf.com/reader/full/race-and-entrepreneurial-success-black-asian-and-white-owned-business 87/253
have had a self-employed family member prior to starting their firm.
Male business owners, however, are more likely to have worked in
that family business than female business owners.19 Male business
owners are also more likely to have worked in a similar business be-
fore starting their businesses. Differences in these types of work experi-ence by sex, however, are not very large. Finally, both male and female
business owners have similarly low rates of inheriting businesses.
Table 3.8 reports mean values for all outcomes and explanatory vari-
ables separately for male- and female-owned businesses.
Estimates from separate sets of business outcome regressions for
male- and female-owned businesses are reported in tables 3.8 and 3.9,
respectively. Overall, the results do not differ substantially between
men and women. For example, the black coefficients have the same
sign and are statistically significant. We find a strong positive relation-
ship between business outcomes and the owner’s education level for
both male and female firms. Having a self-employed family member
has no effect on business outcomes, but prior work experience in a
family business has large effects on business outcomes for both men
and women. We also find that prior work experience in a similar busi-
ness improves outcomes for both sexes, whereas prior management ex-
perience has inconsistent effects. Thus, the determinants of business
outcomes do not differ substantially between male- and female-owned businesses. We continue to include both male and female owners in the
remaining analyses.
Table 3.7
(continued)
Male-
OwnedFirms
Female-
OwnedFirms
Transportations, communications, and public utilities 5.0% 2.5%
Personal services 24.2% 30.6%
Professional services 17.2% 23.0%
Uncoded industry 4.2% 3.7%
Sample size 13,918 24,102
Notes: (1) The sample includes businesses that are classified by the IRS as individual pro-prietorships or self-employed persons, partnerships, and subchapter S corporations, havesales of $500 or more, and have at least one owner who worked at least twelve weeksand ten hours per week in the business. (2) All estimates are calculated using sampleweights provided by the Characteristics of Business Owners.
74 Chapter 3

8/9/2019 Race and Entrepreneurial Success - Black , Asian, And White Owned Business in the United States
http://slidepdf.com/reader/full/race-and-entrepreneurial-success-black-asian-and-white-owned-business 88/253
Table 3.8
Logit and linear regressions for small business outcomes for men, Characteristics of Busi-ness Owners (1992)
Specification
(1) (2) (3) (4)
Dependent variable Closure(1992–1996)
Profits$10,000þ
EmployerFirm
Ln Sales
Black-owned business 0.0161(0.0174)
0.2036(0.0274)
0.1057(0.0227)
0.5322(0.0746)
Latino-owned business 0.0347(0.0146)
0.0568(0.0181)
0.0115(0.0150)
0.0013(0.0588)
Native American-owned
business
0.1674
(0.0795)
0.0042
(0.0692)
0.0467
(0.0575)
0.3201
(0.2397)
Asian-owned business 0.0512(0.0177)
0.0070(0.0189)
0.0509(0.0154)
0.3240(0.0665)
Married 0.0201(0.0091)
0.1238(0.0123)
0.0658(0.0101)
0.2215(0.0381)
Never married 0.0185(0.0105)
0.0390(0.0132)
0.0530(0.0111)
0.4333(0.0427)
High school graduate 0.0313(0.0101)
0.0805(0.0139)
0.0469(0.0118)
0.1686(0.0430)
Some college 0.0149(0.0099)
0.0835(0.0139)
0.0567(0.0116)
0.0437(0.0426)
College graduate 0.0882(0.0113)
0.1341(0.0148)
0.0846(0.0124)
0.2692(0.0467)
Graduate school 0.1433(0.0124)
0.2419(0.0154)
0.2122(0.0123)
0.6930(0.0484)
Urban 0.0229(0.0071)
0.0457(0.0088)
0.0390(0.0071)
0.0934(0.0288)
Prior work experience in amanagerial capacity
0.0896(0.0069)
0.0226(0.0082)
0.0478(0.0068)
0.2218(0.0272)
Prior work experience in asimilar business 0.0532(0.0061) 0.1126(0.0077) 0.0395(0.0063) 0.4381(0.0252)
Have a self-employedfamily member
0.0012(0.0069)
0.0100(0.0088)
0.0006(0.0073)
0.0558(0.0288)
Prior work experience in afamily member’s business
0.0523(0.0085)
0.0158(0.0103)
0.0513(0.0083)
0.3709(0.0340)
Inherited business 0.0461(0.0263)
0.1004(0.0279)
0.2182(0.0205)
1.1793(0.0972)
Mean of dependent variable 0.2170 0.3617 0.2299 10.3239
Log likelihood/R-square 10,761.38 11,978.54 11,107.46 0.0892
Sample size 21,316 19,439 21,753 21,753
Notes: (1) See notes to table 3.5. (2) The sample includes only male-owned firms.
The Determinants of Small Business Success 75

8/9/2019 Race and Entrepreneurial Success - Black , Asian, And White Owned Business in the United States
http://slidepdf.com/reader/full/race-and-entrepreneurial-success-black-asian-and-white-owned-business 89/253
Table 3.9
Logit and linear regressions for small business outcomes for women, Characteristics of Business Owners (1992)
Specification
(1) (2) (3) (4)
Dependent variable Closure(1992–1996)
Profits$10,000þ
EmployerFirm
Ln Sales
Black-owned business 0.0261(0.0199)
0.1155(0.0259)
0.0737(0.0219)
0.3708(0.0794)
Latino-owned business 0.0466(0.0218)
0.0113(0.0214)
0.0503(0.0178)
0.2478(0.0877)
Native American-owned
business
0.0458
(0.0798)
0.1167
(0.0628)
0.1003
(0.0533)
0.5322
(0.2925)
Asian-owned business 0.0333(0.0255)
0.0509(0.0181)
0.1048(0.0161)
0.7822(0.0899)
Married 0.0494(0.0107)
0.0448(0.0109)
0.0618(0.0101)
0.2243(0.0420)
Never married 0.1078(0.0134)
0.0208(0.0139)
0.0052(0.0131)
0.1785(0.0550)
High school graduate 0.0233(0.0162)
0.0129(0.0176)
0.0321(0.0145)
0.1106(0.0627)
Some college 0.0130(0.0161)
0.0355(0.0171)
0.0158(0.0143)
0.0725(0.0618)
College graduate 0.0092(0.0173)
0.0584(0.0180)
0.0033(0.0154)
0.1672(0.0669)
Graduate school 0.1597(0.0213)
0.1277(0.0185)
0.0414(0.0162)
0.4034(0.0730)
Urban 0.0004(0.0102)
0.0400(0.0098)
0.0197(0.0083)
0.1272(0.0391)
Prior work experience in amanagerial capacity
0.0169(0.0092)
0.0282(0.0084)
0.0561(0.0078)
0.1622(0.0355)
Prior work experience in asimilar business 0.0195(0.0087) 0.0709(0.0078) 0.0525(0.0071) 0.3539(0.0332)
Have a self-employedfamily member
0.0631(0.0095)
0.0150(0.0088)
0.0051(0.0081)
0.0027(0.0361)
Prior work experience in afamily member’s business
0.0032(0.0123)
0.0565(0.0102)
0.0560(0.0094)
0.3815(0.0456)
Inherited business 0.2746(0.0557)
0.1185(0.0276)
0.1623(0.0233)
1.5391(0.1385)
Mean of dependent variable 0.2495 0.1686 0.1589 9.5403
Log likelihood/R-square 6,548.74 4,743.32 5,234.98 0.0593
Sample size 12,169 11,061 12,426 12,426
Notes: (1) See notes to table 3.5. (2) The sample includes only female-owned firms.
76 Chapter 3

8/9/2019 Race and Entrepreneurial Success - Black , Asian, And White Owned Business in the United States
http://slidepdf.com/reader/full/race-and-entrepreneurial-success-black-asian-and-white-owned-business 90/253
Examining the Sensitivity of Results to Alternative Sample Definitions
As noted in chapter 2 and the book’s data appendix, the 1992 CBO and
the underlying SMOBE/SBO data appear to include a large number of
side or casual businesses. One way to address this concern is by
excluding businesses in which the owner worked fewer than twelve
weeks or fewer than ten hours per week during the year. These cutoffs
were chosen to rule out small-scale businesses but not to rule out other
part-time business owners. In particular, we are concerned about
removing business owners who work less than full time or less than a
full year because of a lack of demand for their products or services.
Thus, not working full time is a result of lack of business successinstead of a choice about how much to work. Similarly, we do not
include hours worked as an extra control because it partly captures
business success.
In this section, we check the sensitivity of our results to the removal
of part-time business owners. In particular, we estimate means and a
separate set of regressions that include only businesses with at least
one owner who works thirty hours or more per week and thirty-six
weeks or more per year. This restriction reduces our sample size byroughly 20 percent. As expected, we find that business outcomes are
better for this sample, but we find very similar patterns for family-
business-background measures. We also find that the coefficient esti-
mates on prior work experience in a family business are similar in the
profits equation and larger in the other specifications. Similar to the
original estimates, we find that having a self-employed family member
generally does not improve outcomes. We also continue to find that
having inherited businesses and having similar business work experi-
ence improve outcomes although the relationship is slightly weaker.
We also try a specification that includes even tighter hours- and
weeks-worked restrictions and find roughly similar results.
We also checked the sensitivity of our results to the inclusion of
smaller firms by excluding firms that required little startup capital. We
estimate regressions using a sample that excludes firms with less than
$5,000 in startup capital. We do not exclude these firms in our main
sample because we are concerned that the receipt of startup capital
may be related to the potential success of the business and manysuccessful businesses may have required very little or no capital.
In fact, published estimates from the CBO indicate that even among
businesses with sales of $100,000 to $200,000 per year, approximately
The Determinants of Small Business Success 77

8/9/2019 Race and Entrepreneurial Success - Black , Asian, And White Owned Business in the United States
http://slidepdf.com/reader/full/race-and-entrepreneurial-success-black-asian-and-white-owned-business 91/253
40 percent of firms required less than $5,000 in startup capital (U.S.
Census Bureau 1997). Furthermore, 32.5 percent of firms with $1 mil-
lion or more in sales started with less than $5,000 in startup capital,
and 33.1 percent of firms with 100 or more employees had less than
$5,000 in startup capital. Removing these firms and many firms in
industries that require very little capital (such as construction and high
technology) eliminates some very successful firms.
Family-business backgrounds are similar for this more restrictive
sample, which excludes 40 percent of the original sample. For example,
54.1 percent of owners have a self-employed family member compared
with 51.6 percent in the full sample, and 25.2 percent of owners have
prior work experience in a family business compared with 22.5 percentin the full sample. Furthermore, only 1.5 percent of owners inherited
their businesses, which is comparable to the 1.6 percent found in the
full sample.
In contrast to these results, the mean outcomes among businesses
that started with $5,000 or more in startup capital are considerably bet-
ter than those for all businesses (see table 3.10). Firms with $5,000 or
more in startup capital have higher profits and sales, hire more em-
ployees, and are less likely to close than firms with less startup capital.Table 3.10 also reports small-business-outcome-regression estimates
for this restricted sample. The results are similar for the effects of the
family-business-background measures. We find that having a self-
employed family member has little effect on outcomes, whereas prior
work experience in a family member’s business improves outcomes.
Prior work experience in a similar business also has a positive effect on
business outcomes. One difference in results is that the estimated rela-
tionship between owner’s education and small business outcomes is
now weaker, possibly due to a strong correlation between education
and startup capital. Overall, these estimates indicate that the findings
regarding the importance of family-business backgrounds in contribu-
ting to small business success are not due to the inclusion of smaller,
less successful firms that require little or no startup capital.
To summarize, the results for the determinants of small business
outcomes are not overly sensitive to the sample definitions that we
choose. Although business outcomes improve when we restrict the
sample to full-time working owners or businesses with $5,000 or morein startup capital, the coefficient estimates do not change substantially.
To avoid problems with excluding less successful firms that have less
78 Chapter 3

8/9/2019 Race and Entrepreneurial Success - Black , Asian, And White Owned Business in the United States
http://slidepdf.com/reader/full/race-and-entrepreneurial-success-black-asian-and-white-owned-business 92/253
Table 3.10
Small business outcomes regressions for firms with $5,000þ startup capital, Characteris-tics of Business Owners (1992)
Specification
(1) (2) (3) (4)
Dependent variable Closure(1992–1996)
Profits$10,000þ
EmployerFirm
Ln Sales
Black-owned business 0.0085(0.0170)
0.1966(0.0293)
0.1419(0.0268)
0.5556(0.0946)
Latino-owned business 0.0333(0.0127)
0.0562(0.0199)
0.0171(0.0181)
0.0737(0.0972)
Native American-owned
business
0.0415
(0.0583)
0.0348
(0.0742)
0.0209
(0.0687)
0.0434
(0.2923)
Asian-owned business 0.0288(0.0129)
0.0041(0.0168)
0.0367(0.0155)
0.2575(0.0897)
Female-owned business 0.0301(0.0057)
0.2154(0.0091)
0.0465(0.0080)
0.5880(0.0924)
Married 0.0455(0.0090)
0.1181(0.0122)
0.1353(0.0118)
0.2979(0.1411)
Never married 0.0214(0.0112)
0.0424(0.0144)
0.0318(0.0137)
0.2778(0.1861)
High school graduate 0.0147(0.0102)
0.0177(0.0156)
0.0334(0.0146)
0.0750(0.1589)
Some college 0.0109(0.0102)
0.0477(0.0155)
0.1003(0.0144)
0.1502(0.1552)
College graduate 0.0456(0.0113)
0.0269(0.0165)
0.0971(0.0152)
0.3380(0.1759)
Graduate school 0.0516(0.0114)
0.1603(0.0168)
0.1838(0.0152)
0.5028(0.1674)
Urban 0.0333(0.0063)
0.0707(0.0089)
0.0036(0.0082)
0.1033(0.0983)
Prior work experience in amanagerial capacity 0.0376(0.0061) 0.0078(0.0088) 0.0634(0.0081) 0.1764(0.0900)
Prior work experience in asimilar business
0.0285(0.0055)
0.0910(0.0080)
0.0268(0.0073)
0.2573(0.0937)
Have a self-employedfamily member
0.0046(0.0061)
0.0105(0.0092)
0.0173(0.0084)
0.0517(0.1032)
Prior work experience in afamily member’s business
0.0490(0.0077)
0.0142(0.0105)
0.0870(0.0096)
0.4342(0.1125)
Inherited business 0.0471(0.0261)
0.0644(0.0309)
0.2980(0.0300)
1.6740(0.2486)
Mean of dependent variable 0.1564 0.4117 0.3540 10.8625Log likelihood/R-square 8,536.59 11,959.81 12,831.09 0.0891
Sample size 20,212 18,886 20,485 20,485
Notes: (1) See notes to table 3.5. (2) The sample includes only firms with at least $5,000 instartup capital.
The Determinants of Small Business Success 79

8/9/2019 Race and Entrepreneurial Success - Black , Asian, And White Owned Business in the United States
http://slidepdf.com/reader/full/race-and-entrepreneurial-success-black-asian-and-white-owned-business 93/253
than full-time working owners because of limited demand and poten-
tially very successful firms that started with less than $5,000 in capital,
we continue using our main sample of active firms in which we include
all owners with twelve or more weeks and ten or more hours worked
per week for the remaining analyses.
Correcting for Missing Data: Multiple Imputation
Another concern with the estimates reported in table 3.5 is missing
data for some of the independent variables in the CBO. Approximately
10 percent of the observations for each of the specifications reported in
table 3.5 are excluded because of missing values for one or more of theindependent variables. Although these levels of missing data are not
extremely high, we examine the sensitivity of our results to two alter-
native methods of correcting for missing data. First, we estimate re-
gressions in which dummy variables are included for missing values
of specific independent variables.20 For example, if the education level
of the business owner is missing, then the four education-level dummy
variables would be equal to zero, and a special missing education
dummy variable would be equal to one. Thus, the missing observationfor owner’s education would not contribute to the coefficient estimates
on the main education-level dummies but would contribute to coeffi-
cient estimates on other variables. This technique is becoming increas-
ingly common in the literature because it is easy to implement and
provides more precise estimates for the other variables. Although not
reported, we find estimates that are similar to the ones reported in
table 3.5 for all four specifications.
We also address the missing data problem by using multiple impu-
tation (Rubin 1987; Schafer and Olsen 1998; Schafer 1999; Brownstone
and Valetta 2001).21 The multiple-imputation technique essentially
replaces each missing value in the data with a set of plausible values
resulting in separate datasets that include the true values for nonmiss-
ing observations and the imputed variables for missing observations.
The imputations are made by examining correlations between all avail-
able independent variables and placing restrictions on minimum and
maximum values and rounding.22 The variables are assumed to have a
multivariate normal distribution. Logit or linear regressions are thenrun on five separately imputed datasets.23 The results from the five
runs are combined for inference, and adjustments are made for sam-
pling variance. The resulting coefficient estimates summarize this infor-
80 Chapter 3

8/9/2019 Race and Entrepreneurial Success - Black , Asian, And White Owned Business in the United States
http://slidepdf.com/reader/full/race-and-entrepreneurial-success-black-asian-and-white-owned-business 94/253
mation, and their standard errors capture the variability of estimates
across the five runs, which differs from the typical overstatement of
the statistical precision of estimates from single imputation methods.
We report the multiple imputation coefficient estimates and their stan-
dard errors in table 3.11. Despite the large increase in sample size, the
estimates are similar to those reported in table 3.5. Thus, the removal
of observations with missing data does not appear to overly affect our
results.
Startup Capital
As noted in the previous chapter, a large literature finds that owners’personal wealth is positively associated with business ownership. A
substantial amount of attention in the literature is devoted to credibly
determining whether the positive relationship is due to the inability of
would-be entrepreneurs to acquire adequate levels of startup capital
because of the presence of liquidity constraints. The main concerns
with this interpretation are that business ownership may be an effec-
tive method of acquiring wealth and that individuals who are adept at
accumulating wealth perhaps through wage and salary work may bethe same individuals who are the most successful at starting busi-
nesses. In both cases, the positive relationship between wealth and
business ownership is not caused by the inability to obtain financial
capital due to liquidity constraints. Because of these concerns, we first
reported estimates of the determinants of business outcomes without
controls for startup capital. We now turn to a detailed discussion of
the potential effects of startup capital, which is likely to be an impor-
tant determinant of small business success.
Although we do not present new evidence on the liquidity-
constraint debate, we note the possibility that the owner’s level of
wealth may affect business success. In particular, if liquidity con-
straints are binding, then this may affect the scale or success of the
entrepreneurial venture. Liquidity-constrained entrepreneurs might
start smaller undercapitalized businesses than they would have other-
wise. In this case, the businesses created by liquidity-constrained entre-
preneurs are likely to have worse outcomes than those created in the
absence of liquidity constraints. The personal wealth of the entrepre-neur then becomes a key factor in the success of the firm because this
wealth can be invested directly in the business or used as collateral to
obtain business loans.
The Determinants of Small Business Success 81
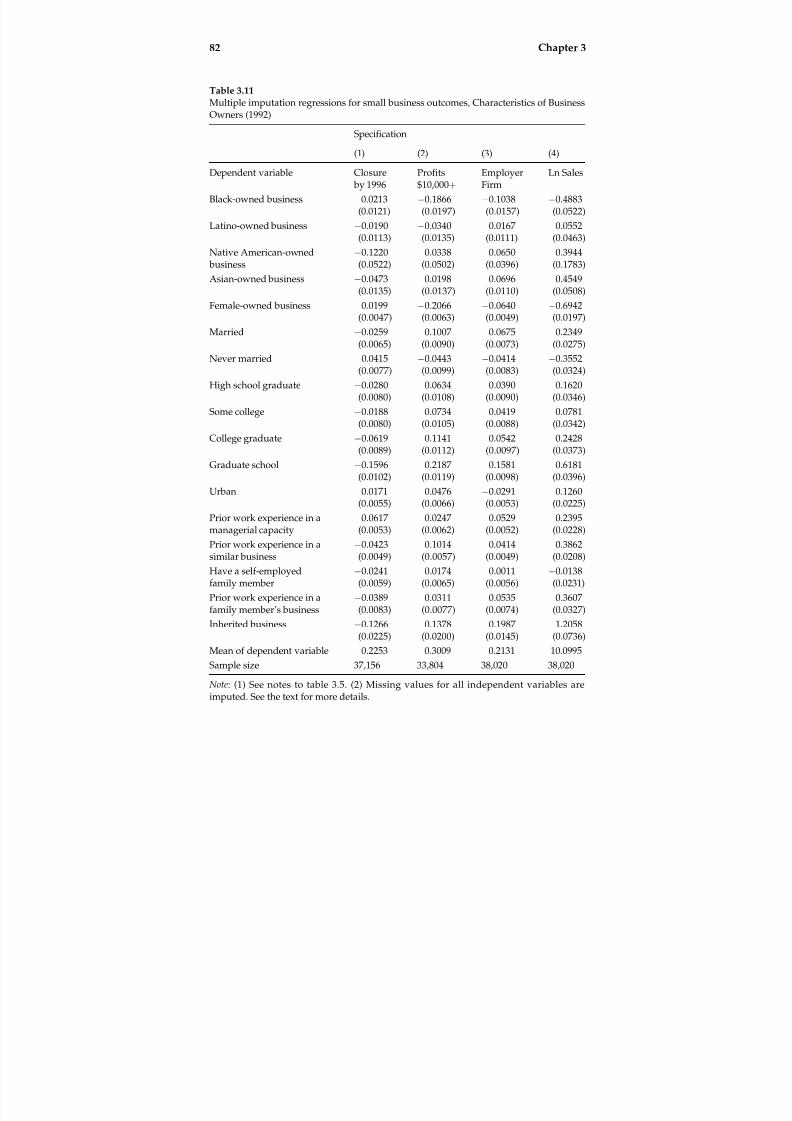
8/9/2019 Race and Entrepreneurial Success - Black , Asian, And White Owned Business in the United States
http://slidepdf.com/reader/full/race-and-entrepreneurial-success-black-asian-and-white-owned-business 95/253

8/9/2019 Race and Entrepreneurial Success - Black , Asian, And White Owned Business in the United States
http://slidepdf.com/reader/full/race-and-entrepreneurial-success-black-asian-and-white-owned-business 96/253
Surprisingly, however, the relationship between owner’s wealth and
business success has not been examined extensively in the literature.
Holtz-Eakin, Joulfaian, and Rosen (1994b) examine whether current
changes in asset levels through inheritances affect survival probabil-
ities and sales growth. They find that a $150,000 inheritance increases
the probability of remaining a business owner by 1.3 percentage
points, and if the firm survives, receipts increase by 20 percent. Fairlie
and Krashinsky (2005) also find evidence of a positive effect of initial
owner-asset levels on entrepreneurial survival.
Unfortunately, the CBO does not contain a measure of the owner’s
net worth prior to starting the business.24 Instead, the CBO contains
categorical information on ‘‘the total amount of capital required tostart/acquire the business’’ (U.S. Census Bureau 1997, p. C-15). Some
caution is warranted when exploring the relationship between this
measure of startup capital and business outcomes (Bates 1990b). The
problem is that potentially successful business ventures are likely to
generate more startup capital than business ventures that are viewed
as being potentially less successful. Thus, we cannot determine with
certainty that lower levels of startup capital are primarily driven by
constraints in obtaining financing. In support of the use of this mea-sure, however, there is evidence suggesting that the size of inheritances
received by individuals increases the amount of capital invested in the
business (Holtz-Eakin, Joulfaian, and Rosen 1994a). This finding sug-
gests that the receipt of inheritances might relieve liquidity constraints
and that lower levels of startup capital at least partly reflect barriers to
access to financial capital.
Additional evidence on the link between startup capital and owner’s
wealth is provided by examining the relationship between business
loans and personal commitments, such as using personal assets for col-
lateral for business liabilities and guarantees that make owners person-
ally liable for business debts. Using data from the SSBF and Survey of
Consumer Finances (SCF), Avery, Bostic, and Samolyk (1998) find that
the majority of all small business loans have personal commitments.
The common use of personal commitments to obtain business loans
suggests that wealthier entrepreneurs may be able to negotiate better
credit terms and obtain larger loans for their new businesses, possibly
leading to more successful firms.25 Cavalluzzo and Wolken (2005) findthat personal wealth, primarily through home ownership, decreases
the probability of loan denials among existing business owners. If per-
sonal wealth is important for existing business owners in acquiring
The Determinants of Small Business Success 83

8/9/2019 Race and Entrepreneurial Success - Black , Asian, And White Owned Business in the United States
http://slidepdf.com/reader/full/race-and-entrepreneurial-success-black-asian-and-white-owned-business 97/253
business loans, then it may be even more important for entrepreneurs
in acquiring startup loans. Avery, Bostic, and Samolyk (1998), however,
do not find evidence of a consistent relationship between personal
commitments and owner’s wealth across specifications.
We now turn to examining the relationship between startup capitaland business outcomes. We first examine published estimates from the
CBO (U.S. Census Bureau 1997), which reveal a very strong positive
correlation between startup capital and outcomes. Table 3.12 reports
estimates of sales and employment by startup-capital level. Firms with
higher levels of startup capital are much more likely to have high sales
levels and hire employees. These results are consistent with liquidity
constraints limiting access to financial capital leading to less successful
businesses. This simple analysis of the relationships between startupcapital and business outcomes, however, does not account for the
effects of other correlated owner and business characteristics. The re-
gression results allow us to investigate this issue further.
Industry
The industry of the business is also likely to be associated with the size
and success of the business. Some industries have higher business-turnover rates than others, most notably retail and services (Robb
2000; Reynolds and White 1997). Published estimates from the CBO
also indicate large industry differences in survival rates (see table 3.13).
Table 3.12
Small business outcomes by firm’s startup capital, Characteristics of Business Owners(1992)
PercentageTotal Capital Needed
by Firm to Start toAcquire the Business
Sales of $50,000þ
Sales of $100,000þ
PaidEmployees
AllFirms
Less than $5,000 17.6% 10.3% 11.1% 61.2%
$5,000 to $24,999 35.0% 20.9% 23.1% 22.5%
$25,000 to $99,999 49.1% 36.0% 38.1% 11.1%
$100,000 or more 55.1% 46.1% 44.5% 5.3%
All firms 26.4% 17.1% 18.2%
Source: U.S. Bureau of the Census (1997).Note: The sample includes businesses that are classified by the IRS as individual proprie-torships or self-employed persons, partnerships, and subchapter S corporations and thathave sales of $500 or more.
84 Chapter 3

8/9/2019 Race and Entrepreneurial Success - Black , Asian, And White Owned Business in the United States
http://slidepdf.com/reader/full/race-and-entrepreneurial-success-black-asian-and-white-owned-business 98/253
The highest closure rates are found for businesses in construction (29.8percent) and transportation, communications, and utilities (30.4 per-
cent). In contrast, fewer than 20 percent of manufacturing firms and
finance, insurance, and real estate firms closed from 1992 to 1996.
Additional business outcomes from published CBO data and the
1992 SMOBE are reported in table 3.13. Wholesale trade and manufac-
turing firms have substantially higher sales than firms in other indus-
tries. Firms in these two industries and in retail trade hire more
employees than other industries. The most profitable industry appearsto be wholesale trade followed by transportation, communications,
and utilities; finance, insurance, and real estate; and manufacturing.
Businesses in personal services have the lowest average sales of all
Table 3.13
Small business outcomes by major industry, Survey of Minority-Owned Business Enter-prises (1992) and Characteristics of Business Owners (1992)
AverageSales
MeanNumberof Em-ployees
PercentageClosing
between1992 and1996
Percent-age withProfits of $10,000þ
Percent-age of AllFirms
Agricultural services,forestry, fishing, andmining
$106,859 0.9 23.7% 31.0% 3.4%
Construction $167,862 1.2 29.8% 38.5% 10.6%
Manufacturing $872,526 7.1 19.6% 41.2% 3.0%
Transportation,communications, andutilities
$186,053 1.7 30.4% 44.8% 4.1%
Wholesale Trade $1,190,794 3.2 24.0% 54.0% 3.1%
Retail Trade $291,646 2.8 24.2% 33.6% 14.4%
Finance, insurance, andreal estate
$166,021 0.9 19.5% 42.1% 11.3%
Services $84,954 1.2 27.0% 27.1% 45.1%
Professional $103,455 1.2 19.1%
Personal $71,344 1.2 26.0%Industries not classified $29,130 0.1 33.6% 15.6% 5.1%
All firms $192,672 1.6 26.0% 32.5%
Source: U.S. Census Bureau, Economic Census, Survey of Minority-Owned BusinessEnterprises (1992) and U.S. Bureau of the Census (1997).Note: The sample includes businesses that are classified by the IRS as individual proprie-torships or self-employed persons, partnerships, and subchapter S corporations and thathave sales of $500 or more.
The Determinants of Small Business Success 85

8/9/2019 Race and Entrepreneurial Success - Black , Asian, And White Owned Business in the United States
http://slidepdf.com/reader/full/race-and-entrepreneurial-success-black-asian-and-white-owned-business 99/253
industries and have one of the lowest levels of average employees. The
patterns in outcomes across industries are somewhat difficult to sum-
marize, but wholesale trade and manufacturing generally have the
best outcomes, and personal services have the worst outcomes.
Although we find large differences in business outcomes across
industries, it is difficult to interpret the results. The main issue is that
the choice of industry, starting, and size of business may be simultane-
ously determined. For example, consider the decision of a worker at
manufacturing plant who is considering starting a business. The deci-
sion for this worker is likely to be between remaining a manufacturing
worker or starting a business in a different industry in which business
ownership is more common, such as retail trade. The simultaneity of the decision suggests that there exist several potential explanations for
finding a relationship between industry and business success. First, it
is possible that some entrepreneurs are constrained in their choice of
industries because of capital requirements, lack of relevant skills, or
discrimination (Boden 1996; Bates 1997; Boden and Nucci 2000; Robb
2000). Discrimination from certain industry sectors, such as construc-
tion, may occur directly through limited opportunities to penetrate net-
works (Bates 1993a; Feagin and Imani 1994; Bates and Howell 1997).Industry differences may also result from differences in the preferences
of owners for types of work. All of these explanations support the idea
that industry choice is a determinant of business success.
On the other hand, industry differences may result from differences
in the preferences of entrepreneurs for the goals of the business. Entre-
preneurs seeking to ‘‘make it rich’’ instead of simply providing a
steady income may choose certain high-growth, high-risk industries
instead of other industries. Differences in entrepreneurial ability may
also lead to different choices of industries. The most able entrepreneurs
are likely to choose the industries that provide them with the highest
potential returns, whereas less able entrepreneurs are likely to be lim-
ited in their choice of industries in which they can start businesses.
High-ability entrepreneurs may also have higher levels of human capi-
tal and more access to financial capital, enabling them to start busi-
nesses in ‘‘better’’ industries. In these cases, the potential success of the
business (or ability of the entrepreneur) is causing the industry choice.
For these reasons, we did not include industry controls in the previ-ous specifications. Previous studies also take this approach of report-
ing results with and without industry controls (see Bates 1997, for
example).
86 Chapter 3
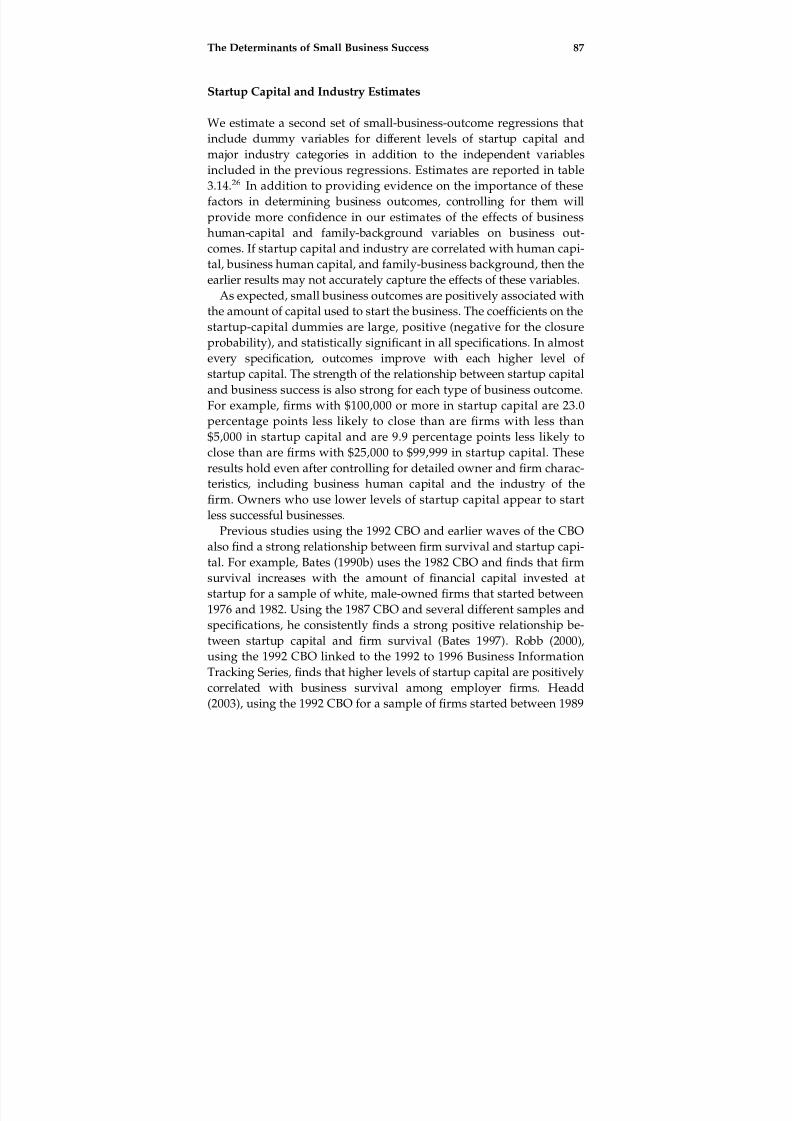
8/9/2019 Race and Entrepreneurial Success - Black , Asian, And White Owned Business in the United States
http://slidepdf.com/reader/full/race-and-entrepreneurial-success-black-asian-and-white-owned-business 100/253
Startup Capital and Industry Estimates
We estimate a second set of small-business-outcome regressions that
include dummy variables for different levels of startup capital and
major industry categories in addition to the independent variables
included in the previous regressions. Estimates are reported in table
3.14.26 In addition to providing evidence on the importance of these
factors in determining business outcomes, controlling for them will
provide more confidence in our estimates of the effects of business
human-capital and family-background variables on business out-
comes. If startup capital and industry are correlated with human capi-
tal, business human capital, and family-business background, then theearlier results may not accurately capture the effects of these variables.
As expected, small business outcomes are positively associated with
the amount of capital used to start the business. The coefficients on the
startup-capital dummies are large, positive (negative for the closure
probability), and statistically significant in all specifications. In almost
every specification, outcomes improve with each higher level of
startup capital. The strength of the relationship between startup capital
and business success is also strong for each type of business outcome.For example, firms with $100,000 or more in startup capital are 23.0
percentage points less likely to close than are firms with less than
$5,000 in startup capital and are 9.9 percentage points less likely to
close than are firms with $25,000 to $99,999 in startup capital. These
results hold even after controlling for detailed owner and firm charac-
teristics, including business human capital and the industry of the
firm. Owners who use lower levels of startup capital appear to start
less successful businesses.
Previous studies using the 1992 CBO and earlier waves of the CBO
also find a strong relationship between firm survival and startup capi-
tal. For example, Bates (1990b) uses the 1982 CBO and finds that firm
survival increases with the amount of financial capital invested at
startup for a sample of white, male-owned firms that started between
1976 and 1982. Using the 1987 CBO and several different samples and
specifications, he consistently finds a strong positive relationship be-
tween startup capital and firm survival (Bates 1997). Robb (2000),
using the 1992 CBO linked to the 1992 to 1996 Business InformationTracking Series, finds that higher levels of startup capital are positively
correlated with business survival among employer firms. Headd
(2003), using the 1992 CBO for a sample of firms started between 1989
The Determinants of Small Business Success 87

8/9/2019 Race and Entrepreneurial Success - Black , Asian, And White Owned Business in the United States
http://slidepdf.com/reader/full/race-and-entrepreneurial-success-black-asian-and-white-owned-business 101/253
Table 3.14
Logit and linear regressions for small business outcomes, Characteristics of BusinessOwners (1992)
Specification
(1) (2) (3) (4)
Dependent variable Closure by 1996
Profits$10,000þ
EmployerFirm
Ln Sales
Black-owned business 0.0077(0.0133)
0.1684(0.0213)
0.0703(0.0176)
0.3215(0.0506)
Latino-owned business 0.0143(0.0123)
0.0444(0.0149)
0.0277(0.0126)
0.0735(0.0447)
Native American-owned
business
0.1270
(0.0564)
0.0322
(0.0548)
0.0696
(0.0454)
0.3468
(0.1706)
Asian-owned business 0.0091(0.0149)
0.0176(0.0150)
0.0164(0.0128)
0.0216(0.0495)
Female-owned business 0.0150(0.0053)
0.1943(0.0069)
0.0498(0.0057)
0.5708(0.0193)
Married 0.0286(0.0070)
0.1068(0.0094)
0.0594(0.0081)
0.1539(0.0261)
Never married 0.0344(0.0083)
0.0080(0.0105)
0.0316(0.0093)
0.2853(0.0309)
High school graduate 0.0065(0.0087)
0.0428(0.0116)
0.0251(0.0099)
0.0324(0.0325)
Some college 0.0095(0.0086)
0.0637(0.0115)
0.0398(0.0098)
0.0011(0.0322)
College graduate 0.0433(0.0096)
0.0855(0.0123)
0.0470(0.0106)
0.1441(0.0355)
Graduate school 0.1617(0.0117)
0.1573(0.0137)
0.1674(0.0115)
0.5567(0.0397)
Urban 0.0079(0.0059)
0.0610(0.0071)
0.0144(0.0059)
0.1831(0.0214)
Prior work experience in amanagerial capacity 0.0826(0.0056) 0.0075(0.0066) 0.0212(0.0057) 0.0401(0.0200)
Prior work experience in asimilar business
0.0505(0.0052)
0.0962(0.0061)
0.0426(0.0053)
0.4081(0.0187)
Have a self-employedfamily member
0.0181(0.0057)
0.0004(0.0069)
0.0057(0.0060)
0.0651(0.0207)
Prior work experience in afamily member’s business
0.0323(0.0071)
0.0210(0.0081)
0.0344(0.0069)
0.2300(0.0250)
Inherited business 0.0761(0.0246)
0.1351(0.0238)
0.2267(0.0182)
1.3143(0.0764)
Startup capital: $5,000 to$24,999
0.0871(0.0061)
0.1505(0.0068)
0.1487(0.0059)
0.7156(0.0214)
Startup capital: $25,000 to$99,999
0.1308(0.0090)
0.2312(0.0088)
0.3077(0.0070)
1.4676(0.0291)
88 Chapter 3

8/9/2019 Race and Entrepreneurial Success - Black , Asian, And White Owned Business in the United States
http://slidepdf.com/reader/full/race-and-entrepreneurial-success-black-asian-and-white-owned-business 102/253
and 1992, also finds that startup capital is negatively associated with
closure of the firm between 1992 and 1996.
Industry is also linked to business success as many of the dummyvariables for industries are large in magnitude and statistically signifi-
cant. The left-out category in the regressions is retail trade. Thus, the
reported regression estimates capture the difference between the aver-
age business outcome in that industry and the average business out-
come in retail trade, after controlling for other owner and business
characteristics. The estimates vary across specifications, however, mak-
ing it difficult to summarize the association between industries and
business outcomes.It is also important to note that the addition of startup capital and
industry do not overly influence the estimated effects of the human
capital, family-business background, and business human-capital
Table 3.14
(continued)
Specification
(1) (2) (3) (4)
Startup capital: $100,000 ormore
0.2295(0.0166)
0.1791(0.0125)
0.3735(0.0099)
2.1520(0.0422)
Agricultural services 0.0112(0.0164)
0.0111(0.0184)
0.1586(0.0167)
0.9204(0.0574)
Construction 0.0438(0.0096)
0.0528(0.0111)
0.0353(0.0090)
0.2546(0.0350)
Manufacturing 0.0625(0.0171)
0.0358(0.0166)
0.0035(0.0129)
0.1055(0.0532)
Wholesale 0.0057(0.0148)
0.1305(0.0153)
0.0006(0.0127)
0.6082(0.0518)
Finance, insurance, and realestate
0.0609(0.0109)
0.0771(0.0122)
0.1856(0.0109)
0.4926(0.0367)
Transportation, communi-cations, and public utilities
0.0600(0.0130)
0.1205(0.0147)
0.1523(0.0139)
0.3300(0.0486)
Personal services 0.0195(0.0079)
0.0488(0.0096)
0.1161(0.0077)
0.7430(0.0286)
Professional services 0.0973(0.0089)
0.0650(0.0110)
0.1191(0.0092)
0.7021(0.0328)
Uncoded industry 0.0198(0.0132)
0.1020(0.0183)
0.5054(0.0334)
0.9842(0.0490)
Mean of dependent variable 0.2280 0.2975 0.2066 10.0668
Sample size 33,116 30,271 33,701 33,701
Note: See notes to table 3.5.
The Determinants of Small Business Success 89

8/9/2019 Race and Entrepreneurial Success - Black , Asian, And White Owned Business in the United States
http://slidepdf.com/reader/full/race-and-entrepreneurial-success-black-asian-and-white-owned-business 103/253
variables. The estimated effects of owner’s education do not change
substantially after including startup capital and industry. The coeffi-
cient estimates on having a self-employed family member and inher-
iting the business also do not change substantially. The coefficient
estimates on previous work experience in a family member’s business
are generally smaller in absolute value (although still statistically sig-
nificant) in the new specifications. The coefficients on prior work expe-
rience in a similar business are very similar. These findings suggest
that the interrelatedness of human-capital and financial-capital inputs
is not problematic for our regression estimates.
Age of the Business
The CBO also includes information on when the business was estab-
lished. We estimate a set of regressions that control for the age of the
business. As expected, we find that the age of the business is a strong
predictor of business success. For each specification, we find that
business outcomes improve with business age. This finding is not sur-
prising as older firms have had more time to grow, and as time pro-
gresses, weaker firms have discontinued operations. Thus, the age of the business is better viewed as another business outcome instead of
as a determinant of business success. Most important, however, we
find that the inclusion of the age of the business does not substantially
alter the estimates of the effects of our main explanatory variables on
business outcomes. The main exception is that the coefficient estimate
on whether the business was inherited is smaller in absolute value in
each of the specifications.
We also estimate specifications that exclude older firms to make sure
that our results hold for more recently created firms. In particular, we
find that our estimates are not overly sensitive to the exclusion of firms
started before 1980. The exclusion of these firms reduces our sample
size by roughly one third.
Overall, these findings indicate that our estimates are not overly sen-
sitive to controlling for the age of the business or the inclusion of much
older businesses. We do not investigate the relationship between our
business outcomes and age of the business further because of endoge-
neity concerns. This is especially important when we later investigatethe causes of racial differences in business outcomes. A finding, for ex-
ample, that black firms are less successful because they are younger
than white firms does not identify the underlying cause of the lack of
success.
90 Chapter 3

8/9/2019 Race and Entrepreneurial Success - Black , Asian, And White Owned Business in the United States
http://slidepdf.com/reader/full/race-and-entrepreneurial-success-black-asian-and-white-owned-business 104/253
Conclusions
What makes a business successful? Do the owner’s education level and
types of prior work experience matter? Is the amount of capital
invested at startup key to the eventual success of the firm? We answer
these questions in this chapter using confidential and restricted-access
microdata from the CBO. Using the detailed information available in
the CBO on both the characteristics of the owner and the business, we
examine the potential determinants of business success measured by
closure rates, profits, employment, and sales. We explore the effects
of human and financial capital on business outcomes as well as less-
studied determinants, such as family-business backgrounds and typesof prior work experience.
The owner’s education level is an important determinant of business
success. For example, businesses owned by college graduates have ap-
proximately 25 percent higher sales on average than businesses owned
by high school dropouts. Furthermore, firms with owners who have a
graduate degree have nearly 40 percent higher sales than firms with
owners who are college graduates. The general and specific knowledge
and skills acquired through formal education, especially at the collegeand graduate-school levels, may be useful for running a successful
business. The owner’s level of education may also serve as a proxy for
his or her overall ability or as a positive signal to potential customers,
lenders, or other businesses.
We also find a strong positive relationship between startup capital
and business outcomes. Firms with higher levels of startup capital are
more likely to have higher profits and sales and to hire employees and
are less likely to close. The estimates are large and consistent across
outcomes. This positive relationship is consistent with the inability of
some entrepreneurs to obtain the optimal level of startup capital be-
cause of borrowing constraints. In this case, differences in startup
capital may be due to differences in the personal wealth of the entre-
preneur because this wealth can be invested directly in the business or
used as collateral to obtain business loans. Because these entrepreneurs
are constrained in the amount of startup capital that could be used to
purchase buildings, equipment, and other investments, their busi-
nesses are less successful than if they could have invested the optimalamount of capital. As noted in the previous literature, however, the
positive relationship may alternatively be due to the ability of poten-
tially successful business ventures to generate startup capital. Al-
though we cannot rule out this possibility, we provide evidence from
The Determinants of Small Business Success 91

8/9/2019 Race and Entrepreneurial Success - Black , Asian, And White Owned Business in the United States
http://slidepdf.com/reader/full/race-and-entrepreneurial-success-black-asian-and-white-owned-business 105/253
the literature suggesting that at least part of the relationship is likely
due to limited access to capital. Lack of access to capital because of
low levels of personal wealth and lending discrimination may be espe-
cially important for minority business owners, which we discuss fur-
ther in the next chapter.
Using rare or unique information contained in the CBO on family-
business backgrounds, we also provide new evidence on the under-
lying causes of intergenerational links in self-employment and the
related issue of how having a family-business background affects small
business outcomes. Estimates from the CBO indicate that more than
half of all business owners had a self-employed family member prior
to starting their business. Conditional on having a self-employed fam-ily member, less than half of small business owners worked in that
family member’s business. This suggests that it is unlikely that inter-
generational links in self-employment are due solely to the acquisi-
tion of general and specific business capital. Similarities across family
members in entrepreneurial preferences may explain part of the
relationship.
In contrast, estimates from regression models for small business out-
comes conditioning on business ownership indicate that having a self-employed family member plays only a minor role relative to prior
work experience in that family member’s business. For most business
outcomes, having a family member who owns a business has no effect
on the success of the business. Working in a family member’s business,
however, has a large, positive, and statistically significant effect for all
business outcomes. The inclusion of controls for similar business work
experience and management experience in the multivariate regres-
sions suggests that the positive estimated effects of working for a self-
employed family member are not simply capturing the effects of
management experience or specific business human capital on small
business outcomes. Instead, prior work experience in a family mem-
ber’s business has an independent effect on small business outcomes,
which may in part be due to the acquisition of less formal or more gen-
eral business human capital. Business owners who worked in family
businesses may simply learn how to run a successful business instead
of how to run just a particular kind of business.
Although many owners had a self-employed family member andprevious work experience in a family member’s business, estimates
from the CBO indicate that only 1.6 percent of all small businesses are
92 Chapter 3
8/9/2019 Race and Entrepreneurial Success - Black , Asian, And White Owned Business in the United States
http://slidepdf.com/reader/full/race-and-entrepreneurial-success-black-asian-and-white-owned-business 106/253
inherited. Inherited businesses are more successful on average than
noninherited businesses, but their limited representation among the
population of small businesses suggests that business inheritance is
only a minor determinant of small business outcomes.
Business owners can also acquire business human capital through
two additional methods—prior work experience in a managerial ca-
pacity and prior work experience in a business whose goods and ser-
vices were similar to those provided by the owner’s business. Our
regression results provide mixed evidence on whether acquiring gen-
eral business human capital through management experience is im-
portant for business success. On the other hand, we find consistent
evidence that prior work experience in a similar type of businessimproves business outcomes. Acquiring skills that are specific to a
type of work or industry—specific business human capital—through
prior work experience appear to be useful for starting and running suc-
cessful businesses.
Several important determinants of business outcomes are identified
from analyzing the CBO microdata. Business success is related to the
financial capital, human capital, and family-business backgrounds of
owners. The next step is to determine whether racial differences inthese factors explain the large disparities in business outcomes dis-
cussed in chapter 2.
Appendixes
Estimating the Intergenerational Transmission in Business Ownership
Business ownership rates for the children of business owners and the
children of nonbusiness owners are estimated from our CBO sample.
To estimate these rates, we need to make two key assumptions. The
difficulty in estimating business ownership rates arises because we do
not have a comparison group of nonbusiness owners in the CBO data.
We first make the conservative assumption that 25 percent of small
business owners have a self-employed parent, which is derived from
our estimate that 51.6 percent of business owners had a self-employed
family member prior to starting their firms. We also have to make the
assumption that the self-employment rate is not changing rapidly over
time and is in a steady state of roughly 10 percent. Making these twoassumptions, we find that the children of self-employed parents are
three times more likely to be self-employed than are the children of
non-self-employed parents.
The Determinants of Small Business Success 93

8/9/2019 Race and Entrepreneurial Success - Black , Asian, And White Owned Business in the United States
http://slidepdf.com/reader/full/race-and-entrepreneurial-success-black-asian-and-white-owned-business 107/253
To see this, we express the joint probability of having a self-
employed parent ðSt1 ¼ 1Þ and a self-employed child when they are
adults ðSt ¼ 1Þ as
PðSt1 ¼ 1; St ¼ 1Þ ¼ PðSt1 ¼ 1 j St ¼ 1ÞPðSt ¼ 1Þ
¼ PðSt ¼ 1 j St1 ¼ 1ÞPðSt1 ¼ 1Þ: ð3:1Þ
PðSt1 ¼ 1 j St ¼ 1Þ is the probability that the parent of a self-employed
child is self-employed, and PðSt ¼ 1 j St1 ¼ 1Þ is the probability that
the child of a self-employed parent is self-employed. Equation (3.1)
must hold because of the laws of probability.
We first assume a steady-state relationship in which the total self-employment rate of parents is the same as the total self-employment
rate of adult children, PðStÞ ¼ PðSt1Þ ¼ 0:10. If we also assume a one-
to-one matching of parents to children, the probability that the child
is self-employed given that his or her parent was self-employed or the
‘‘intergenerational pickup rate’’ (Hout and Rosen 2000) equals the
probability that a business owner has a self-employed parent. This can
be expressed as
PðSt1 ¼ 1 j St ¼ 1Þ ¼ PðSt ¼ 1 j St1 ¼ 1Þ: ð3:2Þ
Thus, the self-employment rate among the children of the self-
employed is 0.25. To find the self-employment rate among children on
the non-self-employed, we can work with the joint probability of hav-
ing a non-self-employed parent and a self-employed child, which can
be expressed as
PðSt1 ¼ 0; St ¼ 1Þ ¼ PðSt1 ¼ 0 j St ¼ 1ÞPðSt ¼ 1Þ
¼ PðSt ¼ 1 j St1 ¼ 0ÞPðSt1 ¼ 0Þ: ð3:3Þ
Substituting PðSt ¼ 1Þ ¼ 0:10, PðSt1 ¼ 0Þ ¼ 0:90 and PðSt1 ¼ 0 j St
¼ 1Þ ¼ 0:75, we can solve for PðSt1 ¼ 0 j St ¼ 1Þ, which is the proba-
bility of self-employment among the children of non-business owners.
Thus, the self-employment rate of the children of the non-self-
employed is 0.08 indicating that the children of self-employed parents
are roughly three times more likely to be self-employed than the chil-
dren of non-self-employed parents, which is consistent with previousfindings in the literature.
The percentage of owners who had a self-employed family member
prior to business startup certainly overstates the percentage of owners
94 Chapter 3
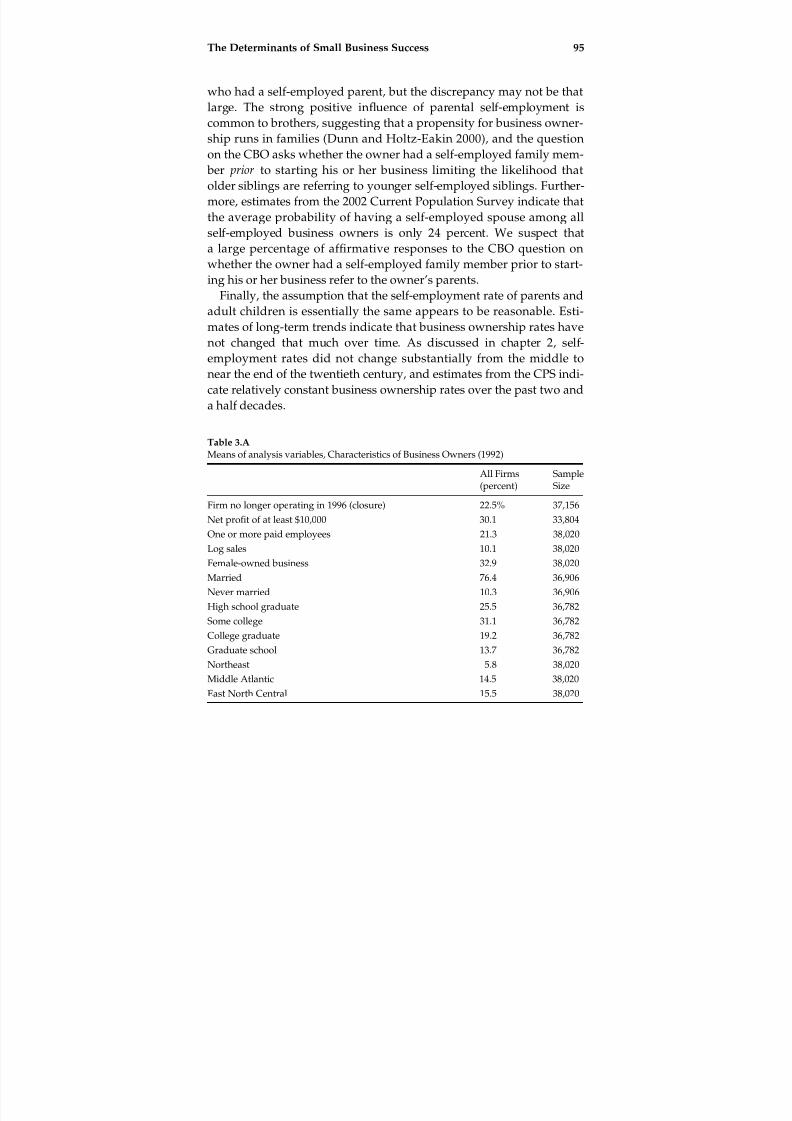
8/9/2019 Race and Entrepreneurial Success - Black , Asian, And White Owned Business in the United States
http://slidepdf.com/reader/full/race-and-entrepreneurial-success-black-asian-and-white-owned-business 108/253
who had a self-employed parent, but the discrepancy may not be that
large. The strong positive influence of parental self-employment is
common to brothers, suggesting that a propensity for business owner-
ship runs in families (Dunn and Holtz-Eakin 2000), and the question
on the CBO asks whether the owner had a self-employed family mem-
ber prior to starting his or her business limiting the likelihood that
older siblings are referring to younger self-employed siblings. Further-
more, estimates from the 2002 Current Population Survey indicate that
the average probability of having a self-employed spouse among all
self-employed business owners is only 24 percent. We suspect that
a large percentage of affirmative responses to the CBO question on
whether the owner had a self-employed family member prior to start-ing his or her business refer to the owner’s parents.
Finally, the assumption that the self-employment rate of parents and
adult children is essentially the same appears to be reasonable. Esti-
mates of long-term trends indicate that business ownership rates have
not changed that much over time. As discussed in chapter 2, self-
employment rates did not change substantially from the middle to
near the end of the twentieth century, and estimates from the CPS indi-
cate relatively constant business ownership rates over the past two anda half decades.
Table 3.A
Means of analysis variables, Characteristics of Business Owners (1992)
All Firms(percent)
SampleSize
Firm no longer operating in 1996 (closure) 22.5% 37,156
Net profit of at least $10,000 30.1 33,804One or more paid employees 21.3 38,020
Log sales 10.1 38,020
Female-owned business 32.9 38,020
Married 76.4 36,906
Never married 10.3 36,906
High school graduate 25.5 36,782
Some college 31.1 36,782
College graduate 19.2 36,782
Graduate school 13.7 36,782Northeast 5.8 38,020
Middle Atlantic 14.5 38,020
East North Central 15.5 38,020
The Determinants of Small Business Success 95

8/9/2019 Race and Entrepreneurial Success - Black , Asian, And White Owned Business in the United States
http://slidepdf.com/reader/full/race-and-entrepreneurial-success-black-asian-and-white-owned-business 109/253
Table 3.A
(continued)
All Firms
(percent)
Sample
Size
West North Central 7.8 38,020
South Atlantic 16.3 38,020
East South Central 4.9 38,020
West South Central 10.6 38,020
Mountain 6.6 38,020
Urban 75.7 38,020
Prior work experience: 1 year 7.3 37,503
Prior work experience: 2 to 5 years 16.5 37,503
Prior work experience: 6 to 9 years 15.1 37,503
Prior work experience: 10 to 19 years 29.3 37,503
Prior work experience: 20 years or more 25.3 37,503
Prior work experience in a managerial capacity 55.2 37,417
Prior work experience in a similar business 50.1 37,238
Have a self-employed family member 51.6 37,740
Prior work experience in a family member’s business 22.5 36,575
Inherited business 1.6 37,619
Startup capital: $5,000 to $24,999 23.5 37,388
Startup capital: $25,000 to $99,999 11.3 37,388
Startup capital: $100,000 and over 5.0 37,388
Agricultural services 2.7 38,020
Construction 12.1 38,020
Manufacturing 3.3 38,020
Wholesale 3.5 38,020
Finance, insurance, and real estate 9.7 38,020
Transportation, communications, and public utilities 4.2 38,020
Personal services 26.3 38,020
Professional services 19.1 38,020
Uncoded industry 4.1 38,020
Notes: (1) The sample includes businesses that are classified by the IRS as individual pro-prietorships or self-employed persons, partnerships, and subchapter S corporations, havesales of $500 or more, and have at least one owner who worked at least twelve weeksand ten hours per week in the business. (2) All estimates are calculated using sampleweights provided by the Characteristics of Business Owners.
96 Chapter 3

8/9/2019 Race and Entrepreneurial Success - Black , Asian, And White Owned Business in the United States
http://slidepdf.com/reader/full/race-and-entrepreneurial-success-black-asian-and-white-owned-business 110/253
4 Why Are African American-Owned BusinessesLess Successful?
African Americans are less likely to own businesses than whites, andtheir businesses are less successful on average than are white-owned
businesses. The evidence presented in chapter 2 indicates that black
businesses have lower revenues and profits, hire fewer employees,
and are more likely to close than white-owned businesses. In most
cases, the disparities are large. For example, average sales among black
firms are roughly one fourth that of white firms, and black firms hire
one third the number of employees on average as white firms. The
relative underperformance of black-owned businesses is alarming because of the implications of successful business ownership for eco-
nomic advancement, job creation, and income equality.
In the previous chapter’s exploration of the determinants of business
outcomes, several owner and firm characteristics are identified as
predictors of success. Human capital, financial capital, and family-
business backgrounds are found to improve business outcomes. Do
black business owners have lower levels of education, less access to
startup capital, and more disadvantaged family backgrounds thanwhite business owners? Can these factors explain why black-owned
businesses have lower survival rates, profits, employment, and sales
than white-owned businesses?
The single most important factor determining business success is
startup capital. We find that higher levels of startup capital are associ-
ated with lower closure probabilities, higher profits and sales, and
more employment. Therefore, less access to capital for black business
owners compared with white owners may partly explain why black-
owned businesses have worse outcomes than white-owned firms, onaverage. Previous research indicates that low levels of wealth limit
business creation among blacks (Fairlie 1999, 2006) and low levels of
startup capital increase closure rates among black-owned businesses

8/9/2019 Race and Entrepreneurial Success - Black , Asian, And White Owned Business in the United States
http://slidepdf.com/reader/full/race-and-entrepreneurial-success-black-asian-and-white-owned-business 111/253
(Bates 1997; Robb 2000). There is also a large body of evidence indicat-
ing that black businesses face lending discrimination (Blanchflower,
Levine, and Zimmerman 2003; Cavalluzzo, Cavalluzzo, and Wolken
2002). Given these findings, we suspect that racial differences in wealth
and startup capital contribute substantially to differences in business
outcomes, but we do not know the extent of their contribution.
Another determinant of success in small business is the owner’s edu-
cation level. After controlling for other factors, firms with more highly
educated owners have lower closure probabilities, higher profits and
sales, and more employment. Therefore, if black business owners have
lower education levels than white business owners, disparities in edu-
cation levels could explain why black-owned businesses underperformrelative to white-owned firms, on average.
Building on the finding in the previous literature that the children of
business owners are more likely than the children of nonbusiness own-
ers to become business owners, we examine whether the businesses
created by the children of business owners are also more successful.
In the previous chapter, we find that previous work experience in a
family member’s business and previous work experience in a business
providing similar goods and services have large positive effects on business outcomes. These findings suggest that the lack of opportuni-
ties for black owners to acquire important general and specific business
human capital may limit their ability to create successful businesses. In
fact, there is evidence in the previous literature indicating that current
differences between blacks and whites in business ownership rates are
partly determined by racial differences in business ownership in the
previous generation (Fairlie 1999; Hout and Rosen 2000). Although the
intergenerational transmission of business ownership is important in
creating racial disparities in rates of business ownership, we do not
know if it also contributes to racial disparities in business outcomes
conditioning on ownership. In particular, can these disparities explain
why black-owned businesses lag behind white-owned businesses in
survival rates, profits, employment, and sales?
Several recent studies have examined the reasons behind the lack of
black-owned businesses and find that relatively low levels of educa-
tion, assets, and parental self-employment are partly responsible (see
Bates 1997, Fairlie 1999, and Hout and Rosen 2000 for a few examplesreviewed in chapter 2). Although these results are informative, they do
not shed light on why the average performance of black-owned firms
lags behind that of white-owned firms. We know much less about
98 Chapter 4

8/9/2019 Race and Entrepreneurial Success - Black , Asian, And White Owned Business in the United States
http://slidepdf.com/reader/full/race-and-entrepreneurial-success-black-asian-and-white-owned-business 112/253
why black-owned firms have lower outcomes relative to white-owned
businesses. This is partly due to the small number of datasets that
identify the race of the owner, additional owner characteristics, and
business outcomes.
We use data from the Characteristics of Business Owners (CBO) to
examine the role that financial capital and human capital play in con-
tributing to racial disparities in business outcomes, such as closures,
profits, employment size, and sales. We also examine the role that
intergenerational links in self-employment play in contributing to ra-
cial differences in business outcomes. Do black business owners have
limited opportunities for the acquisition of general and specific busi-
ness human capital from working in family-owned businesses andthe receipt of business inheritances, in addition to less education and
access to financial capital? We build on findings from the previous
chapter on the determinants of business success and use a special de-
composition technique to identify the underlying causes of differences
in outcomes between black and white firms. The decomposition tech-
nique identifies whether a particular factor is important and identifies
how much it explains of the gap in a particular outcome. This allows
the relative strengths of the factors to be compared.The confidential and restricted-access CBO microdata are useful for
this analysis because they are one of the only nationally representative
datasets containing a large enough sample of black firms and detailed
information on family-business backgrounds. For example, the CBO
appears to be the only nationally representative dataset containing in-
formation on previous work experience in businesses owned by family
members. Overall, the detailed information on both the characteristics
of the owner and the business available in the CBO is important for
exploring additional potential causes of the racial differences in busi-
ness outcomes.
Racial Differences in Education
Over the twentieth century, blacks made considerable progress in edu-
cational attainment. Figure 4.1 displays estimates of the percentage of
black and white adults age twenty-five and over who have completed
four or more years of high school. In 1940, only 7.7 percent of blackscompleted four years of high school or more. By 2004, more than 80
percent of blacks had high school educations. The percentage of blacks
who completed at least four years of college also increased markedly
Why Are African American-Owned Businesses Less Successful? 99

8/9/2019 Race and Entrepreneurial Success - Black , Asian, And White Owned Business in the United States
http://slidepdf.com/reader/full/race-and-entrepreneurial-success-black-asian-and-white-owned-business 113/253
over the period. Only 1.3 percent of blacks were college educated in
1940, but nearly 20 percent were college educated by 2004. Although
blacks have made considerable progress both in absolute terms and
relative to whites, large disparities in educational attainment remain.
In 2004, 85.8 percent of whites had at least four years of high school,
and 28.2 percent had at least four years of college. Racial parity in edu-
cational attainment has not yet occurred.Racial disparities in educational attainment are smaller for business
owners than the general population but remain large. Figure 4.2 dis-
plays estimates of educational attainment by race from CBO micro-
data. Black business owners are more likely to be high school
dropouts and are less likely to be college graduates. Black business
owners, however, are equally likely to have graduate school degrees
as white business owners. Overall, 26.2 percent of black business own-
ers have at least a college education compared with 33.3 percent of white business owners.
In the previous chapter, we find that the education level of the
owner is an important predictor of business success. Therefore, the
Figure 4.1
Educational attainment by race, U.S. Census Bureau estimates (1940 to 2004)
100 Chapter 4
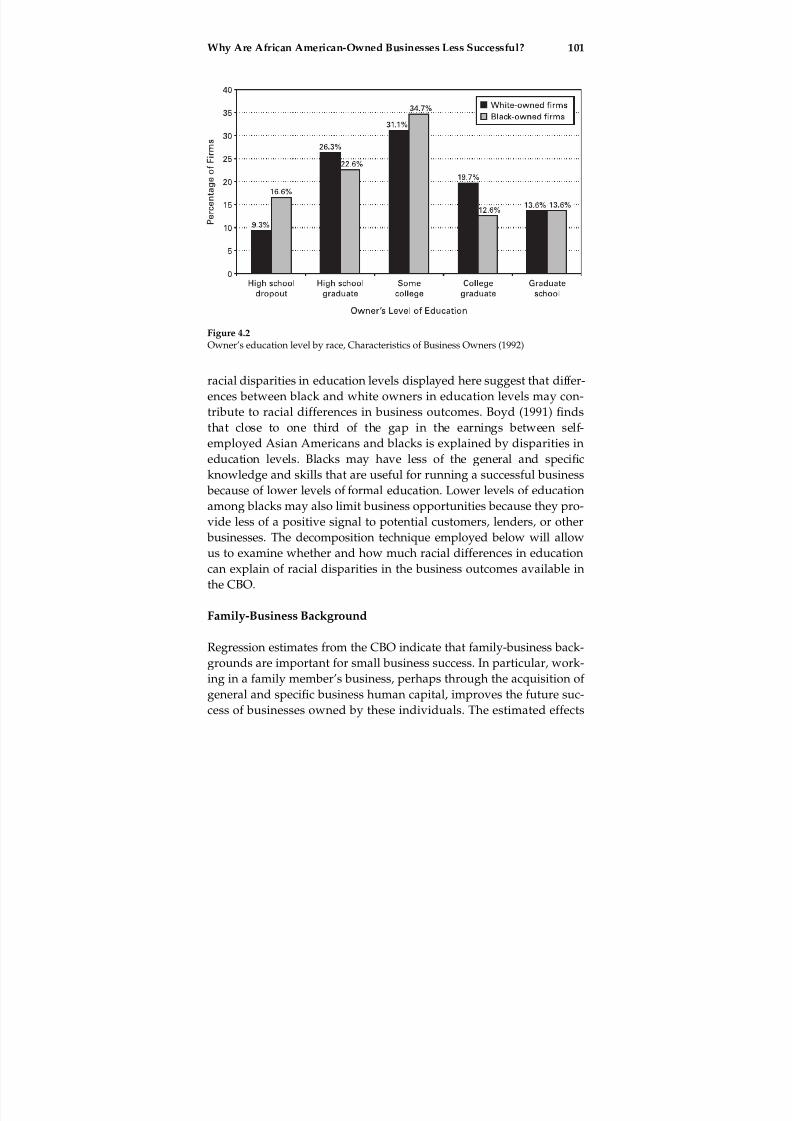
8/9/2019 Race and Entrepreneurial Success - Black , Asian, And White Owned Business in the United States
http://slidepdf.com/reader/full/race-and-entrepreneurial-success-black-asian-and-white-owned-business 114/253
racial disparities in education levels displayed here suggest that differ-
ences between black and white owners in education levels may con-tribute to racial differences in business outcomes. Boyd (1991) finds
that close to one third of the gap in the earnings between self-
employed Asian Americans and blacks is explained by disparities in
education levels. Blacks may have less of the general and specific
knowledge and skills that are useful for running a successful business
because of lower levels of formal education. Lower levels of education
among blacks may also limit business opportunities because they pro-
vide less of a positive signal to potential customers, lenders, or other businesses. The decomposition technique employed below will allow
us to examine whether and how much racial differences in education
can explain of racial disparities in the business outcomes available in
the CBO.
Family-Business Background
Regression estimates from the CBO indicate that family-business back-grounds are important for small business success. In particular, work-
ing in a family member’s business, perhaps through the acquisition of
general and specific business human capital, improves the future suc-
cess of businesses owned by these individuals. The estimated effects
Figure 4.2
Owner’s education level by race, Characteristics of Business Owners (1992)
Why Are African American-Owned Businesses Less Successful? 101

8/9/2019 Race and Entrepreneurial Success - Black , Asian, And White Owned Business in the United States
http://slidepdf.com/reader/full/race-and-entrepreneurial-success-black-asian-and-white-owned-business 115/253
are large in magnitude: they increase outcomes anywhere from 15 to
40 percent. Given these results and the extensive literature addressing
concerns with the African American family (Wilson 1987; Tucker and
Mitchell-Kernan 1995; Wilson 2002), it is useful to explore the relation-
ship between race, families, and business success.
Recent estimates indicate that blacks are 40 percent less likely to be
married than are whites and that black women are nearly 80 percent
more likely to have a nonmarital birth than are white women (U.S.
Census Bureau 2001; National Center for Health Statistics 2003). As a
result, 53.3 percent of black children live with only one of their parents
compared with 21.5 percent of white children (U.S. Census Bureau
2001). The high incidence of single black parents is likely to have ad-verse educational, economic, and emotional outcomes for this group of
children (McLanahan and Sandefur 1994; Seltzer 1994; Amato 2000).
The loss of resources associated with having one parent missing from
the household may be especially detrimental to the future outcomes of
black children.
One area in which the lack of exposure to both parents may be limit-
ing is in business ownership. As noted above, previous research indi-
cates that the probability of self-employment is substantially higheramong the children of the self-employed than among the children of
the non-self-employed (Lentz and Laband 1990; Fairlie 1999; Dunn
and Holtz-Eakin 2000; Hout and Rosen 2000). These studies generally
find that an individual who had a self-employed parent is roughly
two to three times as likely to be self-employed as someone who did
not have a self-employed parent. The high incidence of growing up
in a single-parent family and the strong intergenerational link in self-
employment may limit business ownership opportunities for blacks. If
black children are less likely to live with both parents, they will have a
lower likelihood of being exposed to a self-employed parent and fewer
chances to work in a family business.
Although the high rates of black children currently growing up in
single-parent families may have a detrimental effect on future business
ownership rates and business outcomes, historical estimates of single-
parent family rates contribute to current differences in business out-
comes. The earliest reported data from the U.S. Census Bureau, which
are for 1960, indicate that black children were more than twice as likelyto live in single-parent families as white children. In 1960, 21.9 percent
of black children lived in single-parent families compared with 7.1 per-
cent of white children (U.S. Census Bureau 2005b). On average, these
102 Chapter 4
8/9/2019 Race and Entrepreneurial Success - Black , Asian, And White Owned Business in the United States
http://slidepdf.com/reader/full/race-and-entrepreneurial-success-black-asian-and-white-owned-business 116/253
children would be forty-two years old at the time of the CBO survey.
Nearly half of the sample of black business owners in the CBO is under
the age of forty-five, suggesting that historically high levels of single-
parent households may be contributing to the lower outcomes of the
current generation of business owners. Marriage rates among current
black business owners are also lower than marriage rates among white
business owners: 77 percent of white owners are married compared
with 68 percent of black owners.
Concerns about the negative consequences of weak family ties on
business opportunities among blacks are not new. In fact, nearly forty
years ago, Nathan Glazer and Daniel Patrick Moynihan made the ar-
gument that the black family ‘‘was not strong enough to create thoseextended clans that elsewhere were most helpful for businessmen and
professionals’’ (Glazer and Moynihan 1970, p. 33). More recently, Hout
and Rosen (2000) note a ‘‘triple disadvantage’’ faced by black men in
terms of business ownership. They are less likely than white men to
have self-employed fathers, to become self-employed if their fathers
were not self-employed, and to follow their father in self-employment.
Furthermore, Fairlie (1999) provides evidence from the Panel Study
of Income Dynamices (PSID) that current racial patterns of self-employment are in part determined by racial patterns of self-
employment in the previous generation. Thus, there is some concern
that the lack of a strong family-business background may limit oppor-
tunities for black business success.
Racial Differences in Family-Business Experience
Previous research indicates that the relatively low likelihood of having
a self-employed parent limits blacks’ chances of becoming a self-
employed business owner. We know less, however, about whether
blacks and whites differ in prior work experience in family businesses
and their likelihood of receiving business inheritances and whether
these patterns contribute to the lower outcomes by black firms relative
to white firms, on average. Black and white business owners indeed
have different family-business backgrounds. Table 4.1 reports the per-
centage of owners who had a family member who was a business
owner and the percentage of owners who worked for that family mem- ber.1 More than half of all white business owners had a self-employed
family member owner prior to starting their business. In contrast, ap-
proximately one third of black business owners had a self-employed
Why Are African American-Owned Businesses Less Successful? 103

8/9/2019 Race and Entrepreneurial Success - Black , Asian, And White Owned Business in the United States
http://slidepdf.com/reader/full/race-and-entrepreneurial-success-black-asian-and-white-owned-business 117/253
family member. Black business owners are much less likely to be part
of a family with business experience.
Although family members may include spouses and siblings in addi-tion to parents, these results are consistent with Hout and Rosen’s
(2000) finding of a lower probability of self-employment among the
children of self-employed parents (the ‘‘intergenerational pickup rate
with respect to self-employment’’) for blacks than for whites. As men-
tioned previously, this represents one of the three disadvantages in
business ownership faced by blacks, according to Hout and Rosen.
To see the similarity with Hout and Rosen’s finding, we can use
equations (3.1) and (3.2) from this chapter’s appendix and evidence onlong-term trends in black and white self-employment rates. As dis-
played in figure 2.2, business-ownership rates have not changed sub-
stantially over time and thus across generations for either whites
or blacks. This implies that self-employment rates are roughly in a
long-term steady-state relationship in which the current generation’s
self-employment rate is similar to the previous generation’s self-
employment rate. If we also assume that there exists a one-to-one
matching of parents to children, the intergenerational pickup rate
equals the probability of a business owner having a self-employed par-
ent as indicated in equation (3.2). Using this equation, we find that the
intergenerational pickup rate for blacks is approximately 0.330, where-
as the intergenerational pickup rate is 0.531 for whites and 0.516 for
Table 4.1
Family business background by race, Characteristics of Business Owners (1992)
AllFirms
White-
OwnedFirms
Black-
OwnedFirms
Had a self-employed family member priorto starting firm
51.6% 53.1% 33.6%
Previously worked in that family member’s business (conditional)
43.6% 43.9% 37.4%
Previously worked in a family member’s business (unconditional)
22.5% 23.3% 12.6%
Inherited their businesses 1.6% 1.7% 1.4%
Sample size 38,020 15,872 7,565
Notes: (1) The sample includes businesses that are classified by the IRS as individual pro-prietorships or self-employed persons, partnerships, and subchapter S corporations, havesales of $500 or more, and have at least one owner who worked at least twelve weeksand ten hours per week in the business. (2) All estimates are calculated using sampleweights provided by the Characteristics of Business Owners.
104 Chapter 4
8/9/2019 Race and Entrepreneurial Success - Black , Asian, And White Owned Business in the United States
http://slidepdf.com/reader/full/race-and-entrepreneurial-success-black-asian-and-white-owned-business 118/253
all firms. The black/total ratio for the probability of having a self-
employed family member is 0.632, which is in the range of Hout and
Rosen’s (2000) estimates. Therefore, the CBO data provide support for
the hypothesis that blacks are less likely to become business owners
than whites, even for those individuals who have self-employed
parents.
Family businesses may provide important opportunities for acquir-
ing general and specific business human capital (Lentz and Leband
1990). Estimates from the CBO indicate that conditional on having a
self-employed family member, black business owners were also less
likely to have worked for that person than were white business own-
ers. As shown in table 4.1, 37.4 percent of black business owners whohad a self-employed family member worked for that person’s business,
whereas 43.9 percent of white business owners who had a self-
employed family member worked for that person’s business.2 Finally,
black business owners overall were much less likely than white busi-
ness owners to work for a family member’s business. The uncondi-
tional rate of working in a family member’s business was 12.6 percent
for blacks and 23.3 percent for whites.
Black business owners were slightly less likely to inherit their busi-nesses than were white owners: 1.4 percent of black owners inherited
their firms compared with 1.7 percent of white owners. All rates of
inheritance are very low and suggest that racial differences in inheri-
tances cannot explain much of the gaps in small business outcomes.
We also find that only 4.3 percent of white owners and 2.0 percent of
black owners acquired the business through a ‘‘transfer of ownership/
gift’’ and had a self-employed family member prior to starting their
business. These upper-bound estimates of direct parent-to-child trans-
fers or gifts of businesses that are not inheritances combined with the
estimates of business inheritances suggests that only a small percent-
age of all existing businesses are acquired from parents. They are also
confirmed by estimates from the 1998 Survey of Small Business Fi-
nances (SSBF), which indicate that 4.2 percent of whites and 4.0 per-
cent of blacks inherited or received their business as a gift.
Overall, black business owners have a relatively disadvantaged
family-business background compared with white business owners.
The lack of family-business experience may contribute substantially tothe relative lack of success of black-owned businesses because of lim-
ited opportunities to receive the informal learning or apprenticeship-
type training that occurs in working in a family business. Family
Why Are African American-Owned Businesses Less Successful? 105

8/9/2019 Race and Entrepreneurial Success - Black , Asian, And White Owned Business in the United States
http://slidepdf.com/reader/full/race-and-entrepreneurial-success-black-asian-and-white-owned-business 119/253
businesses provide an opportunity for family members to acquire gen-
eral business human capital and in many cases also provide the oppor-
tunity for acquiring specific business human capital. The impact of
racial differences in these opportunities on racial differences in small
business outcomes will be explored using a special decomposition
technique shown later in the chapter.
Racial Differences in Business Human Capital
Having prior work experience in businesses whose goods and services
were similar to those provided by the owner’s business is found to be
an important determinant of business success. If blacks have less priorwork experience in a similar business, then they may have had less of a
chance to acquire the skills that are specific to a type of work or indus-
try that are useful for running a successful business. Black business
owners may also have less prior management experience than white
business owners. The results from our regression analysis, however,
do not provide clear evidence on the effects of having prior work expe-
rience in a managerial capacity on business outcomes.
Table 4.2 reports estimates of the percentage of black and whitefirms with owners who previously worked in a business with similar
goods and services and who have previous work experience in a man-
agerial capacity. Black business owners have less work experience in a
similar business prior to starting or acquiring their businesses than
whites. Half of all white business owners have this type of work expe-
rience, compared with 43.1 percent of black business owners. The dif-
Table 4.2Types of prior work experience by race, Characteristics of Business Owners (1992)
AllFirms
White-OwnedFirms
Black-OwnedFirms
Previously worked in a business with similar goods/services
50.1% 50.4% 43.1%
Previous work experience in a managerial capacity 55.2% 55.6% 47.1%
Sample size 38,020 15,872 7,565
Notes: (1) The sample includes businesses that are classified by the IRS as individual pro-prietorships or self-employed persons, partnerships, and subchapter S corporations, havesales of $500 or more, and have at least one owner who worked at least twelve weeksand ten hours per week in the business. (2) All estimates are calculated using sampleweights provided by the Characteristics of Business Owners.
106 Chapter 4
8/9/2019 Race and Entrepreneurial Success - Black , Asian, And White Owned Business in the United States
http://slidepdf.com/reader/full/race-and-entrepreneurial-success-black-asian-and-white-owned-business 120/253
ference in prior work experience at a business with similar goods and
services may translate into black owners having less specific business
human capital than white owners on average.
Black business owners are also less likely to have prior work experi-
ence in a managerial capacity than are white business owners. The per-
centage of black business owners with prior managerial experience is
47.1 percent compared with 55.6 percent for whites. Although there is
a racial difference in managerial experience, the findings from our re-
gression analysis in chapter 3 are mixed on the importance of this type
of experience in predicting business success. Thus, it is difficult to pre-
dict whether lower levels of prior managerial experience among black
business owners lead to worse outcomes relative to white businesses.
Financial Capital
An important limiting factor for the performance of black firms may be
access to financial capital. Relatively low levels of wealth among blacks
and the existence of liquidity constraints in U.S. financial markets may
limit the ability of black entrepreneurs to raise the optimal levels of
capital needed to start businesses. As discussed in chapter 2, there isevidence in the literature that low levels of assets among blacks are
one of the major causes of low rates of business creation. Estimates
from both the CPS and PSID indicate that roughly 15 percent of the
white/black gap in business entry rates is due to wealth disparities
(Fairlie 1999, 2006).
Very little previous research focuses on the related question of
whether low levels of personal wealth and liquidity constraints also
limit the ability of black entrepreneurs to raise startup capital. Under-
capitalization likely leads to lower survivability, profits, employment,
and sales. Indeed, we find in the previous chapter that the level of
startup capital is a strong predictor of business success. If startup capi-
tal levels are influenced by entrepreneurial wealth, then a strong link
between racial inequality in wealth and racial disparities in business
outcomes is expected. Related to this issue and potentially exacerbat-
ing the problem is that black entrepreneurs may face discrimination in
the lending market, which would also limit their ability to invest in
their businesses.Racial inequality in wealth may also have an effect on the continuing
success of businesses. If business owners cannot freely borrow to offset
periods of low sales, then those owners with fewer financial resources
Why Are African American-Owned Businesses Less Successful? 107

8/9/2019 Race and Entrepreneurial Success - Black , Asian, And White Owned Business in the United States
http://slidepdf.com/reader/full/race-and-entrepreneurial-success-black-asian-and-white-owned-business 121/253
may be more likely to close. In addition, access to personal or family
wealth may allow owners to avoid potential liquidity constraints in
expanding existing businesses. Even if black business owners are able
to obtain adequate startup capital, future limitations in accessing finan-
cial capital may result in less successful businesses.
Some suggestive evidence on racial differences in access to financial
capital is provided by published estimates from the CBO (U.S. Census
Bureau 1997). The CBO questionnaire asks owners with unsuccessful
businesses from 1992 to 1996 why their businesses were unsuccessful.
Black business owners are twice as likely as all business owners to re-
port ‘‘lack of access to business loans/credit’’ as a reason for closure
(16.2 percent compared with 8.3 percent). They are also nearly threetimes more likely than all business owners to report ‘‘lack of access to
personal loans/credit’’ as a reason for closure (8.8 percent compared
with 3.3 percent). Capital constraints appear to be more relevant for
black entrepreneurs than for white entrepreneurs.
To further explore this hypothesis, we first document and discuss
the causes of racial differences in wealth in the United States. We next
review the findings from the literature on lending discrimination
against black-owned businesses. Finally, we present estimates of black/white differences in startup capital from the CBO. We argue
that racial differences in startup capital capture racial differences in ac-
cess to capital. Low levels of startup capital invested in black-owned
businesses partly reflect racial inequality in personal and family wealth
and may also result from discrimination in the lending market.
Black/White Differences in Wealth
Racial inequality in the accumulation of wealth in the United States
stands in stark contrast to wage and earnings inequality. For example,
median weekly earnings for full-time black workers are 80 percent of
median weekly earnings of full-time white workers (U.S. Bureau of
Labor Statistics 2004). The median net worth of whites, on the other
hand, is nearly eleven times higher than the median net worth of blacks
(see table 4.3). The median level of net worth, defined as the current
value of all assets minus all liabilities on those assets, for black house-
holds is only slightly more than $6,000. Remarkably, that estimate
implies that if you add home equity, savings, retirement accounts, mu-tual fund accounts, and other assets, 50 percent of all black households
in the United States have less than $6,166 in net worth. The median
level of net worth among white households is $67,000. Large racial dif-
108 Chapter 4

8/9/2019 Race and Entrepreneurial Success - Black , Asian, And White Owned Business in the United States
http://slidepdf.com/reader/full/race-and-entrepreneurial-success-black-asian-and-white-owned-business 122/253
ferences in net worth are also found using other datasets and within
age groups, education levels, and marital statuses (Blau and Graham
1990; Oliver and Shapiro 1995; Scholz and Levine 2004; Altonji and
Doraszelski 2001).
Examining the full distribution of wealth reveals a more pronounced
inequality than what is revealed by a comparison of medians (figure
4.3). Forty-five percent of blacks have net worth of less than $5,000.
Less than one fifth of all whites have net worth below this level. At the
top of the distribution, only 2.7 percent of blacks have a value of net
worth that is at least $250,000. Among whites, 22.2 percent have values
of net worth in this range. Comparing asset distributions makes it
strikingly clear: most blacks have very low levels of wealth, and rela-
tively few have high levels of wealth when compared with whites.
The single largest asset held by most households is their home. Esti-mates of home ownership reported in table 4.4 indicate that only 46.8
percent of all black households own their own homes. For whites, 73.0
percent own their own home. Among home owners, blacks have much
less equity in their homes than whites. The median home equity
among black homeowners is $35,000, whereas the median home equity
among white homeowners is $64,200. Blacks are clearly less likely to
own their own homes, and among those who own a home, they have
less equity in their homes. This is due to a combination of lower homevalues and lower equity/debt ratios in their homes.
Estimates from the SIPP indicate that wealth inequality has
decreased only slightly in the past two decades. In 1983, the white/
Table 4.3
Median value of assets for households by race, U.S. Census Bureau Estimates (1983 to2000)
Total WhiteWhitenon-Latino Black
1983 $32,667 $39,135 $3,397
1988 $35,752 $43,279 $4,169
1991 $36,623 $44,408 $4,604
1993 $37,587 $45,740 $4,418
1995 $40,200 $49,030 $7,073
1998 $41,681 $52,301 $59,700 $5,490
2000 $46,506 $58,716 $67,000 $6,166
Source: U.S. Census Bureau estimates from various years of the Survey of Income andProgram Participation.
Why Are African American-Owned Businesses Less Successful? 109

8/9/2019 Race and Entrepreneurial Success - Black , Asian, And White Owned Business in the United States
http://slidepdf.com/reader/full/race-and-entrepreneurial-success-black-asian-and-white-owned-business 123/253
black ratio of median asset levels was 11.5. By 2000, the ratio dropped
to 9.5. However, some of this decrease may have been due to the large
increase in the white Latino population in the 1980s and 1990s. Latinos
have very low levels of net worth, which are only slightly higher than
black levels. If white non-Latinos are used to calculate the white/black
ratio of median net worth, we find a ratio of 10.9. In either case, racial
wealth inequality is extremely large and does not appear to be dis-appearing quickly.
As expected, a large percentage of the racial gap in wealth accumu-
lation is due to differences in permanent or lifetime income, family
composition, and other demographic characteristics. Income differ-
Figure 4.3
Distribution of net worth by race, U.S. Census Bureau Estimates, Survey of Income andProgram Participation (2000)
Table 4.4
Home ownership and median home equity by race, U.S. Census Bureau Estimates fromthe Survey of Program and Income Participation (2000)
TotalWhitenon-Latino Black
Percentage with own home 67.2% 73.0% 46.8%
Median equity in own home among homeowners $59,000 $64,200 $35,000
Source: U.S. Census Bureau estimates from various years of the Survey of Income andProgram Participation.
110 Chapter 4

8/9/2019 Race and Entrepreneurial Success - Black , Asian, And White Owned Business in the United States
http://slidepdf.com/reader/full/race-and-entrepreneurial-success-black-asian-and-white-owned-business 124/253
ences between blacks and whites alone explain a large part of the gap
(Scholz and Levine 2004). Racial differences in inheritances and gifts
also appear to contribute to the wealth gap measured in mean levels
(Menchik and Jianakoplos 1997; Gittleman and Wolff 2004; Avery and
Rendall 1997, 2002). The contribution to the racial gap in median levels
of net worth is likely to be smaller, however, as most households do
not receive inheritances (Scholz and Levine 2004). Other types of inter-
generational transfers may also be important in contributing to the
racial wealth gap. Racial differences in parental wealth explain part of
the wealth gap (Conley 1999). Charles and Hurst (2002) find that 42
percent of white families receive assistance from their family for a
down payment on a home compared with only 10 percent of blackfamilies.
Lower levels of asset accumulation among blacks may also be due to
differences in investment types (Scholz and Levine 2004), lower rates of
return on assets within asset types (Menchik and Jianakoplos 1997),
and higher participation rates in welfare programs and public hous-
ing, which have asset restrictions. Finally, racial differences in self-
employment partly explain racial differences in asset accumulation
(Menchik and Jianakoplos 1997; Altonji and Doraszelski 2001). Thisfinding, however, begs the question of whether self-employment
increases asset accumulation or wealth increases self-employment as
discussed in previous chapters.
The consequences of racial wealth inequality are severe. Low asset
levels affect the ability of black families to smooth their consumption
over fluctuations in income due to job loss and other negative labor-
market outcomes. Wealth inequality also translates into political, so-
cial, residential, and educational inequality. Current asset levels, and
not only current and future income, are important for home purchases
and financing education. Through inheritances and intergenerational
transfers, black/white wealth inequality is also transmitted to future
generations.
Racial inequality in wealth is also likely to have negative conse-
quences for business formation and success through its effects on ac-
cess to financial capital. Clearly, lower levels of wealth among blacks
are likely to translate into less access to startup capital. Business cre-
ation is often funded by owner’s equity, and investors frequently re-quire a substantial level of owner’s investment of his or her own
capital as an incentive and as collateral. Racial differences in home eq-
uity may be especially important in providing access to startup capital.
Why Are African American-Owned Businesses Less Successful? 111

8/9/2019 Race and Entrepreneurial Success - Black , Asian, And White Owned Business in the United States
http://slidepdf.com/reader/full/race-and-entrepreneurial-success-black-asian-and-white-owned-business 125/253
Homes provide collateral for business loans, and home equity loans
can provide relatively low-cost financing.3 Thus, lower levels of wealth
can lead to inadequate access to financial capital, which in turn can
both limit business creation and result in undercapitalized businesses.
Family Wealth
Lower levels of parental wealth may also limit access to financial capi-
tal for black entrepreneurs. Black families have less to pass on to their
children through inheritances. This in turn will result in lower wealth
holdings and access to startup capital among the current generation of
blacks. The lower likelihood of receiving inheritances and the smaller
amount of inheritances that are received may also have a direct effecton business success for blacks. The receipt of inheritances among busi-
ness owners is associated with higher survival rates and higher sales
among surviving businesses (Holtz-Eakin, Joulfaian, and Rosen 1994a).
Business owners also turn to family members for loans and equity
financing. Family members may provide business loans with favorable
terms. From the other side, investing in a child’s, sibling’s, or relative’s
business may be an attractive option because of the extra information
and trust.The CBO includes information on whether owners receive personal
loans from family members to finance their business ventures.4 Esti-
mates from our CBO sample indicate that family loans are not a com-
mon source of startup capital among small business owners. Only 6.4
percent of all owners borrowed capital from their family for starting or
acquiring the business. Furthermore, a similar percentage of black and
white owners borrowed from their families. Given that startup capital
levels are lower for black businesses as noted below, this implies that
black owners borrow a smaller total amount from family members
than white owners.
Bates (1997) provides estimates of borrowing startup capital from
family members from the 1987 CBO. Among firms that borrow startup
capital, he finds that 21.2 percent of black firms borrow from family
members and that the average amount borrowed is $18,306. A larger
percentage of white borrowers obtained loans from family members
(26.8 percent) and for a higher average amount ($35,446). However,
for capital needs of established firms, evidence from the SSBF paints adifferent picture. Over 10 percent of firms owned by blacks obtained
loans from family and friends, compared with less than 6 percent of
white-owned businesses (Bitler, Robb, and Wolken 2001).
112 Chapter 4

8/9/2019 Race and Entrepreneurial Success - Black , Asian, And White Owned Business in the United States
http://slidepdf.com/reader/full/race-and-entrepreneurial-success-black-asian-and-white-owned-business 126/253
Lower levels of family wealth among blacks may limit their ability to
obtain sufficient startup capital or ongoing financing. Consequently,
blacks may start fewer businesses, and for those black businesses that
do start, they may be smaller than what would be optimal.5 Thus, ra-
cial differences in family wealth may contribute to racial differences in
business outcomes.
Lending Discrimination
An additional factor that might explain differing rates of startup capital
by race is lending discrimination. Much of the recent research on the
issue of discrimination in business lending uses data from the Survey
of Small Business Finances (SSBF).6 The main findings from this litera-ture are that minority-owned businesses experience higher loan denial
probabilities and pay higher interest rates than white-owned busi-
nesses even after controlling for differences in credit-worthiness and
other factors (Cavalluzzo, Cavalluzzo, and Wolken 2002; Blanchflower,
Levine, and Zimmerman 2003; Coleman 2002, 2003; Blanchard, Yinger,
and Zhao 2004; Cavalluzzo and Wolken 2005; Robb and Fairlie 2006).
Using the 1993 National Survey of Small Business Finances (NSSBF),
Cavalluzzo, Cavalluzzo, and Wolken (2002) find that black businessowners are more likely than whites to have unmet credit needs and
more likely to have been denied credit, even after controlling for many
factors related to creditworthiness. Blanchflower, Levine, and Zimmer-
man (2003), using the 1993 SSBF and 1998 SSBF, find that blacks pay a
higher interest rate on loans obtained. They also find that concerns
over whether a loan application would be denied prevented some pro-
spective borrowers from applying for a loan in the first place. The dis-
parities between the denial rates between whites and blacks are greater
when including these individuals with those that actually applied for a
loan. Bostic and Lampani (1999) include additional geographic controls
but also find a statistically significant difference in approval rates be-
tween blacks and whites.
Using the 1998 SSBF, Cavalluzzo and Wolken (2005) find substan-
tial unexplained differences in loan denial rates between African
American- and white-owned firms. They also find that while greater
personal wealth is associated with a lower probability of denial, a large
difference in denial rates between blacks and whites remains, evenafter controlling for personal wealth. Finally, they find that denial rates
for blacks increase with lender-market concentration, which is con-
sistent with Becker’s (1971/1957) classic theories of discrimination.
Why Are African American-Owned Businesses Less Successful? 113

8/9/2019 Race and Entrepreneurial Success - Black , Asian, And White Owned Business in the United States
http://slidepdf.com/reader/full/race-and-entrepreneurial-success-black-asian-and-white-owned-business 127/253
Cavalluzzo and Wolken (2005) estimate the magnitude of contribu-
tions from group differences in characteristics to racial gaps in loan
denial rates and find that group differences in credit history differences
explain most of the difference in denial rates. When examining specific
loan types, Mitchell and Pearce (2004) find that black firms faced sig-
nificantly greater loan-denial probabilities than white-male-owned
firms on both relationship bank loans and transaction bank loans.
Using the 1998 SSBF, Robb and Fairlie (2006) focus on more estab-
lished businesses—those five years and older. They find that estab-
lished black-owned business are still significantly less likely than
white-owned businesses to be approved for loans, to pay a higher rate
of interest on approved loans, and not to apply for credit when needed because of fear that the loan application would be denied. They also
find that blacks are more likely than whites to be denied trade credit
and to rely on credit cards for borrowing purposes. Older, more-
established black-owned businesses appear to also face significant bar-
riers in accessing financial capital.
Although it is difficult to prove without a doubt that lending dis-
crimination exists, the evidence from the literature is consistent with
the existence of continuing lending discrimination against black-owned firms. Black firms are more likely to be denied loans and pay
higher interest rates and are less likely to borrow from banks for
startup or continuing capital. Lending discrimination may have a di-
rect effect on business outcomes because it limits access to loans that
can help a business ‘‘weather a storm’’ or diversify into new products
or markets.
Although most of the evidence from this literature focuses on exist-
ing black businesses, lending discrimination may also severely limit ac-
cess to startup capital, discouraging would-be minority entrepreneurs
and jeopardizing the scale and longevity of their businesses.
Differential Types of Financing
Black and white entrepreneurs differ in the types of financing they use
for their businesses. Although these differences are likely to be caused
by many factors, they may be partly due to differences in personal
wealth and lending discrimination. Focusing on startup capital differ-
ences, there is evidence of less use of banks by black entrepreneurs forstartup capital. Published estimates from the CBO indicate that only
6.6 percent of black firms received business loans from banking or
commercial lending institutions (see table 4.5). Nearly twice that
114 Chapter 4

8/9/2019 Race and Entrepreneurial Success - Black , Asian, And White Owned Business in the United States
http://slidepdf.com/reader/full/race-and-entrepreneurial-success-black-asian-and-white-owned-business 128/253
Table 4.5
Sources of borrowed and equity capital by race, Characteristics of Business Owners(1992)
Percentage
AllFirms
White-OwnedFirms
Black-OwnedFirms
Sources of borrowed capital for owner:
Personal loan using home mortgage/equity line of credit
5.0% 5.0% 3.5%
Personal credit card 3.0 2.9 3.8
Personal loan from spouse 1.2 1.1 1.5
Personal loan from family 6.1 5.8 4.6
Other personal loan 7.1 7.1 5.6
Sources of nonborrowed capital for owner:
None (100 percent borrowed capital) 6.6 6.8 4.4
Use of owner’s personal/family physical assets(building, motor vehicle, equipment, etc.)
18.5 19.1 14.1
Proceeds from the sale of owner’s personal assets 2.5 2.4 1.7
Owner’s personal/family savings 40.7 40.5 35.1
Other source 3.9 3.7 7.7
Sources of borrowed capital for firm:
Business loan from banking or commercial lendinginstitution
11.7 12.1 6.6
Government-guaranteed business loan from bankingor commercial lending institution
0.4 0.4 0.7
Business loan from federal, state, or local government 0.3 0.3 0.3
Business loan from investment company/profit ornonprofit private source
0.6 0.6 0.5
Business loan from previous owner 1.9 1.9 0.6
Business trade credit from supplier 0.9 0.9 0.6Other business loan 1.6 1.6 0.9
Source: Characteristics of Business Owners (1992) are reported in U.S. Census Bureau(1997).Notes: (1) The sample includes businesses that are classified by the IRS as individual pro-prietorships or self-employed persons, partnerships, and subchapter S corporations andthat have sales of $500 or more. (2) White category is equal to the total minus all minoritygroups. (3) More than one source of capital can be reported for each firm.
Why Are African American-Owned Businesses Less Successful? 115
8/9/2019 Race and Entrepreneurial Success - Black , Asian, And White Owned Business in the United States
http://slidepdf.com/reader/full/race-and-entrepreneurial-success-black-asian-and-white-owned-business 129/253
percentage of white firms received bank loans for startup capital.
Blacks are also less likely to use a home equity line for startup capital
than are whites, which may be partly due to the lower rates of home
ownership reported above. Blacks are also less likely than whites to
use equity or nonborrowed sources of startup capital and to have loans
from other sources (except government-backed loans). On the other
hand, black business owners are more likely to use credit cards for
startup funds than are white business owners.7
In studies using the 1987 CBO, Bates (1997, 2005) conducts a thor-
ough comparison of differences between black and white firms in their
use of startup capital. Bates finds that black firms were more likely to
start with no capital, less likely to borrow startup capital, and morelikely to rely solely on equity capital than white-owned firms. In his
sample of male-owned firms started in the past ten years, he finds that
29 percent of black firms used borrowed funds for startup capital com-
pared with 37 percent of white firms. Focusing on startup funding
from financial institutions, he also finds that black-owned firms receive
less in startup capital from banks on average than white-owned firms.
Among firms borrowing startup capital, he estimates that the average
black firm borrowed $31,958 from financial institutions compared with$56,784 for white firms.
Bates also explores whether disparities in levels of startup capital are
partly due to differences in equity startup capital. He finds that black
firms receive $2.69 per dollar of equity capital invested in loans from
financial institutions. This is lower than the $3.10 per dollar of equity
investment for white firms. After controlling for other owner and busi-
ness characteristics, he finds a roughly similar-sized difference between
black and white debt per equity dollar invested. These differences are
not large, however, suggesting that an important hurdle to obtaining
loans from financial institutions for black entrepreneurs is low levels
of equity financing in addition to differential treatment by financial
institutions (Bates 2005). In fact, from a pooled sample of black and
white firms, Bates (2005) finds that loans received by black firms bor-
rowing startup capital are significantly smaller than those received by
white firms even after controlling for equity capital and owner and
business characteristics such as education and industry. Racial differ-
ences in personal wealth, which are not measured in the CBO, may bea key factor in explaining the remaining black/white differences in
business loans.
116 Chapter 4
8/9/2019 Race and Entrepreneurial Success - Black , Asian, And White Owned Business in the United States
http://slidepdf.com/reader/full/race-and-entrepreneurial-success-black-asian-and-white-owned-business 130/253
For older, more established firms, these racial differences in financ-
ing patterns continue. Using data from the 1998 SSBF, Robb and Fairlie
(2006) find that black firms are less likely than white firms to have
credit lines, equipment loans, business mortgages, motor vehicle loans,
or trade credit. They are also less likely to use business credit cards, use
personal credit cards for business purposes, or hold checking accounts.
In fact, the only types of loans that they hold more frequently than
white firms are capital leases and a catch-all category of ‘‘other’’ loans.
Blacks are more likely than whites to borrow through the use of credit
cards and trade credit (carrying balances on those lines of credit and
paying interest on those balances), which often have higher interest
rates than conventional loans.Overall, these racial differences in types of financing for startup or
continuing capital may be the result of many different factors. For ex-
ample, we cannot rule out the possibility that the lower likelihood of
acquiring capital from financial institutions among black businesses is
due to a lower evaluated probability of success for these businesses.
However, the patterns are consistent with large racial differences in
personal wealth and lending discrimination.
Racial Differences in Startup Capital
Black-owned businesses have very low levels of startup capital relative
to white-owned businesses (figure 4.4). Fewer than 2 percent of black
firms start with $100,000 or more of capital, and 6.5 percent have be-
tween $25,000 and $100,000 in startup capital. Nearly two thirds of
black businesses have less than $5,000 in startup capital. Although a
large percentage of white firms also start with little capital, a higher
percentage of white firms start with large amounts of capital than
black firms.
Racial disparities in startup capital may reflect differences in the
potential success of firms and thus ability to raise capital by firms. In
other words, some black entrepreneurs may have difficulty raising cap-
ital because their businesses are predicted to be less likely to succeed. If
so, banks and other investors will rationally decline to invest in these
businesses. Of course, an alternative explanation is that black business
owners invest less startup capital in their businesses because they have
less access to capital. This may be due to having lower levels of per-sonal and family wealth to borrow against or use as equity financing
but may also be due to lending discrimination. Evidence favoring these
Why Are African American-Owned Businesses Less Successful? 117
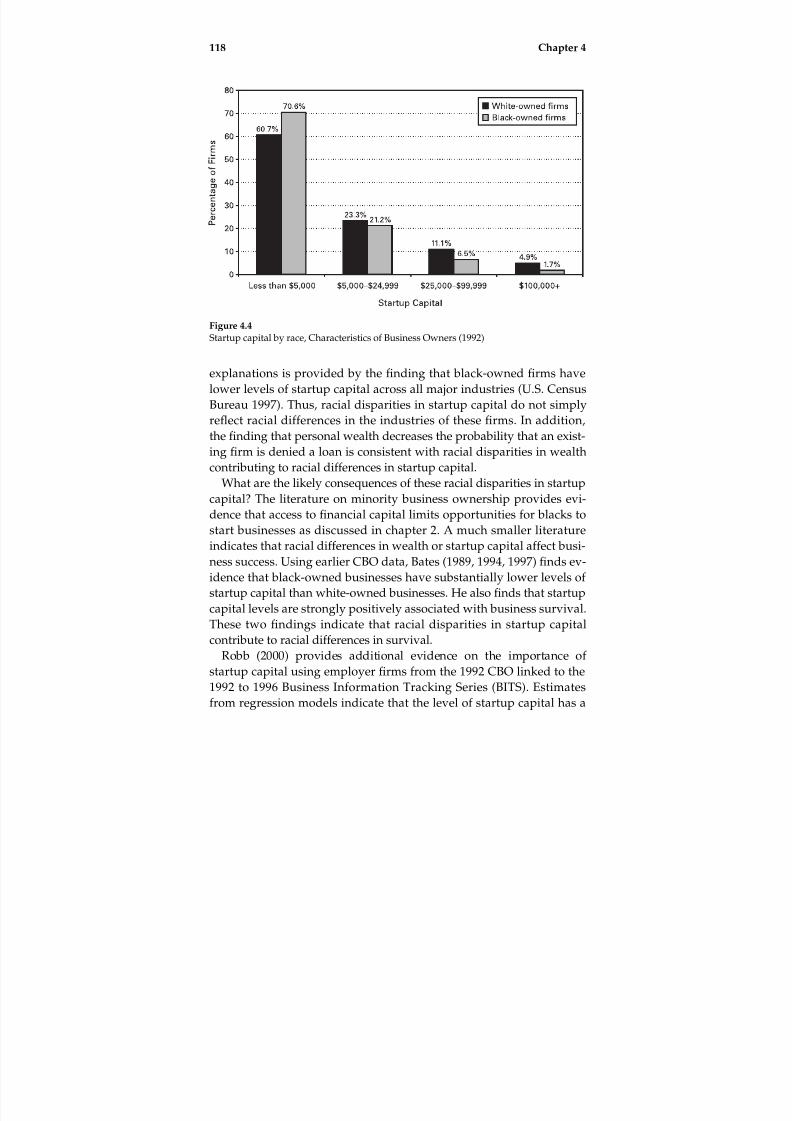
8/9/2019 Race and Entrepreneurial Success - Black , Asian, And White Owned Business in the United States
http://slidepdf.com/reader/full/race-and-entrepreneurial-success-black-asian-and-white-owned-business 131/253
explanations is provided by the finding that black-owned firms have
lower levels of startup capital across all major industries (U.S. CensusBureau 1997). Thus, racial disparities in startup capital do not simply
reflect racial differences in the industries of these firms. In addition,
the finding that personal wealth decreases the probability that an exist-
ing firm is denied a loan is consistent with racial disparities in wealth
contributing to racial differences in startup capital.
What are the likely consequences of these racial disparities in startup
capital? The literature on minority business ownership provides evi-
dence that access to financial capital limits opportunities for blacks to
start businesses as discussed in chapter 2. A much smaller literature
indicates that racial differences in wealth or startup capital affect busi-
ness success. Using earlier CBO data, Bates (1989, 1994, 1997) finds ev-
idence that black-owned businesses have substantially lower levels of
startup capital than white-owned businesses. He also finds that startup
capital levels are strongly positively associated with business survival.
These two findings indicate that racial disparities in startup capital
contribute to racial differences in survival.
Robb (2000) provides additional evidence on the importance of startup capital using employer firms from the 1992 CBO linked to the
1992 to 1996 Business Information Tracking Series (BITS). Estimates
from regression models indicate that the level of startup capital has a
Figure 4.4
Startup capital by race, Characteristics of Business Owners (1992)
118 Chapter 4

8/9/2019 Race and Entrepreneurial Success - Black , Asian, And White Owned Business in the United States
http://slidepdf.com/reader/full/race-and-entrepreneurial-success-black-asian-and-white-owned-business 132/253
negative and statistically significant effect on the probability of busi-
ness closure. Black-employer firms are also found to have substantially
lower levels of startup capital than white-employer firms. Thus, racial
disparities in the amount of capital used to start the business result
in higher closure rates among black-employer firms relative to white-
employer firms.
Our estimates also indicate that racial disparities in startup capital
contribute to worse outcomes among black-owned businesses. In the
multivariate regressions reported in chapter 3, we find a strong posi-
tive relationship between startup capital and business success. Higher
levels of startup capital are associated with lower closure probabilities,
higher profits, more employment, and higher sales. In addition, esti-mates from the 1992 CBO indicate that blacks have substantially lower
levels of startup capital. Thus, black/white differences in startup capi-
tal appear to contribute to racial disparities in business outcomes.
What we do not know from these findings, however, is how much
these racial differences in startup capital contribute to differences in
business outcomes relative to racial differences in other factors such as
education, business human capital, and family-business backgrounds.
Using individual-level data, Fairlie (1999, 2006) provides some evi-dence on this question. Focusing on the causes of the higher annual
rate of exit from self-employment for blacks than whites, estimates
from the CPS indicate that racial differences in personal wealth ex-
plain 7.3 percent of the gap. Estimates from the PSID indicate that
1.8 to 11.1 percent of the male black/white gap in exit rates from self-
employment is explained by differences in asset levels. The use of
individual-level data, the focus on transitions out of self-employment,
and the inclusion of personal wealth, however, make it difficult to
draw conclusions about whether racial disparities in access to startup
capital contribute to racial differences in business outcomes. The
decompositions estimated below provide evidence on the relative im-
portance of racial differences in startup capital to racial disparities in
business outcomes.
Industry Differences
Racial differences in industry distributions may also contribute to dif-ferences between blacks and whites in small business outcomes. Some
industries, most notably retail and services, have higher business turn-
over rates than others (Robb 2000; Reynolds and White 1997). Those
Why Are African American-Owned Businesses Less Successful? 119

8/9/2019 Race and Entrepreneurial Success - Black , Asian, And White Owned Business in the United States
http://slidepdf.com/reader/full/race-and-entrepreneurial-success-black-asian-and-white-owned-business 133/253
with higher capital requirements for entry, such as manufacturing and
wholesale, typically have lower turnover rates. Estimates from the
CBO reported in chapter 3 indicate differences in business outcomes
across industries, although the differences are somewhat mixed in the
regression models that control for other owner and firm characteristics.
One consistent result, however, is that firms in personal services have
worse outcomes.
Black and white firms concentrate in different industries. Table 4.6reports estimates of industry distributions by race from CBO micro-
data. Black firms are underrepresented in construction, manufacturing,
wholesale trade, agricultural services and finance, insurance, and real
estate relative to white firms. Black firms are more concentrated in
transportation, communications and public utilities, and personal ser-
vices than white firms. These industries generally have worse business
outcomes than the previous industries, but as noted above the regres-
sion results provide mixed evidence on which industries are associatedwith worse outcomes.
Black and white firms may concentrate in different industries for
several reasons. First, capital constraints may limit which industries an
Table 4.6
Industry distribution by race, Characteristics of Business Owners (1992)
White-
OwnedFirms
Black-
OwnedFirms
Agricultural services 2.7% 1.7%
Construction 12.5% 7.1%
Manufacturing 3.4% 1.7%
Wholesale trade 3.6% 1.1%
Retail trade 14.7% 14.5%
Finance, insurance, and real estate 10.1% 6.1%
Transportation, communications, and public utilities 3.9% 8.5%
Personal services 25.9% 32.8%
Professional services 19.3% 20.8%
Uncoded industry 3.9% 5.7%
Sample size 15,872 7,565
Notes: (1) The sample includes businesses that are classified by the IRS as individual pro-prietorships or self-employed persons, partnerships, and subchapter S corporations, havesales of $500 or more, and have at least one owner who worked at least twelve weeksand ten hours per week in the business. (2) All estimates are calculated using sampleweights provided by the Characteristics of Business Owners.
120 Chapter 4

8/9/2019 Race and Entrepreneurial Success - Black , Asian, And White Owned Business in the United States
http://slidepdf.com/reader/full/race-and-entrepreneurial-success-black-asian-and-white-owned-business 134/253
individual can enter due to higher capital requirements of certain
industries (Bates 1997). In addition, industry choice may be con-
strained due to a lack of relevant skills and discrimination (Boden
1996; Boden and Nucci 2002; Robb 2000). Discrimination may occur
directly in self-employment through limited opportunities to penetrate
networks, such as those in construction (Bates 1993a; Feagin and Imani
1994; Bates and Howell 1997). While differences in entrepreneurial
ability may lead to different choices of industries, differences in indus-
try concentrations may simply reflect differences in preferences.
Overall, the estimates presented here suggest that black/white dif-
ferences in industry distributions may contribute to racial differences
in business outcomes. However, these industry differences may resultfrom different constraints, preferences or abilities, which affect the in-
terpretation of our results. A concern is that industry choice may sim-
ply be a measure of business success, implying that black firms have
limited entry into certain industries because they are less successful
and not because the industry concentration of black firms leads to less
success.
Identifying the Causes of Black/White Differences in BusinessOutcomes
The estimates reported above indicate that black business owners have
less family-business experience, lower levels of education, and lower
levels of startup capital than white business owners and differ along
several additional dimensions. These owner and firm characteristics
are important determinants of small business outcomes. Taken to-
gether, these results suggest that racial differences in family-business
background, education, and startup capital contribute to why black-
owned businesses have worse outcomes on average than white-owned
businesses. The impact of each factor, however, is difficult to summa-
rize. In particular, we want to identify the separate contributions from
racial differences in the variables included in the regressions.
The most common approach used to quantify these contributions
is the technique of decomposing racial differences in mean levels of
an outcome into those due to different observable characteristics or
‘‘endowments’’ between racial groups and those due to different effectsof characteristics or ‘‘coefficients’’ of groups. The technique is com-
monly attributed to Blinder (1973) and Oaxaca (1973). The Blinder-
Oaxaca decomposition technique is especially useful for identifying
Why Are African American-Owned Businesses Less Successful? 121

8/9/2019 Race and Entrepreneurial Success - Black , Asian, And White Owned Business in the United States
http://slidepdf.com/reader/full/race-and-entrepreneurial-success-black-asian-and-white-owned-business 135/253
and quantifying the separate contributions of group differences in mea-
surable characteristics, such as education, experience, and geographical
location, to racial gaps in outcomes. The technique is easy to apply and
requires only coefficient estimates from linear regressions for the out-
come of interest and sample means of the independent variables used
in the regressions. We use this technique for the log sales specification,
which is estimated using a linear regression.
The Blinder-Oaxaca technique, however, cannot be used without
modification to decompose racial differences in the three other
outcomes—closure, profits, and employment. This is because each of
these business outcomes is binary (they take on the values of either 0
or 1), and their specifications are estimated with logit regressions in-stead of linear regressions. Instead, we use a decomposition technique
that takes into account the nonlinearity of the logit regressions used to
estimate the other outcomes. This technique is described in the appen-
dix to this chapter and Fairlie (1999, 2005) in more detail.
Table 4.7 reports estimates from this procedure for decomposing the
black/white gaps in small business outcomes (see also Fairlie and
Robb 2007). We first discuss the results for the more simplified model
that does not include startup capital or industry. The underlying re-gression estimates are taken from table 3.5, and the means for black
and white firms are reported in table 4.A. The separate contributions
from racial differences in each set of independent variables are
reported. As noted above, the black/white gaps in small business out-
comes are large. Black firms are more likely to close and have lower
profits, employment, and sales than white firms. Racial differences in
the male/female ownership of the firm contribute significantly to the
gaps in small business outcomes. The large contributions are the result
of a higher percentage of black-owned firms than white-owned firms
also being female-owned and of female-owned firms having lower
business outcomes than male-owned businesses, on average. Similar
to the previous chapter, we calculate separate decompositions by gen-
der and discuss the results below.
Lower marriage rates among blacks also contribute to the black/
white gaps in small business outcomes. Sixty-eight percent of black
owners are married compared with 77 percent of white owners.
Spousal income may act as a buffer against downturns in sales for the business and allow the owner to stay in business longer.
Although racial disparities in education are smaller for business
owners than for the general population, low levels of education among
122 Chapter 4

8/9/2019 Race and Entrepreneurial Success - Black , Asian, And White Owned Business in the United States
http://slidepdf.com/reader/full/race-and-entrepreneurial-success-black-asian-and-white-owned-business 136/253
Table 4.7
Decompositions of black/white gaps in small business outcomes, Characteristics of Busi-ness Owners (1992)
Specification
(1) (2) (3) (4)
Dependent variable Closure Profits Employer Ln Sales
Black mean 0.2696 0.1410 0.1121 9.4241
White mean 0.2282 0.3004 0.2067 10.0680
Black/white gap 0.0414 0.1594 0.0946 0.6439
Contributions from racial differences in:
Sex 0.0032
7.7%
0.0253
15.9%
0.0083
8.8%
0.0689
10.7%Marital status 0.0037
8.9%0.00442.8%
0.00424.4%
0.01662.6%
Education 0.00276.5%
0.00563.5%
0.00232.4%
0.01562.4%
Region 0.00338.0%
0.00322.0%
0.00505.3%
0.01392.2%
Urban 0.00266.3%
0.00603.8%
0.00515.4%
0.01542.4%
Prior work experience 0.0011
2.7%
0.0017
1.1%
0.0008
0.8%
0.0011
0.2%Prior work experience in a managerialcapacity
0.006114.7%
0.00161.0%
0.00424.4%
0.01782.8%
Prior work experience in a similar business
0.00256.0%
0.00362.3%
0.00171.8%
0.02774.3%
Have a self-employed family member 0.00378.9%
0.00171.1%
0.00040.4%
0.00701.1%
Prior work experience in a familymember’s business
0.004811.6%
0.00271.7%
0.00535.6%
0.04126.4%
Inherited business 0.0002
0.5%
0.0005
0.3%
0.0002
0.2%
0.0021
0.3%
All included variables 0.020048.3%
0.040925.7%
0.025126.5%
0.191029.7%
Notes: (1) The samples and regression specifications are the same as those used in table3.5. (2) Contribution estimates are mean values of the decomposition using 1,000 sub-samples of whites. See text for more details.
Why Are African American-Owned Businesses Less Successful? 123
8/9/2019 Race and Entrepreneurial Success - Black , Asian, And White Owned Business in the United States
http://slidepdf.com/reader/full/race-and-entrepreneurial-success-black-asian-and-white-owned-business 137/253
black business owners relative to white business owners appear to
have a negative effect on business outcomes. As noted above, the dif-
ferences are large. For example, 27 percent of black business owners
have a college education compared with 33 percent of white business
owners. These educational differences, however, do not translate into
very large effects: racial differences in the education level of the owner
explain from 2.4 to 6.5 percent of the black/white gaps in business out-
comes. Black business owners are less educated on average than are
white business owners, but these educational differences do not appear
to be an extremely large hindrance to operating successful businesses.
Although black-owned businesses have a different regional distribu-
tion and are more likely to be located in urban areas than are white-owned businesses, racial differences in geographical locations do not
appear to contribute substantially to the gaps in small business out-
comes. Racial differences in the amount of prior work experience and
management experience have either small effects or mixed effects on
gaps in the different business outcomes.
As reported in table 4.1, black business owners are much less likely
to have a self-employed family member than are white business own-
ers. This difference, however, does not contribute to racial disparitiesin profits, employment, and sales. The only exception is that racial dif-
ferences in having a self-employed family member explain about 9 per-
cent of the black/white gap in closure rates. The contribution of group
differences in parental self-employment to racial differences in small
business outcomes appears to be smaller than the contribution to rates
of self-employment and entry into self-employment. Estimates from
the PSID indicate that racial differences in the probability of having a
self-employed father explain 8 to 14 percent of the black/white gap in
the entry rate into self-employment and 4 to 6 percent of the gap in the
self-employment rate (Fairlie 1999).
The explanatory power of racial differences in prior work experience
in a family member’s business is stronger. With the exception of the
profits specification, racial differences in this variable explain 5.6 to
11.6 percent of the black/white gaps in small business outcomes. Ap-
parently, the lack of work experience in family businesses among fu-
ture black business owners, perhaps by restricting their acquisition of
general and specific business human capital, limits the successfulnessof their businesses relative to whites.
Racial differences in prior work experience in a business providing
similar goods and services consistently explain a small part of the gaps
124 Chapter 4

8/9/2019 Race and Entrepreneurial Success - Black , Asian, And White Owned Business in the United States
http://slidepdf.com/reader/full/race-and-entrepreneurial-success-black-asian-and-white-owned-business 138/253
in outcomes. Although the coefficient estimates in the small business
outcome regressions are generally similar in magnitude to coefficient
estimates on the family-business work-experience variable, the contri-
butions from racial differences are somewhat smaller. The racial dis-
parity in the percentage of owners who worked in a family member’s
business is larger than the disparity in the percentage of owners who
worked in a business with similar goods and services. Black owners
appear to acquire less specific business human capital from working in
similar business prior to starting their own businesses.
Black-owned businesses are less likely to be inherited than white-
owned businesses, and inherited businesses are generally more suc-
cessful than noninherited businesses, but racial differences in businessinheritances explain virtually none of the gaps in small business out-
comes. The overall likelihood of business inheritances (1.6 percent) is
too small to play a major role in explaining racial differences in busi-
ness outcomes.
This finding is interesting in light of the finding in the literature that
blacks are less likely to receive inheritances and typically receive much
smaller inheritances than whites. As noted above, there is recent evi-
dence suggesting that the lack of inheritances among blacks is animportant factor explaining why blacks have asset levels that are sub-
stantially lower than white levels (Menchik and Jianakoplos 1997;
Gittleman and Wolff 2000; Avery and Rendall 1997, 2002). Further-
more, the receipt of inheritances is a major determinant of starting and
remaining in business (Holtz-Eakin, Joulfaian, and Rosen 1994a, 1994b;
Blanchflower and Oswald 1998), suggesting that lower levels of inheri-
tances among blacks contribute to lower rates of business ownership.
With regard to business inheritances, however, they are apparently
not very important in explaining differences in business outcomes.
Differences between Male and Female Business Owners
We also investigate whether the causes of racial differences in business
outcomes are similar for male- and female-owned businesses. As noted
in chapter 3, male firms tend to have lower closure rates, higher profit
rates, higher employer rates, and more sales than female firms. In
terms of owner characteristics, however, there are many similarities between the sexes. We also found that estimates from separate sets
of business outcome regressions that the determinants of business
outcomes do not differ substantially between men and women. The
Why Are African American-Owned Businesses Less Successful? 125

8/9/2019 Race and Entrepreneurial Success - Black , Asian, And White Owned Business in the United States
http://slidepdf.com/reader/full/race-and-entrepreneurial-success-black-asian-and-white-owned-business 139/253
remaining question then is whether the explanations for black/white
disparities in business outcomes differ between male- and female-
owned businesses.
Tables 4.8 and 4.9 report estimates from separate decompositions for
racial differences in business outcomes for men and women, respec-
tively. Mean characteristics are reported in table 4.10. Estimates from
the CBO indicate that black firms have higher closure rates, have lower
profits, are less likely to have employees, and have lower sales than
white firms for both male- and female-owned businesses. These dispar-
ities in outcomes are large for both sexes.
Turning to the explanatory factors, we find that lower levels of edu-
cation among blacks explain part of the gaps in business outcomesfor men but not for women. In contrast, estimates from the decom-
positions indicate roughly similar patterns for the family-business-
background variables. Racial differences in having a self-employed
family member explain very little of the gaps in business outcomes,
whereas having prior work experience in a family member’s business
explains part of the gaps. Racial differences in business inheritances ex-
plain virtually none of the gap for either men or women.
For additional explanatory factors, we find that racial differences inmanagement experience continue to have inconsistent explanatory
power across specifications. Racial differences in prior work experience
in similar businesses contribute to the black/white gaps in business
outcomes for men but not to the gaps for women. Racial differences in
marital status explain a much larger portion of the disparities in busi-
ness outcomes for women than for men. Black female business owners
are less likely to be married than are white female business owners,
and this marital status is associated with better business outcomes.
The contribution estimates from racial differences in region and urban
status are similarly inconsistent across specifications.
Overall, the decompositions indicate some differences in the results
for men and women, but the main findings for the family-business-
background variables are similar. Racial differences in prior work
experience in family businesses explain part of the gaps in business
outcomes, whereas racial differences in having self-employed family
members and business inheritances have little explanatory power. We
continue to group men and women in the remaining analyses. A moreextensive analysis of these patterns, however, is beyond the scope of
the current analysis.
126 Chapter 4

8/9/2019 Race and Entrepreneurial Success - Black , Asian, And White Owned Business in the United States
http://slidepdf.com/reader/full/race-and-entrepreneurial-success-black-asian-and-white-owned-business 140/253
Table 4.8
Decompositions of black/white gaps in small business outcomes for men, Characteristicsof Business Owners (1992)
Specification
(1) (2) (3) (4)
Dependent variable Closure Profits Employer Ln Sales
Black mean 0.2496 0.1902 0.1310 9.6709
White mean 0.2189 0.3661 0.2311 10.3259
Black/white gap 0.0306 0.1759 0.1001 0.6550
Contributions from racial differences in:
Marital status 0.0005
1.7%
0.0007
0.4%
0.0004
0.4%
0.0034
0.5%Education 0.0065
21.1%0.00864.9%
0.00383.8%
0.03154.8%
Region 0.00093.0%
0.00201.1%
0.00242.4%
0.02654.1%
Urban 0.003210.5%
0.00673.8%
0.00595.9%
0.01412.1%
Prior work experience 0.00000.0%
0.00341.9%
0.00050.5%
0.00230.4%
Prior work experience in a managerial
capacity
0.0094
30.7%
0.0023
1.3%
0.0047
4.7%
0.0206
3.2%Prior work experience in a similar
business0.004013.2%
0.00673.8%
0.00222.2%
0.03555.4%
Have a self-employed family member 0.00020.7%
0.00171.0%
0.00010.1%
0.01131.7%
Prior work experience in a familymember’s business
0.005718.5%
0.00160.9%
0.00525.2%
0.04166.4%
Inherited business 0.00030.8%
0.00060.4%
0.00141.4%
0.00570.9%
All included variables 0.0119
38.8%
0.0142
8.1%
0.0206
20.5%
0.1304
19.9%
Notes: (1) The samples and regression specifications are the same as those used in table3.8. (2) Contribution estimates are mean values of the decomposition using 1,000 sub-samples of whites. See the text for more details.
Why Are African American-Owned Businesses Less Successful? 127

8/9/2019 Race and Entrepreneurial Success - Black , Asian, And White Owned Business in the United States
http://slidepdf.com/reader/full/race-and-entrepreneurial-success-black-asian-and-white-owned-business 141/253
Table 4.9
Decompositions of black/white gaps in small business outcomes for women, Character-istics of Business Owners (1992)
Specification
(1) (2) (3) (4)
Dependent variable Closure Profits Employer Ln Sales
Black mean 0.2968 0.0767 0.0865 9.0901
White mean 0.2475 0.1693 0.1563 9.5221
Black/white gap 0.0494 0.0926 0.0697 0.4321
Contributions from racial differences in:
Marital status 0.0120
24.2%
0.0061
6.6%
0.0091
13.0%
0.0364
8.4%Education 0.0048
9.8%0.00242.6%
0.00010.2%
0.01834.2%
Region 0.007014.1%
0.00384.1%
0.00071.0%
0.00400.9%
Urban 0.00010.2%
0.00545.8%
0.00304.3%
0.01894.4%
Prior work experience 0.00163.2%
0.00161.7%
0.00223.2%
0.00471.1%
Prior work experience in a managerial
capacity
0.0012
2.5%
0.0007
0.7%
0.0046
6.6%
0.0103
2.4%Prior work experience in a similar
business0.0002
0.5%0.00030.4%
0.00020.2%
0.00781.8%
Have a self-employed family member 0.012224.6%
0.00252.7%
0.00101.4%
0.00050.1%
Prior work experience in a familymember’s business
0.00030.7%
0.00454.8%
0.00507.2%
0.03538.2%
Inherited business 0.00061.2%
0.00020.2%
0.00172.4%
0.00501.2%
All included variables 0.0222
44.9%
0.0128
13.9%
0.0171
24.6%
0.0752
17.4%
Notes: (1) The samples and regression specifications are the same as those used in table3.9. (2) Contribution estimates are mean values of the decomposition using 1,000 sub-samples of whites. See the text for more details.
128 Chapter 4
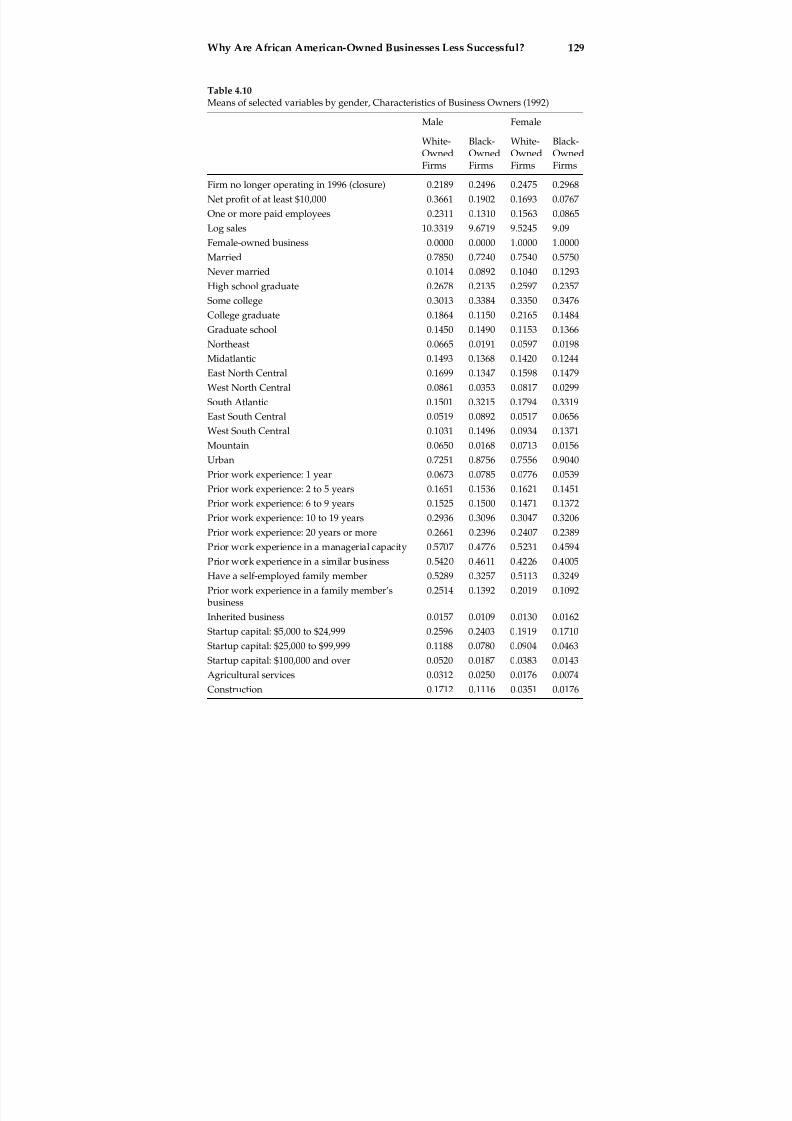
8/9/2019 Race and Entrepreneurial Success - Black , Asian, And White Owned Business in the United States
http://slidepdf.com/reader/full/race-and-entrepreneurial-success-black-asian-and-white-owned-business 142/253
Table 4.10
Means of selected variables by gender, Characteristics of Business Owners (1992)
Male Female
White-OwnedFirms
Black-OwnedFirms
White-OwnedFirms
Black-OwnedFirms
Firm no longer operating in 1996 (closure) 0.2189 0.2496 0.2475 0.2968
Net profit of at least $10,000 0.3661 0.1902 0.1693 0.0767
One or more paid employees 0.2311 0.1310 0.1563 0.0865
Log sales 10.3319 9.6719 9.5245 9.09
Female-owned business 0.0000 0.0000 1.0000 1.0000
Married 0.7850 0.7240 0.7540 0.5750Never married 0.1014 0.0892 0.1040 0.1293
High school graduate 0.2678 0.2135 0.2597 0.2357
Some college 0.3013 0.3384 0.3350 0.3476
College graduate 0.1864 0.1150 0.2165 0.1484
Graduate school 0.1450 0.1490 0.1153 0.1366
Northeast 0.0665 0.0191 0.0597 0.0198
Midatlantic 0.1493 0.1368 0.1420 0.1244
East North Central 0.1699 0.1347 0.1598 0.1479
West North Central 0.0861 0.0353 0.0817 0.0299South Atlantic 0.1501 0.3215 0.1794 0.3319
East South Central 0.0519 0.0892 0.0517 0.0656
West South Central 0.1031 0.1496 0.0934 0.1371
Mountain 0.0650 0.0168 0.0713 0.0156
Urban 0.7251 0.8756 0.7556 0.9040
Prior work experience: 1 year 0.0673 0.0785 0.0776 0.0539
Prior work experience: 2 to 5 years 0.1651 0.1536 0.1621 0.1451
Prior work experience: 6 to 9 years 0.1525 0.1500 0.1471 0.1372
Prior work experience: 10 to 19 years 0.2936 0.3096 0.3047 0.3206Prior work experience: 20 years or more 0.2661 0.2396 0.2407 0.2389
Prior work experience in a managerial capacity 0.5707 0.4776 0.5231 0.4594
Prior work experience in a similar business 0.5420 0.4611 0.4226 0.4005
Have a self-employed family member 0.5289 0.3257 0.5113 0.3249
Prior work experience in a family member’s business
0.2514 0.1392 0.2019 0.1092
Inherited business 0.0157 0.0109 0.0130 0.0162
Startup capital: $5,000 to $24,999 0.2596 0.2403 0.1919 0.1710
Startup capital: $25,000 to $99,999 0.1188 0.0780 0.0904 0.0463
Startup capital: $100,000 and over 0.0520 0.0187 0.0383 0.0143
Agricultural services 0.0312 0.0250 0.0176 0.0074
Construction 0.1712 0.1116 0.0351 0.0176
Why Are African American-Owned Businesses Less Successful? 129

8/9/2019 Race and Entrepreneurial Success - Black , Asian, And White Owned Business in the United States
http://slidepdf.com/reader/full/race-and-entrepreneurial-success-black-asian-and-white-owned-business 143/253
Contributions from Startup Capital and Industry Differences
Table 4.11 reports the results of decompositions that include startup
capital and industry. We exclude these variables from the first set of
decompositions because of concerns over endogeneity as discussed in
chapter 3. The regression estimates are taken from table 3.14.
Black-owned firms clearly have less startup capital than white-
owned firms. For example, 8 percent of black-owned businesses had at
least $25,000 in startup capital compared with nearly 16 percent of
white-owned businesses. These racial differences in startup capital ex-
plain a substantial portion of the black/white gaps in small business
outcomes. The contribution estimates range from 14.5 to 43.2 percent
for the different outcomes. Clearly, lower levels of startup capital
among black-owned firms are associated with less successful busi-
nesses. These lower levels of startup capital are likely to be related to
difficulty in obtaining funding because of low levels of personal wealth
and possibly lending discrimination. Black levels of wealth are one
eleventh white levels. The result is that black/white differences instartup capital are the single most important factor in explaining racial
differences in business outcomes.
Black-owned businesses appear to be overrepresented in less suc-
cessful industries relative to white-owned businesses. Racial differences
Table 4.10
(continued)
Male Female
White-OwnedFirms
Black-OwnedFirms
White-OwnedFirms
Black-OwnedFirms
Manufacturing 0.0352 0.0189 0.0281 0.0142
Wholesale 0.0388 0.0132 0.0302 0.0087
FIRE 0.0949 0.0598 0.1097 0.0616
Trans., communications, and public utilities 0.0459 0.1229 0.0240 0.0309
Personal services 0.2367 0.3287 0.3071 0.3280
Professional services 0.1771 0.1541 0.2269 0.2767Uncoded industry 0.0407 0.0575 0.0364 0.0569
Sample size 7,425 4,588 6,857 2,243
Notes: (1) The sample includes businesses that are classified by the IRS as individual pro-prietorships or self-employed persons, partnerships, and subchapter S corporations, havesales of $500 or more, and have at least one owner who worked at least twelve weeksand ten hours per week in the business. (2) All estimates are calculated using sampleweights provided by the CBO.
130 Chapter 4

8/9/2019 Race and Entrepreneurial Success - Black , Asian, And White Owned Business in the United States
http://slidepdf.com/reader/full/race-and-entrepreneurial-success-black-asian-and-white-owned-business 144/253
Table 4.11
Decompositions of black/white gaps in small business outcomes, Characteristics of Busi-ness Owners (1992)
Specification
(1) (2) (3) (4)
Dependent variable Closure Profits Employer Ln Sales
Black mean 0.2692 0.1414 0.1116 9.4221
White mean 0.2288 0.3003 0.2065 10.0615
Black/white gap 0.0404 0.1590 0.0948 0.6394
Contributions from racial differences in:
Sex 0.0019
4.7%
0.0231
14.6%
0.0060
6.3%
0.0562
8.8%Marital status 0.0030
7.5%0.00553.5%
0.00414.3%
0.01181.8%
Education 0.00317.8%
0.00452.8%
0.00131.4%
0.00661.0%
Region 0.00317.6%
0.00352.2%
0.00101.0%
0.01602.5%
Urban 0.00122.9%
0.00784.9%
0.00212.2%
0.02774.3%
Prior work experience 0.0014
3.5%
0.0021
1.3%
0.0010
1.1%
0.0032
0.5%Prior work experience in a managerialcapacity
0.006516.1%
0.00050.3%
0.00181.9%
0.00350.5%
Prior work experience in a similar business 0.00297.1%
0.00422.6%
0.00222.3%
0.02774.3%
Have a self-employed family member 0.00327.8%
0.00010.0%
0.00091.0%
0.01282.0%
Prior work experience in a family member’s business
0.00327.9%
0.00191.2%
0.00333.4%
0.02463.8%
Inherited business 0.0001
0.1%
0.0005
0.3%
0.0000
0.0%
0.0007
0.1%
Startup capital 0.017543.2%
0.023114.5%
0.035036.9%
0.151223.6%
Industry 0.008320.5%
0.01127.0%
0.00929.7%
0.06339.9%
All included variables 0.039597.7%
0.068342.9%
0.065869.4%
0.317949.7%
Notes: (1) The sample and regression specifications are the same as those used in table3.14. (2) Contribution estimates are mean values of the decomposition using 1,000 sub-
samples of whites. See the text for more details.
Why Are African American-Owned Businesses Less Successful? 131
8/9/2019 Race and Entrepreneurial Success - Black , Asian, And White Owned Business in the United States
http://slidepdf.com/reader/full/race-and-entrepreneurial-success-black-asian-and-white-owned-business 145/253
in industry composition explain from 7.0 to 20.5 percent of the black/
white gaps in small business outcomes. In particular, black-owned
firms are more likely to be located in personal services, which have
worse outcomes on average than other industries. These findings are
consistent with Robb (2000). The results are difficult to interpret, how-
ever, because of the joint decision between business ownership and
industry.
Overall, racial differences in the explanatory variables explain a large
percentage of the total black/white gaps in small business outcomes.
They explain nearly 50 percent of the racial gap in profits and employ-
ment and nearly 70 percent of the total gap in log sales. Nearly 100 per-
cent of the black/white gap in business closure rates is explained byracial differences in the explanatory variables. Although we employed
relatively parsimonious specifications focusing on well measured and
less endogenous owner and firm characteristics, our models performed
quite well in explaining racial disparities in business outcomes. These
factors are likely to be several of the most important inputs into the
production process of the firm.
Although the decompositions explain most of the black/white gaps
in business outcomes, it is useful to consider the remaining or ‘‘unex-plained’’ portion of the gaps. The ‘‘unexplained’’ portion of the racial
gaps may be due to lending discrimination and consumer discrimina-
tion against black-owned firms, the omission of important unmeasur-
able factors such as risk aversion, or the inability to accurately measure
racial differences in access to capital. We now briefly discuss some of
these factors.
Other Potential Explanations: Consumer Discrimination
Although the decomposition technique reveals several explanations for
black/white differences in business outcomes, we discuss a few addi-
tional explanations, which are difficult to identify using the technique
or cannot be measured with the CBO. One potential explanation for
the remaining racial differences in business outcomes is consumer dis-
crimination against black-owned firms. Black firms may have difficulty
selling certain products and services to nonblack customers limiting
the size of their markets and resulting success. Discriminating custom-ers could be individuals, other firms or the government. Using micro-
data from the 1980 Census, Borjas and Bronars (1989) explore whether
the large variance in self-employment rates across racial groups are
132 Chapter 4
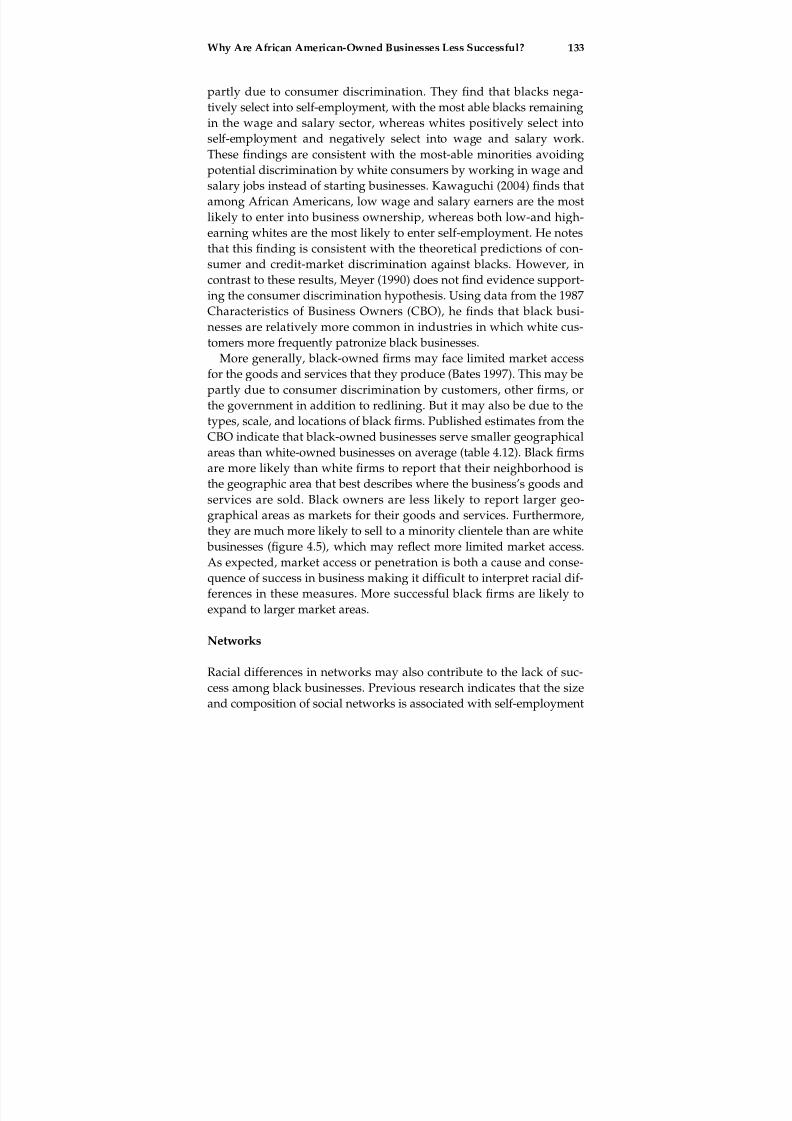
8/9/2019 Race and Entrepreneurial Success - Black , Asian, And White Owned Business in the United States
http://slidepdf.com/reader/full/race-and-entrepreneurial-success-black-asian-and-white-owned-business 146/253
partly due to consumer discrimination. They find that blacks nega-
tively select into self-employment, with the most able blacks remaining
in the wage and salary sector, whereas whites positively select into
self-employment and negatively select into wage and salary work.
These findings are consistent with the most-able minorities avoiding
potential discrimination by white consumers by working in wage and
salary jobs instead of starting businesses. Kawaguchi (2004) finds that
among African Americans, low wage and salary earners are the most
likely to enter into business ownership, whereas both low-and high-
earning whites are the most likely to enter self-employment. He notes
that this finding is consistent with the theoretical predictions of con-
sumer and credit-market discrimination against blacks. However, incontrast to these results, Meyer (1990) does not find evidence support-
ing the consumer discrimination hypothesis. Using data from the 1987
Characteristics of Business Owners (CBO), he finds that black busi-
nesses are relatively more common in industries in which white cus-
tomers more frequently patronize black businesses.
More generally, black-owned firms may face limited market access
for the goods and services that they produce (Bates 1997). This may be
partly due to consumer discrimination by customers, other firms, orthe government in addition to redlining. But it may also be due to the
types, scale, and locations of black firms. Published estimates from the
CBO indicate that black-owned businesses serve smaller geographical
areas than white-owned businesses on average (table 4.12). Black firms
are more likely than white firms to report that their neighborhood is
the geographic area that best describes where the business’s goods and
services are sold. Black owners are less likely to report larger geo-
graphical areas as markets for their goods and services. Furthermore,
they are much more likely to sell to a minority clientele than are white
businesses (figure 4.5), which may reflect more limited market access.
As expected, market access or penetration is both a cause and conse-
quence of success in business making it difficult to interpret racial dif-
ferences in these measures. More successful black firms are likely to
expand to larger market areas.
Networks
Racial differences in networks may also contribute to the lack of suc-
cess among black businesses. Previous research indicates that the size
and composition of social networks is associated with self-employment
Why Are African American-Owned Businesses Less Successful? 133

8/9/2019 Race and Entrepreneurial Success - Black , Asian, And White Owned Business in the United States
http://slidepdf.com/reader/full/race-and-entrepreneurial-success-black-asian-and-white-owned-business 147/253
Table 4.12
Market area of small businesses by race, Characteristics of Business Owners (1992)
Percentage
AllFirms
White-OwnedFirms
Black-OwnedFirms
Geographic area that best describes marketplace:
Neighborhood 32.8% 31.6% 45.2%
City/county 53.8 54.1 51.9
Regional (adjoining counties or states) 24.5 25.7 14.7
National 6.8 7.0 4.7
International 2.0 1.8 1.3Source: Characteristics of Business Owners (1992) as reported in U.S. Census Bureau(1997).Notes: (1) The sample includes businesses that are classified by the IRS as individual pro-prietorships or self-employed persons, partnerships, and subchapter S corporations andthat have sales of $500 or more. (2) White category is equal to the total minus all minoritygroups.
Figure 4.5
Minority customers served by the business ( percentage), Characteristics of BusinessOwners (1992)
134 Chapter 4

8/9/2019 Race and Entrepreneurial Success - Black , Asian, And White Owned Business in the United States
http://slidepdf.com/reader/full/race-and-entrepreneurial-success-black-asian-and-white-owned-business 148/253
(Allen 2000) and that having close friends and neighbors in business
and being a member of a business network are positively associated
with outcomes among nascent entrepreneurs (Davidsson and Honig
2002). If minority firms have limited access to business, social, or fam-
ily networks or have smaller networks then they may be less likely to
enter business and create successful businesses. These networks may
be especially important in providing financing, customers, technical as-
sistance, role models, and contracts.8 These same networks, however,
are likely to also be useful for finding employment in the wage and
salary sector creating a dampening effect on self-employment.
In an earlier study, Fratoe (1988) finds that black business owners
are less likely to have business role models, obtain loans from otherfamily members, and use family members as unpaid labor. Social net-
works may be especially important in industries such as construction,
where deals are often made in informal settings (Feagin and Imani
1994). If minorities are blocked from these industries perhaps due to
discrimination, then their business networks may be restricted (Bates
1993b; Feagin and Imani 1994; Bates and Howell 1997). Examining the
retail industry in New York, Rauch (2001) finds evidence that African
American businesses were less able to organize ‘‘mutual self-help’’than immigrant businesses.
Ethnic and racial groups may differ not only in the size of their net-
works but also in their ability to transfer information related to run-
ning a business among coethnics. There is evidence that experience as
an employee of a small business and transfers of information are im-
portant (Meyer 1990). Strong patterns of industry concentrations for
businesses owned by many ethnic groups are consistent with this
explanation (Fairlie and Meyer 1996). The industry concentration of
black businesses has become more similar to white businesses over
time, however, while the there has been no convergence in rates of
business ownership (Fairlie and Meyer 2000).
A major limitation of these explanations is that they are difficult to
analyze empirically. The problem is that success in business for some
groups may simply create larger and more efficient business and social
networks. Thus, it is difficult to identify the direction of causation be-
tween networks and success. Coethnic networks may also create a
multiplier effect whereby small differences in initial business success between groups may lead to large differences in future business suc-
cess. This point is related to the argument noted above that the lack of
black traditions in business enterprise is a major cause of current low
Why Are African American-Owned Businesses Less Successful? 135

8/9/2019 Race and Entrepreneurial Success - Black , Asian, And White Owned Business in the United States
http://slidepdf.com/reader/full/race-and-entrepreneurial-success-black-asian-and-white-owned-business 149/253
levels of black business ownership (Du Bois 1899; Myrdal 1944; Cayton
and Drake 1946; Frazier 1957).
Conclusions
African Americans have levels of wealth that are one eleventh those of
whites. The median level of net worth, defined as the current value of
all assets minus all liabilities on those assets, for black households is
only $6,166. This disparity in personal wealth appears to have two
major consequences for business success. First, low levels of wealth
limit business formation among blacks. In fact, roughly 15 percent of
the black/white gap in business creation rates is due to racial differen-ces in assets (Fairlie 1999, 2006). Second, black entrepreneurs who do
start businesses invest much less capital at startup on average than
white entrepreneurs. For example, estimates from the CBO microdata
indicate that the percentage of black-owned firms starting with at least
$25,000 in capital is roughly half the percentage of white-owned firms
starting with at least $25,000 in capital.
Lower levels of startup capital among black businesses limit their
ability to grow and succeed. Specifically, we find that racial disparitiesin startup capital contribute to higher failure rates, lower sales and
profits, and less employment among black-owned businesses. Esti-
mates from nonlinear decompositions indicate that racial differences in
startup capital explain from 14.5 to 43.2 percent of the gaps in small
business outcomes. Startup capital disparities are the most important
explanatory factor in contributing to racial differences in business out-
comes. Limited access to financial capital among black entrepreneurs,
which appears to be caused by wealth inequality and possibly lending
discrimination, is a major reason for less successful black businesses.
Racial differences in family-business backgrounds are also an im-
portant factor. Previous research indicates that the probability of busi-
ness ownership is substantially higher among the children of business
owners than among the children of nonbusiness owners and that
current racial patterns of self-employment are in part determined by
racial patterns of self-employment in the previous generation (Lentz
and Laband 1990; Fairlie 1999; Dunn and Holtz-Eakin 2000; Hout and
Rosen 2000). The CBO microdata allow us to build on these findings by exploring whether the intergenerational transmission of business
ownership is also important in creating racial disparities in busi-
ness outcomes conditioning on ownership.
136 Chapter 4

8/9/2019 Race and Entrepreneurial Success - Black , Asian, And White Owned Business in the United States
http://slidepdf.com/reader/full/race-and-entrepreneurial-success-black-asian-and-white-owned-business 150/253
Estimates from the CBO indicate that black business owners have a
relatively disadvantaged family-business background compared with
white business owners. Black business owners are much less likely
than white business owners to have had a self-employed family-
member owner prior to starting their business and are less likely to
have worked in that family member’s business. Only 12.6 percent of
black business owners had prior work experience in a family member’s
business compared with 23.3 percent of white business owners. Racial
differences and overall rates of business inheritances are much smaller.
The percentage of business owners inheriting their firms was 1.4 per-
cent for blacks and 1.7 percent for whites.
Estimates from linear and nonlinear decompositions indicate that thelower likelihood of having a self-employed family member prior to
business startup among blacks than among whites does not generally
contribute to racial differences in small business outcomes. Instead, the
lack of prior work experience in family businesses among future black
business owners, perhaps by restricting their acquisition of general and
specific business human capital, limits the successfulness of their busi-
nesses relative to whites. With the exception of the profits specification,
racial differences in this variable explain 5.6 to 11.6 percent of the gapsin small business outcomes. Providing some additional evidence on the
importance of limited opportunities for acquiring business human cap-
ital, racial differences in prior work experience in similar businesses
also consistently explain part of the gaps in small business outcomes.
Furthermore, the combination of these two factors suggests that racial
differences in opportunities to acquire business human capital in gen-
eral contribute substantially to the differential success of black- and
white-owned businesses.
Inherited businesses are generally more successful than noninherited
businesses, but racial differences in business inheritances explain virtu-
ally none of the gaps in small business outcomes. The likelihood of
business inheritances among black and white owners (under 2 percent)
is just too small to play a major role in explaining racial differences in
business outcomes.
We also examine the contributions of other factors to racial differ-
ences in small business outcomes. Lower levels of education among
black business owners relative to white business owners explain amodest but nontrivial portion (2.4 to 6.5 percent) of the black/white
gaps in business outcomes. Although black-owned businesses have a
different regional distribution and are more likely to be located in
Why Are African American-Owned Businesses Less Successful? 137

8/9/2019 Race and Entrepreneurial Success - Black , Asian, And White Owned Business in the United States
http://slidepdf.com/reader/full/race-and-entrepreneurial-success-black-asian-and-white-owned-business 151/253
urban areas than are white-owned businesses, racial differences in geo-
graphical locations do not appear to contribute substantially to the
gaps in small business outcomes. Racial differences in the amount of
prior work experience and management experience have either small
effects or mixed effects across specifications. Finally, racial differences
in industry composition explain part of the gaps in business outcomes,
but these results are difficult to interpret because industry differences
may reflect different preferences or constraints on entry into more prof-
itable industries.
Overall, the relatively simple empirical models of business outcomes
do quite well in explaining the black/white gaps in business outcomes.
Although there are many unmeasurable factors that may explain out-come disparities as discussed above, we explain 50 to 100 percent of
the differences in business outcomes using the human capital, financial
capital, family business background, and other owner and firm charac-
teristics available in the CBO. In comparison, decompositions of earn-
ings differences between blacks and whites typically explain no more
than half of the gap unless a measure of ability is included (Altonji
and Blank 1999).
Our estimates indicate that blacks are less likely than whites to haveprevious work experience in a family member’s business and are less
likely to have previous work experience in a similar business. The rela-
tive lack of opportunities for acquiring general and specific business
human capital apparently has a negative effect on the outcomes of
black-owned firms. This finding has important policy implications.
Most minority-business-development policies currently in place, such
as set-asides and loan-assistance programs, are targeted toward allevi-
ating financial constraints not toward providing opportunities for
work experience in small businesses. To break the cycle of low rates
of business ownership and relatively worse business outcomes being
passed from one generation of blacks to the next, programs that di-
rectly address deficiencies in family-business experience, possibly
through an expansion of apprenticeship-type entrepreneurial training
programs, may be needed in addition to programs focused on improv-
ing access to financial capital.
Appendixes
Nonlinear Decomposition Method
In this appendix, we describe the decomposition techniques used in
this chapter to identify the causes of black/white differences in busi-
138 Chapter 4

8/9/2019 Race and Entrepreneurial Success - Black , Asian, And White Owned Business in the United States
http://slidepdf.com/reader/full/race-and-entrepreneurial-success-black-asian-and-white-owned-business 152/253
ness outcomes. These techniques decompose intergroup differences in
mean levels of an outcome into those due to different observable char-
acteristics or ‘‘endowments’’ across groups and those due to different
effects of characteristics or ‘‘coefficients’’ of groups. We describe the
standard Blinder-Oaxaca technique, which is used for dependent vari-
ables that are estimated with linear regressions, such as log sales. An
alternative nonlinear decomposition technique due to Fairlie (1999,
2005a) is also described. The technique is useful for decomposing racial
differences in binary outcomes, such as closure, having profits of
$10,000 or more, and having employees. Logit regressions are esti-
mated to identify the determinants of these business outcomes. This
nonlinear technique has broader applications for identifying the causesof racial, gender, geographical, or other categorical differences in
any binary dependent variable in which a logit or probit model is
used. SAS programs are available at hpeople.ucsc.edu/~rfairlie/
decompositioni, and Stata programs are available by entering ‘‘ssc in-
stall fairlie’’ in Stata.
For a linear regression, the standard Blinder-Oaxaca decomposition
of the white/black gap in the average value of the dependent variable,
Y , can be expressed as
Y W Y B ¼ ½ðX W X BÞ ^ b b W þ ½X Bð ^ b b W ^ b b BÞ; ð4:1Þ
where X j is a row vector of average values of the independent vari-
ables and ^ b b j is a vector of coefficient estimates for race j. Following
Fairlie (1999), the decomposition for a nonlinear equation, such as
Y ¼ FðX b b Þ, can be written as
Y W Y B ¼XN W
i¼1
FðX W i
^ b b
W
ÞN W
XN Bi¼1
FðX Bi
^ b b
W
ÞN B
" #
þXN Bi¼1
FðX Bi^ b b W Þ
N B
XN Bi¼1
FðX Bi^ b b BÞ
N B
" #; ð4:2Þ
where N j is the sample size for race j. This alternative expression for
the decomposition is used because Y does not necessarily equal
FðX ^
b b Þ.9
In both (4.1) and (4.2), the first term in brackets represents thepart of the racial gap that is due to group differences in distributions
of X , and the second term represents the part due to differences in
the group processes determining levels of Y . The second term also
captures the portion of the racial gap due to group differences in
Why Are African American-Owned Businesses Less Successful? 139
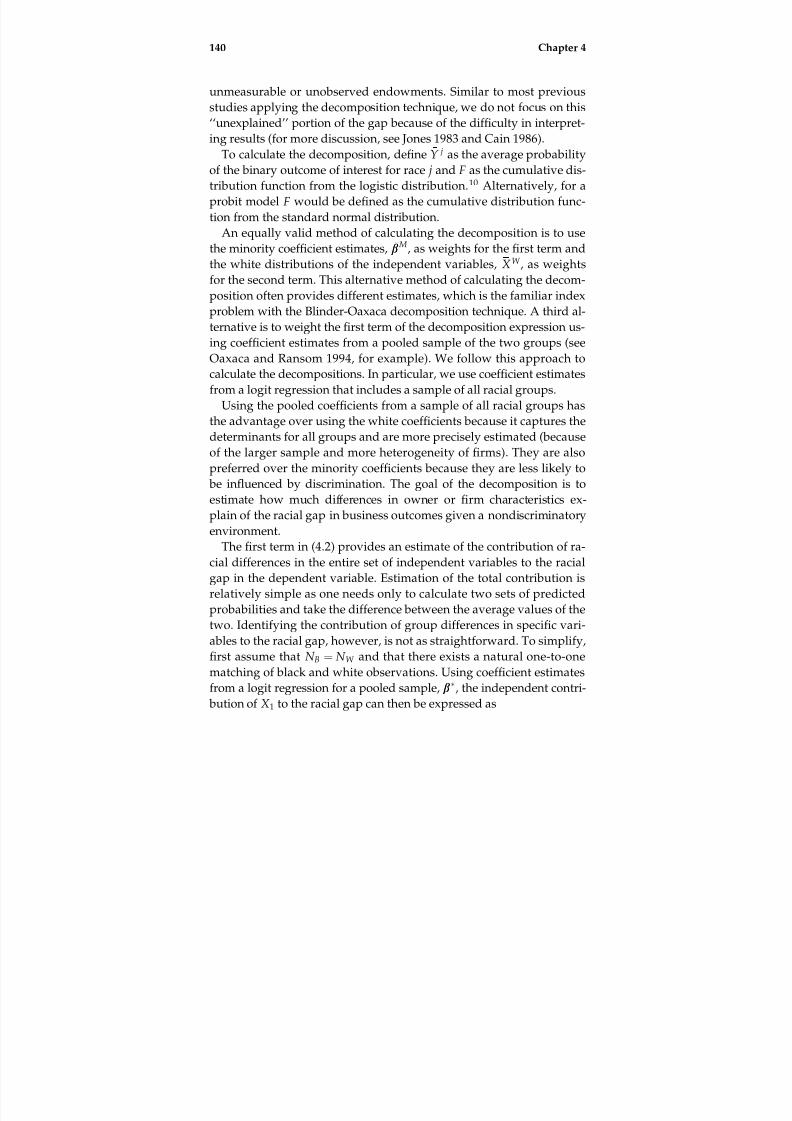
8/9/2019 Race and Entrepreneurial Success - Black , Asian, And White Owned Business in the United States
http://slidepdf.com/reader/full/race-and-entrepreneurial-success-black-asian-and-white-owned-business 153/253
unmeasurable or unobserved endowments. Similar to most previous
studies applying the decomposition technique, we do not focus on this
‘‘unexplained’’ portion of the gap because of the difficulty in interpret-
ing results (for more discussion, see Jones 1983 and Cain 1986).
To calculate the decomposition, define Y j as the average probability
of the binary outcome of interest for race j and F as the cumulative dis-
tribution function from the logistic distribution.10 Alternatively, for a
probit model F would be defined as the cumulative distribution func-
tion from the standard normal distribution.
An equally valid method of calculating the decomposition is to use
the minority coefficient estimates, ^ b b M, as weights for the first term and
the white distributions of the independent variables, X W , as weightsfor the second term. This alternative method of calculating the decom-
position often provides different estimates, which is the familiar index
problem with the Blinder-Oaxaca decomposition technique. A third al-
ternative is to weight the first term of the decomposition expression us-
ing coefficient estimates from a pooled sample of the two groups (see
Oaxaca and Ransom 1994, for example). We follow this approach to
calculate the decompositions. In particular, we use coefficient estimates
from a logit regression that includes a sample of all racial groups.Using the pooled coefficients from a sample of all racial groups has
the advantage over using the white coefficients because it captures the
determinants for all groups and are more precisely estimated (because
of the larger sample and more heterogeneity of firms). They are also
preferred over the minority coefficients because they are less likely to
be influenced by discrimination. The goal of the decomposition is to
estimate how much differences in owner or firm characteristics ex-
plain of the racial gap in business outcomes given a nondiscriminatory
environment.
The first term in (4.2) provides an estimate of the contribution of ra-
cial differences in the entire set of independent variables to the racial
gap in the dependent variable. Estimation of the total contribution is
relatively simple as one needs only to calculate two sets of predicted
probabilities and take the difference between the average values of the
two. Identifying the contribution of group differences in specific vari-
ables to the racial gap, however, is not as straightforward. To simplify,
first assume that N B ¼ N W and that there exists a natural one-to-onematching of black and white observations. Using coefficient estimates
from a logit regression for a pooled sample, ^ b b , the independent contri-
bution of X 1 to the racial gap can then be expressed as
140 Chapter 4

8/9/2019 Race and Entrepreneurial Success - Black , Asian, And White Owned Business in the United States
http://slidepdf.com/reader/full/race-and-entrepreneurial-success-black-asian-and-white-owned-business 154/253
1
N BXN B
i¼1
Fðaa þ X W 1i
^ b b 1 þ X W 2i
^ b b 2 Þ Fðaa þ X B1i^ b b 1 þ X W
2i^ b b 2 Þ:11 ð4:3Þ
Similarly, the contribution of X 2 can be expressed as
1
N B
XN Bi¼1
Fðaa þ X B1i^ b b 1 þ X W
2i^ b b 2 Þ Fðaa þ X B1i
^ b b 1 þ X B2i^ b b 2 Þ: ð4:4Þ
The contribution of each variable to the gap is thus equal to the change
in the average predicted probability resulting from sequentially
switching the white characteristics to black characteristics one variable
or set of variables at a time.12 A useful property of this technique isthat the sum of the contributions from individual variables will be
equal to the total contribution from all of the variables evaluated with
the full sample.
In practice, the sample sizes of the two groups are rarely the same
and a one-to-one matching of observations from the two samples is
needed to calculate (4.3) and (4.4). In this example, it is likely that the
black sample size is substantially smaller than the white sample size.
To address this problem, first use the pooled coefficient estimates tocalculate predicted probabilities, Y Y i, for each black and white observa-
tion in the sample. Next, draw a random subsample of whites with a
sample size equal to N B and randomly match it to the full black sam-
ple. The decomposition estimates obtained from this procedure de-
pend on the randomly chosen subsample of whites. Ideally, the results
from the decomposition should approximate those from matching the
entire white sample to the black sample. A simple method of approxi-
mating this hypothetical decomposition is to draw a large number of
random subsamples of whites, match each of these random sub-
samples of whites to the black sample, and calculate separate decom-
position estimates. The mean value of estimates from the separate
decompositions is calculated and used to approximate the results for
the entire white sample. All of the decompositions reported in this
chapter use 1,000 random subsamples of whites to calculate these
means.
Why Are African American-Owned Businesses Less Successful? 141

8/9/2019 Race and Entrepreneurial Success - Black , Asian, And White Owned Business in the United States
http://slidepdf.com/reader/full/race-and-entrepreneurial-success-black-asian-and-white-owned-business 155/253
Table 4.A
Means of selected variables, Characteristics of Business Owners (1992)
White-
OwnedFirms
Black-
OwnedFirms
Firm no longer operating in 1996 (closure) 0.2282 0.2696
Net profit of at least $10,000 0.3004 0.1410
One or more paid employees 0.2067 0.1121
Log sales 10.07 9.42
Female-owned business 0.3268 0.4261
Married 0.7650 0.6780
Never married 0.1020 0.1200
High school graduate 0.2651 0.2230
Some college 0.3123 0.3423
College graduate 0.1962 0.1292
Graduate school 0.1353 0.1437
Northeast 0.0643 0.0194
Midatlantic 0.1469 0.1315
East North Central 0.1666 0.1403
West North Central 0.0847 0.0330
South Atlantic 0.1597 0.3259
East South Central 0.0518 0.0792
West South Central 0.0999 0.1443
Mountain 0.0670 0.0163
Urban 0.7351 0.8877
Prior work experience: 1 year 0.0707 0.0680
Prior work experience: 2 to 5 years 0.1641 0.1500
Prior work experience: 6 to 9 years 0.1507 0.1445
Prior work experience: 10 to 19 years 0.2973 0.3143
Prior work experience: 20 years or more 0.2578 0.2393
Prior work experience in a managerial capacity 0.5552 0.4699
Prior work experience in a similar business 0.5030 0.4353
Have a self-employed family member 0.5231 0.3254
Prior work experience in a family member’s business 0.2352 0.1264
Inherited business 0.0148 0.0132
Startup capital: $5,000 to $24,999 0.2374 0.2107
Startup capital: $25,000 to $99,999 0.1095 0.0645
Startup capital: $100,000 and over 0.0475 0.0168
Agricultural services 0.0269 0.0175
Construction 0.1261 0.0718
Manufacturing 0.0330 0.0168
Wholesale 0.0360 0.0112
142 Chapter 4

8/9/2019 Race and Entrepreneurial Success - Black , Asian, And White Owned Business in the United States
http://slidepdf.com/reader/full/race-and-entrepreneurial-success-black-asian-and-white-owned-business 156/253
Table 4.A
(continued)
White-
OwnedFirms
Black-
OwnedFirms
Finance, insurance, and real estate 0.0987 0.0609
Transportation, communications, and public utilities 0.0389 0.0834
Personal services 0.2616 0.3287
Professional services 0.1937 0.2060
Uncoded industry 0.0391 0.0572
Sample size 14,282 6,831
Notes: (1) The sample includes businesses that are classified by the IRS as individual pro-prietorships or self-employed persons, partnerships and subchapter S corporations, havesales of $500 or more, and have at least one owner who worked at least twelve weeksand ten hours per week in the business. (2) All estimates are calculated using sampleweights provided by the CBO.
Why Are African American-Owned Businesses Less Successful? 143

8/9/2019 Race and Entrepreneurial Success - Black , Asian, And White Owned Business in the United States
http://slidepdf.com/reader/full/race-and-entrepreneurial-success-black-asian-and-white-owned-business 157/253

8/9/2019 Race and Entrepreneurial Success - Black , Asian, And White Owned Business in the United States
http://slidepdf.com/reader/full/race-and-entrepreneurial-success-black-asian-and-white-owned-business 158/253
5 Why Are Asian-Owned Businesses More Successful?
In this chapter, we explore potential explanations for the relative suc-cess of Asian American-owned businesses in the United States. Asian
Americans differ from other minority groups in that they have high
rates of business ownership. In the past few years, more than 11
percent of Asian workers in the United States were self-employed busi-
ness owners. This is comparable to the white rate of business owner-
ship. In addition to having relatively high rates of self-employment,
Asians have better business outcomes on average than other racial
groups. For example, Asian-owned businesses are 16.9 percent lesslikely to close, 20.6 percent more likely to have profits of at least
$10,000, and 27.2 percent more likely to hire employees than busi-
nesses owned by whites.
The success of Asians in business ownership in the United States is
well documented and has been used as an example of how disadvan-
taged groups utilize business ownership as a route for economic ad-
vancement. It has been argued, for example, that the economic success
of Chinese and Japanese immigrants is in part due to their ownershipof small businesses (Loewen 1971; Light 1972; Bonacich and Modell
1980). More recently, Koreans have also purportedly used business
ownership for economic mobility (Min 1989, 1993).
Most prior research on Asian business ownership relies on house-
hold survey data, such as the Census of Population, and focuses on
explaining the relatively high rates of self-employment among Asians
(Min 1986–1987; Bonacich and Light 1988; Kim, Hurh, and Fernandez
1989; Hout and Rosen 2000; Mar 2005). These studies find that Asian
Americans, especially immigrants, have self-employment rates that arehigher than other minority groups and typically on par with that of
whites in the United States. Evidence from Canada and the United

8/9/2019 Race and Entrepreneurial Success - Black , Asian, And White Owned Business in the United States
http://slidepdf.com/reader/full/race-and-entrepreneurial-success-black-asian-and-white-owned-business 159/253
Kingdom also indicates that Asians have relatively high rates of busi-
ness ownership (Clark and Drinkwater 1998, 2000; Fairlie 2006). Pre-
vious research also finds that self-employed Asians have relatively high
earnings.1
Although research on Asian business ownership is extensive, only a
handful of previous studies use business-level data to study the out-
comes of Asian-owned firms. The few studies using business-level
data to explore why Asian-owned businesses are more likely to sur-
vive and are more profitable than businesses owned by other racial
groups, find that high levels of investment of human and financial cap-
ital are the most important factors (Bates 1989, 1997; Robb 2000). The
lack of research on the outcomes of Asian firms is due primarily to thelimited availability of data with large enough samples of Asian-owned
businesses and detailed information on business outcomes. This lack of
research is especially unfortunate given such dramatic differences in
outcomes across racial groups.
In this chapter, we use CBO microdata to explore the causes of why
Asian-owned firms are less likely to close and have higher profits, em-
ployment, and sales than white-owned firms. The confidential and
restricted-access CBO microdata are useful for studying this question because of the large oversample of Asian-owned businesses and
detailed information on the characteristics of both owners and firms.
Although the CBO microdata contain information on immigrant status
and country of origin, in most analyses we combine the various Asian
subgroups. The estimates presented in chapter 2 and later in this chap-
ter indicate that business outcomes are roughly similar for immigrant
and U.S.-born Asians and across major Asian subgroups. Also, roughly
80 percent of Asian-owned businesses in the United States are owned
by immigrants, suggesting that the results presented below are being
driven primarily by businesses owned by Asian immigrants.
The analysis also focuses mainly on the effects of measurable inputs
in the firm’s production process. We are particularly interested in
exploring the role that financial capital and human capital play in con-
tributing to the relative success of Asian businesses. Are Asian busi-
nesses more successful because of higher levels of startup capital and
owner’s human capital? We also examine the role that intergenera-
tional links in self-employment play in contributing to racial differ-ences in small business outcomes. Do Asian business owners have
greater opportunities for the acquisition of general and specific busi-
ness human capital from working in family-owned businesses?
146 Chapter 5

8/9/2019 Race and Entrepreneurial Success - Black , Asian, And White Owned Business in the United States
http://slidepdf.com/reader/full/race-and-entrepreneurial-success-black-asian-and-white-owned-business 160/253
We build on findings from previous chapters on the determinants of
business success to identify the underlying causes of differences in
business performance between Asian and white firms. The decomposi-
tion technique used for this analysis not only identifies whether a par-
ticular factor is important but also identifies how much of the gap it
explains for a particular outcome. This allows the relative contribu-
tions of racial differences in startup capital, human capital, and family-
business backgrounds to be compared to try to explain why Asian
firms have better outcomes on average than white firms. Although
this approach might not reveal all of the reasons that Asian firms have
better average outcomes than white firms, the results are easily inter-
preted and have clear policy implications.
Social Capital and Ethnic Resources
The previous literature offers various explanations for high rates of
Asian self-employment, including high levels of human and financial
capital (sometimes referred to as class resources) and extensive social or
ethnic resources (such networks, rotating credit associations, and ac-
cess to coethnic labor and customers).2
Several studies focus on theimportance of social resources, especially for Asian immigrants.3 Net-
works of coethnics may provide valuable resources such as customers,
labor, and technical assistance to assist in starting and running busi-
nesses (Light 1972; Waldinger, Aldrich, and Ward 1990; Saxenian
2002; Zhou 2004; Kalnins and Cheung 2006; Gil and Hartmann 2007).
Coethnic networks may also be useful for providing access to financial
capital for entrepreneurs through rotating credit associations, direct
loans, and equity investments in the business.
Ethnic enclaves facilitate the transmission of social and ethnic
resources. In particular, enclaves create opportunities for would-be
entrepreneurs by providing access to markets, labor, and information
(Aldrich et al. 1985; Borjas 1990). For example, the protected-market
hypothesis maintains that ethnic enterprises often better serve the mar-
ket of ethnic minorities by offering transactions in their own language
and more efficiently responding to a group’s tastes and demands
(Light 1972; Aldrich et al. 1985; Waldinger et al. 1990). Ethnic groups
often concentrate in a given area, which can result in the decision of nonminority business owners to leave and correspondingly open up
opportunities that can be taken advantage of by minority groups
(Aldrich et al. 1985). Niche markets arise in some areas due to
Why Are Asian-Owned Businesses More Successful? 147

8/9/2019 Race and Entrepreneurial Success - Black , Asian, And White Owned Business in the United States
http://slidepdf.com/reader/full/race-and-entrepreneurial-success-black-asian-and-white-owned-business 161/253
underserved markets, especially in inner cities (Porter 1995; Yoon 1991,
1997).
Ethnic entrepreneurs often get their start in business by serving a
predominantly minority clientele, which typically populate the area
where the ethnic businesses are located. While enclaves offer opportu-
nities for market access to ethnic entrepreneurs, relying on the ethnic
enclave as the sole source of demand can limit growth potential be-
cause of the limited market size (Bates 1997; Waldinger et al. 1990).
Enclaves may also reduce a business’s survival prospects because
many individuals from the same enclave could opt for business owner-
ship for the same reasons and result in excess competition, causing
some of the locations to go out of business (Bates 1997; Waldinger etal. 1990; Yoon 1991). Consistent with these arguments, Boyd (1991)
finds no benefit of a concentrated ethnic population on ethnic immi-
grant entrepreneurs.
Some ethnic minorities have a comparative advantage in attract-
ing cheap labor from within their own network (Waldinger 1986;
Bonacich and Light 1988). Asians can access coethnics and family
members, which may provide an edge in hiring low-paid and trusted
workers (Fratoe 1988; Min 1986–1987; Boyd 1991). Ethnic immigrantworkers may have restricted job opportunities because of limited
English skills but fit in well working for ethnic business owners who
understand their own language and culture (Yoon 1991, 1993; Min
1988). However, the vast majority of the self-employed do not have any
employees, so this argument alone may not be able to explain much of
the large racial differences in self-employment rates and outcomes.
Relying heavily on social or ethnic resources may be necessary for
those with lower levels of class resources but could result in worse
outcomes. Chaganti and Greene (2002) find that entrepreneurs with
higher levels of involvement in their ethnic community have lower
levels of personal resources and are more reliant on their communities.
Yoon (1991) finds that Korean immigrant businesses that are more reli-
ant on ethnic resources have lower levels of start up capital and lower
levels of gross sales. Bates (1997) finds that Asian Indian businesses are
the least oriented to serving a minority clientele, least likely to employ
a predominantly minority labor force, and hence least likely to utilize
resources of ethic enclaves, yet they have the best average performanceof all Asian-owned firms. The Asian subgroup that he examined with
the lowest average outcomes, the Vietnamese, is very active and reliant
on ethnic enclaves to start and operate businesses.
148 Chapter 5
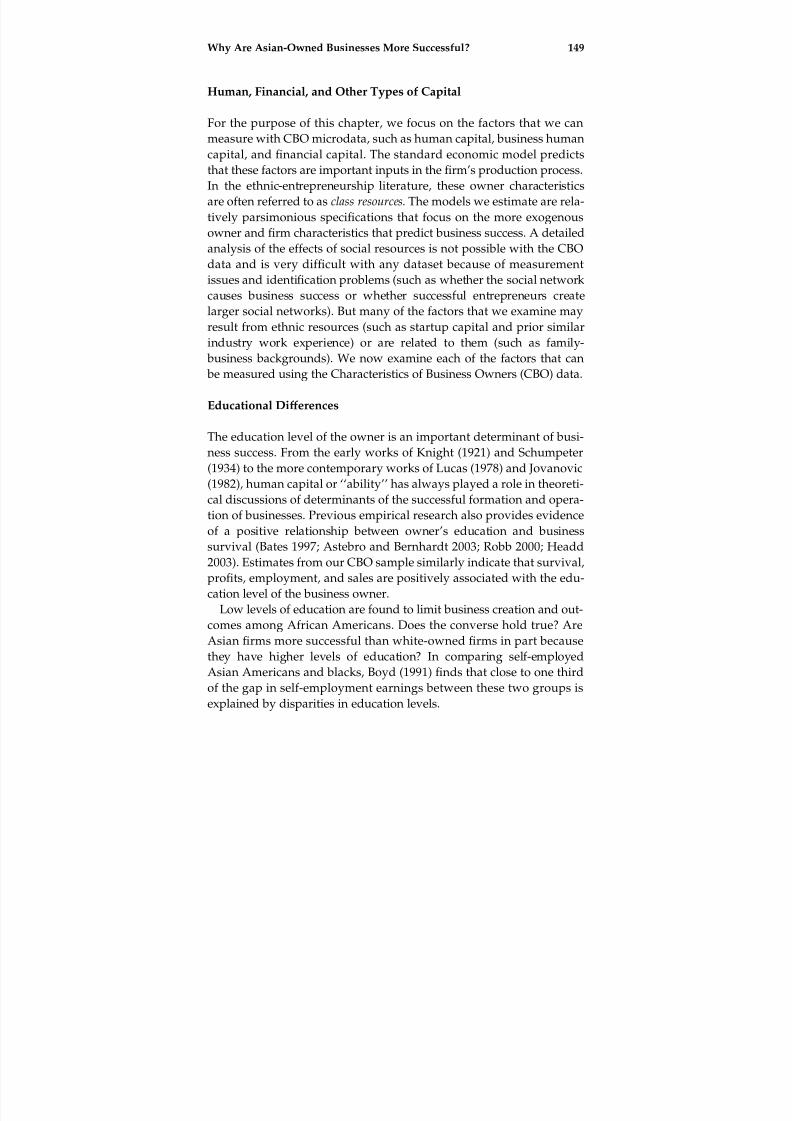
8/9/2019 Race and Entrepreneurial Success - Black , Asian, And White Owned Business in the United States
http://slidepdf.com/reader/full/race-and-entrepreneurial-success-black-asian-and-white-owned-business 162/253
Human, Financial, and Other Types of Capital
For the purpose of this chapter, we focus on the factors that we can
measure with CBO microdata, such as human capital, business human
capital, and financial capital. The standard economic model predicts
that these factors are important inputs in the firm’s production process.
In the ethnic-entrepreneurship literature, these owner characteristics
are often referred to as class resources. The models we estimate are rela-
tively parsimonious specifications that focus on the more exogenous
owner and firm characteristics that predict business success. A detailed
analysis of the effects of social resources is not possible with the CBO
data and is very difficult with any dataset because of measurementissues and identification problems (such as whether the social network
causes business success or whether successful entrepreneurs create
larger social networks). But many of the factors that we examine may
result from ethnic resources (such as startup capital and prior similar
industry work experience) or are related to them (such as family-
business backgrounds). We now examine each of the factors that can
be measured using the Characteristics of Business Owners (CBO) data.
Educational Differences
The education level of the owner is an important determinant of busi-
ness success. From the early works of Knight (1921) and Schumpeter
(1934) to the more contemporary works of Lucas (1978) and Jovanovic
(1982), human capital or ‘‘ability’’ has always played a role in theoreti-
cal discussions of determinants of the successful formation and opera-
tion of businesses. Previous empirical research also provides evidence
of a positive relationship between owner’s education and business
survival (Bates 1997; Astebro and Bernhardt 2003; Robb 2000; Headd
2003). Estimates from our CBO sample similarly indicate that survival,
profits, employment, and sales are positively associated with the edu-
cation level of the business owner.
Low levels of education are found to limit business creation and out-
comes among African Americans. Does the converse hold true? Are
Asian firms more successful than white-owned firms in part because
they have higher levels of education? In comparing self-employedAsian Americans and blacks, Boyd (1991) finds that close to one third
of the gap in self-employment earnings between these two groups is
explained by disparities in education levels.
Why Are Asian-Owned Businesses More Successful? 149

8/9/2019 Race and Entrepreneurial Success - Black , Asian, And White Owned Business in the United States
http://slidepdf.com/reader/full/race-and-entrepreneurial-success-black-asian-and-white-owned-business 163/253
Asians are the most educated racial group in the United States. Asfigure 5.1 illustrates, Asians are much more likely than whites to grad-
uate from college or graduate school. Estimates from 2000 U.S. Census
microdata indicate that nearly half of all Asian adults have at least a
college degree. This compares with less than 30 percent of whites. The
pattern of higher education levels among Asians is also observed when
we look at our sample of active business owners. As illustrated in fig-
ure 5.2, 47 percent of Asian business owners have at least a college de-
gree, and 22 percent have gone beyond an undergraduate degree topursue graduate school. Roughly one third of whites have at least a
college degree, and 14 percent have a graduate degree.
Research on blocked mobility for minorities and especially immi-
grants indicates that some groups are ‘‘pushed’’ into self-employment
(Kassoudji 1988; Waldinger, Aldrich, and Ward 1990; Boyd 1990; Kim,
Hurh, and Fernandez 1989; Min 1984). Potential employers may under-
value educational accomplishments by Asians in the wage and salary
sector because the education was usually obtained in their home coun-
try: about 80 percent of Asians in our sample are immigrants. Bates
(1997) finds that those Asians that are pushed into self-employment
due to undervalued education or limited English-language skills typi-
cally locate in the lowest-yielding industries—retailing and personal
Figure 5.1
Educational attainment distribution for Asian and white population, 2000 U.S. Census5% PUMS Microdata
150 Chapter 5

8/9/2019 Race and Entrepreneurial Success - Black , Asian, And White Owned Business in the United States
http://slidepdf.com/reader/full/race-and-entrepreneurial-success-black-asian-and-white-owned-business 164/253
services—while those ‘‘pulled’’ into self-employment are drawn into
self-employment in skill-intensive industries such as professional ser-
vices, finance, insurance, and real estate. Published estimates from the
1992 CBO indicate that the most educated Asians locate in high
human-capital-intensive industries such as finance, insurance, and real
estate (FIRE) rather than in low human-capital-intensive industries,
such as retail trade (U.S. Census Bureau 1997).
The importance of education in our business outcome regressions
from chapter 3 indicates that higher education levels are potentially
one explanation for the superior outcomes of Asian-owned businesses,a finding consistent with previous research on fewer outcome mea-
sures (Bates 1997; Robb 2000). Our decompositions expand on these
findings by providing an estimate of how much observed racial differ-
ences in education explain the Asian/white differences in business
outcomes.
Family-Business Experience
Comparisons of family backgrounds between Asians and whites are
difficult to make because of the large share of Asians who are immi-
grants and the lack of information on family formation in their home
Figure 5.2
Owner’s education level by race, Characteristics of Business Owners (1992)
Why Are Asian-Owned Businesses More Successful? 151

8/9/2019 Race and Entrepreneurial Success - Black , Asian, And White Owned Business in the United States
http://slidepdf.com/reader/full/race-and-entrepreneurial-success-black-asian-and-white-owned-business 165/253
countries. The current snapshot in the United States indicates that
Asian marriage rates and single-parent household rates are not overly
different than white rates. More than 60 percent of Asian adults are
currently married, compared with 57 percent of whites. Asians have
about half the rate of nonmarital births (22 percent) as whites (40 per-
cent), and about 14 percent of Asian children live with single parents,
compared with 20 percent of white children (U.S. Census Bureau 2001;
National Center for Health Statistics 2003). These estimates indicate
that Asians are more likely to grow up in two-parent families than
whites, which differs from the experience for blacks as described in
chapter 4. However, it is important to keep in mind that these esti-
mates are relevant for current Asian children and not the previous gen-eration of Asians who are potential business owners captured in the
CBO data. Unfortunately, published historical data on Asians living in
the United States are not available. In addition, we do not have infor-
mation on the family backgrounds of Asian immigrants in their home
countries. Nevertheless, the combination of relatively high rates of
self-employment and low rates of growing up in single-parent families,
at least for the current generation of Asians, implies that Asians may
be more likely to have parents who are self-employed business owners.The owner’s family-business background and type of prior work ex-
perience are important factors in successfully running a business. Fam-
ily businesses appear to provide an important opportunity for family
members to acquire human capital related to operating a business. In
addition, prior work experience in a similar business may provide the
owner with valuable specific business human capital. If Asians have
plentiful opportunities to acquire important general and specific busi-
ness human capital through these avenues, then it could partly explain
why they tend to have more successful businesses.
Focusing on current business owners, however, we do not find evi-
dence that Asian owners have more advantaged family-business back-
grounds than whites. Estimates of having a self-employed family
member, working in family businesses, and having business inheri-
tances are reported in table 5.1. About 44 percent of Asian business
owners indicate that they had a self-employed family member prior to
starting their firm. This compares with 53 percent of white-owned
firms. About 41 percent of Asian owners with a self-employed familymember previously worked in that family member’s business com-
pared with 44 percent of white business owners. Additionally, about
18 percent of Asian business owners previously worked in a family
152 Chapter 5

8/9/2019 Race and Entrepreneurial Success - Black , Asian, And White Owned Business in the United States
http://slidepdf.com/reader/full/race-and-entrepreneurial-success-black-asian-and-white-owned-business 166/253
member’s business before starting their own, compared with about 23
percent of white business owners. Inheritance was an infrequent
source of business ownership, with only 1.3 percent and 1.7 percent of Asian and white business owners, respectively, citing this as a source
of their businesses. These estimates indicate that the current genera-
tion of Asian business owners does not have an advantaged family-
business background relative to white business owners. Instead, Asian
owners appear to have less experience, on average, than white owners
in working for family businesses prior to starting their own businesses.
Related to the family-business background of the owner, marriage is
associated with business success. Spouses may provide financial assis-tance, paid or unpaid labor for the business, health insurance coverage,
and other types of assistance useful for running a business. Estimates
from the CBO indicate that 82 percent of Asian owners are married
compared with 77 percent of white owners (see the appendix to this
chapter). The difference is not that large, however, suggesting that dif-
ferences between Asians and whites in marital status cannot have a
large explanatory effect on racial differences in business outcomes.
Differences in Business Human Capital
As noted in previous chapters, prior work experience also plays a role
in business performance. Our data show that white and Asian business
Table 5.1
Family business background by race, Characteristics of Business Owners (1992)
AllFirms
White-
OwnedFirms
Asian-
OwnedFirms
Had a self-employed family member priorto starting firm
51.6% 53.1% 44.3%
Previously worked in that family member’s business (conditional)
43.6% 43.9% 40.5%
Previously worked in a family member’s business (unconditional)
22.5% 23.3% 18.0%
Inherited their businesses 1.6% 1.7% 1.3%
Sample size 38,020 15,872 6,321
Notes: (1) The sample includes businesses that are classified by the IRS as individual pro-prietorships or self-employed persons, partnerships, and subchapter S corporations, havesales of $500 or more, and have at least one owner who worked at least twelve weeksand ten hours per week in the business. (2) All estimates are calculated using sampleweights provided by the Characteristics of Business Owners.
Why Are Asian-Owned Businesses More Successful? 153

8/9/2019 Race and Entrepreneurial Success - Black , Asian, And White Owned Business in the United States
http://slidepdf.com/reader/full/race-and-entrepreneurial-success-black-asian-and-white-owned-business 167/253
owners have similar business and management experience. As indi-
cated in table 5.2, 50 percent of white business owners and 47 percent
of Asian business owners previously worked in a business that pro-
vided similar goods or services as the businesses they currently own.
This type of work experience undoubtedly provides opportunities for
acquiring job- or industry-specific business human capital in additionto more general business human capital. In addition, about 56 percent
of both white and Asian owners have previous work experience in a
managerial capacity prior to owning their current business, which pro-
vides an opportunity to gain professional and management experience
useful in running future business ventures. The similarity of these fac-
tors across white and Asian owners implies that they cannot explain
much, if any, of the observed differences in business outcomes.
As noted in chapter 3, the number of years of work experience prior
to starting the business had mixed effects across outcome measures, al-
though we find some evidence that individuals with twenty or more
years or very few years of prior work experience have worse outcomes,
on average. A larger share of Asian business owners had less than six
years of work experience than white owners before starting their busi-
ness. The opposite is true at the other end of the distribution. More
than one quarter of white business owners had twenty or more years
of work experience, prior to opening their businesses, compared with
13 percent of Asian business owners. The racial differences in previouswork experience are large between the two groups, indicating that this
may play a role in the differences in business outcomes.
Table 5.2
Types of prior work experience by race, Characteristics of Business Owners (1992)
AllFirms
White-
OwnedFirms
Asian-
OwnedFirms
Previously worked in a business with similargoods/services
50.1% 50.4% 46.8%
Previous work experience in a managerial capacity 55.2% 55.6% 56.4%
Sample size 38,020 15,872 6,321
Notes: (1) The sample includes businesses that are classified by the IRS as individual pro-prietorships or self-employed persons, partnerships and subchapter S corporations, havesales of $500 or more, and have at least one owner who worked at least twelve weeks
and ten hours per week in the business. (2) All estimates are calculated using sampleweights provided by the Characteristics of Business Owners.
154 Chapter 5

8/9/2019 Race and Entrepreneurial Success - Black , Asian, And White Owned Business in the United States
http://slidepdf.com/reader/full/race-and-entrepreneurial-success-black-asian-and-white-owned-business 168/253
Wealth Differences
The owner’s wealth may be an important determinant of business suc-
cess because it affects access to financial capital at startup and over the
life of the firm. Personal wealth can be invested directly in the business
or used as collateral to obtain loans. We provide evidence in the previ-
ous chapter that low levels of wealth are found to limit business cre-
ation and outcomes for black-owned businesses. Are Asians more
successful in business partly because they have better access to finan-
cial capital? We first examine wealth differences between Asians and
whites and then, using the CBO data, explore whether financial capital
differences explain why Asian-owned businesses outperform white-owned businesses on average.
Estimates from pooling the 1984 to 2001 Survey of Income and
Program Participation (SIPP) Panels indicate that Asians and whites
have similar wealth levels.4 Using households headed by individuals
twenty-five to sixty-four years old, the median total net worth in 2000
dollars is about $59,400 for whites and $49,300 for Asians. Asians have
a slightly higher mean total net worth of about $129,300, compared
with $123,600 for whites. In earlier work, Bates (1997) also finds thatAsians had a slightly higher mean value of wealth ($73,222) than
whites ($68,768) using the 1984 SIPP. Separate estimates by immigrant
status indicate that Asian immigrants and U.S.-born Asians have simi-
lar average levels of wealth (Hao 2007).
These estimates indicate that, unlike blacks as shown in the previous
chapter, Asians have wealth levels that are comparable to whites. Do
these similar wealth levels translate into similar levels of startup capi-
tal, or do Asians and whites differ in the types of financing used, po-
tentially resulting in different levels of startup capital? We investigate
these questions next.
Types of Financing
Asian and other minority owners differ from white business owners in
the types of financing they used to start their businesses. Table 5.3
reports published estimates of sources of capital from the CBO for
whites and the combined group of Asians and other minority-ownedfirms (Pacific Islanders, American Indians, and Alaska natives) (U.S.
Census Bureau 1997). Thus, when examining sources of borrowed and
equity capital, we are limited to presenting estimates for Asians and
Why Are Asian-Owned Businesses More Successful? 155
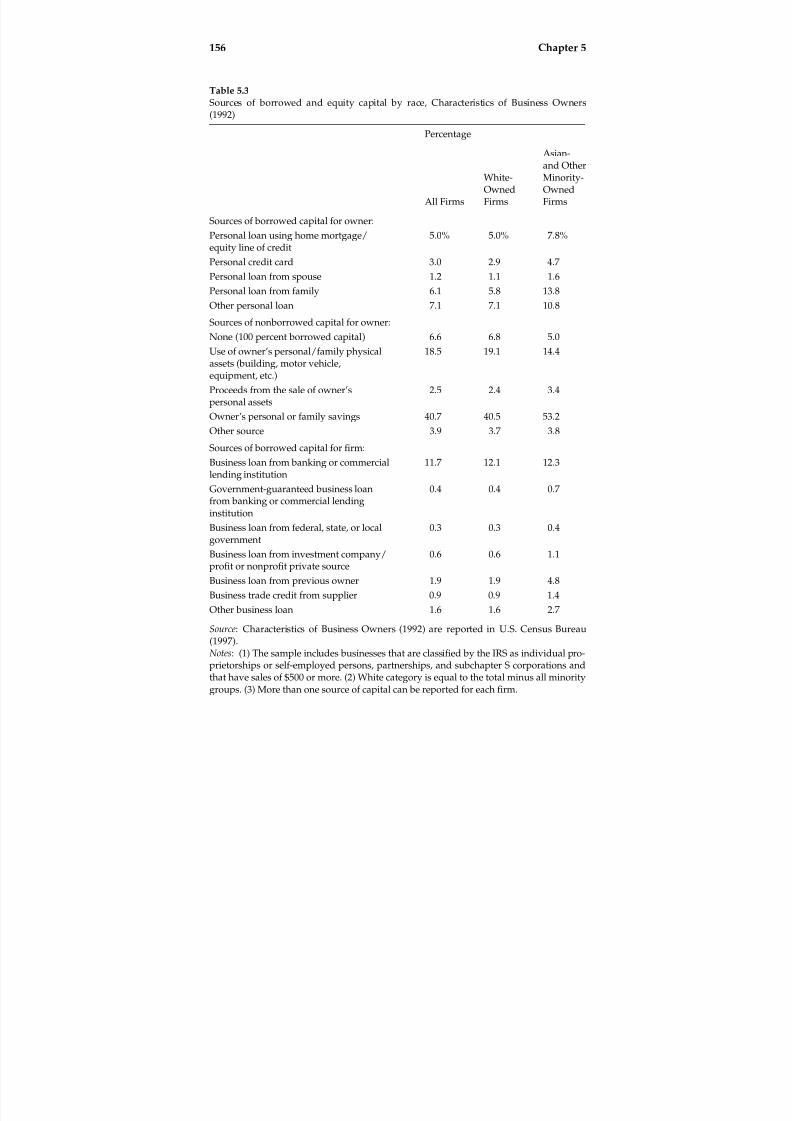
8/9/2019 Race and Entrepreneurial Success - Black , Asian, And White Owned Business in the United States
http://slidepdf.com/reader/full/race-and-entrepreneurial-success-black-asian-and-white-owned-business 169/253
Table 5.3
Sources of borrowed and equity capital by race, Characteristics of Business Owners(1992)
Percentage
All Firms
White-OwnedFirms
Asian-and OtherMinority-OwnedFirms
Sources of borrowed capital for owner:
Personal loan using home mortgage/equity line of credit
5.0% 5.0% 7.8%
Personal credit card 3.0 2.9 4.7Personal loan from spouse 1.2 1.1 1.6
Personal loan from family 6.1 5.8 13.8
Other personal loan 7.1 7.1 10.8
Sources of nonborrowed capital for owner:
None (100 percent borrowed capital) 6.6 6.8 5.0
Use of owner’s personal/family physicalassets (building, motor vehicle,equipment, etc.)
18.5 19.1 14.4
Proceeds from the sale of owner’spersonal assets
2.5 2.4 3.4
Owner’s personal or family savings 40.7 40.5 53.2
Other source 3.9 3.7 3.8
Sources of borrowed capital for firm:
Business loan from banking or commerciallending institution
11.7 12.1 12.3
Government-guaranteed business loanfrom banking or commercial lendinginstitution
0.4 0.4 0.7
Business loan from federal, state, or localgovernment
0.3 0.3 0.4
Business loan from investment company/profit or nonprofit private source
0.6 0.6 1.1
Business loan from previous owner 1.9 1.9 4.8
Business trade credit from supplier 0.9 0.9 1.4
Other business loan 1.6 1.6 2.7
Source: Characteristics of Business Owners (1992) are reported in U.S. Census Bureau(1997).
Notes: (1) The sample includes businesses that are classified by the IRS as individual pro-prietorships or self-employed persons, partnerships, and subchapter S corporations andthat have sales of $500 or more. (2) White category is equal to the total minus all minoritygroups. (3) More than one source of capital can be reported for each firm.
156 Chapter 5

8/9/2019 Race and Entrepreneurial Success - Black , Asian, And White Owned Business in the United States
http://slidepdf.com/reader/full/race-and-entrepreneurial-success-black-asian-and-white-owned-business 170/253
Native Americans combined. However, nearly 85 percent of this group
is in fact Asians and Pacific Islanders. Nearly 8 percent of Asian and
other minority owners used a personal loan through a home mortgage
or equity line of credit for startup capital, compared with 5 percent of
whites. Asian firms were also more likely than white firms to use a
personal credit card or a personal loan from a spouse. More signifi-
cantly however, 13.8 percent of Asians and other minorities used a per-
sonal loan from a family member and 10.8 percent used some other
type of personal loan. These compare with 5.8 percent and 7.1 percent
for whites, respectively.5 Thus, Asian owners are much more likely
than white owners to rely on family sources for borrowed startup capi-
tal for their businesses.6
The story is mixed for nonborrowed startup capital. Published CBO
estimates show that white firms were more likely to use an owner’s
personal or family physical assets for the business startup (19.1 per-
cent) than were Asians (14.4 percent). Bates (1997) finds that the major-
ity of Asian startup capital on the equity side comes from family
wealth. Asians were slightly more likely to use proceeds from the sale
of owner’s assets to finance a business venture, but only 3 percent of
Asians did so. Finally, Asians were much more likely to invest per-sonal or family savings in the business (53.2 percent) than were whites
(40.5 percent).
In examining the sources of borrowed startup capital for the firm,
the story was similar. Asian-owned businesses were more likely to
have borrowed capital from each of the different sources than were
whites. Business loans from banking or commercial lending institu-
tions were the most common, followed by business loans from a previ-
ous owner and other business loans. Very few businesses used loans
from the federal, state, or local governments.
Estimates from the 1998 Survey of Small Business Finances (SSBF)
for more established businesses indicate that less than 47 percent of
Asian-owned firms have an outstanding loan compared with nearly 56
percent of white-owned firms. Asians are less likely to have credit
lines, mortgages, vehicle loans, equipment loans, or capital leases.
Asians are more likely than whites to have owner loans and to borrow
through the use of credit cards (Bitler, Robb, and Wolken 2001). These
findings could mean that Asian owners are necessarily more reliant onfriends and family or on owner equity than are white owners.
One line of research in the sociological literature examines rotating
credit associations and other types of financing, which emerge out of
Why Are Asian-Owned Businesses More Successful? 157

8/9/2019 Race and Entrepreneurial Success - Black , Asian, And White Owned Business in the United States
http://slidepdf.com/reader/full/race-and-entrepreneurial-success-black-asian-and-white-owned-business 171/253
ethnic networks. Rotating credit associations allow people in the net-
work to pool their savings and lend to individuals, many of whom
start up businesses with the borrowed capital. Previous research has
noted the role of rotating credit associations in providing financial cap-
ital for Asian businesses (Light, Kwuon, and Zhong 1990; Yoon 1991).
Yet estimates from the CBO indicate that, at most, 14.6 percent of
Asian and other minority business owners report having a personal or
business loan from ‘‘other’’ sources, which is lower than the total inci-
dence for bank loans and credit cards. It appears that many rotating
credit associations generally provide very short-term capital and that
their role as a saving mechanism may be more important than theirrole in providing loans.7
Startup Capital
Estimates from the CBO indicate that Asians start their businesses with
far more capital than whites and other groups. Figure 5.3 indicates that
12 percent of Asian-owned businesses started with more than $100,000
in capital, compared with just 5 percent of white-owned firms. Nearlya quarter of Asian-owned businesses started with $25,000 to $100,000,
compared with just 11 percent of white-owned firms. More than 60
percent of white owned firms were started with less than $5,000,
Figure 5.3
Startup capital by race, Characteristics of Business Owners (1992)
158 Chapter 5

8/9/2019 Race and Entrepreneurial Success - Black , Asian, And White Owned Business in the United States
http://slidepdf.com/reader/full/race-and-entrepreneurial-success-black-asian-and-white-owned-business 172/253
whereas just 36 percent of Asian-owned firms were started with com-
parable levels of startup capital.
Bates (1997) finds similar patterns using the 1987 CBO. The total fi-
nancial capital at startup was about $14,000 on average for blacks and
$32,000 on average for nonminorities, whereas it was nearly $54,000
for Asian immigrants. He also finds that nearly half of Asians used
borrowed funds to finance the business startup (compared with 29 per-
cent of blacks and 34 percent of nonminorities). Bates compares active
versus discontinued firms owned by Asian immigrants and finds that
those that remained active over a five-year period averaged more than
$62,000 in startup capital, compared with less than $16,000 for discon-
tinued firms.High levels of capitalization among Asian firms may be related to
differential selection into business ownership, family and coethnic
resources, and the types of firms that they create. Differences in types
of firms, however, do not appear to explain much of the differences.
Higher levels of startup capital among Asian and other minority firms
than among white firms are consistent across most industry sectors
(U.S. Census Bureau 1997). Even in services and retail, where Asians
are disproportionately located, Asians use higher-than-average levelsof startup capital. Asians are more reliant on personal and family eq-
uity and borrowed capital than whites. While Asians have similar
wealth levels as whites, they turn that wealth into higher levels of start
up capital, both equity (nonborrowed) and debt capital (borrowed).
Furthermore, they leverage their wealth into higher levels of borrow-
ing by both the owner (for example, through personal loans and credit
cards) and the firm (such as business loans). The next question then is
how much higher levels of startup capital explain better average out-
comes among Asian-owned businesses than white-owned businesses.
Industry Differences
As mentioned in chapter 3, firms located in certain industries tend to
have higher turnover rates than firms located in other industries (most
notably retail and services). And those with higher capital require-
ments for entry, such as manufacturing and wholesale trade, typically
have lower turnover rates and higher average sales. Table 5.4 showsthe industry distribution of white- and Asian-owned firms. Asian firms
are much less frequently found in the construction industry than white
firms, even though their wealth and capital access appear to be on
Why Are Asian-Owned Businesses More Successful? 159

8/9/2019 Race and Entrepreneurial Success - Black , Asian, And White Owned Business in the United States
http://slidepdf.com/reader/full/race-and-entrepreneurial-success-black-asian-and-white-owned-business 173/253
par with whites. Asians are slightly more likely to be found in the
wholesale industry, which is also characterized by higher capital
requirements for entry. Even within this industry, Asians use higher-
than-average levels of startup capital (U.S. Census Bureau 1996).
Asians are much more likely to be found in the retail trade sector,
with one quarter of Asian firms locating in this industry. This com-
pares with 15 percent of white firms. There has been some concern in
the literature that the concentration of Asians in the retail industryreflects less than optimal opportunities in salaried employment, espe-
cially for minorities (Kassoudji 1988; Borjas 1994; Bates 1997; Mar
2005). Yet Asians firms are about equally likely as white firms to be in
the personal services industry with about 26 percent of each group
locating in this industry. They are also about equally likely to be
located in professional services, with 18.8 percent of Asian firms and
19.3 percent of white firms locating there. Thus, it appears that the con-
cern that minority firms are limited to certain industries because of capital constraints does not appear to hold for Asians. The apparent
dearth of Asian-owned firms in the construction industry is probably
due in part to preferences or to industry-specific knowledge and expe-
Table 5.4
Industry distribution by race, Characteristics of Business Owners (1992)
White-
OwnedFirms
Asian-
OwnedFirms
Agricultural services 2.7% 2.1%
Construction 12.5% 3.9%
Manufacturing 3.4% 3.5%
Wholesale trade 3.6% 3.9%
Retail trade 14.7% 25.0%
Finance, insurance, and real estate 10.1% 8.7%
Transportation, communications, and public utilities 3.9% 4.2%
Personal services 25.9% 25.9%
Professional services 19.3% 18.8%
Uncoded industry 3.9% 4.0%
Sample size 15,872 6,321
Notes: (1) The sample includes businesses that are classified by the IRS as individual pro-prietorships or self-employed persons, partnerships, and subchapter S corporations, havesales of $500 or more, and have at least one owner who worked at least twelve weeksand ten hours per week in the business. (2) All estimates are calculated using sampleweights provided by the Characteristics of Business Owners.
160 Chapter 5

8/9/2019 Race and Entrepreneurial Success - Black , Asian, And White Owned Business in the United States
http://slidepdf.com/reader/full/race-and-entrepreneurial-success-black-asian-and-white-owned-business 174/253
rience. Another explanation may be that it is an industry in which
there are considerable entry barriers created by existing networks and
discrimination against outsiders.
Hours Worked
Are Asian-owned businesses more successful than white-owned busi-
nesses because Asian owners typically work long hours? Bates (1997)
finds that the relative success of Asian immigrant firms disappears
after adjusting for the number of hours worked by the owner. As pre-
viously discussed in chapter 3, we are concerned about including hours
worked in the regression models or using them to create adjusted out-come measures, such as firm profits or sales per hour, because it
assumes away the possibility that limited demand for products and
services is responsible for why some business owners work less than
full-time. We would be implicitly assuming that all business owners
work their desired amount of hours, which is unlikely to be the case.
Even with these concerns, it is useful to examine whether Asian
owners work more hours on average than other owners. We are espe-
cially interested in focusing on whether Asian owners are more likelyto work long hours exceeding forty hours per week. Published esti-
mates from the CBO indicate that Asian and other minority owners
are slightly less likely than owners of all firms to report working forty-
one to forty-nine hours per week and are slightly more likely to report
working fifty to fifty-nine hours per week, compared with white firms
(figure 5.4). The main difference is that Asian owners are more likely to
work sixty hours or more: 22 percent of Asian owners work sixty or
more hours per week compared with 14 percent of white owners.
However, differences in the other categories are not large, and owners
working very long hours represent a small fraction of all Asian busi-
ness owners.
Examining sales by hours worked illustrates that Asian and other
minority firms have better sales outcomes than whites-owned firms
for each level of hours worked in the business. This implies that long
hours are not the driving force behind the better outcomes of Asian-
owned businesses. As shown in figure 5.5, Asian-owned businesses
are more likely to have revenues of $100,000 or more in every hoursworked category, not just at the higher end of the distribution. Pre-
vious researchers have noted that business owners have more flexibil-
ity in hours worked and are often willing to work more given a certain
Why Are Asian-Owned Businesses More Successful? 161

8/9/2019 Race and Entrepreneurial Success - Black , Asian, And White Owned Business in the United States
http://slidepdf.com/reader/full/race-and-entrepreneurial-success-black-asian-and-white-owned-business 175/253
Figure 5.4
Hours worked by owner by race, published estimates from the Characteristics of Busi-ness Owners (1992)
Figure 5.5
Firms with $100,000 or more in sales by race and hours worked (percent), published esti-mates from the Characteristics of Business Owners (1992)
162 Chapter 5
8/9/2019 Race and Entrepreneurial Success - Black , Asian, And White Owned Business in the United States
http://slidepdf.com/reader/full/race-and-entrepreneurial-success-black-asian-and-white-owned-business 176/253
return (Portes and Zhou 1996), suggesting that the long hours may be
in response to significant demand for their goods or services and thus
an indicator of success. Overall, Asian business owners may be more
likely to work very long hours (sixty or more hours per week), but this
represents only a fraction of Asian firms and even for this group, Asian
firms perform better than white firms.
Asian Subgroups
Before turning to the explanations for why Asian-owned businesses
outperform white-owned businesses on average, we address the issue
of why we focus on Asian-owned businesses in general rather than onAsian immigrants or specific Asian subgroups. Many previous studies
of Asian business ownership delineate immigrants from nonimmi-
grants. U.S.-born Asians and Asian immigrants may face different
opportunities in the labor market and thus have different motives for
entering business, ultimately leading to different business outcomes.
While we analyze Asian immigrants separately from U.S.-born Asians,
the results reported here are for all Asians. This is due to finding simi-
lar business outcomes for the two groups and limitations of releasingdetailed tables through the Census Bureau’s strict disclosure process
for confidential and restricted-access data. Roughly 80 percent of
Asian-owned businesses in the United States are owned by Asian
immigrants. Therefore, the estimates of Asian business outcomes
reported in chapter 2 and in this chapter are being driven primarily by
businesses owned by Asian immigrants.
When comparing businesses owned by Asian immigrants and non-
immigrants, we find similar business outcomes. Figure 5.6 reports the
distribution of sales by immigrant status for Asian and other minority
firms from published 1992 CBO data. Estimates from the 1992 CBO in-
dicate that about 23 percent of Asian and other minority immigrant
firms have employees, compared with 22 percent of those who were
U.S. born. While the U.S.-born-owned firms are more heavily repre-
sented in the less than $5,000 category, the other differences in sales’
distributions were not large across immigrant and nonimmigrant
firms.
In our subsample of active firms from CBO microdata, business out-comes are remarkably similar between Asian immigrant and nonimmi-
grant firms. The percentages of firms that have employees or profits of
at least $10,000 are virtually identical. Immigrant firms are slightly less
Why Are Asian-Owned Businesses More Successful? 163

8/9/2019 Race and Entrepreneurial Success - Black , Asian, And White Owned Business in the United States
http://slidepdf.com/reader/full/race-and-entrepreneurial-success-black-asian-and-white-owned-business 177/253
likely to close, but the difference is small. There are some differences,
however, in the owner characteristics of immigrants and Asians who
were born in the United States. For example, those who were born in
the United States are younger and less likely to be married. They are
also more likely to start businesses with little or no financial capital,
more likely to have a family member who owned a business, and
more likely to have worked for that business. Overall, however, Asianimmigrant and U.S.-born owners are fairly similar, and the mean char-
acteristics for all Asian firms are roughly similar to the mean character-
istics for Asian immigrant firms.
Previous research using older CBO data yields similar outcomes
among businesses owned by Asian immigrants and nonimmigrants.
Using 1987 CBO data, Bates (1997) reports four business outcomes by
immigrant status for Asians that are comparable to the ones we exam-
ine in this chapter. Immigrants are separated into two categories—those with a level of high fluency in English (Asian Indian and
Filipino) and those with a low level of fluency (Korean and Chinese)—
and are compared with nonimmigrant Asian Americans. The survival
Figure 5.6
Sales and receipts by immigrant status for Asian and other minority-owned businesses,published estimates from the Characteristics of Business Owners (1992)
164 Chapter 5
8/9/2019 Race and Entrepreneurial Success - Black , Asian, And White Owned Business in the United States
http://slidepdf.com/reader/full/race-and-entrepreneurial-success-black-asian-and-white-owned-business 178/253
rates of firms in all three categories are virtually identical, ranging from
81.9 to 82.2 percent. While sales, employment, and profits are also sim-
ilar, there are some slight variations. Koreans and Chinese average 1.7
employees, while nonimmigrant Asian Americans and high-fluency
immigrants average 1.2 employees. Koreans and Chinese have the
highest levels of sales but rank in the middle in terms of profits. In esti-
mating regressions predicting firm survival, Bates also finds that both
Asian immigrants and Asian nonimmigrant firms have higher rates of
survival than white firms. The difference between Asian immigrants
and nonimmigrants is relatively small and not statistically significant.
Census data on self-employed business owners from the 2000 Pub-
lic Use Microdata Sample File (PUMS) provide additional supportfor grouping Asian immigrants and nonimmigrants together. Self-
employed immigrants and nonimmigrants have nearly identical earn-
ings at $53,400 and $56,600, respectively. Asian immigrants work
slightly more hours in a given week but work nearly identical numbers
of weeks during the year. While Asian immigrants are more likely to
have dropped out of high school, the percentage that graduated from
college is nearly identical to that of U.S.-born Asians. About 21 percent
of immigrants have postgraduate education, compared with 23.5 per-cent of U.S.-born Asians. Interest income, which is often used as a
proxy for wealth, is also similar for immigrants and nonimmigrants.
Thus, while several previous studies delineate immigrants from non-
immigrants, these various data sources indicate that there are more
similarities than differences in business outcomes and combining the
two groups for our analyses may not be problematic.
A similar issue is grouping Asians from different countries of origin.
Many previous studies of Asian self-employment have focused on a
specific subgroup of Asians, such as Japanese Americans (Light 1972;
Bonacich and Modell 1980), Chinese Americans (Bates 1997), and Ko-
rean Americans (Min 1988; Bates 1994; Yoon 1991, 1995). As discussed
in chapter 2, differences in business outcomes exist across Asian sub-
groups, but the differences are relatively small when compared with
differences between Asians and whites or blacks. Table 5.5 expands on
these findings by reporting business outcomes from CBO microdata
for the largest Asian subgroups. Comparing the various outcome mea-
sures, we do not find evidence that one subgroup outperforms theothers across all measures. The results presented in chapter 2 from the
2002 SBO indicate similarly positive business outcomes across almost
all of the larger Asian subgroups.
Why Are Asian-Owned Businesses More Successful? 165

8/9/2019 Race and Entrepreneurial Success - Black , Asian, And White Owned Business in the United States
http://slidepdf.com/reader/full/race-and-entrepreneurial-success-black-asian-and-white-owned-business 179/253
We also experimented with business outcome regressions with
detailed Asian subgroup dummies and find that the coefficients on
these dummies are not statistically significant for any of the subgroups.
This result is consistent with Bates (1997), who includes dummies
for Asian Indian, Chinese, Korean, and Vietnamese in his survivalregressions—none of which are statistically significant. Providing ad-
ditional support of our grouping Asian subpopulations, Boyd (1991)
finds that there are not statistically significant differences in self-
employment earnings between Asian subgroups, such as Chinese, Jap-
anese, Korean, Asian Indian, Filipino, Vietnamese, and other Asians.
Given that the goal of this chapter is to compare the relative perfor-
mance of Asian-owned businesses with that of whites, combining these
subgroups seems reasonable.In working with confidential data for this chapter, we were limited
in the number of tabulations and regressions we could get released
through the Census Bureau’s lengthy disclosure process. This restric-
tion limited our ability to conduct an extensive analysis delineating
Asians by immigrant status or subgroup. Because our focus is on the
outcomes of businesses and not the selection process into business
ownership, we are interested in explaining the relative success of
Asians as a group, whether they are immigrants or native born and
irrespective of their country of origin. Further work examining these
subpopulations will make a valuable contribution in better under-
standing this population, but it is beyond the scope of this chapter.
Table 5.5
Business outcomes among detailed Asian groups, Characteristics of Business Owners(1992)
Percentage
AllAsianFirms
AsianIndianFirms
ChineseFirms
JapaneseFirms
KoreanFirms
OtherAsianFirms
Closure rate from 1992 to 1996 17.9% 12.4% 17.2% 16.1% 20.1% 20.8%
Net profit of $10,000 or more 29.9 38.8 29.4 26.8 31.8 26.3
Hire 1 or more employees 38.0 43.2 35.3 45.7 50.7 28.1
Notes: (1) The sample includes businesses that are classified by the IRS as individual pro-
prietorships or self-employed persons, partnerships, and subchapter S corporations, havesales of $500 or more, and have at least one owner who worked at least twelve weeksand ten hours per week in the business. (2) All estimates are calculated using sampleweights provided by the Characteristics of Business Owners.
166 Chapter 5
8/9/2019 Race and Entrepreneurial Success - Black , Asian, And White Owned Business in the United States
http://slidepdf.com/reader/full/race-and-entrepreneurial-success-black-asian-and-white-owned-business 180/253
Identifying the Causes of Asian/White Differences in Business
Outcomes
Asian business owners are more educated and use more startup capi-
tal, on average, than white business owners. To identify whether these
differences, among others, can explain why Asian-owned businesses
are more successful than white-owned businesses, we employ the
same decomposition method used in chapter 4. This method, attrib-
uted to Blinder (1973) and Oaxaca (1973), decomposes racial differ-
ences in mean outcomes into those due to different observable
characteristics (or endowments) between racial groups and those due to
different effects of characteristics (or coefficients) of groups. We modifytheir technique to reflect the logit regressions that we use for our three
binary outcomes of business performance (Fairlie 2005a). An extensive
description of the technique is provided in chapter 4.
Table 5.6 reports estimates from this procedure for decomposing the
Asian/white gaps in business outcomes. The separate contributions
from racial differences in each set of independent variables are
reported. Based on the concerns noted in the previous literature re-
garding potential endogeneity, we report decomposition results for themain owner and firm characteristics first and decomposition results
that include startup capital and industry second. The means of all inde-
pendent variables are reported in table 5.A.
Racial differences in the male and female composition of firms plays
only a small role in explaining differences in outcomes with the excep-
tion of profits, in which case it explains 5.5 percent of the Asian/white
gap. Marital status differences explain 3.9 percent of the gap in em-
ployment and 4.7 percent of the gap in profits but few of the other out-
comes. In our sample, 82 percent of the Asian owners were married,
compared with 77 percent of white owners.
Education plays a major role in explaining the Asian/white gap in
outcomes. It explains 16 percent in both the profits and employer spec-
ifications, 24.2 percent in the closure specification, and 6.8 percent in
the sales specification. These results indicate that a large part of the
success of Asian-owned firms can be attributed to their higher educa-
tion levels relative to whites. More than 22 percent of Asian owners
have a postcollege education, compared with about 14 percent of whites, and nearly a quarter of Asian owners have a college degree,
compared with 20 percent of whites. This holds true for both U.S.-born
Asians and Asian immigrants.
Why Are Asian-Owned Businesses More Successful? 167

8/9/2019 Race and Entrepreneurial Success - Black , Asian, And White Owned Business in the United States
http://slidepdf.com/reader/full/race-and-entrepreneurial-success-black-asian-and-white-owned-business 181/253
Table 5.6
Decompositions of Asian/White gaps in small business outcomes, Characteristics of Business (1992)
Specification
(1) (2) (3) (4)
Dependent variable Closure Profits Employer Ln Sales
Asian mean 0.1896 0.3627 0.2628 10.6963
White mean 0.2282 0.3008 0.2065 10.0680
Asian/white gap 0.0386 0.0619 0.0562 0.6283
Contributions from racial differences in:
Sex 0.0006
1.6%
0.0034
5.5%
0.0004
0.8%
0.0141
2.2%Marital status 0.0003
0.9%0.0029
4.7%0.0022
3.9%0.0107
1.7%
Education 0.009324.2%
0.009916.0%
0.009116.2%
0.04296.8%
Region 0.00051.4%
0.021735.0%
0.00193.3%
0.064710.3%
Urban 0.00328.4%
0.009615.5%
0.007413.1%
0.02133.4%
Prior work experience 0.0028
7.2%
0.0144
23.2%
0.0084
14.9%
0.0377
6.0%Prior work experience in a managerialcapacity
0.00000.0%
0.00030.4%
0.00020.4%
0.00090.1%
Prior work experience in a similar business 0.00133.5%
0.00233.8%
0.00101.8%
0.01282.0%
Have a self-employed family member 0.00143.7%
0.00101.7%
0.00020.4%
0.00320.5%
Prior work experience in a family member’s business
0.00225.8%
0.00182.9%
0.00325.8%
0.02043.2%
Inherited business 0.0002
0.6%
0.0009
1.5%
0.0009
1.5%
0.0048
0.8%
All included variables 0.005213.4%
0.055589.7%
0.005810.3%
0.157425.1%
Notes: (1) The samples and regression specifications are the same as those used in table3.6. (2) Contribution estimates are mean values of the decomposition using 1,000 sub-samples of whites. See the text for more details.
168 Chapter 5

8/9/2019 Race and Entrepreneurial Success - Black , Asian, And White Owned Business in the United States
http://slidepdf.com/reader/full/race-and-entrepreneurial-success-black-asian-and-white-owned-business 182/253
Regional differences also play a role in explaining the higher profits
(35 percent) and sales (10.3 percent) of Asian-owned businesses.
Nearly 50 percent of Asian-owned firms are located in the Pacific re-
gion. Perhaps many of these firms have a wider market or trade rela-
tions with Asian countries. Region explains very little of the other two
outcome variables, however. Urbanicity explains more than 15 percent
of the Asian/white gap in profits. It also explains 8.4 percent of the gap
in closure rates and 13.1 percent of the employer gap but just 3.4 per-
cent of the gap in the log of sales. Nearly 95 percent of Asian-owned
firms are located in urban areas, compared with about three quarters
of white-owned firms. Locating in an urban area might also indicate a
broader market area with greater growth potential.Variations in previous work experience explain between 6 and 23
percent of the gaps in business outcomes. As shown in chapter 3, the
estimated effects of prior work experience vary somewhat across out-
come measures, although we find some evidence suggesting that indi-
viduals with twenty or more years of prior work experience and
owners with very little previous work experience have worse out-
comes, on average. Owners with long prior work experience may have
moved into business ownership as a response to job loss (Farber 1999;Fairlie and Krashinsky 2005) or for lifestyles changes, while owners
with very little experience may encounter difficulties identifying good
business opportunities. Asian owners are more likely to have low
levels of prior work experience and are less likely to have very high
levels of prior work experience than white owners. It appears that
lower incomes by the most experienced outweigh those of the least ex-
perienced, as variations in previous work experience explain between
6 and 23 percent of the gaps in business outcomes. It was most impor-
tant in the profits outcome, which could indicate that very experienced
business people are entering business ownership for lifestyle reasons
rather than for profit motives.
Similar business experience and working in a family member’s busi-
ness actually increase the gaps. In other words, Asians have disadvan-
taged levels of these characteristics compared with whites. From tables
5.1 and 5.2, recall that Asians are less likely to have work experience in
a family member’s business prior to starting a firm and are less likely
to have previously worked in a business with similar goods and ser-vices. If Asian owners had similar levels of theses characteristics as
white owners then their businesses would be predicted to perform
even better.
Why Are Asian-Owned Businesses More Successful? 169
8/9/2019 Race and Entrepreneurial Success - Black , Asian, And White Owned Business in the United States
http://slidepdf.com/reader/full/race-and-entrepreneurial-success-black-asian-and-white-owned-business 183/253
Managerial experience does not contribute to the racial differences in
outcomes. In all cases, it is less than one half of 1 percent. Likewise,
inheritances contribute very little to the gaps, which is consistent with
our previous finding for black firms in chapter 4. The incidences of
inheritances are too infrequent and the racial differences in inheritances
are too small to result in inheritances contributing much to differences
in business outcomes.
Our next decomposition includes the contributions from racial differ-
ences in both startup capital and industry. These results are reported in
table 5.7. The contributions of the variables in the previous decomposi-
tion are similar to those in this decomposition. Racial differences in ed-
ucation continue to be important in explaining the Asian/white gapsin business outcomes. The inclusion of controls for startup capital and
industry does not change the conclusion that Asian businesses are
more successful partly because of higher education levels. The role of
prior work experience also remains strong, explaining between 7.3 and
21.5 percent of the gaps in business outcomes.
Asian/white differences in business performance do not appear to
be due to industry differences. Although racial differences in industry
concentrations contribute to the gaps in closure, employment, andsales, it works in the other direction for profits. The industry distribu-
tion of Asian firms is less favorable for this outcome. Given the incon-
sistency of results across different outcomes, industry differences do
not appear to contribute substantially to why Asian firms perform bet-
ter on average than white firms.
Startup capital plays the most substantial role in explaining the gaps.
Group differences in startup capital explain 57 percent of the gap in
the log sales equation, 65 percent of the closure equation, 71 percent
of the gap in the profit equation, and 100 percent of the gap in the em-
ployer equation. Fewer than 5 percent of white owned firms were
started with more than $100,000 in capital, compared with 12 percent
of Asian-owned firms. Also, nearly a quarter of Asian-owned firms
were started with $25,000 to 100,000, compared with just 11 percent of
firms owned by whites. Although more than 60 percent of white-
owned firms were started with less than $5,000 in capital, only 36 per-
cent of Asians did so. Clearly, firms with higher levels of startup
capital are associated with more successful business outcomes. Thecontribution of higher levels of startup capital among Asian-owned
businesses to their relative success is even larger than the contribution
of lower levels of startup capital among black-owned businesses to
their lower average outcomes.
170 Chapter 5

8/9/2019 Race and Entrepreneurial Success - Black , Asian, And White Owned Business in the United States
http://slidepdf.com/reader/full/race-and-entrepreneurial-success-black-asian-and-white-owned-business 184/253
Table 5.7
Decompositions of Asian/White gaps in small business outcomes, Characteristics of Business Owners (1992)
Specification
(1) (2) (3) (4)
Dependent variable Closure Profits Employer Ln Sales
Asian mean 0.1890 0.3637 0.2651 10.7037
White mean 0.2281 0.3003 0.2066 10.0615
Asian/white gap 0.0391 0.0635 0.0585 0.6422
Contributions from racial differences in:
Sex 0.0004
1.1%
0.0020
3.1%
0.0002
0.3%
0.0127
2.0%Marital status 0.0005
1.2%0.0027
4.3%0.0012
2.1%0.0084
1.3%
Education 0.010326.3%
0.00619.6%
0.009716.6%
0.05067.9%
Region 0.00010.2%
0.023537.0%
0.00142.4%
0.086113.4%
Urban 0.00153.8%
0.012619.8%
0.00284.8%
0.03856.0%
Prior work experience 0.0035
8.9%
0.0137
21.5%
0.0090
15.5%
0.0472
7.3%Prior work experience in a managerialcapacity
0.00102.5%
0.00010.2%
0.00030.5%
0.00010.0%
Prior work experience in a similar business 0.00184.5%
0.00284.4%
0.00152.5%
0.01322.1%
Have a self-employed family member 0.00112.9%
0.00000.1%
0.00050.9%
0.00580.9%
Prior work experience in a family member’s business
0.00143.5%
0.00121.9%
0.00203.4%
0.01231.9%
Inherited business 0.0000
0.0%
0.0008
1.3%
0.0004
0.8%
0.0028
0.4%
Startup capital 0.025565.3%
0.045271.1%
0.0697119.2%
0.363756.6%
Industry 0.003910.0%
0.00619.6%
0.009616.4%
0.03575.6%
All included variables 0.037395.5%
0.0946149.0%
0.0941160.9%
0.620696.6%
Notes: (1) The sample and regression specifications are the same as those used in table3.14. (2) Contribution estimates are mean values of the decomposition using 1,000 sub-
samples of whites. See the text for more details.
Why Are Asian-Owned Businesses More Successful? 171

8/9/2019 Race and Entrepreneurial Success - Black , Asian, And White Owned Business in the United States
http://slidepdf.com/reader/full/race-and-entrepreneurial-success-black-asian-and-white-owned-business 185/253
Overall, racial differences in the explanatory variables explain a large
percentage of the total Asian/white gaps in business outcomes, espe-
cially when startup capital is included. In the second set of specifica-
tions, the gaps in profits and employer status are fully explained, and
less than 5 percent of the gaps in the closure and sales equations are
left unexplained. Startup capital plays the strongest role, followed by
education and prior work experience.
Conclusions
Estimates from the CBO indicate that Asian-owned businesses have
better average outcomes than white-owned businesses. Asian firms are16.9 percent less likely to close, 20.6 percent more likely to have profits
of at least $10,000, and 27.2 percent more likely to hire employees than
white firms. They also have mean annual sales that are roughly 60 per-
cent higher than the mean sales of white-owned firms. These differ-
ences imply that Asian firms are also substantially more successful on
average than are African American firms.
Asian business owners have relatively high levels of education: 46
percent of Asian business owners have a college degree, comparedwith 33 percent of white business owners. Asian business owners are
also found to have very high levels of startup capital. Estimates from
the CBO indicate that 12 percent of Asian-owned businesses started
with more than $100,000 in capital, compared with only 5 percent of
white-owned firms. In contrast to these results, we find that Asian
business owners do not have advantaged family-business backgrounds
when compared with whites. They are slightly less likely to have had a
self-employed family member prior to starting their business and have
prior work experience in a family member’s business. Similar to white
business owners, a very small percentage of Asian owners inherited
their businesses.
We use a nonlinear decomposition technique to measure the con-
tribution of racial differences in firm and owner characteristics to dif-
ferences in business outcomes between Asian- and white-owned
businesses. Asian-owned businesses are more successful than white-
owned businesses largely for two reasons: the owners have high levels
of human capital, and the businesses have substantial startup capital.Startup capital and education alone explain from 65 percent to the en-
tire gap in business outcomes between Asians and whites. Racial dif-
ferences in prior work experience are also found to be an important
172 Chapter 5

8/9/2019 Race and Entrepreneurial Success - Black , Asian, And White Owned Business in the United States
http://slidepdf.com/reader/full/race-and-entrepreneurial-success-black-asian-and-white-owned-business 186/253
factor in explaining the Asian/white gaps in business outcomes. Our
results indicate that group differences in prior work experience in fam-
ily businesses do not contribute to Asian/white differences in closure
probabilities, profits, employment, and sales. We also find no explana-
tory power from Asian/white differences in prior work experience in a
similar business in determining racial differences in business outcomes.
Even with the relatively parsimonious models estimated using CBO
data, we can explain virtually the entire gap between the outcomes of
Asian-owned businesses and white-owned businesses. Admittedly, we
do not explore whether other factors such as social capital and addi-
tional ethnic resources are important for the success of Asian-owned
businesses. It is very difficult to find good exogenous measures of thesefactors. Furthermore, although social and ethnic resources may be im-
portant for the success of Asian-owned businesses, they are not easily
affected by policy. Policies that increase human capital and access to
financial capital, such as entrepreneurial training and loan-assistance
programs, are easier to implement and expand.
Appendix
Table 5.A
Means of selected variables, Characteristics of Business Owners (1992)
White-OwnedFirms
Asian-OwnedFirms
Firm no longer operating in 1996 (closure) 0.2282 0.1785
Net profit of at least $10,000 0.3004 0.3800
One or more paid employees 0.2067 0.2985
Log sales 10.07 10.71
Female-owned business 0.3268 0.3070
Married 0.7650 0.8200
Never married 0.1020 0.1010
High school graduate 0.2651 0.1590
Some college 0.3123 0.2482
College graduate 0.1962 0.2423
Graduate school 0.1353 0.2219
Northeast 0.0643 0.0221
Midatlantic 0.1469 0.1720East North Central 0.1666 0.0699
West North Central 0.0847 0.0163
Why Are Asian-Owned Businesses More Successful? 173

8/9/2019 Race and Entrepreneurial Success - Black , Asian, And White Owned Business in the United States
http://slidepdf.com/reader/full/race-and-entrepreneurial-success-black-asian-and-white-owned-business 187/253
Table 5.A
(continued)
White-
OwnedFirms
Asian-
OwnedFirms
South Atlantic 0.1597 0.1081
East South Central 0.0518 0.0121
West South Central 0.0999 0.0792
Mountain 0.0670 0.0327
Urban 0.7351 0.9467
Prior work experience: 1 year 0.0707 0.0946
Prior work experience: 2 to 5 years 0.1641 0.2255
Prior work experience: 6 to 9 years 0.1507 0.1607
Prior work experience: 10 to 19 years 0.2973 0.2474
Prior work experience: 20 years or more 0.2578 0.1313
Prior work experience in a managerial capacity 0.5552 0.5643
Prior work experience in a similar business 0.5030 0.4685
Have a self-employed family member 0.5231 0.4434
Prior work experience in a family member’s business 0.2352 0.1796
Inherited business 0.0148 0.0132
Startup capital: $5,000 to $24,999 0.2374 0.2804
Startup capital: $25,000 to $99,999 0.1095 0.2412
Startup capital: $100,000 and over 0.0475 0.1198
Agricultural services 0.0269 0.0207
Mining and construction 0.1261 0.0388
Manufacturing 0.0330 0.0352
Wholesale 0.0360 0.0390
Finance, insurance, and real estate 0.0987 0.0865
Transportation, communications, and public utilities 0.0389 0.0420
Personal services 0.2616 0.2595
Professional services 0.1937 0.1885
Uncoded industry 0.0391 0.0402
Sample size 14,068 6,321
Notes: (1) The sample includes businesses that are classified by the IRS as individual pro-prietorships or self-employed persons, partnerships, and subchapter S corporations, havesales of $500 or more, and have at least one owner who worked at least twelve weeksand ten hours per week in the business. (2) All estimates are calculated using sampleweights provided by the Characteristics of Business Owners.
174 Chapter 5
8/9/2019 Race and Entrepreneurial Success - Black , Asian, And White Owned Business in the United States
http://slidepdf.com/reader/full/race-and-entrepreneurial-success-black-asian-and-white-owned-business 188/253
6 Conclusions and Implications
African Americans are much less likely to own businesses than whites,and their businesses are less successful on average. Only 5.1 percent of
black workers are self-employed business owners compared with 11.1
percent of white workers. Although there is some evidence of rising
black business ownership rates in the past few years, racial disparities
remain large, and a major convergence in business-ownership rates is
unlikely in the near future. In fact, even in light of the substantial gains
blacks have made in education, earnings, and civil rights during the
twentieth century, black self-employment rates remained roughly con-stant relative to white rates.
Although a large number of businesses owned by African Ameri-
cans are very successful, many more struggle with relatively low prof-
its, sales, and employment. The result is that black-owned firms have
lower average revenues and profits, are less likely to hire employees,
and are more likely to close than white-owned firms. The disparities in
these outcomes between black and white firms are quite large. For ex-
ample, average annual sales of black firms are $74,018, which is lessthan one-fifth the level of average sales of white firms. Black-owned
businesses are more successful now than they were in the past, but
their average performance relative to white-owned businesses has not
improved over the past two decades.
In contrast to these patterns, Asian Americans have high rates of
business ownership, and Asian-owned businesses typically have better
average outcomes than white-owned businesses. In the past few years,
slightly more than 11 percent of Asian workers are self-employed busi-
ness owners, which is comparable to the rate of business ownershipamong whites. Asian-owned firms are 16.9 percent less likely to close,
20.6 percent more likely to have profits of at least $10,000, and 27.2
percent more likely to hire employees than white-owned firms.

8/9/2019 Race and Entrepreneurial Success - Black , Asian, And White Owned Business in the United States
http://slidepdf.com/reader/full/race-and-entrepreneurial-success-black-asian-and-white-owned-business 189/253
These large racial disparities in business ownership and outcomes
are troubling because they are both a symptom and cause of broader
economic inequality. We should be especially concerned about the
implications for income and wealth inequality because business own-
ership provides the primary source of income for one out of ten Amer-
icans and business owners hold nearly 40 percent of total U.S. wealth
(Bucks, Kennickell, and Moore 2006). Successful business ownership
among disadvantaged minorities is also important for job creation,
economic development, political power, and economic efficiency.
The lack of business ownership among African Americans and
worse outcomes among black-owned businesses contribute substan-
tially to overall earnings and wealth inequality. We estimate that totalearnings inequality would drop by roughly 20 percent if black business
ownership and performance improved to white levels. The impact of
improving black business outcomes may reduce wealth inequality
even more over the long run. Both black and white entrepreneurs have
higher savings rates and accumulate more wealth than their counter-
parts working in the wage and salary sector (Bradford 2003).
The potential benefits of minority-owned businesses in terms of mi-
nority employment are also very important. The 3.9 million minority-owned firms in the United States hire 4.6 million employees. Many of
these firms are located in predominately minority communities. In
fact, more than 40 percent of black and Latino employer firms hire at
least 90 percent minority employees (U.S. Census Bureau 1997), and
64 percent of the workforce of fast-growing black firms (‘‘gazelles’’)
is black (Boston 2003, 2006a).1 It has been argued that promoting
minority-business growth may be a more effective method of reducing
minority unemployment than overall economic and employment
growth (Boston 1999b). Making the conservative assumption that half
of all employees at minority-owned firms are minorities, an increase in
both the number of minority-owned firms and the average number of
employees per firm by only 10 percent could result in nearly 1 million
new jobs for minorities. An increase of 1 million jobs would be signifi-
cant given there are roughly 3 million minorities currently unem-
ployed in the United States (U.S. Bureau of Labor Statistics 2007).
Given the consequences of racial disparities in business ownership
and outcomes, it is important to understand why these patterns exist.Why are African Americans less likely to start businesses, and why are
their businesses less successful on average than white-owned busi-
nesses? Why do Asian-owned businesses, in contrast, have high rates
176 Chapter 6

8/9/2019 Race and Entrepreneurial Success - Black , Asian, And White Owned Business in the United States
http://slidepdf.com/reader/full/race-and-entrepreneurial-success-black-asian-and-white-owned-business 190/253
of ownership and survivability and relatively high profits, employ-
ment, and sales compared with businesses owned by other groups? Al-
though an extensive literature examines the causes of racial differences
in business ownership, few studies explore the causes of racial differ-
ences in business outcomes, especially using business-level data. A bet-
ter understanding of why businesses owned by some groups tend to
outperform those owned by other groups is important.
Using confidential and restricted-access microdata from the Charac-
teristics of Business Owners (CBO), we explore the factors associated
with business success and the potential causes of racial disparities in
closure rates, profits, employment, and sales. The detailed information
on owner and business characteristics contained in the CBO microdataallows us to identify several key determinants of small business out-
comes and underlying causes of racial disparities in business outcomes
in the United States. We focus on the factors suggested by economic
theory as being the most important for business success.
Three major barriers to successful minority businesses are revealed.
First, the relative success among Asian-owned businesses and lack of
success among black-owned businesses is partly due to high levels of
startup capital among Asian firms and low levels of startup capitalamong black firms. Lower levels of startup capital among blacks ap-
pear to be partly due to low levels of personal wealth and possibly
also lending discrimination. Second, relatively disadvantaged family-
business backgrounds among black business owners contribute to
worse outcomes. The lack of prior work experience in a family busi-
ness among black business owners appears to limit their acquisition of
general and specific business human capital useful for running success-
ful businesses. Finally, other forms of human and business human cap-
ital, such as education and prior work experience in a related business,
appear to limit the potential for business success among blacks. In con-
trast, highly educated owners are one of the main reasons behind the
success of Asian-owned business in the United States. We discuss each
of these explanations in more detail.
Financial Capital
The level of startup capital invested in the business is strongly associ-ated with business success. Estimates from the CBO indicate that firms
with higher levels of startup capital are less likely to close, have higher
profits and sales, and are more likely to hire employees. The estimated
Conclusions and Implications 177

8/9/2019 Race and Entrepreneurial Success - Black , Asian, And White Owned Business in the United States
http://slidepdf.com/reader/full/race-and-entrepreneurial-success-black-asian-and-white-owned-business 191/253
positive relationship may be due to the inability of some entrepreneurs
to obtain the optimal level of startup capital because of liquidity con-
straints. In this case, differences in startup capital may be due to differ-
ences in the personal wealth of the entrepreneur because this wealth
can be invested directly in the business or used as collateral to obtain
business loans. The positive relationship, however, may alternatively
be due to potentially successful business ventures being more likely to
attract startup capital than business ventures that are viewed as being
potentially less successful. We provide some evidence from the litera-
ture suggesting that this alternative explanation is likely to be less im-
portant in explaining racial differences in business outcomes.
Personal wealth among African Americans is one eleventh that of whites. The median level of net worth, defined as the current value of
all assets minus all liabilities on those assets, for black households is
only $6,166 compared to $67,000 for white households. These figures
imply that half of all black households have less than $6,166 in total
wealth. Part of these disparities in wealth are due to blacks being less
likely to own homes, having lower home values, and having lower
equity to debt ratios in their homes. Recent research also indicates
that black businesses may face lending discrimination (Blanchflower,Levine, and Zimmerman 2003; Cavalluzzo, Cavalluzzo, and Wolken
2002) and that blacks may have less access to family wealth through
inheritances, loans, and equity investments. All of these factors may
contribute to the substantially lower levels of startup capital among
black business owners than among white business owners. Fewer than
2 percent of black firms start with $100,000 or more of capital, and 6.5
percent have between $25,000 and $100,000 in startup capital. Nearly
two thirds of black businesses have less than $5,000 in startup capital.
Although a large number of white firms also start with little capital, a
much greater percentage start with large amounts of capital.
In contrast to the black experience, Asians have high levels of wealth
and invested capital. The median level of net worth for Asian house-
holds is roughly similar to the white level of net worth. Asian busi-
nesses, however, start with substantially higher levels of capital. For
example, 12 percent of Asian-owned firms have startup capital of
$100,000 or more compared with fewer than 5 percent of white-owned
firms.Using a special statistical technique that accounts for the contribu-
tions of additional factors such as education, family-business back-
grounds, and prior work experience, we find that racial differences in
178 Chapter 6

8/9/2019 Race and Entrepreneurial Success - Black , Asian, And White Owned Business in the United States
http://slidepdf.com/reader/full/race-and-entrepreneurial-success-black-asian-and-white-owned-business 192/253
startup capital are the single most important factor explaining racial
disparities in business outcomes. Decomposition estimates indicate
that lower levels of startup capital among black firms explain from
14.5 to 43.2 percent of black/white gaps in business outcomes. Higher
levels of startup capital among Asian firms explain an even larger
share of the Asian/white gaps in business outcomes. The primary rea-
son behind Asian firms having lower closure rates and higher profits,
employment, and sales is that they invest more financial capital at
startup than white or black firms.
Family-Business Experience
Our analysis of the CBO microdata reveals new findings on the impor-
tance of the owner’s family-business background in determining busi-
ness ownership and outcomes. More than half of all business owners
had a self-employed family member prior to starting their business.
Conditional on having a self-employed family member, less than half
of small business owners worked in that family member’s business.
On the other hand, we find that only 1.6 percent of all small busi-
nesses in the United States are inherited. These results suggest that thestrong intergenerational links in business ownership found in previous
studies are partly but not entirely driven by opportunities to acquire
both general and specific business human capital from working in
family members’ businesses. Business inheritances and partnerships
with family members appear to play only a minor role.
A thorough examination of the determinants of business outcomes
reveals a more nuanced role for the owner’s family-business back-
ground in contributing to success in business ownership. Simply
having a self-employed family member has no significant effect on
business outcomes. In contrast, working in that family member’s busi-
ness leads to a more successful business. Business outcomes are 15 to
27 percent better if the owner worked in a family business prior to
starting his or her own business.
The rich detail of the CBO microdata also allows us to control for
prior similar business work experience and management experience.
The inclusion of these controls suggests that the positive effects of
working for a self-employed family on small business outcomes arenot simply capturing the effects of management experience or specific
business human capital. Instead, the independent effects of prior work
experience in a family member’s business on business outcomes appear
Conclusions and Implications 179

8/9/2019 Race and Entrepreneurial Success - Black , Asian, And White Owned Business in the United States
http://slidepdf.com/reader/full/race-and-entrepreneurial-success-black-asian-and-white-owned-business 193/253
to be partly due to the acquisition of less formal or more general busi-
ness human capital. Estimates from the regression analysis also indi-
cate that inherited businesses are more successful on average than
noninherited businesses. However, their limited representation among
the population of small businesses suggests that business inheritances
are only a minor determinant of small business outcomes.
Black business owners have a relatively disadvantaged family-
business background compared with white business owners. Black
business owners are much less likely than white business owners to
have had a self-employed family member prior to starting their busi-
nesses and are less likely to have worked in that family member’s busi-
ness. Only 12.6 percent of black business owners had prior workexperience in a family member’s business compared with 23.3 percent
of white business owners. Racial differences and overall rates of busi-
ness inheritances are much smaller: 1.4 percent of black owners and
1.7 percent of white owners inherit their firms.
Using a nonlinear decomposition technique that accounts for the
contributions of additional factors such as education and startup capi-
tal, we find that the lower probability of having a self-employed family
member prior to business startup among blacks than among whitesdoes not generally contribute to racial differences in small business
outcomes. Instead, the lack of prior work experience in family busi-
nesses among future black business owners, perhaps by restricting
their acquisition of general and specific business human capital, limits
the successfulness of their businesses relative to whites. Providing
some additional evidence on the importance of limited opportunities
for acquiring business human capital, racial differences in prior work
experience in similar businesses also consistently explain part of the
gaps in small business outcomes. Furthermore, the combination of
these two factors suggests that racial differences in general opportuni-
ties to acquire business human capital contribute substantially to
black/white differences in small business outcomes. On the other
hand, racial differences in business inheritances are found to explain
virtually none of the gaps in small business outcomes. The overall like-
lihood of business inheritances is just too small to play a major role in
explaining racial differences in business outcomes.
The success of Asian firms does not appear to be due to advanta-geous family-business backgrounds. In fact, estimates from the CBO
indicate that Asian business owners are less likely than white owners
to have a family member who owned a business prior to starting their
180 Chapter 6
8/9/2019 Race and Entrepreneurial Success - Black , Asian, And White Owned Business in the United States
http://slidepdf.com/reader/full/race-and-entrepreneurial-success-black-asian-and-white-owned-business 194/253
business, to have worked for a family business, and to inherit their
business. The differences in having a self-employed family member
and prior work experience in a family business, however, are smaller
than they are between white and black business owners. Estimates
from our decompositions indicate that Asian firms would be even
more successful relative to white firms if they had more similar
family-business backgrounds.
Human Capital
Similar to previous findings from the literature, we find evidence of a
strong positive relationship between the education level of the ownerand business outcomes. The general and specific knowledge and skills
acquired through formal education may be useful for running a suc-
cessful business, and the owner’s level of education may also serve as
a proxy for his or her overall ability or as a positive signal to potential
customers, lenders, or other businesses. The estimated relationships be-
tween owner’s education and small business outcomes are strong even
after controlling for family-business background measures, startup
capital levels, and industries.Although blacks have made substantial gains in education, large ra-
cial disparities remain. For example, only 17.6 percent of black adults
have a college education compared with 28.2 percent of whites.
Marked disparities in education levels reveal themselves among busi-
ness owners as well. Roughly one third of white business owners are
college educated, whereas only one quarter of black business owners
have the same level of education. In stark contrast to these patterns,
Asians have extremely high levels of education. Nearly 50 percent of
Asian adults and 50 percent of Asian business owners have a college
degree.
Lower levels of education among black business owners and higher
levels of education among Asian business owners translate into dispar-
ities in business outcomes. Our decomposition estimates indicate that
differences in owner’s education do not contribute substantially to dis-
parities in business outcomes between black and white firms, but they
do indicate that differences in education contribute to disparities in
business outcomes between Asians and whites. Higher levels of educa-tion are a major reason that Asian-owned businesses are more success-
ful than white-owned businesses and black-owned businesses in the
United States.
Conclusions and Implications 181

8/9/2019 Race and Entrepreneurial Success - Black , Asian, And White Owned Business in the United States
http://slidepdf.com/reader/full/race-and-entrepreneurial-success-black-asian-and-white-owned-business 195/253
Policy Implications
The desire for entrepreneurship is strong around the world. When
individuals are asked whether they would prefer ‘‘being an em-
ployee or being self-employed,’’ a large percentage reported ‘‘self-
employment’’ as their preference (Blanchflower, Oswald, and Stutzer
2001). Slightly more than 70 percent of respondents in the United
States express a desire to be self-employed. In many other countries
(including Germany, Italy, and Canada), more than half of all individ-
uals report a desire for self-employment.2 Interest in self-employment
also appears to be strong among minorities. More than 75 percent of
young blacks report being interested in starting their own businesscompared with 63 percent of young white respondents (Walstad and
Kourilsky 1998).
Although many disadvantaged individuals possess a strong desire
for entrepreneurship, they may ultimately be unsuccessful in running
businesses because of a lack of human capital, business human capital,
or financial capital. In particular, if minority entrepreneurs face con-
straints that limit their optimal level of business ownership or optimal
scale of businesses, such as liquidity constraints, informational barriers,lending discrimination, or customer discrimination, there will be some
efficiency loss in the economy. Although it would be difficult to deter-
mine the level of this loss, barriers to entry and expansion faced by mi-
nority businesses are potentially costly to U.S. productivity, especially
as minorities represent an increasing share of the total population and
possess a strong desire for entrepreneurship.
Many efforts have been made to address these concerns about bar-
riers to entrepreneurship and successful business ownership in the
United States. Policies to promote entrepreneurship and business own-
ership among disadvantaged groups are widespread. For example,
there exist more than 500 nonprofit programs providing loans, train-
ing, or technical assistance to disadvantaged entrepreneurs (Aspen In-
stitute 2005). Several states in the United States also have programs
providing transfers to unemployment insurance recipients (U.S. De-
partment of Labor 1992; Vroman 1997; Kosanovich et al. 2001).3 The
federal government and several states have also promoted self-
employment as a way to leave the welfare rolls (Guy, Doolittle, andFink 1991). New demonstration programs by the U.S. Department of
Labor and SBA provide microenterprise training and assistance as
well as microloans (Bellotti 2006).
182 Chapter 6
8/9/2019 Race and Entrepreneurial Success - Black , Asian, And White Owned Business in the United States
http://slidepdf.com/reader/full/race-and-entrepreneurial-success-black-asian-and-white-owned-business 196/253
The focus of many programs for minority and disadvantaged firms
is on providing more access to financial capital. Perhaps the most well-
known program is the U.S. Small Business Administration’s 7(a) Loan
Program, which is named for section 7(a) of the Small Business Act
and provides government backing on loans by commercial lenders.
The loans are awarded to businesses applying for loans that would
not otherwise receive bank funding. Although the program does not
target minority entrepreneurs, they are disproportionately affected. Of
the 97,000 loans approved for nearly $15 billion in 2006, roughly one
third of the number and dollars went to minority firms (U.S. Small
Business Administration 2007b). Many microlenders also provide
small loans to disadvantaged business owners (Servon 1999; Aspen In-stitute 2005).
The largest government policies aimed at promoting minority busi-
nesses in the United States, however, are affirmative action contracting
and procurement programs.4 During the late 1970s and 1980s, there
was substantial growth in the value of federal, state, and local govern-
ment contracts reserved or set aside for minority-owned businesses.
The purpose of these minority-business contracting programs was to
develop minority enterprise, counter the effects of past discrimination,and reduce unemployment among minorities in urban communities.
These programs originated from government policies that were
designed to strengthen the viability of small businesses. Set-asides
were initially targeted to economically disadvantaged minorities with
the goal of increasing the number of minority-owned firms during the
late 1960s and early 1970s, but they were later expanded to target mi-
nority businesses that had greater future growth potential (Bates
1985). In 2005, small disadvantaged businesses (SDBs) were awarded
$21.7 billion in federal contracts (U.S. Small Business Administration
2007a).
Set-aside programs typically specify a percentage of the number or
total dollar value of government contracts allotted to minority-owned
businesses. In some cases, prime contractors are required to allot a
specified percentage of the total amount of government contracts to
minority-owned subcontractors and suppliers (Rice 1991; Myers 1997).
Many of the programs provide goals for minority participation and
price breaks instead of actually setting aside a certain number of con-tracts for minority-owned businesses. Data on local set-aside programs
listed in Minority Business Enterprise Legal Defense and Education
Fund (1988) indicate that these goals range from 1 to 50 percent, with
Conclusions and Implications 183
8/9/2019 Race and Entrepreneurial Success - Black , Asian, And White Owned Business in the United States
http://slidepdf.com/reader/full/race-and-entrepreneurial-success-black-asian-and-white-owned-business 197/253
most programs having goals of 5 to 15 percent. A large proportion of
the program coverage appears to target the construction sector. Set-
aside programs are also often complemented with procurement offi-
cials who aid minority-owned businesses in obtaining assistance (Bates
and Williams 1993).
Contracting programs exist at the federal, state, city, county, and
special district level. Recently, however, these programs have been
both judicially and legislatively challenged and in many cases dis-
mantled. The constitutionality of government-sponsored set-aside pro-
grams has been seriously questioned in two U.S. Supreme Court
decisions—Richmond v. J. A. Croson Co. (1989) and Adarand Constructors
Inc. v. Pen a (1995). State referendums, such as Proposition 209 in Cali-fornia and Initiative 200 in Washington, further jeopardize the future
of government affirmative action contracting programs. In response,
many minority-business-development programs have disappeared,
and others have shifted focus to disadvantaged-business-enterprise
(DBE) programs.
Although minority-business set-asides represent an extremely large
annual governmental expenditure and are controversial both politi-
cally and judicially, relatively little is known about their effectiveness.Previous research indicates that minority-business-contracting pro-
grams did not always increase utilization, can be costly, and may have
led minority firms to overextend themselves (Myers and Chan 1996;
Bates and Williams 1996; Marion 2007). The literature also indicates,
however, that these programs may have increased the number of mi-
nority contracts and businesses in the United States, especially in the
construction industry (Blanchflower and Wainwright 2005; Chay,
Fairlie, and Chatterji 2005; Enchautegui et al. 1996; Boston 1998; Bates
and Williams 1993). Given the heated debates over these programs, it
is surprising that so little is known about their effects. More research is
clearly needed.
Affirmative action contracting programs may have an impact on
minority-business performance by reducing barriers to entry and ex-
pansion. In particular, the financial constraints identified above may
be relaxed because smaller minority firms can grow through govern-
ment work instead of borrowing from banks or other institutions. Gov-
ernment work may also provide a buffer against economic downturnsin which small businesses may rely heavily on loans and personal
wealth to survive. Given lower levels of wealth and less ability to bor-
row, this could be especially important for minority firms. On the other
184 Chapter 6

8/9/2019 Race and Entrepreneurial Success - Black , Asian, And White Owned Business in the United States
http://slidepdf.com/reader/full/race-and-entrepreneurial-success-black-asian-and-white-owned-business 198/253
hand, government contracting represents a relatively small market
share for minority firms and is focused on specific industries, such as
construction (U.S. Census Bureau 2006a). Furthermore, the current
trend toward reducing and eliminating affirmative action contracting
programs suggests that these programs are likely to have less of an im-
pact in the future.
New Policy Ideas
In light of these findings, future policies promoting minority busi-
nesses need to be creative. Government contracting programs and re-
lated loan programs for minority-owned or disadvantaged businessesare targeted toward alleviating financial constraints, but these pro-
grams do not provide opportunities for obtaining relevant work expe-
rience. Clearly, improving access to capital for minority entrepreneurs
is important, especially in light of the striking wealth inequality that
exists in the United States. However, increasing opportunities for the
acquisition of human capital and business human capital should also
be viewed as vital goals for minority-business development.
Before discussing specific policies ideas, an important distinction isneeded between the goals of increasing the number of minority busi-
nesses and improving the performance of minority businesses. Al-
though several constraints to minority-business ownership have been
identified in the previous literature, it is difficult to know what the
optimal level of business ownership would be given the risky nature
of entrepreneurship. On the other hand, there is no disagreement
over the importance of improving minority business-outcomes: better-
performing businesses unambiguously make minorities better off.
Therefore, we discuss policies that focus on relaxing the constraints to
successful business ownership to address the problem of racial inequal-
ity. Furthermore, the policy ideas discussed below pertain to all disad-
vantaged business owners, not just those from minority groups, and
also may have the broader effect of increasing the number of successful
entrepreneurs in the U.S. economy.
Policies to promote educational attainment in general and among
business owners more specifically would be a good start. The educa-
tional disparities between Asian and black business owners accentuatedisparities in the general population. Asian business owners are found
to be twice as likely to have a college education as black business
owners. But in the general population, nearly half of all Asians have a
Conclusions and Implications 185

8/9/2019 Race and Entrepreneurial Success - Black , Asian, And White Owned Business in the United States
http://slidepdf.com/reader/full/race-and-entrepreneurial-success-black-asian-and-white-owned-business 199/253
college education compared with less than one out of every five blacks.
Programs targeted at increasing educational opportunities for blacks
may result in better business outcomes among black-owned busi-
nesses. These policies are also likely to contribute to reducing income
and wealth inequality, which may further translate into reducing
racial disparities in business outcomes. Wealth inequality may be
directly addressed through expanding asset-building programs such
as financial-education programs, individual development accounts
(IDAs), and first-time home-ownership programs.
Our estimates indicate that blacks are less likely than whites to have
previous work experience in a family member’s business and are less
likely to have previous work experience in a similar business. The rela-tive scarcity of opportunities for acquiring general and specific busi-
ness human capital apparently has a negative effect on the outcomes
of black-owned firms. This finding is important because it suggests
that a potentially effective emphasis for minority or disadvantaged
business-development policies is to provide opportunities for relevant
work experience for would-be entrepreneurs.
A few large national programs provide related mentoring services to
entrepreneurs. For example, the Small Business Administration runsthe Mentor-Protege Program for disadvantaged firms under the 8(a)
Program, which is named for section 8(a) of the Small Business Act.
The program focuses on technical, management, and financial assis-
tance, subcontract support, and assistance in performing prime con-
tracts through joint-venture arrangements. Other federal agencies also
have mentor-protege programs. Another program is provided by the
Service Corps of Retired Executives (SCORE). SCORE volunteers,
who are working or retired business owners, executive, and corporate
leaders, provide free advice and training to entrepreneurs and small
business owners. These programs do not provide opportunities for
would-be entrepreneurs to acquire general and specific business
human capital by working for other business owners. Instead, the
focus is on mentoring entrepreneurs as they start or run their own
businesses.
The findings from our research suggest that governmental programs
providing mentoring, internships, or apprenticeship-type training may
help to reduce historical inequalities in business performance.5 Train-ing programs that are industry-specific, are targeted toward disadvan-
taged groups, and emphasize prior hands-on work experience are
likely to be most useful for providing minority entrepreneurs with
186 Chapter 6

8/9/2019 Race and Entrepreneurial Success - Black , Asian, And White Owned Business in the United States
http://slidepdf.com/reader/full/race-and-entrepreneurial-success-black-asian-and-white-owned-business 200/253
opportunities to acquire business human capital. In addition to the cre-
ation of these programs, the government could play a more active role
in facilitating the placement of potential entrepreneurs in industry jobs
where they would learn relevant skills for running future businesses.
In each case, these policies may serve as a substitute for the lack of
opportunities to work in family businesses for some disadvantaged
groups.
All of these policies may be difficult and costly to implement, but a
shift in the emphasis of entrepreneurial training programs away from
writing business plans and finding capital and toward gaining related
work experience would represent a step in the right direction. Potential
entrepreneurs should be encouraged to find related work experience,especially in small businesses prior to launching new businesses. The
work experience could be in a friend’s or relative’s business or in a sim-
ilar industry as the one for the business idea. In an extreme case, entre-
preneurial training programs could require relevant work experience
as a prerequisite for participation in the program. The results from this
study indicate that the benefits of this type of work experience could
be large in terms of creating successful businesses. Although empha-
sizing the acquisition of relevant prior work experience may be espe-cially valuable for disadvantaged entrepreneurs, it may help any
would-be entrepreneurs in starting successful businesses. Prior indus-
try work experience is one of the main factors considered in loan appli-
cations (U.S. Small Business Administration 2007a), and some potential
entrepreneurs may realize that the initial chosen industry or business
ownership, in general, is not for them.
An important issue is whether family-structure patterns among
blacks may counteract some of the benefits of these policies. One rea-
son that black business owners may be less likely to have a family
member who owns a business and less likely to have worked in that
family member’s business is that relatively large numbers grow up in
single-parent families. Having only one parent at home limits potential
exposure to family businesses, particularly if the absent parent is the
father because men have higher business ownership rates than women.
For the current generation of black business owners, our best estimate
is that more than 20 percent of them grew up in a single-parent family.
Today, more than half of all black children live with only parent. Thesetrends may limit the opportunities available to the current generation
of black children to work in family businesses and acquire business
human capital prior to starting their own businesses later in life.
Conclusions and Implications 187
8/9/2019 Race and Entrepreneurial Success - Black , Asian, And White Owned Business in the United States
http://slidepdf.com/reader/full/race-and-entrepreneurial-success-black-asian-and-white-owned-business 201/253
Progress in business outcomes for future generations of black entrepre-
neurs thus may be dampened by recent trends in family structure.
To break the cycle of low rates of business ownership and relatively
worse business outcomes from being passed from one generation of
blacks to the next, programs that directly address deficiencies in family-
business experience, possibly through an expansion of apprenticeship-
type entrepreneurial training programs, may be needed. More research,
however, is needed on the potential effectiveness of these types of pro-
grams, especially from rigorous evaluations of pilot programs, before a
large-scale investment is made.
In conclusion, racial disparities in business success are a symptom of
broader economic inequality. Policies that are targeted to alleviate bar-riers to raising capital and help people acquire business human capital
through work experience may improve the outcomes of minority-
owned businesses and disadvantaged businesses. More generally, poli-
cies that improve the education and wealth of African Americans and
other disadvantaged groups will likely result in better performing
businesses in the long run. Finally, any policies that increase education,
business human capital, and access to financial capital are likely to in-
crease the number of successful entrepreneurs in the U.S. economy.
188 Chapter 6

8/9/2019 Race and Entrepreneurial Success - Black , Asian, And White Owned Business in the United States
http://slidepdf.com/reader/full/race-and-entrepreneurial-success-black-asian-and-white-owned-business 202/253
Data Appendix
A major challenge for researchers in the area of minority business isfinding data. Few datasets have both large samples of minority-owned
businesses and detailed information on businesses characteristics and
outcomes. It is particularly difficult to find detailed information on the
characteristics of both owners and firms. This is important if we want
to learn more about the relationship between owner characteristics
(such as education and prior work experience) and business perfor-
mance, for example. Many large nationally representative datasets are
based on household surveys such as the Census and Current Popula-tion Survey (CPS), but these datasets include only limited information
on the owner’s business. Household surveys typically include only the
owner’s income from the business and the industry of the business.
Business-level datasets, on the other hand, include more information
on the business but typically include very limited information, if any,
on the characteristics of the owners.
The Characteristics of Business Owners (CBO) is one of the only
datasets that includes both a large sample of minority-owned busi-nesses and detailed owner and firm characteristics. We use this dataset
extensively to explore the owner and firm characteristics that are asso-
ciated with business success, as well as the causes of racial differences
in business outcomes.
In this data appendix, we describe the CBO and the dataset that it is
drawn from—the Survey of Minority-Owned Business Enterprises
(SMOBE). The recently released 2002 Survey of Business Owners
(SBO), which replaced the SMOBE, is also discussed. Published esti-
mates from the SMOBE and SBO are the most commonly cited andused estimates of the state of minority-owned businesses. The CPS is
also described in detail because it provides the most up-to-date esti-
mates of self-employed business ownership rates in the United States.

8/9/2019 Race and Entrepreneurial Success - Black , Asian, And White Owned Business in the United States
http://slidepdf.com/reader/full/race-and-entrepreneurial-success-black-asian-and-white-owned-business 203/253
Unlike business-level data, the CPS includes information on wage
and salary workers allowing one to easily calculate the percentage
of the working population that owns a business, referred to as the
self-employed business-ownership rate. Finally, we discuss a few addi-
tional data sources that can be used to study minority-owned busi-
nesses but are not used extensively in this study.
The Survey of Business Owners (SBO) and the Survey of Minority-
Owned Business Enterprises (SMOBE)
The Survey of Business Owners (SBO) is conducted by the U.S. Census
Bureau every five years to collect statistics that describe the composi-tion of U.S. businesses by gender, race, and ethnicity. This survey was
previously conducted as the Survey of Minority- and Women-Owned
Business Enterprises (SMOBE/SWOBE). Data are compiled from sev-
eral sources: IRS business tax returns, other Economic Census reports
(such as the Annual Survey of Manufacturers and the Annual Retail
Trade Survey), Social Security information on race and Hispanic or
Latino origin, and a mailout and mailback survey. The universe for the
most recent survey is all firms operating during 2002 with receipts of $1,000 or more that filed tax forms as individual proprietorships, part-
nerships, or any type of corporation.1 Businesses that are classified as
agricultural production, domestically scheduled airlines, railroads,
U.S. Postal Service, mutual funds (except real estate investment trusts),
religious grant operations, private households and religious organiza-
tions, public administration, and government are excluded.
The SMOBE and SBO data have undergone several major changes
over time including the addition of C corporations and the removal of
firms with annual receipts between $500 and $1,000 starting in 1997.
Table A.1 includes a summary of the major changes in the SMOBE/
SBO data from 1982 to 2002. Additional changes were made over time,
which are described in more detail in table A.2. In chapter 2, we pro-
vide a new compilation of estimates from the SMOBE and SBO that
makes these data as comparable as possible over the time period 1982
to 2002.
These surveys provide the most comprehensive data available on
businesses by the race, ethnicity, and gender of the owners. Businessownership is defined as having 51 percent or more of the stock or
equity in the business. Business ownership was categorized by gender
(male, female, or equally male- and female-owned), ethnicity (His-
190 Data Appendix

8/9/2019 Race and Entrepreneurial Success - Black , Asian, And White Owned Business in the United States
http://slidepdf.com/reader/full/race-and-entrepreneurial-success-black-asian-and-white-owned-business 204/253
panic, non-Hispanic), and race (white, black or African American,
American Indian or Alaska native, Asian, native Hawaiian, or other
Pacific Islander). For the first time, respondents could choose multiple
race groups in the 2002 SBO survey.
Aggregate publications from this survey are available for each racial
group, Hispanics, and women. Separate reports are not available for
white firms, but estimates for non-Hispanic white firms and all whitefirms are reported in 1997 and 2002, respectively. Although not di-
rectly comparable over time, the number of non-Hispanic white or all
white firms can be estimated by subtracting out all minority firms or
Hispanic firms in other years.
The confidential microdata underlying these aggregate publications
are available to approved researchers at the Center for Economic
Studies.2 Alternatively, special cross-tabulations of these data can be
purchased from the U.S. Census Bureau. Prior to 2002, the SMOBE
data contained information on businesses including legal form of orga-
nization (sole proprietorships, partnerships, S corporations, and, begin-
ning in 1997, C corporations), industry, location, employment size,
receipts size, and payroll. The 2002 SBO contains all of this information
except legal form of organization.
The public use tables from the SBO/SMOBE are the most widely
used source for tracking the number, performance, size, and industry
composition of minority-owned businesses in the United States. Many
researchers have used these data to try to better understand the rolethat minority- and female-owned businesses play in our economy
(U.S. Small Business Administration 1999, 2001; Handy and Swinton
1983 and 1984; Robb 2000). Most research using the SMOBE data
Table A.1Major changes in survey methodology, Survey of Minority-Owned Business Enterprises(1982 to 1997) and Survey of Business Owners (2002)
1982 1987 1992 1997 2002
Dataset SMOBE SMOBE SMOBE SMOBE SBO
Types of businesses included:
Sole proprietorships Yes Yes Yes Yes Yes
Partnerships Yes Yes Yes Yes Yes
S corporations Yes Yes Yes Yes Yes
All other corporations No No No Yes Yes
Minimum business receipts None $500 $500 $1,000 $1,000
Source: U.S. Census Bureau (2005). For more details of changes, see table A.2.
Data Appendix 191

8/9/2019 Race and Entrepreneurial Success - Black , Asian, And White Owned Business in the United States
http://slidepdf.com/reader/full/race-and-entrepreneurial-success-black-asian-and-white-owned-business 205/253
Table A.2Changes in survey methodology to the Survey of Business Owners (SBO) and Survey of Minority-Owned2002)
1982 1987 1992 1997
Legal form IRS changed therules for subchapterS corporations toallow for up to 25shareholders. How-ever, the CensusBureau receiveddata, including thenumber of sharesowned, for up to
only the first 10owners. To deter-mine the minorityownership of eachS corporation withmore than 10owners, the numberof shares listed forthe first 10 share-holders was con-sidered to be thenumber of sharesfor the entirecorporation.
IRS changed rulesfor subchapter Scorporations toallow for up to 35shareholders. TheCensus Bureaureceived data,excluding thenumber of sharesowned, for up to
only the first 10owners. CensusBureau researchindicated that 99.9%of all S corporationshad all shareholdersreporting the samerace and ethnicity.
The use of selectitems from IRS andSSA administrativerecords to identifythe owners of partnerships andsubchapter Scorporations wasdiscontinued.Therefore, some
partnerships andsubchapter Scorporations weresubjected to beingsampled todetermine whichwere minority-owned. A smallsample of Ccorporations wasincluded in theSWOBE to provideestimates at thenational level byindustry division.
The expaall cminofor aleve

8/9/2019 Race and Entrepreneurial Success - Black , Asian, And White Owned Business in the United States
http://slidepdf.com/reader/full/race-and-entrepreneurial-success-black-asian-and-white-owned-business 206/253
Minority methods The Census Bureauexpanded its sur-name list to includemore Hispanicsurnames and some
American Indianand Asian sur-names. All owners,including thosewith ‘‘black’’ racecodes, were sub-
jected to the sur-name match toidentify probableHispanic or Asianownership.
The CensusBureau’s surnamelist was expandedto include non-minority surnames
(i.e., non-Hispanicand non-Asian) toplace minority/nonminority codeson each ownerfor use in animputation of nonrespondents.
Industry Expanded serviceindustry coverageand methodologicalimprovements inprocessing thataffect detailedpublication levelsmake the data notdirectly comparableto 1972.
Classifications forfirm data were
based on the 1972Standard IndustrialClassification (SIC)system.
Virtually all non-farm businesseswere included.Classifications forfirm data were
based on the 1987SIC system.
Virtufarmwereexcefied prodrailrPostmut(exc
invereligoperadmgove

8/9/2019 Race and Entrepreneurial Success - Black , Asian, And White Owned Business in the United States
http://slidepdf.com/reader/full/race-and-entrepreneurial-success-black-asian-and-white-owned-business 207/253
Table A.2
(continued)
1982 1987 1992 1997
Receipts Unknown receiptscutoff
Included all personswith businessreceipts over $500
Included all personswith businessreceipts over $500
Incluwithrece
Minority methodology Black-owned businesses weredirectly identifiedusing adminis-trative records.Minority-ownedC corporationswere identified
from other gov-ernment agencies,public sources,and contacts withminority devel-opment agencies,and the data forthese corporationswere obtained fromthe 1982 EconomicCensus. The data
for these large cor-porations wereincluded in thepublished tables.
Individual propri-etorships owned
by blacks were stillidentified usingadministrativerecords. A sampleof partnerships andsubchapter S
corporations wastaken to determine
black ownership. Inthe past, only thenonblack race andethnicity data werecollected directlyfrom respondents.
Based on the race,ethnicity, andgender of themajority of thenumber of owners,without regard topercentage of interest owned in
the firm. All firmswhere 50 percent ormore of the ownerswere minority wereincluded in the tabs.
Baseor minterrighnessitiesas a own
Busiownsharminominowithor ethaviinterexclumino
counheldforeicomfor-p

8/9/2019 Race and Entrepreneurial Success - Black , Asian, And White Owned Business in the United States
http://slidepdf.com/reader/full/race-and-entrepreneurial-success-black-asian-and-white-owned-business 208/253
tabupublsepa
Questionnaires Two questionnaires:MB-1: Sole pro-prietorship forminstructed therespondent to markthe one box in race
and the ethnicityquestion with whichthey most closelyidentify.
Two questionnaires:MB-1: Sole pro-prietorship formrequested informa-tion for the primary
business owner.
However, if a hus- band and wifeowned the businessequally, they wereinstructed to com-plete the form for
both owners. The re-spondent was askedto mark one box forrace and ethnicitywith which he/she
most closelyidentifies.
Four questionnaires:MB-1: Sole propri-etorships wereasked to provideinformation for theprimary business
owner. However,if a husband andwife owned theequally, they wereinstructed to com-plete the form for
both owners.
TwoMB-and werevideage
gendand ownof stheldothewas for pcorp
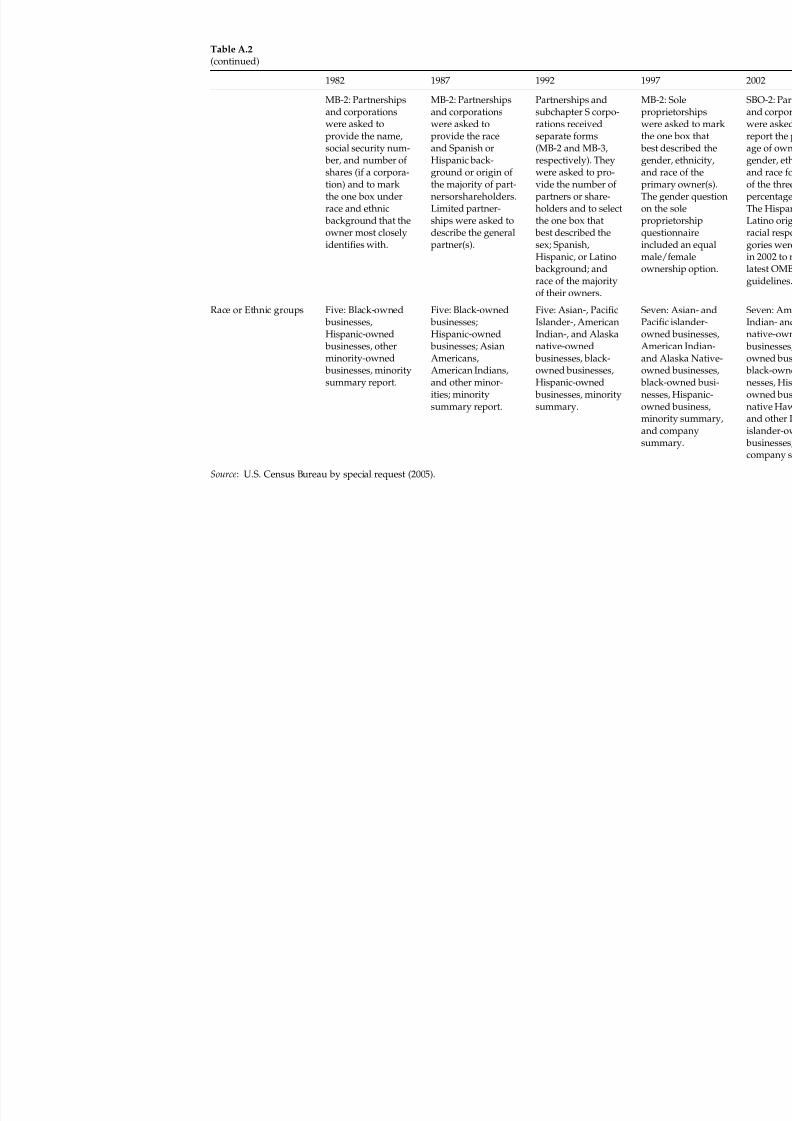
8/9/2019 Race and Entrepreneurial Success - Black , Asian, And White Owned Business in the United States
http://slidepdf.com/reader/full/race-and-entrepreneurial-success-black-asian-and-white-owned-business 209/253
Table A.2(continued)
1982 1987 1992 1997
MB-2: Partnershipsand corporationswere asked toprovide the name,social security num-
ber, and number of shares (if a corpora-tion) and to markthe one box underrace and ethnic
background that theowner most closelyidentifies with.
MB-2: Partnershipsand corporationswere asked toprovide the raceand Spanish orHispanic back-ground or origin of the majority of part-nersorshareholders.Limited partner-ships were asked todescribe the generalpartner(s).
Partnerships andsubchapter S corpo-rations receivedseparate forms(MB-2 and MB-3,respectively). Theywere asked to pro-vide the number of partners or share-holders and to selectthe one box that
best described thesex; Spanish,
Hispanic, or Latino background; andrace of the majorityof their owners.
MB-propwerethe o
best gendand primThe on thpropquesinclu
maleown
Race or Ethnic groups Five: Black-owned businesses,Hispanic-owned
businesses, otherminority-owned
businesses, minoritysummary report.
Five: Black-owned businesses;Hispanic-owned
businesses; AsianAmericans,American Indians,and other minor-ities; minoritysummary report.
Five: Asian-, PacificIslander-, AmericanIndian-, and Alaskanative-owned
businesses, black-owned businesses,Hispanic-owned
businesses, minoritysummary.
SevePaciownAmeand own
blacnessownminoand sum
Source: U.S. Census Bureau by special request (2005).

8/9/2019 Race and Entrepreneurial Success - Black , Asian, And White Owned Business in the United States
http://slidepdf.com/reader/full/race-and-entrepreneurial-success-black-asian-and-white-owned-business 210/253
conduct cross-sectional analyses; however, Handy and Swinton (1983)
link the 1972 and 1977 SMOBE microdata, and Robb (2000) links the
1992 SMOBE to a longitudinal file of employer businesses to create
panel data.
The Characteristics of Business Owners (CBO)
The 1992 Characteristics of Business Owners (CBO) Survey is the third
survey of its kind conducted by the U.S. Census Bureau. The first two
surveys were conducted for 1982 and 1987. The 1997 CBO was can-
celled, and the 2002 CBO contains substantially less information on the
owner and business and has only recently accepted applications forrestricted-access use by the U.S. Census Bureau. Minorities and women
are oversampled in the 1992 CBO to allow researchers to more reliably
study these businesses and business owners. The sample for the CBO
is a subsample of the SMOBE and drawn from the businesses that
responded to the SMOBE (the 1992 SMOBE had a 77 percent response
rate).
The 1992 CBO survey was conducted by the U.S. Census Bureau to
provide economic, demographic, and sociological data on businessowners and their business activities (for more deteails on the CBO, see
U.S. Census Bureau 1997, Bates 1990a, Headd 1999, and Robb 2000).
The survey was sent to more than 75,000 firms and 115,000 owners
who filed an IRS form 1040 Schedule C (individual proprietorship or
self-employed person), 1065 (partnership), or 1120S (subchapter S cor-
poration).3 Only firms with $500 or more in sales were included. The
businesses included in the CBO represent nearly 90 percent of all busi-
nesses in the United States (U.S. Census Bureau 1997). Response rates
for the firm and owners surveys were approximately 60 percent. All
estimates reported below use sample weights that adjust for survey
nonresponse (Headd 1999).
The CBO is unique in that it contains detailed information on the
characteristics of both business owners and their businesses. For exam-
ple, owner characteristics include education, detailed work experience,
hours worked in the business, and the way that the business was
acquired. Business characteristics include closure, profits, sales, em-
ployment, and industry. Most business characteristics refer to 1992,with the main exception being closure, which is measured over the
period 1992 to 1996. Additional advantages of the CBO over other na-
tionally representative datasets for this analysis are the availability of
Data Appendix 197

8/9/2019 Race and Entrepreneurial Success - Black , Asian, And White Owned Business in the United States
http://slidepdf.com/reader/full/race-and-entrepreneurial-success-black-asian-and-white-owned-business 211/253
measures of business ownership among family members and the large
oversample of minority-owned businesses. In particular, the CBO con-
tains rare or unique information on business inheritances, business
ownership among family members, prior work experience in a family
member’s business, and prior work experience in a business whose
goods or services were similar to those provided by the owner’s busi-
ness. The CBO allows us to conduct a detailed analysis of the determi-
nants of several business outcomes, such as closure rates, sales, profits,
and employment size.
Unfortunately, future CBO surveys are likely to contain substantially
less information on owner and firm characteristics. For example, the
survey used for the 2002 CBO does not contain information on keyvariables of interest such as the amount of startup capital, family busi-
ness experience, prior work experience, and profits. We use the 1992
CBO microdata for the main analysis and report published estimates
on business outcomes from the 2002 data. The estimates indicate that
racial disparities in business performance have not changed over this
period.
The CBO sample used in most analyses conducted in this study
includes firms that meet a minimum weeks and hours restriction. Spe-cifically, at least one owner must report working for the business at
least twelve weeks in 1992 and at least ten hours per week. This restric-
tion excludes 22.1 percent of firms in the original sample. The weeks
and hours restrictions are imposed to rule out very small-scale busi-
ness activities such as casual or side businesses owned by wage and
salary workers. For the main results, we did not choose tighter hours-
and weeks-worked criteria because of concerns about removing un-
successful business owners. For example, a business owner who is
working twenty-five hours per week may not be doing this by choice
and may be working less than full-time only because of lack of de-
mand for his or her products or services. There is a tradeoff between
being overinclusive and throwing out unsuccessful businesses with
no perfect delineating point. We follow some of the previous self-
employment literature, which includes only self-employed business
owners with at least fifteen hours worked per week and twenty weeks
worked per year. We could not match these criteria exactly because the
CBO only includes a categorical measure of hours and weeks workedlimiting the flexibility of choosing cutoffs. We also try tighter hours
and weeks restrictions and comment on the findings below.
198 Data Appendix
8/9/2019 Race and Entrepreneurial Success - Black , Asian, And White Owned Business in the United States
http://slidepdf.com/reader/full/race-and-entrepreneurial-success-black-asian-and-white-owned-business 212/253
In multiowner firms, which represent 20.6 percent of the sample, we
identify one person as the primary owner of the business. The primary
owner is identified as the owner working the most annual hours in
1992 (weeks*hours). In the case of ties, we identify the primary owner
as the person who founded the business. Finally, all remaining ties are
resolved by assigning a random owner. The primary business owner is
used to identify all owner characteristics of the firm, such as marital
status, education, prior work experience, and family business back-
ground. The race and sex of the firm, however, are identified by major-
ity ownership, which is the method used by the underlying SMOBE/
SWOBE (U.S. Census Bureau 1997; Robb 2000).4
Given the detailed information on both owner and business charac-teristics, the oversamples of minority-owned businesses, and availabil-
ity since 1982, it is surprising that the CBO microdata have only been
used by a handful of researchers to study minority-owned businesses
(Bates 1997 and many other studies; Christopher 1993, 1998; Kijakazi
1997; Robb 2000, 2002). The lack of use appears to be primarily due to
difficulties in accessing and reporting results from these confidential,
restricted-access data. All research using the CBO must be conducted
in a Census Research Data Center or at the Center for EconomicStudies (CES) after approval by the CES and IRS, and all output must
pass strict disclosure regulations.
The Current Population Survey (CPS)
Rates of minority business ownership are examined using the Current
Population Survey (CPS). Microdata from the 1979 to 2006 Outgoing
Rotation Group Files to the CPS are used to estimate self-employed
business ownership rates by race and ethnicity. The survey, conducted
by the U.S. Census Bureau and the Bureau of Labor Statistics, is repre-
sentative of the entire U.S. population and interviews more than 50,000
households and 130,000 people per month. It contains detailed infor-
mation on labor-force and demographic characteristics.
The CPS provides the most up-to-date estimates of the rate of busi-
ness ownership in the United States. The new estimates of business-
ownership rates from CPS microdata presented in this study improve
on published estimates from the same source by the Bureau of LaborStatistics (BLS). Regularly published estimates from the BLS, such as
those reported in Employment and Earnings, do not include incorpo-
Data Appendix 199

8/9/2019 Race and Entrepreneurial Success - Black , Asian, And White Owned Business in the United States
http://slidepdf.com/reader/full/race-and-entrepreneurial-success-black-asian-and-white-owned-business 213/253
rated business owners, which represent roughly one third and a grow-
ing share of all business owners.5 Using CPS microdata, owners of
both unincorporated and incorporated businesses can be identified.
These data also provide a different, individual-based representation
of recent trends in minority business ownership than estimates of the
number of businesses from the SBO/SMOBE. Estimates from the CPS
do not suffer from two problems facing the SMOBE. The scope of busi-
nesses included in the SMOBE has changed over the past two decades,
and the data include a large number of side or ‘‘casual’’ businesses
owned by wage and salary workers or individuals who are not in the
labor force.6 The CPS microdata include all individuals who identify
themselves as self-employed in their own not incorporated or incorpo-rated business on their main job and thus capture only primary busi-
ness owners.
The CPS is also advantageous for calculating business ownership
rates because it provides estimates of the size of the population
employed in the wage and salary sector. This allows for the use of the
same definitions of race, ethnicity, and labor force attachment for
estimating both the number of self-employed business owners (numer-
ator) and the total number of wage and salary workers and self-employed business owners (denominator).
The Current Population Survey (CPS) Outgoing Rotation Group
(ORG) files are used to calculate the self-employment series reported
in chapter 2. The ORG files contain annual samples that are roughly
three times larger than those from a monthly CPS, such as the com-
monly used March Annual Demographic Files. The large sample sizes
are useful for estimating trends in business ownership rates for smaller
demographic groups and provide more precise estimates of the num-
ber and rates of self-employed business ownership for all groups.
Self-employed business owners are defined as those individuals who
identify themselves as self-employed in their own not incorporated or
incorporated business on the class of worker question. The class of
worker question refers to the job with the most hours during the refer-
ence week. We restrict the sample to include only individuals age six-
teen and over who worked at least fifteen hours during this week. The
hours restriction is imposed to rule out very small-scale business activ-
ities. As in most previous studies of self-employment, agriculturalindustries are excluded. Agricultural industries are defined using the
North American Industry Classification System (NAICS).7 Estimates
200 Data Appendix

8/9/2019 Race and Entrepreneurial Success - Black , Asian, And White Owned Business in the United States
http://slidepdf.com/reader/full/race-and-entrepreneurial-success-black-asian-and-white-owned-business 214/253
for 1979 to 1991, however, also exclude veterinary services because
they cannot be separately identified.
Estimates of self-employment rates may not be perfectly comparable
before and after 1994 when the CPS was redesigned. In a thorough
analysis of the 1994 CPS redesign using a ‘‘parallel survey,’’ Polivika
and Miller (1998) conclude that self-employment rates increased by
0.44 percentage points for men and 1.58 for women. On the other
hand, Fairlie and Meyer (2000) find by comparing estimates from the
CPS ORG to estimates from the CPS Annual Demographic Files for the
same year (but subject to the redesign in different years) that the rede-
sign may have led to a fall in the reported white male self-employment
rate of one percentage point. Using the same comparison, however, theredesign leads to an increase in the black male self-employment rate by
almost a full percentage point.
We create five distinct ethnic or racial groups by interacting
responses to the race and Spanish/Hispanic origin questions available
in the CPS. The groups are white (non-Latino), black, Latino, Asian
and Pacific Islander, and Native American (American Indian, Aleut,
and Eskimo). The black, Asian, and Native American groups include
individuals reporting Spanish ethnicity. This classification does not,however, lead to a substantial undercount of Latinos as few Latinos re-
port being black, Asian, or Native American (Fairlie 2004b). Race and
Spanish codes changed in 1989, 1996 and 2003. The largest change was
in 2003, when respondents were allowed to report multiple races. Esti-
mates starting in 2003 reported in chapter 2 only include individuals
reporting a single race. Individuals reporting a multiple race only rep-
resent 1.7 percent of our 2003 to 2006 sample.
Individual- versus Business-Level Data
Estimates of the level of minority business activity in the United States
can be generated from both individual-level datasets such as the CPS
and business-level datasets such as the SBO/SMOBE and compared
with each other. Of course, estimates of the total number of business
owners and the total number of businesses are not perfectly compara-
ble. Multiple businesses owned by one individual count only once in
individual-level data, and businesses with multiple owners count onlyonce in business-level data. These discrepancies are relatively minor,
however. Estimates from the 1992 CBO indicate that the total number
Data Appendix 201

8/9/2019 Race and Entrepreneurial Success - Black , Asian, And White Owned Business in the United States
http://slidepdf.com/reader/full/race-and-entrepreneurial-success-black-asian-and-white-owned-business 215/253
of business owners is only 12 percent larger than the total number of
businesses (U.S. Census Bureau 1997). Similarly, Boden and Nucci
(1997) find that less than 3 percent of small business records in the
CBO pertain to owners of multiple businesses.
There are several additional reasons for discrepancies in the total
number of self-employed business owners and the total number of
businesses that are due to measurement issues, some of which are spe-
cific to the CPS and SBO/SMOBE. The most important is that business
ownership in the CPS refers to the person’s main job activity. In the
2002 SBO and 1997 SMOBE, all businesses resulting from filing tax
forms to the IRS with at least $1,000 in annual sales are included.
Thus, side businesses owned by wage and salary workers are countedin the SBO/SMOBE data but not in the CPS data. The focus on main
job activity in the CPS may represent only a small part of the discrep-
ancy, however. Headd (2005) finds that in the 2004 CPS, roughly
500,000 of the individuals who did not report self-employment as
their main job activity did report self-employment in their secondary
occupation.
As discussed previously, we impose hours-worked restrictions to the
CPS sample to rule out small-scale businesses. Excluding these busi-nesses further limits the comparability of our CPS estimates to the
SBO/SMOBE estimates. The SBO/SMOBE data do not impose any
restrictions on the size of the business other than the annual sales re-
striction. Using the CBO microdata, however, we are able to impose
restrictions on hours and weeks worked to remove small-scale
businesses.
Another cause of the discrepancy is that the SBO/SMOBE data refer
to businesses that existed at any point in the calendar year. The CPS in-
stead refers to self-employed business ownership at the time of the sur-
vey. Thus, the CPS is likely to capture fewer business owners because
there is a considerable amount of volatility in business ownership. The
CPS and SBO/SMOBE may also differ in how likely they are to capture
some occupations, such as sales and real estate agents. These individu-
als may report working for an employer instead of self-employment on
the CPS questionnaire, even when they file as sole proprietors (Headd
2005). In a recent preliminary study, Bjelland et al. (2006) find that a
large percentage of individuals in the CPS are not found in the CensusBureau’s comprehensive dataset of businesses, the Business Register,
and vice versa. Their preliminary matching exercise, however, only
202 Data Appendix
8/9/2019 Race and Entrepreneurial Success - Black , Asian, And White Owned Business in the United States
http://slidepdf.com/reader/full/race-and-entrepreneurial-success-black-asian-and-white-owned-business 216/253
includes unincorporated business owners, sole proprietorships, and
businesses with positive earnings.
Overall, individual- and business-level data capture different mea-
sures of business activity. There are advantages and disadvantages to
both types of data for studying racial business patterns. We present
estimates from both sources and CBO microdata in chapter 2. The
CBO microdata capture detailed information on owner and business
characteristics and allow us to address some of the disadvantages of
using business-level data based on tax filings.
Additional Data Sources for Studying Minority-Owned Businesses
There are several additional nationally representative datasets that can
be used to study minority-owned businesses. These datasets, however,
are limited in size, scope, or timeliness compared to the CPS, SBO/
SMOBE, and CBO. We briefly discuss a few of the most commonly
used datasets for studying minority entrepreneurship.
One of the only business-level datasets that provides information on
the owner is the Survey of Small Business Finances (SSBF), which is
conducted by the Board of Governors of the Federal Reserve Systemevery five years. The 2003 SSBF contains a nationally representative
sample of 4,240 for-profit, nongovernmental, nonagricultural busi-
nesses with fewer than 500 employees.8 The SSBF provides detailed in-
formation on many owner and firm characteristics, including credit
histories, recent borrowing experiences, balance-sheet data, and
sources of financial products and services used (for more information,
see Mach and Wolken 2006 and hwww.federalreserve.gov/ssbf i). A
major limitation to the SSBF, however, is that it contains relatively
small minority business sample sizes.9
A new nationally representative, business-level dataset from the
Kauffman Foundation is the Kauffman Firm Survey (KFS). The KFS
contains information on nearly 5,000 firms that started in 2004 and
tracks them over a three-year period. The sample sizes are sufficiently
large for analyses of several minority groups (Asians, Hispanics, and
blacks). The KFS includes detailed information on business outcomes
in addition to owner characteristics and information on sources of fi-
nancial capital.There are also several commonly used household surveys providing
individual-level data on self-employed business owners in addition to
Data Appendix 203

8/9/2019 Race and Entrepreneurial Success - Black , Asian, And White Owned Business in the United States
http://slidepdf.com/reader/full/race-and-entrepreneurial-success-black-asian-and-white-owned-business 217/253
the CPS.10 A less frequent but larger source of data on self-employed
business owners is the Census of Population 5% Public Use Microdata
Sample (PUMS). The 5% PUMS is calculated every ten years with
observations for 5 percent of the U.S. population. Although census
microdata is available as far back as 1850, the 1910 Census was the first
census to include information on self-employment (see hwww.census
.govi and hwww.ipums.org/usai). The information available in the
U.S. Census is very similar to the CPS.
Estimates of self-employed business owners can also be obtained
from panel data allowing for the analysis of entry and exit over time.11
The Survey of Income and Program Participation (SIPP), conducted by
the U.S. Census Bureau, provides monthly data for a large sample of individuals (see hwww.sipp.census.gov/sippi). The Panel Study of In-
come Dynamics (PSID) provides annual data for a large sample of
individuals starting in 1968. The dataset, which contains an oversam-
ple of minority households, is conducted at the Survey Research Cen-
ter, Institute for Social Research, University of Michigan (see hhttp://
psidonline.isr.umich.edui for more details). The National Longitudinal
Surveys (NLS) are a set of surveys containing detailed longitudinal in-
formation on demographic characteristics and labor-market activitiesfor several age cohorts of the population (see hwww.bls.gov/nlsi).
The National Longitudinal Survey of Youth 1979 (NLSY79) is perhaps
the most widely used NLS. It contains a nationally representative sam-
ple of individuals who were age fourteen to twenty-two when they
were first interviewed in 1979 with oversamples of black and Latino
youth (see Center for Human Resource Research 2005 for more infor-
mation).12 In most cases, these longitudinal datasets provide more
detailed information on owner characteristics than the CPS, but theyhave much smaller sample sizes and are generally not as representa-
tive of the current U.S. population.
Summary
In this data appendix, we provide a description of the three main data-
sets used in this study—the SBO/SMOBE, CBO, and CPS. The SBO/
SMOBE and CPS are the most widely used, up-to-date sources of esti-
mates for business outcomes and ownership by race and ethnicity inthe United States, respectively. In this study, the SBO/SMOBE data
are used to provide estimates of business outcomes by ethnicity and
race, and the CPS microdata are used to estimate self-employed busi-
204 Data Appendix

8/9/2019 Race and Entrepreneurial Success - Black , Asian, And White Owned Business in the United States
http://slidepdf.com/reader/full/race-and-entrepreneurial-success-black-asian-and-white-owned-business 218/253
ness ownership rates by ethnicity and race. The number of minority-
owned businesses in the United States can also be estimated from the
SBO/SMOBE and compared to estimates of the number of minority
self-employed business owners in the CPS.
The CBO data are also described in detail. The CBO is a unique and
relatively underutilized data source for examining racial differences in
business outcomes and the causes of these differences. The CBO is
unique in that it contains information on both the characteristics of the
business and the business owner. It also contains detailed information
on family background experiences of the owners. The CBO appears to
be underutilized because of the difficulties in accessing and reporting
results from these confidential and restricted-access data. All researchusing the CBO must be conducted in a Census Research Data Center
or at the Center for Economic Studies (CES) after approval by the CES
and IRS, and all output must pass strict disclosure regulations. CBO
microdata and published estimates from the CBO (U.S. Census Bureau
1997) are used extensively in this study.
Data Appendix 205

8/9/2019 Race and Entrepreneurial Success - Black , Asian, And White Owned Business in the United States
http://slidepdf.com/reader/full/race-and-entrepreneurial-success-black-asian-and-white-owned-business 219/253

8/9/2019 Race and Entrepreneurial Success - Black , Asian, And White Owned Business in the United States
http://slidepdf.com/reader/full/race-and-entrepreneurial-success-black-asian-and-white-owned-business 220/253
Notes
Chapter 1
1. There are 22,678 black-owned firms with $500,000 or more in annual sales and reve-nues in the United States (U.S. Census Bureau 2006b).
2. See Glazer and Moynihan (1970), Loewen (1971), Light (1972, 1979), Baron, Kahan,and Gross (1975), Bonacich and Modell (1980), Sowell (1981), and Moore (1983).
3. Racial disparities in business ownership also appear to contribute to racial tensions inurban areas and business owners (see Min 1996 and Yoon 1997, for example).
4. Survey data indicate strong interest in entrepreneurship among minorities. Seventy-five percent of young blacks, compared with 63 percent of young whites, report beinginterested in starting a business (Walstad and Kourilsky 1998). These patterns suggestthat constraints may limit business ownership among blacks.
5. See Blanchflower (2004) and Parker (2004) for more discussion of the broader questionof whether more self-employment is better.
Chapter 2
1. Published estimates from the CPS from government sources generally do not includeowners of incorporated businesses. See the book’s data appendix for more details.
2. The inclusion of agricultural industries results in larger racial differences in self-employment rates. The white, black, Latino, and Asian self-employment rates are 11.8,5.1, 7.5, and 11.9 percent, respectively.
3. The Latino/white and black/white ratios of self-employment rates are similar for menand women separately. Asian women, however, have higher rates of self-employmentthan white women, and Asian men have lower rates than white men. For all groups,women have substantially lower rates of business ownership than men.
4. There is also evidence of relatively low black self-employment rates and high Asianself-employment rates in Canada and the United Kingdom and substantially lowerLatino rates than white non-Latino rates in Canada (Clark and Drinkwater 1998, 2000;Fairlie 2006).

8/9/2019 Race and Entrepreneurial Success - Black , Asian, And White Owned Business in the United States
http://slidepdf.com/reader/full/race-and-entrepreneurial-success-black-asian-and-white-owned-business 221/253
5. Estimates reported in Aronson (1991), Blau (1987), and Fairlie and Meyer (2000) indi-cate that the upward trend in the self-employment rate dates back to the early 1970s.
6. The decline from 1993 to 1994 may partly be due to the 1994 CPS redesign. See Poli-
vika and Miller (1998) and Fairlie and Meyer (2000) for more discussion.
7. The inclusion of agriculture results in similar rates of self-employment between whiteand black men in 1910 (see Levenstein 1995).
8. See House-Soremekun (2002) for a discussion of African American business develop-ment in Cleveland from 1795 to the present.
9. A larger literature examines the overall determinants of business ownership. SeeAronson (1991), Parker (2004), and van Praag (2005) for reviews of the literature.
10. The most common method of identifying the relative important of factors is the
decomposition technique described in Blinder (1973) and Oaxaca (1973). The techniquecombines coefficient estimates from multivariate regressions and group differences inmean characteristics.
11. Black youth are also more likely than white youth to report that it is important ‘‘forour nation’s schools to teach students about entrepreneurship and starting a business’’(Walstad and Kourilsky 1998).
12. Evans and Jovanovic (1989), Evans and Leighton (1989), Meyer (1990), Holtz-Eakin, Joulfaian, and Rosen (1994a, 1994b), Lindh and Ohlsson (1996, 1998), Bates (1997),Blanchflower and Oswald (1998), Dunn and Holtz-Eakin (2000), Fairlie (1999), Johansson(2000), Taylor (2001), Zissimopoulos and Karoly (2003), Hurst and Lusardi (2004), Holtz-
Eakin and Rosen (2004), Giannetti and Simonov (2004), Fairlie and Krashinsky (2005),and Nykvist (2005).
13. See Blau and Graham (1990), Oliver and Shapiro (1995), Menchik and Jianakoplos(1997), Altonji and Doraszelski (2001), and Gittleman and Wolff (2004) for a few recentstudies on racial differences in asset levels. See Bradford (2003) on wealth holdingsamong black and white entrepreneurs.
14. Bates (1997) finds a very strong relationship between wealth and self-employmententry and large racial differences in wealth levels using the 1988 SIPP. Although esti-mates of the relative contribution of racial differences in wealth are not reported, these
findings suggest that they explain a large part of the gap in self-employment entry rates.15. Using data from the Panel Study of Entrepreneurial Dynamics (PSED), however,Kim, Aldich, and Keister (2006) do not find evidence that individuals who have self-employed parents are more likely to be nascent entrepreneurs. The results may differ be-cause nascent entrepreneurs are defined as individuals who are ‘‘now trying to start anew business’’ and are not current business owners.
16. Earlier studies making this argument include Kinzer and Sagarin (1950), Glazer andMoynihan (1970), and Light (1972).
17. We thank Valerie Strang, Anthony Caruso, and James Jarzabkowski at the U.S. Cen-
sus Bureau for providing estimates from the SBO and SMOBE.18. To find the most recently available data, we used newer reports to find revised esti-mates for previous years whenever possible (for example, we used the 1987 report for
208 Notes to Chapter 2
8/9/2019 Race and Entrepreneurial Success - Black , Asian, And White Owned Business in the United States
http://slidepdf.com/reader/full/race-and-entrepreneurial-success-black-asian-and-white-owned-business 222/253
1982 estimates). We did not make any other adjustments to the data. See U.S. Small Busi-ness Administration (2007a) for adjustments to the number of Asian and Hispanic firmsin 1982 and 1987.
19. To make the data as comparable as possible, we exclude publicly held, foreign-owned, not-for-profit and other firms from the published estimates for all firms. Thesetypes of firms are not included in the estimates for ethnic or racial groups, making com-parisons between minority and total estimates problematic with unadjusted publisheddata.
20. Estimates for white-owned firms reported in table 2.3 are not directly comparableover time because of changes in measurement.
21. These estimates required special tabulations prepared for us by the Census Bureau.
22. Published estimates from the 1992 CBO, which exclude C corporations, indicate that
the total number of business owners is 11.8 percent higher than the total number of busi-nesses (U.S. Census Bureau 1997). The numbers of black and Latino business owners are2.8 and 5.1 percent higher than the number of black and Latino businesses, respectively.
23. Estimates from the 2004 March CPS indicate that 500,000 of the individuals notreporting self-employment as their main job activity report self-employment in their sec-ondary occupation (Headd 2005).
24. In a comparison of estimates from the CBO to estimates from the CPS Annual Demo-graphic Files, Boden and Nucci (1997) also find higher growth rates for white businessowners from 1982 to 1987 using the CBO. This is even after removing S corporations
from the CBO and incorporated business owners from the CPS and including all indi-viduals receiving any self-employment income in the CPS to make the data morecomparable.
25. Unpaid family workers are not included in these estimates.
26. We can apply these restrictions to the estimate of the total number of businesses fromthe 1992 SMOBE by reducing them by 22.1 percent. The resulting estimate of the totalnumber of businesses is 13.4 million, which is more similar to the CPS estimate of thetotal number of self-employed business owners of 10.7 million. We should not expectthese estimates to match perfectly because of the reasons noted above, but it is useful tonote that they are closer than using the unadjusted SMOBE estimates.
27. The CBO includes only a categorical measure of profits.
28. Although sample weights are used that correct for nonresponse, there is some con-cern that closure rates are underestimated for the period from 1992 to 1996. Many busi-nesses closed or moved over this period and did not respond to the survey which wassent out at the end of the period. Indeed, Robb (2000) showed, through matching admin-istrative records, that nonrespondents had a much higher rate of closure than respon-dents. Racial differences in closure rates, however, were similar for the respondent andnonrespondent samples.
29. Estimates of the profit distribution for Asian- and other minority-owned firms clearly
indicate that these businesses are overrepresented in higher profit categories (U.S. CensusBureau 1997). Asian- and Pacific Islander-owned businesses comprise 85 percent of all
businesses in this group (U.S. Census Bureau 1996).
Notes to Chapter 2 209

8/9/2019 Race and Entrepreneurial Success - Black , Asian, And White Owned Business in the United States
http://slidepdf.com/reader/full/race-and-entrepreneurial-success-black-asian-and-white-owned-business 223/253
8/9/2019 Race and Entrepreneurial Success - Black , Asian, And White Owned Business in the United States
http://slidepdf.com/reader/full/race-and-entrepreneurial-success-black-asian-and-white-owned-business 224/253
business owners have more flexibility in hours worked and are often willing to workmore given a certain return.
12. Another problem arises in both of these cases because only categorical measures of
hours and profits are available in the CBO.
13. We approximate by multiplying the coefficient estimate from the logit model by pð1 pÞ, where p is the mean of the dependent variable.
14. These findings are also consistent with evidence from household surveys indicatinglarge differences in earnings between self-employed men and women (Aronson 1991;Devine 1994; Hundley 2000; U.S. Bureau of Labor Statistics 2004).
15. See also Gatewood et al. (2003) and Parker (2004) for recent reviews of the literatureand Coleman (2001) for a discussion of constraints faced by female-owned firms.
16. Published estimates from the CBO indicate that a higher percentage of female ownersreport that the reason they started the business was ‘‘to have more freedom in meetingfamily responsibilities’’ than men, but a similarly high percentage of women as menreported that it was ‘‘to have a primary source of income’’ or ‘‘to be my own boss’’ (U.S.Census Bureau 1997).
17. As expected, the removal of business inheritances from the specifications does notaffect the coefficients on other variables.
18. The cutoffs for the ordered probit are (1) negative, (2) 0 to $9,999, (3) $10,000 to$24,999, (4) $25,000 to $99,999, and (5) $100,000 or more.
19. Aldrich and Kim (2007) using a sample of nascent entrepreneurs and a comparisongroup also find that men are more likely to report working in their parent’s businessthan are women.
20. Race, gender, region, and urban are from administrative records and have no missingvalues.
21. The technique has been used to impute income and wealth variables in the Survey of Consumer Finances (Kennickell 1998).
22. Information from all of the independent variables in the main specification and onfinancial capital, industry, and start year was used in the correlations.
23. The gains in efficiency are small after increasing the number of imputations abovefive (Schafer and Olsen 1998).
24. The CBO does not include any measure of the owner’s net worth. Using the 1987CBO, Astebro and Bernhardt (2004) instead use instrumented household income as aproxy for household wealth and find a positive relationship between this variable andstartup capital controlling for other owner and business characteristics.
25. Astebro and Berhardt (2003) find a positive relationship between business sur-vival and having a bank loan at startup after controlling for owner and businesscharacteristics.
26. We find that the effects of startup capital and industry do not differ substantially formale- and female-owned businesses.
Notes to Chapter 3 211

8/9/2019 Race and Entrepreneurial Success - Black , Asian, And White Owned Business in the United States
http://slidepdf.com/reader/full/race-and-entrepreneurial-success-black-asian-and-white-owned-business 225/253
Chapter 4
1. The questions ask (1) ‘‘Prior to beginning/acquiring this business, had any of your
close relatives ever owned a business OR been self-employed? (Close relatives refer tospouses, parents/guardians, brothers, sisters, or immediate family)’’ and (2) ‘‘If ‘Yes,’ didyou work for any of these relatives?’’ (U.S. Census Bureau 1997, p. C-4).
2. These patterns may in part be due to lower employment levels among black-ownedfirms.
3. Fairlie and Krashinsky (2007) find evidence that housing appreciation is associatedwith higher levels of business creation.
4. Unfortunately, the CBO does not contain separate information for equity investmentsmade by family members.
5. Dunn and Holtz-Eakin (2000) consider an additional explanation. Successful businessowners may be more likely to transfer financial wealth to their children potentially mak-ing it easier for them to become self-employed. Their empirical results, however, suggestthat it plays only a modest role. As mentioned earlier, we find that financial transfersfrom parents to children are not a common source of startup capital among small busi-ness owners.
6. Earlier empirical research using the partially SBA funded survey, Access to Capital bySubcategories of Firms, also found evidence consistent with lending discrimination.Ando (1988) finds that blacks were much more likely to have their loan application
denied than whites, even after controlling for a variety of creditworthiness factors.7. The recently released 2002 Survey of Business Owners yielded similar patterns. Black-owned businesses were more likely to use credit cards or business loans from the govern-ment, while white-owned businesses were twice as likely to use a bank loan. Whites werealso more likely to use personal savings and other personal/family assets to start there
businesses than were blacks. See U.S. Census Bureau (2006a) for more information.
8. See Shane and Cable (2002) for evidence on the impact of network ties on financing of new firms.
9. Note that the Blinder-Oaxaca decomposition is a special case of (4.2).
10. A useful property of the logit regression that includes a constant term is that theaverage of the predicted probabilities must equal the proportion of ones in the sample.In contrast, the predicted probability evaluated at the means of the independent variablesis not necessarily equal to the proportion of ones, and in the sample used below it islarger because the logit function is concave for values greater than 0.5.
11. A black dummy variable is included in estimating the logit model with the pooledsample of blacks and whites but is not used to calculate the decomposition.
12. Unlike in the linear case, the independent contributions of X 1 and X 2 depend on thevalue of the other variable. This implies that the choice of a variable as X 1 or X 2 (or the
order of switching the distributions) is potentially important in calculating its contribu-tion to the racial gap. We return to this issue below.
212 Notes to Chapter 4

8/9/2019 Race and Entrepreneurial Success - Black , Asian, And White Owned Business in the United States
http://slidepdf.com/reader/full/race-and-entrepreneurial-success-black-asian-and-white-owned-business 226/253
Chapter 5
1. See Boyd (1991), Fratoe (1986), and Borjas (1986), for example.
2. Excellent reviews of the literature can be found in Aldrich and Waldinger (1990), Boyd(1991), and Bates (1997). Zhou (2004) and Light (2004) provide more recent reviews of theethnic entrepreneurship literature.
3. Another line of research hypothesizes that Asians have a high rate of self-employment because they come from countries with high rates (or culture) of self-employment. Al-though estimates of self-employment rates are not available for all Asian countries withlarge immigrant populations in the United States, wide variation in self-employmentrates exists across available countries in Asia (International Labour Organization 2005).Asian countries also do not have notably higher self-employment rates compared to
other regions of the world. Previous research on the correlation between U.S. self-employment rates and home country rates is also mixed (Yuengert 1995; Fairlie andMeyer 1996).
4. We are thankful to Lingxin Hao for providing these estimates.
5. In our subsample of active firms using the CBO microdata, we are able to isolateAsians from Native Americans and find that 11.5 percent of Asians had a loan from fam-ily members, compared with 6.2 percent of white owners.
6. The recently released 2002 SBO suggests that these patterns continue. About 55 per-cent of white firms reported using personal or family savings to start their businesses,
compared with 61.4 percent of Asians. Asians were also more likely than whites to usepersonal or business credit cards to finance their startups. About 9.6 percent of Asiansreported using this source, compared with 8.8 percent of whites. Amounts of capitalused were not available from this survey.
7. In addition, previous research finds that this unregulated source of funding comeswith usurious interest rates that can negatively impact the chance for a business to suc-ceed (Light, Kwuon, and Zhong 1990; Bates 1997).
Chapter 6
1. More 30 percent of other minority-owned employer firms hire at least 90 percent mi-nority employees (U.S. Census Bureau 1997).
2. Job satisfaction is also much higher among the self-employed than wage and salaryworkers (Blanchflower, Oswald, and Stutzer 2001).
3. Many countries also have programs providing financial and other assistance to the un-employed to start businesses. See OECD (1992) for descriptions of programs in Belgium,Canada, Finland, France, Greece, Netherlands, Portugal, Spain, and the United Kingdom.
4. See Bates (1993b) and Boston (1999a) for a more thorough discussion of theseprograms.
5. Apprenticeships are common in the manufacturing sector in some developing coun-tries and are associated with substantial returns in self-employment (Frazer 2003).
Notes to Chapters 5 and 6 213

8/9/2019 Race and Entrepreneurial Success - Black , Asian, And White Owned Business in the United States
http://slidepdf.com/reader/full/race-and-entrepreneurial-success-black-asian-and-white-owned-business 227/253
Data Appendix
1. Sole proprietorships complete a 1040C form, partnerships complete a 1065 form, S cor-
porations complete a 1120S form, and C corporations complete a 1120 form.
2. See hwww.ces.census.govi for information on how to apply for access to these data.
3. C corporations were not included. C corporations as a tax filing status, however, are becoming less popular relative to S corporations due to changes in tax laws (Headd1999).
4. The race of the primary owner is not available in the CBO.
5. See Hipple (2004) for recent estimates of the number of unincorporated and incorpo-rated business owners.
6. Estimates from the 1992 CBO, which is drawn from the SMOBE, indicate that 44.2 per-cent of owners in the survey report that their businesses provided less than 25 percent of their total personal income (U.S. Census Bureau 1997). This estimate, however, does notinclude the hours-worked restriction used in our analyses of the CBO microdata.
7. A major change included in the NAICS was that landscaping and veterinary serviceswere removed from agriculture.
8. The underlying sample frame for the SSBF was the Dun’s Market Identifiers (DMI) fileproduced by the Dun & Bradstreet Corporation. The DMI data may undercount minority
businesses (Haggerty et al. 1999). To address this concern the SSBF relies on its own
screener question on minority ownership.
9. The 2003 sample includes 119 black-owned firms, 170 Asian-owned firms, and 149Hispanic-owned firms (Mach and Wolken 2006). The 1998 survey includes larger minor-ity sample sizes with 273 black-owned firms, 214 Asian-owned firms, and 260 Hispanic-owned firms (Bitler, Robb, and Wolken 2001).
10. Information on nascent entrepreneurs can be obtained from the Panel Study of Entrepreneurial Dynamics (PSED). See hhttp://projects.isr.umich.edu/psedi for moreinformation.
11. Panel data can also be created using the CPS by matching records over time. See
Fairlie (2007) for estimates of monthly entrepreneurship rates, which are defined asmonth-to-month entry into business ownership, by race for 1996 to 2006.
12. See also Fairlie (2005b) for review of the literature using the NLSY79 to study self-employment.
214 Notes to Data Appendix
8/9/2019 Race and Entrepreneurial Success - Black , Asian, And White Owned Business in the United States
http://slidepdf.com/reader/full/race-and-entrepreneurial-success-black-asian-and-white-owned-business 228/253
References
Aldrich, Howard, John Carter, Travor Jones, David McEnvoy, and Paul Vellemen. 1985.‘‘Ethnic Residential Segregation and the Protected Market Hypothesis.’’ Social Forces63(4): 996–1009.
Aldrich, Howard E., and Phillip H. Kim. 2007. ‘‘A Life Course Perspective on Occupa-tional Inheritance: Self-employed Parents and Their Children.’’ In Martin Ruef andMichael Lounsbury, eds., Research on the Sociology of Organizations (pp. 33–82). Amster-dam: Elsevier JAI.
Aldrich, Howard E., and Roger Waldinger. 1990. ‘‘Ethnicity and Entrepreneurship.’’ An-nual Review of Sociology 16(1): 111–135.
Allen, W. David. 2000. ‘‘Social Networks and Self-Employment.’’ Journal of Socio-Economics 29: 487–501.
Altonji, Joseph G., and Rebecca M. Blank. 1999. ‘‘Race and Gender in the Labor Market.’’In Orley Ashenfelter and David Card, eds., Handbook of Labor Economics (vol. 3C, pp.3143–3259). Amsterdam: Elsevier.
Altonji, Joseph G., and Ulrich Doraszelski. 2001. ‘‘The Role of Permanent Income andDemographics in Black/White Differences in Wealth.’’ National Bureau for Economic Re-search Working Paper No. 8473.
Amato, Paul R. 2000. ‘‘The Consequences of Divorce for Adults and Children.’’ Journal of
Marriage and Family 62(4): 1269–1287.
Ando, Faith. 1988. ‘‘Capital Issues and Minority-Owned Business.’’ Review of Black Politi-cal Economy 16(4): 77–109.
Aronson, Robert L. 1991. Self-Employment: A Labor Market Perspective. Ithaca: ILR Press.
Aspen Institute. 2005. ‘‘2005 Online Directory of Microenterprise Programs.’’ FIELDMicroenterprise Fund for Innovation, Effectiveness, Learning and Dissemination,hhttp://fieldus.org/Publications/Directory.aspi.
Astebro, Thomas, and Irwin Bernhardt. 2003. ‘‘Start-Up Financing, Owner Characteristics
and Survival.’’ Journal of Economics and Business 55(4): 303–320.
Astebro, T., and I. Bernhardt. 2004. ‘‘The Winners Curse of Human Capital.’’ Small Busi-ness Economics 24(1): 63–78.
Avery, Robert B., Raphael W. Bostic, and Katherine A. Samolyk. 1998. ‘‘The Role of Per-sonal Wealth in Small Business Finance.’’ Journal of Banking and Finance 22: 1019–1061.

8/9/2019 Race and Entrepreneurial Success - Black , Asian, And White Owned Business in the United States
http://slidepdf.com/reader/full/race-and-entrepreneurial-success-black-asian-and-white-owned-business 229/253
Avery, Robert B., and Michael S. Rendall. 1997. ‘‘The Contribution of Inheritances toBlack-White Wealth Disparities in the United States.’’ Bronfenbrenner Life Course CenterWorking Paper 97-08.
Avery, R. B., and M. S. Rendall. 2002. ‘‘Lifetime Inheritances of Three Generations of Whites and Blacks.’’ American Journal of Sociology 107(5): 1300–1346.
Baron, Salo W., Arcadius Kahan, and Nachum Gross. 1975. Economic History of the Jews.New York: Schocken Books.
Bates, Timothy. 1985. ‘‘Impact of Preferential Procurement Policies on Minority-OwnedBusinesses.’’ Review of Black Political Economy (Summer): 51–65.
Bates, Timothy. 1989. ‘‘The Changing Nature of Minority Business: A Comparative Anal-ysis of Asian, Nonminority, and Black-Owned Businesses.’’ Review of Black Political Econ-omy 18 (Fall): 25–42.
Bates, Timothy. 1990a. ‘‘The Characteristics of Business Owners Data Base.’’ Journal of Human Resources 25(4): 752–756.
Bates, Timothy. 1990b. ‘‘Entrepreneur Human Capital Inputs and Small Business Longev-ity.’’ Review of Economics and Statistics 72(4): 551–559.
Bates, Timothy. 1993a. Assessment of State and Local Government Minority Business Develop-ment Programs: Report to the U.S. Department of Commerce Minority Business Development
Agency. Washington, DC: U.S. Department of Commerce.
Bates, Timothy. 1993b. Banking on Black Enterprise. Washington, DC: Joint Center for Po-
litical and Economic Studies.
Bates, Timothy. 1994. ‘‘An Analysis of Korean-Immigrant-Owned Small-Business Start-Ups with Comparisons to African-American and Nonminority-Owned Firms.’’ Urban
Affairs Quarterly 30(2): 227–248.
Bates, Timothy. 1997. Race, Self-Employment and Upward Mobility: An Illusive AmericanDream. Washington, DC: Woodrow Wilson Center Press and Baltimore: Johns HopkinsUniversity Press.
Bates, Timothy. 2005. ‘‘Financing Disadvantaged Firms.’’ In Patrick Bolton and HowardRosenthal, eds., Credit Markets for the Poor (pp. 149–178). New York: Russell Sage
Foundation.
Bates, Timothy, and David Howell. 1997. ‘‘The Declining Status of African American Menin the New York City Construction Industry.’’ In Patrick Mason and Rhonda Williams,eds., Race, Markets, and Social Outcomes. Boston: Kluwer.
Bates, Timothy, and Alicia M. Robb. 2007. ‘‘Analysis of Young Neighborhood Firms Serv-ing Urban Minority Clients.’’ Working paper. Note: Forthcoming in Journal of Economicsand Business ( January 2008).
Bates, Timothy, and Darrell L. Williams. 1993. ‘‘Racial Politics: Does It Pay?’’ SocialScience Quarterly 74(3): 507–522.
Bates, Timothy, and Darrell Williams. 1996. ‘‘Do Preferential Procurement Programs Ben-efit Minority Business?’’ American Economic Review 86(2): 294–297.
Becker, G. 1971/1957. The Economics of Discrimination. Chicago: University of ChicagoPress.
216 References
8/9/2019 Race and Entrepreneurial Success - Black , Asian, And White Owned Business in the United States
http://slidepdf.com/reader/full/race-and-entrepreneurial-success-black-asian-and-white-owned-business 230/253
Bellotti, Jeanne. 2006. ‘‘First Findings from the Evaluation of Project GATE.’’ Paper pre-sented at the 2006 Association for Public Policy Analysis and Management Conference,Madison, WI, November 2.
Benus, J. M., Johnson, T. R., Wood, M., Grover, N., and Shen, T. 1995. Self-EmploymentPrograms: A New Reemployment Strategy. Final Report on the UI Self-Employment Demonstra-tion. Unemployment Insurance Occasional Paper 95-4. Washington, DC: U.S. Departmentof Labor, Employment and Training Administration, Unemployment Insurance Service.
Bitler, Marianne, Alicia Robb, and John Wolken, 2001. ‘‘Financial Services Used by SmallBusinesses: Evidence from the 1998 Survey of Small Business Finances.’’ Federal ReserveBulletin 87 (April): 183–205.
Bjelland, Melissa, John Haltiwanger, Kristin Sandusky, and James Spletzer. 2006. ‘‘Recon-ciling Household and Administrative Measures of Self-Employment and Entrepreneur-
ship.’’ U.S. Census Bureau Working Paper.Black, Jane, David de Meza, and David Jeffreys. 1996. ‘‘House Prices, the Supply of Col-lateral and the Enterprise Economy.’’ Economic Journal 106(434): 60–75.
Blanchard, Lloyd, John Yinger, and Bo Zhao. 2004. ‘‘Do Credit Market Barriers Exist forMinority and Women Entrepreneurs?’’ Syracuse University Working Paper.
Blanchflower, David G. 2004. ‘‘Self-Employment: More May Not Be Better.’’ DartmouthUniversity Working Paper.
Blanchflower, David G., P. Levine, and D. Zimmerman. 2003. ‘‘Discrimination in theSmall Business Credit Market.’’ Review of Economics and Statistics 85(4) (November): 930–
943.
Blanchflower, David G., and Andrew J. Oswald. 1998. ‘‘What Makes an Entrepreneur?’’ Journal of Labor Economics 16(1): 26–60.
Blanchflower, David G., Andrew Oswald, and Alois Stutzer. 2001. ‘‘Latent Entrepreneur-ship across Nations.’’ European Economic Review 45: 680–691.
Blanchflower, D. G., and Wainwright, J. 2005. ‘‘An Analysis of the Impact of AffirmativeAction Programs on Self-Employment in the Construction Industry.’’ National Bureau of Economic Research Working Paper No. 11793.
Blau, David M. 1987. ‘‘A Time-Series Analysis of Self-Employment in the United States.’’ Journal of Political Economy 95: 445–467.
Blau, Francine, and David Graham. 1990. ‘‘Black-White Differences in Wealth and AssetComposition.’’ Quarterly Journal of Economics 105(2): 321–339.
Blinder, Alan S. 1973. ‘‘Wage Discrimination: Reduced Form and Structural Variables.’’ Journal of Human Resources 8: 436–455.
Boden, Rick. 1996. ‘‘Gender and Self-Employment Selection: An Empirical Assessment.’’ Journal of Socio-Economics 25(6): 671–682.
Boden, Richard J. 1999. ‘‘Flexible Working Hours, Family Responsibilities, and FemaleSelf-Employment: Gender Differences in Self-Employment Selection.’’ American Journal of Economic Sociology 58(1): 71–76.
Boden, Rick, and Brian Headd. 2002. ‘‘Race and Gender Differences in Business Owner-ship and Business Turnover.’’ Business Economics (October): 61–71.
References 217
8/9/2019 Race and Entrepreneurial Success - Black , Asian, And White Owned Business in the United States
http://slidepdf.com/reader/full/race-and-entrepreneurial-success-black-asian-and-white-owned-business 231/253
Boden, Richard J., and Alfred R. Nucci. 1997. ‘‘Counting the Self-Employed Using House-hold and Business Sample Data.’’ Small Business Economics 9(5): 427–436.
Boden, Richard J., and Alfred Nucci. 2000. ‘‘On the Survival Prospects of Men’s and
Women’s New Business Ventures.’’ Journal of Business Venturing 15(4): 347–362.
Bonacich, Edna, and Ivan Light. 1988. Immigrant Entrepreneurs: Koreans in Los Angeles1965–1982. Berkeley: University of California Press.
Bonacich, Edna, and John Modell. 1980. The Economic Basis of Ethnic Solidarity in the Japa-nese American Community. Berkeley: University of California Press.
Borjas, George. 1986. ‘‘The Self-Employment Experience of Immigrants.’’ Journal of HumanResources 21 (Fall): 487–506.
Borjas, George. 1990. Friends or Strangers: The Impact of Immigrants on the U.S. Economy.
New York: Basic Books.
Borjas, George. 1994. ‘‘The Economics of Migration,’’ Journal of Economic Literature 32(4):1667–1717.
Borjas, George J. 1999. ‘‘The Wage Structure and Self-Selection into Self-Employment.’’Harvard University Working Paper.
Borjas, George, and Stephen Bronars. 1989. ‘‘Consumer Discrimination and Self-Employment.’’ Journal of Political Economy 97: 581–605.
Bostic, R., and K. P. Lampani. 1999. ‘‘Racial Differences in Patterns of Small Business Fi-nance: The Importance of Local Geography.’’ Working paper.
Boston, Thomas D. 1998. ‘‘Trends in Minority-Owned Businesses.’’ Paper presented at theNational Research Council Research Conference on Racial Trends in the United States,Washington, DC, October 15.
Boston, Thomas D. 1999a. Affirmative Action and Black Entrepreneurship. New York:Routledge.
Boston, Thomas D. 1999b. ‘‘Generating Jobs through African American Business Devel-opment.’’ In J. Whitehead and C. Harris, eds., Readings in Black Political Economy (pp.305–310). Dubuque: Kendall-Hunt.
Boston, Thomas D. 2003. ‘‘The ING Gazelle Index, Third Quarter, 2003.’’ Available athwww.inggazelleindex.comi.
Boston, Thomas D. 2005. ‘‘Black Patronage of Black-owned Businesses and Black Em-ployment.’’ In J. Whitehead, J. Stewart and C. Conrad, eds., African Americans in theUnited States (pp. 373–377). New York: Rowman & Littlefield.
Boston, Thomas D. 2006b. ‘‘The Role of Black-Owned Businesses in Black CommunityDevelopment.’’ Paul Ong, ed., Jobs and Economic Development in Minority Communities:Realities, Challenges, and Innovation (pp. 161–175). Philadelphia: Temple University Press.
Boston, Thomas D., and Linje R. Boston. 2007. ‘‘Secrets of Gazelles: The Differences
between High-Growth and Low-Growth Businesses Owned by African American Entre-preneurs.’’ Annals of the American Academy of Political and Social Science 613 (September):108–130.
Boyd, Robert L. 1990. ‘‘Black and Asian Self-Employment in Large Metropolitan Areas: AComparative Analysis.’’ Social Problems 37(2): 258–274.
218 References
8/9/2019 Race and Entrepreneurial Success - Black , Asian, And White Owned Business in the United States
http://slidepdf.com/reader/full/race-and-entrepreneurial-success-black-asian-and-white-owned-business 232/253
Boyd, Robert L. 1991. ‘‘Inequality in the Earnings of Self-Employed African and AsianAmericans.’’ Sociological Perspectives 34(4): 447–472.
Bradford, William D. 2003. ‘‘The Wealth Dynamics of Entrepreneurship for Black and
White Families in the U.S.’’ Review of Income and Wealth 49(1): 89–116.
Brownstone, David, and Robert Valletta. 2001. ‘‘The Bootstrap and Multiple Imputations:Harnessing Increased Computing Power for Improved Statistical Tests.’’ Journal of Eco-nomic Perspectives 15(4): 129–141.
Bruce, Donald. 1999. ‘‘Do Husbands Matter? Married Women Entering Self-Employment.’’ Small Business Economics 13: 317–329.
Bruderl, Josef, and Peter Preisendorfer. 1998. ‘‘Network Support and the Success of Newly Founded Businesses.’’ Small Business Economics 10: 213–225.
Brush, Candida, Nancy Carter, Elizabeth Gatewood, Patricia Greene, and Myra Hart.2004. Gatekeepers of Venture Growth: A Diana Project Report on the Role and Participationof Women in the Venture Capital Industry. Kansas City, MO: Ewing Marion KauffmanFoundation.
Bucks, Brian K., Arthur B. Kennickell, and Kevin B. Moore. 2006. ‘‘Recent Changes in U.S.Family Finances: Evidence from the 2001 and 2004 Survey of Consumer Finances.’’ Fed-eral Reserve Bulletin 92: A1–A38.
Cain, Glen G. 1987. ‘‘The Economic Analysis of Labor Market Discrimination: A Survey.’’Orley Ashenfelter and R. Laynard, eds., Handbook of Labor Economics (vol. 1, pp. 693–781).Amsterdam: Elsevier.
Card, David. 1999. ‘‘The Causal Effect of Education on Earnings.’’ Orley Ashenfelter andDavid Card, eds., Handbook of Labor Economics (vol. 3A, pp. 1801–1863). Amsterdam:Elsevier.
Carr, Deborah. 1996. ‘‘Two Paths to Self-Employment? Women’s and Men’s Self-Employment in the United States, 1980.’’ Work and Occupations 23: 26–53.
Cavalluzzo, Ken, Linda Cavalluzzo, and John Wolken. 2002. ‘‘Competition, Small Busi-ness Financing, and Discrimination: Evidence from a New Survey.’’ Journal of Business75(4): 641–679.
Cavalluzzo, Ken, and John Wolken. 2005. ‘‘Small Business Loan Turndowns, PersonalWealth and Discrimination.’’ Journal of Business 78(6): 2153–2177.
Cayton, Horace R., and St. Clair Drake. 1946. Black Metropolis. London: Jonathan Cape.
Center for Human Resource Research. 2005. NLSY79 Users’ Guide. Columbus: Ohio StateUniversity.
Chaganti, Radha, and Patricia Greene. 2002. ‘‘Who Are Ethnic Entrepreneurs? A Study of Entrepreneurs’ Ethnic Involvement and Business Characteristics.’’ Journal of Small Busi-ness Management 40(2): 126–143.
Charles, Kerwin Kofi, and Erik Hurst. 2002. ‘‘The Transition to Home-Ownership and theBlack-White Wealth Gap.’’ Review of Economics and Statistics 84(2): 281–297.
Chay, Kenneth, Robert Fairlie, and Ronnie Chatterji. 2005. ‘‘The Impact of ContractingSet-Asides on Minority Business Ownership.’’ University of California Working Paper.
References 219

8/9/2019 Race and Entrepreneurial Success - Black , Asian, And White Owned Business in the United States
http://slidepdf.com/reader/full/race-and-entrepreneurial-success-black-asian-and-white-owned-business 233/253
Christopher, Jan. 1993. ‘‘Empirical Analyses of the Factors Influencing Business Perfor-mance.’’ Ph.D. dissertation, Howard University.
Christopher, Jan. 1998. ‘‘Minority Business Formation and Survival: Evidence on Business
Performance and Viability.’’ Review of Black Political Economy 26(3): (Summer): 37–72.
Clark, Kenneth, and Stephen Drinkwater. 1998. ‘‘Ethnicity and Self-Employment in Brit-ain.’’ Oxford Bulletin of Economics and Statistics 60: 383–407.
Clark, Kenneth, and Stephen Drinkwater. 2000. ‘‘Pushed Out or Pulled In? Self-Employment among Ethnic Minorities in England and Wales.’’ Labour Economics 7: 603–628.
Clark, Kenneth, and Stephen Drinkwater. 2002. ‘‘Enclaves, Neighbourhood Effects andEmployment Outcomes: Ethnic Minorities in England and Wales.’’ Journal of PopulationEconomics 15: 5–29.
Coate, Stephen, and Sharon Tennyson. 1992. ‘‘Labor Market Discrimination, Imperfect In-formation and Self-Employment.’’ Oxford Economic Papers 44: 272–288.
Cobb-Clark, Deborah A., and Vincent Hildebrand. 2006. ‘‘The Wealth of Mexican Ameri-cans.’’ Journal of Human Resources 41(4): 841–868.
Coleman, Susan. 2001. ‘‘Constraints Faced by Women Small Business Owners: Evidencefrom the Data.’’ Paper presented at the United States Association for Small Business andEntrepreneurship Annual Meetings, Orlando, February 8.
Coleman, Susan. 2002. ‘‘The Borrowing Experience of Black and Hispanic-Owned Small
Firms: Evidence from the 1998 Survey of Small Business Finances.’’ Academy of Entrepre-neurship Journal 8(1): 1–20.
Coleman, Susan. 2003. ‘‘Borrowing Patterns for Small Firms: A Comparison by Race andEthnicity.’’ Journal of Entrepreneurial Finance and Business Ventures 7(3): 87–108.
Conley, Dalton. 1999. Being Black, Living in the Red: Race, Wealth and Social Policy in Amer-ica. Los Angeles: University of California Press.
Davidsson, Per, and Benson Honig. 2003. ‘‘The Role of Social and Human Capital amongNascent Entrepreneurs.’’ Journal of Business Venturing 18(3): 301–331.
Dawkins, Casey J. 2007. ‘‘Race, Space, and the Dynamics of Self-Employment.’’ VirginiaTech Working Paper.
Devine, Theresa J. 1994. ‘‘Characteristics of Self-Employed Women in the United States.’’ Monthly Labor Review 117(3): 20–34.
Djankov, Simeon, Edward Miguel, Yingyi Qian, Gerald Roland, and Ekaterina Zhurav-skaya. 2005. ‘‘Who Are Russia’s Entrepreneurs?’’ Journal of the European Economic Associa-tion, Papers and Proceedings 3(2–3): 587–597.
Djankov, Simeon, Yingyi Qian, Gerald Roland, and Ekaterina Zhuravskaya. 2006. ‘‘WhoAre China’s Entrepreneurs?’’ American Economic Review 96(2): 348–352.
Djankov, Simeon, Yingyi Qian, Gerald Roland, and Ekaterina Zhuravskaya. 2007. ‘‘WhatMakes a Successful Entrepreneur? Evidence from Brazil.’’ World Bank Working Paper:Washington, DC.
Du Bois, W. E. B. 1899. The Philadelphia Negro. Philadelphia: University of Pennsylvania.
220 References
8/9/2019 Race and Entrepreneurial Success - Black , Asian, And White Owned Business in the United States
http://slidepdf.com/reader/full/race-and-entrepreneurial-success-black-asian-and-white-owned-business 234/253
Dunn, Thomas A., and Douglas J. Holtz-Eakin. 2000. ‘‘Financial Capital, Human Capital,and the Transition to Self-Employment: Evidence from Intergenerational Links.’’ Journalof Labor Economics 18(2): 282–305.
Earle, John S., and Zuzana Sakova. 2000. ‘‘Business Start-Ups or Disguised Unemploy-ment? Evidence on the Character of Self-Employment from Transition Economies.’’Labour Economics 7(5): 575–601.
Enchautegui, Maria E., Michael Fix, Pamela Loprest, Sarah von der Lippe, and DouglasWissoker. 1996. Do Minority-Owned Businesses Get a Fair Share of Government Contracts.Washington, DC: Urban Institute.
Evans, David, and Boyan Jovanovic. 1989. ‘‘An Estimated Model of EntrepreneurialChoice under Liquidity Constraints.’’ Journal of Political Economy 97(4): 808–827.
Evans, David, and Linda Leighton. 1989. ‘‘Some Empirical Aspects of Entrepreneurship.’’
American Economic Review 79: 519–535.
Fairlie, Robert W. 1999. ‘‘The Absence of the African-American Owned Business: AnAnalysis of the Dynamics of Self-Employment.’’ Journal of Labor Economics 17(1): 80–108.
Fairlie, Robert W. 2002. ‘‘Drug Dealing and Legitimate Self-Employment.’’ Journal of LaborEconomics 20(3): 538–567.
Fairlie, Robert W. 2004a. ‘‘Does Business Ownership Provide a Source of Upward Mobil-ity for Blacks and Hispanics?’’ Doug Holtz-Eakin and Harvey S. Rosen, eds., Public Policyand the Economics of Entrepreneurship (pp. 153–180). Cambridge, MA: MIT Press.
Fairlie, Robert W. 2004b. ‘‘Recent Trends in Ethnic and Racial Business Ownership.’’Small Business Economics 23: 203–218.
Fairlie, Robert W. 2004c. Self-Employed Business Ownership Rates in the United States: 1979– 2003. Washington, DC: U.S. Small Business Administration, Office of Advocacy.
Fairlie, Robert W. 2005a. ‘‘An Extension of the Blinder-Oaxaca Decomposition Techniqueto Logit and Probit Models.’’ Journal of Economic and Social Measurement 30(4): 305–316.
Fairlie, Robert W. 2005b. ‘‘Self-Employment, Entrepreneurship and the National Longitu-dinal Survey of Youth.’’ Monthly Labor Review (Special issue commemorating the twenty-fifth anniversary of the NLSY79) 128(2): 40–47.
Fairlie, Robert W. 2006. ‘‘Entrepreneurship among Disadvantaged Groups: An Analysisof the Dynamics of Self-Employment by Gender, Race and Education.’’ In Simon Parker,ed., The Life Cycle of Entrepreneurial Ventures, International Handbook Series on Entrepre-neurship (vol. 3, pp. 437–475). New York: Springer.
Fairlie, Robert W. 2007. The Kauffman Index of Entrepreneurial Activity: 1996–2006. KansasCity, MO: Ewing Marion Kauffman Foundation.
Fairlie, Robert W., and Harry A. Krashinsky, 2005. ‘‘Liquidity Constraints, HouseholdWealth, and Entrepreneurship Revisited.’’ Working paper.
Fairlie, Robert W., and Bruce D. Meyer. 1996. ‘‘Ethnic and Racial Self-Employment Differ-ences and Possible Explanations.’’ Journal of Human Resources 31 (Fall): 757–793.
Fairlie, Robert W., and Bruce D. Meyer. 2000. ‘‘Trends in Self-Employment among Blackand White Men: 1910–1990.’’ Journal of Human Resources 35(4): 643–669.
References 221

8/9/2019 Race and Entrepreneurial Success - Black , Asian, And White Owned Business in the United States
http://slidepdf.com/reader/full/race-and-entrepreneurial-success-black-asian-and-white-owned-business 235/253
8/9/2019 Race and Entrepreneurial Success - Black , Asian, And White Owned Business in the United States
http://slidepdf.com/reader/full/race-and-entrepreneurial-success-black-asian-and-white-owned-business 236/253
Handy, John, and David Swinton. 1983. The Determinants of the Growth of Black-OwnedBusinesses: A Preliminary Analysis. Washington, DC: U.S. Department of Commerce.
Handy, John, and David Swinton. 1984. ‘‘The Determinants of the Rate of Growth of
Black-Owned Businesses.’’ Review of Black Political Economy 12: 85–110.
Hao, Lingxin. 2007. Color Lines, Country Lines: Race, Immigration, and Wealth Stratificationin America. New York: Russell Sage Foundation.
Headd, Brian. 1999. ‘‘The Characteristics of Business Owners Database, 1992.’’ U.S. Cen-sus Bureau, Center for Economic Studies, Working Paper CES-WP-99-8.
Headd, Brian. 2003. ‘‘Redefining Business Success: Distinguishing between Closure andFailure.’’ Small Business Economics 21(1): 51–61.
Headd, Brian. 2005. ‘‘Measuring Microenterprise: Data on Self-Employment and Nonem-
ployers.’’ Working paper.
Hipple, Steven. 2004. ‘‘Self-Employment in the United States: An Update.’’ Monthly LaborReview 127(7): 13–23.
Holtz-Eakin, Douglas, David Joulfaian, and Harvey Rosen. 1994a. ‘‘Entrepreneurial Deci-sions and Liquidity Constraints.’’ RAND Journal of Economics 23: 334–347.
Holtz-Eakin, Douglas, David Joulfaian, and Harvey Rosen. 1994b. ‘‘Sticking It Out: Entre-preneurial Survival and Liquidity Constraints.’’ Journal of Political Economy 102(1): 53–75.
Holtz-Eakin, Douglas, and Harvey Rosen. 2004. ‘‘Cash Constraints and Business Start-Ups: Deutschmarks versus Dollars.’’ Syracuse University Working Paper.
Holtz-Eakin, Douglas, Harvey S. Rosen, and Robert Weathers. 2000. ‘‘Horatio AlgerMeets the Mobility Tables.’’ Small Business Economics 14: 243–274.
House-Soremekun, Bessie. 2002. Confronting the Odds: African-American Entrepreneurshipin Cleveland, Ohio. Kent, OH: Kent State University Press.
Hout, Michael, and Harvey S. Rosen. 2000. ‘‘Self-Employment, Family Background, andRace.’’ Journal of Human Resources 35(4): 670–692.
Hundley, Greg. 2000. ‘‘Male/Female Earnings Differences in Self-Employment: TheEffects of Marriage, Children, and the Household Division of Labor.’’ Industrial and Labor
Relations Review 54(1): 95–104.
Hurst, Erik, and Annamaria Lusardi. 2004. ‘‘Liquidity Constraints, Household Wealth,and Entrepreneurship.’’ Journal of Political Economy 112(2): 319–347.
International Labour Organization. 2005. Labour Statistics Database. Available at hhttp://laborsta.ilo.orgi.
Johansson, Edvard. 2000. ‘‘Self-Employment and Liquidity Constraints: Evidence fromFinland.’’ Scandinavian Journal of Economics 102(1): 123–134.
Joint Center for Political and Economic Studies. 1994. Assessment of Minority Business De-
velopment Programs. Report to the U.S. Department of Commerce Minority Business De-velopment Agency, Washington, DC.
Jones, F. L. 1983. ‘‘On Decomposing the Wage Gap: A Critical Comment on Blinder’sMethod.’’ Journal of Human Resources 18(1): 126–130.
References 223

8/9/2019 Race and Entrepreneurial Success - Black , Asian, And White Owned Business in the United States
http://slidepdf.com/reader/full/race-and-entrepreneurial-success-black-asian-and-white-owned-business 237/253
Jovanovic, Boyan. 1982. ‘‘Selection and the Evolution of Industry.’’ Econometrica 50(3):649–670.
Kalnins, Arturs, and Wilbur Chung. 2006. ‘‘Social Capital, Geography, and Survival:
Gujarati Immigrant Entrepreneurs in the U.S. Lodging Industry.’’ Management Science52(2): 233–247.
Kassoudji, Sherrie. 1988. ‘‘English Language Abilities and the Labor Market Opportuni-ties of Hispanic and East Asian Men.’’ Journal of Labor Economics 6(2): 205–228.
Kawaguchi, Daiji. 2004. ‘‘Positive, Non-Earnings Aspects of Self-Employment: Evidencefrom Job Satisfaction Scores.’’ University of Tsukuba Institute of Policy and PlanningSciences Working Paper.
Kawaguchi, Daiji. 2005. ‘‘Negative Self Selection into Self-Employment among AfricanAmericans.’’ Topics in Economic Analysis and Policy 5(1): art. 9, 1–25.
Kennickell, Arthur B. 1998. ‘‘Multiple Imputation in the Survey of Consumer Finances.’’Paper prepared for the August 1998 Joint Statistical Meetings, Dallas.
Kihlstrom, Richard, and Jean-Jacques Laffont. 1979. ‘‘A General Equilibrium Entrepreneu-rial Theory of Firm Formation Based on Risk Aversion.’’ Journal of Political Economy 87(4):719–748.
Kijakazi, K. 1997. African-American Economics Development and Small Business Ownership.New York: Garland Press.
Kim, Kwang Chung, and Won Moo Hurh. 1985. ‘‘Ethnic Resources Utilization of Korean
Immigrant Entrepreneurs in the Chicago Minority Area.’’ International Migration Review19(1): 82–111.
Kim, Kwang, Won Hurh, and Marilyn Fernandez. 1989. ‘‘Intragroup Differences in Busi-ness Participation: Three Asian Immigrant Groups.’’ International Migration Review 23(1):73–95.
Kim, Phillip H., Howard E. Aldrich, and Lisa A. Keister. 2006. ‘‘Access (Not) Denied: TheImpact of Financial, Human, and Cultural Capital on Entrepreneurial Entry in the UnitedStates.’’ Small Business Economics 27(1): 5–22.
Kinzer, Robert H., and Edward Sagarin. 1950. The Negro in American Business: the Conflict
between Separatism and Integration. New York: Greenberg.
Knight, Frank. 1921. Risk Uncertainty, and Profit. New York: Houghton Mifflin.
Kosanovich, William T., Heather Fleck, Berwood Yost, Wendy Armon, and SandraSiliezar. 2001. Comprehensive Assessment of Self-Employment Assistance Programs. U.S.Department of Labor Report.
Lentz, Bernard, and David Laband. 1990. ‘‘Entrepreneurial Success and Occupational In-heritance among Proprietors.’’ Canadian Journal of Economics 23(3): 563–579.
Levenstein, Margaret. 1995. ‘‘African American Entrepreneurship: The View from the1910 Census.’’ Business and Economic History 24(1): 106–122.
Light, Ivan. 1972. Ethnic Enterprise in America. Berkeley: University of California Press.
Light, Ivan. 1979. ‘‘Disadvantaged Minorities in Self Employment.’’ International Journal of Comparative Sociology 20(1–2): 31–45.
224 References

8/9/2019 Race and Entrepreneurial Success - Black , Asian, And White Owned Business in the United States
http://slidepdf.com/reader/full/race-and-entrepreneurial-success-black-asian-and-white-owned-business 238/253
Light, Ivan. 2004. ‘‘The Ethnic Economy.’’ In Neil Smelser and Richard Swedberg, eds., Handbook of Economic Sociology (2nd ed.). New York: Russell Sage Foundation.
Light, Ivan, Im Jung Kwuon, and Deng Zhong. 1990. ‘‘Korean Rotating Credit Associa-
tions in Los Angeles.’’ Amerasia Journal 16(2): 35–54.
Lindh, Thomas, and Henry Ohlsson. 1996. ‘‘Self-Employment and Windfall Gains: Evi-dence from the Swedish Lottery.’’ Economic Journal 106(439): 1515–1526.
Lindh, Thomas, and Henry Ohlsson. 1998. ‘‘Self-Employment and Wealth Inequality.’’Review of Income and Wealth 44(1): 25–41.
Loewen, James W. 1971. The Mississippi Chinese: Between Black and White. Cambridge:Harvard University Press.
Lofstrom, Magnus, and Chunbei Wang. 2006. ‘‘Hispanic Self-Employment: A Dynamic
Analysis of Business Ownership.’’ Paper presented at the University of North CarolinaMinority Entrepreneurship Bootcamp.
Lohmann, Henning. 2001. ‘‘Self-Employed or Employee, Full-Time or Part-Time? GenderDifferences in the Determinants and Conditions for Self-Employment in Europe and theUS.’’ Mannheim Centre for European Social Research Working Paper 38.
Lombard, Karen V. 2001. ‘‘Female Self-Employment and Demand for Flexible, Nonstan-dard Work Schedules.’’ Economic Inquiry 39(2): 214–237.
Lowrey, Ying. 2005. Dynamics of Minority-Owned Employer Establishments, 1997–2001: An Analysis of Employer Data from the Survey of Minority-Owned Business Establishments. Wash-
ington, DC: U.S. Small Business Administration, Office of Advocacy.
Lucas, Robert. 1978. ‘‘On the Size Distribution of Firms.’’ Bell Journal of Economics 9(2):508–523.
MacDonald, Heather. 1995. ‘‘Why Koreans Succeed.’’ City Journal (Spring): 12–29.
Mach, Traci L., and John D. Wolken. 2006. ‘‘Financial Services Used by Small Businesses:Evidence from the 2003 Survey of Small Business Finances.’’ Federal Reserve Bulletin 87:167–195.
Mar, Don. 2005. ‘‘Individual Characteristics vs. City Structural Characteristics: ExplainingSelf-Employment Differences among Chinese, Japanese, and Filipinos in the UnitedStates.’’ Journal of Socio-Economics 34: 341–359.
Marion, Justin. 2007. ‘‘How Costly Is Affirmative Action? Government Contracting andCalifornia’s Proposition 209.’’ University of Chicago Working Paper.
McLanahan, Sara, and Gary Sandefur. 1994. Growing Up with a Single Parent: What Hurts,What Helps. Cambridge, MA: Harvard University Press.
Menchik, Paul L., and Nancy A. Jianakoplos. 1997. ‘‘Black-White Wealth Inequality: Is In-heritance the Reason?’’ Economic Inquiry 35(2): 428–442.
Meyer, Bruce. 1990. ‘‘Why Are There So Few Black Entrepreneurs?’’ National Bureau of
Economic Research Working Paper No. 3537.
Min, Pyong. 1984. ‘‘From White-Collar Occupations to Small Business: Korean Immi-grants’ Occupational Adjustment.’’ Sociological Quarterly 25(3): 333–352.
Min, Pyong. 1986–1987. ‘‘Filipino and Korean Immigrants in Small Business: A Compar-ative Analysis.’’ Amerasia Journal 13(1): 53–71.
References 225

8/9/2019 Race and Entrepreneurial Success - Black , Asian, And White Owned Business in the United States
http://slidepdf.com/reader/full/race-and-entrepreneurial-success-black-asian-and-white-owned-business 239/253
Min, Pyong Gap. 1988. Ethnic Business Enterprises: Korean Small Business in Atlanta. NewYork: Center for Migration Studies.
Min, Pyong Gap. 1989. Some Positive Functions of Ethnic Business for an Immigrant Commu-
nity: Koreans in Los Angeles. Final Report Submitted to the National Science Foundation,Washington, DC.
Min, Pyong Gap. 1993. ‘‘Korean Immigrants in Los Angeles.’’ In Ivan Light and Par-minder Bhachu, eds., Immigration and Entrepreneurship: Culture, Capital, and Ethnic Net-works. New Brunswick, NJ: Transaction Publishers.
Min, Pyong Gap. 1996. Caught in the Middle: Korean Merchants in America’s MultiethnicCities. Berkeley: University of California Press.
Minority Business Enterprise Legal Defense and Education Fund. 1988. Report on the Mi-nority Business Enterprise Programs of State and Local Governments. Washington, DC: Mi-
nority Business Enterprise Legal Defense and Education Fund.
Mitchell, K., and D. K. Pearce. 2004. Availability of Financing to Small Firms using the Sur-vey of Small Business Finances. U.S. Small Business Administration, Office of Advocacy.
Moore, Robert L. 1983. ‘‘Employer Discrimination: Evidence from Self-employed Work-ers.’’ Review of Economics and Statistics 65: 496–501.
Moutray, Chad. 2007. ‘‘Educational Attainment and Other Characteristics of the Self-Employed: An Examination Using the Panel Study of Income Dynamics Data.’’ U.S.Small Business Administration Working Paper.
Myers, Samuel L., Jr. 1997. ‘‘Minority Business Set-Asides.’’ In Encyclopedia of African- American Business History. Westport, CT: Greenwood Press.
Myers, Samuel L., Jr., and Tsze Chan. 1996. ‘‘Who Benefits from Minority Business Set-Asides? The Case of New Jersey.’’ Journal of Policy Analysis and Management 15(2): 202–226.
Myrdal, Gunnar. 1944. An American Dilemma. New York: Harper.
National Center for Health Statistics. 2003. ‘‘Births: Final Data for 2003.’’ National VitalStatistics Reports 51(2).
National Federation of Independent Business. 2002. National Small Business Poll: Familiesin Business. Washington, DC: NFIB.
Nicolaou, Nicos, Scott Shane, Lynn Cherkas, Janice Hunkin, and Tim D. Spector. 2007.‘‘Is the Tendency to Engage in Self-Employment Genetic?’’ Imperial College LondonWorking Paper.
Nykvist, Jenny. 2005. ‘‘Entrepreneurship and Liquidity Constraints: Evidence from Swe-den.’’ Uppsala University, Department of Economics, Working Paper 2005: 21.
Oaxaca, Ronald. 1973. ‘‘Male-Female Wage Differentials in Urban Labor Markets.’’ Inter-national Economic Review 14: 693–709.
Oaxaca, Ronald, and Michael Ransom. 1994. ‘‘On Discrimination and the Decompositionof Wage Differentials.’’ Journal of Econometrics 61: 5–21.
Oliver, Melvin L., and Thomas M. Shapiro. 1995. Black Wealth/White Wealth: A New Per-spective on Racial Inequality. New York: Routledge.
226 References
8/9/2019 Race and Entrepreneurial Success - Black , Asian, And White Owned Business in the United States
http://slidepdf.com/reader/full/race-and-entrepreneurial-success-black-asian-and-white-owned-business 240/253
Organization for Economic Cooperation and Development (OECD). 1992. EmploymentOutlook 1992. Paris: OECD. Available at hhttp://www.oecd.org/dataoecd/4/8/2409984.pdf i.
Parker, Simon C. 2004. The Economics of Self-Employment and Entrepreneurship. Cambridge:Cambridge University Press.
Parker, Simon C. 2005. ‘‘Entrepreneurship among Married Couples in the United States:A Simultaneous Probit Approach.’’ Institute for the Study of Labor (IZA) DiscussionPaper 1712.
Polivka, Anne E., and Stephen M. Miller. 1998. ‘‘The CPS after the Redesign: Refocusingthe Economic Lens.’’ In John Haltiwanger, Marilyn E. Manser, and Robert Toel, eds.,Labor Statistics Measurement Issues (pp. 249–286). Chicago: University of Chicago Press.
Porter, Michael. 1995. ‘‘The Competitive Advantage of the Inner City.’’ Harvard Business
Review 73(3): 55–71.
Portes, Alejandro, and R. L. Bach. 1985. Latin Journey: Cuban and Mexican Immigrants in theUnited States. Berkeley: University of California Press.
Portes, Alejandro, and Min Zhou. 1996. ‘‘Self-Employment and the Earnings of Immi-grants.’’ American Sociological Review (61): 219–230.
Rauch, James E. 2001. ‘‘Black Ties Only? Ethnic Business Networks, Intermediaries, andAfrican-American Retail Entrepreneurship.’’ In James E. Rauch and Alessandra Casella,eds., Networks and Markets. New York: Russell Sage Foundation.
Razin, Eran, and Andre Langlois. 1996. ‘‘Metropolitan Characteristics and Entrepreneur-ship among Immigrants and Ethnic Groups in Canada.’’ International Migration Review30(3): 703–727.
Rees, Hedley, and Anup Shah. 1986. ‘‘An Empirical Analysis of Self-Employment in theU.K.’’ Journal of Applied Econometrics 1(1): 95–108.
Reynolds, Paul. 2005. Entrepreneurship in the US: The Future Is Now. New York: Springer.
Reynolds, P., and S. White. 1997. The Entrepreneurial Process: Economic Growth, Men,Women, and Minorities. Westport, CT: Quorum Books.
Rice, Mitchell F. 1991. ‘‘Government Set-Asides, Minority Business Enterprises, and theSupreme Court.’’ Public Administration Review 51(2): 114–122.
Robb, Alicia. 2000. ‘‘The Role of Race, Gender, and Discrimination in Business Survival.’’Doctoral dissertation, University of Michigan Press.
Robb, Alicia. 2002. ‘‘Entrepreneurship: A Path for Economic Advancement for Womenand Minorities?’’ Journal of Developmental Entrepreneurship 7(4): 383–397.
Robb, Alicia. 2005. ‘‘Fear in Financing: The Borrowing Experiences of Minority Firms.’’Working paper.
Robb, Alicia M., and Robert W. Fairlie 2006. ‘‘Tracing Access to Financial Capital among
African-Americans from the Entrepreneurial Venture to the Established Business.’’ Uni-versity of California, Santa Cruz, Working Paper.
Rubin, Donald B. 1987. Multiple Imputation for Nonresponse in Surveys. New York: JohnWiley.
References 227
8/9/2019 Race and Entrepreneurial Success - Black , Asian, And White Owned Business in the United States
http://slidepdf.com/reader/full/race-and-entrepreneurial-success-black-asian-and-white-owned-business 241/253
Saxenian, AnnaLee. 2002. Local and Global Networks of Immigrant Professionals in SiliconValley. San Francisco: Public Policy Institute of California.
Schafer, Joseph L. 1999. ‘‘Multiple Imputation: A Primer.’’ Statistical Methods in Medical
Research 8: 3–15.
Schafer, Joseph L., and Maren K. Olsen. 1998. ‘‘Multiple Imputation for MultivariateMissing-Data Problems: A Data Analyst’s Perspective.’’ Multivariate Behavioral Research33(4): 545–571.
Scholz, John Karl, and Kara Levine. 2004. ‘‘U.S. Black-White Wealth Inequality.’’ In K.Neckerman, ed., Social Inequality (pp. 895–929). New York: Russell Sage Foundation.
Schumpeter, J. A. 1934. The Theory of Economic Development. Cambridge, MA: HarvardUniversity Press.
Seltzer, Judith. 1994. ‘‘The Consequences of Marital Dissolution for Children.’’ Annual Re-view of Sociology 20: 235–266.
Servon, Lisa J. 1999. Bootstrap Capital: Microenterprises and the American Poor. Washington,DC: Brookings Institution Press.
Shane, Scott, and Daniel Cable. 2002. ‘‘Network Ties, Reputation, and the Financing of New Ventures.’’ Management Science 48(3): 364–381.
Sowell, Thomas. 1981. Markets and Minorities. New York: Basic Books.
Srinivasan, R., C. Woo, and A. C. Cooper. 1994. ‘‘Performance Determinants for Male andFemale Entrepreneurs.’’ Working Paper 1053, Purdue University.
Taylor, Mark. 2001. ‘‘Self-Employment and Windfall Gains in Britain: Evidence fromPanel Data.’’ Economica 63: 539–565.
Tucker, M. Belinda, and Claudia Mitchell-Kernan. 1995. The Decline in Marriage among African-Americans: Causes, Consequences, and Policy Implications. New York: Russell SageFoundation.
U.S. Bureau of Labor Statistics. 2004. ‘‘Median Weekly Earnings of Full-Time Wage andSalary Workers by Selected Characteristics.’’ Labor Force Statisticsw from the Current Popu-lation Survey. Available at hhttp://www.bls.gov/cps/cpsaat37.pdf i.
U.S. Bureau of Labor Statistics. 2007. ‘‘Table A-2. Employment Status of the Civilian Pop-ulation by Race, Sex, and Age’’ and ‘‘Table A-3. Employment Status of the Hispanic orLatino Population by Sex and Age.’’ Available at hhttp://stats.bls.gov/news.release/empsit.toc.htmi.
U.S. Census Bureau. 1992. 1987 Economic Census: Characteristics of Business Owners. Wash-ington, DC: U.S. Government Printing Office.
U.S. Census Bureau. 1996. 1992 Economic Census: Survey of Minority-Owned Business Enter- prises, Asians and Pacific Islanders, American Indians, and Alaska Natives. Washington, DC:U.S. Government Printing Office.
U.S. Census Bureau. 1997. 1992 Economic Census: Characteristics of Business Owners. Wash-ington, DC: U.S. Government Printing Office.
U.S. Census Bureau. 2001. 1997 Economic Census: Company Summary. Washington, DC:U.S. Government Printing Office.
228 References
8/9/2019 Race and Entrepreneurial Success - Black , Asian, And White Owned Business in the United States
http://slidepdf.com/reader/full/race-and-entrepreneurial-success-black-asian-and-white-owned-business 242/253
U.S. Census Bureau. 2005a. ‘‘Educational Attainment in the United States: March 2004.’’Current Population Reports, Population Characteristics, P20-476. Washington, DC: U.S. Gov-ernment Printing Office.
U.S. Census Bureau. 2005b. Families and Living Arrangements. Available at hhttp://www.census.gov/population/www/socdemo/hh-fam.html#history i.
U.S. Census Bureau. 2006a. Characteristics of Businesses: 2002: 2002 Economic Census, Sur-vey of Business Owners Company Statistics Series. Washington, DC: U.S. Government Print-ing Office.
U.S. Census Bureau. 2006b. 2002 Economic Census, Survey of Business Owners Company Sta-tistics Series. Washington, DC: U.S. Government Printing Office.
U.S. Census Bureau. 2007. ‘‘Wealth and Asset Ownership.’’ Available at hhttp://www.census.gov/hhes/www/wealth/1998_2000_tables.htmli.
U.S. Department of Labor. 1992. Self-Employment Programs for Unemployed Workers. Un-employment Insurance Occasional Paper 92-2. Washington, DC: U.S. Government Print-ing Office.
U.S. Small Business Administration. 1999. Minorities in Business. Washington, DC: U.S.Small Business Administration, Office of Advocacy.
U.S. Small Business Administration. 2001. Minorities in Business. Washington, DC: U.S.Small Business Administration, Office of Advocacy.
U.S. Small Business Administration. 2007a. Minorities in Business: A Demographic Review of
Minority Business Ownership. Washington, DC: U.S. Small Business Administration, Officeof Advocacy.
U.S. Small Business Administration. 2007b. Office of Financial Assistance Statistics on SmallBusiness Administration Loan Approval. Washington, DC: U.S. Small Business Administra-tion, Office of Advocacy.
van der Sluis, J., van Praag, M., and Vijverberg, W. 2004. Education and Entrepreneurshipin Industrialized Countries: A Meta-Analysis. Tinbergen InstituteWorking Paper No. TI03–046/3. Amsterdam: Tinbergen Institute.
van Praag, Mirjam. 2005. ‘‘Successful Entrepreneurship: Confronting Economic Theory
with Empirical Practice.’’ Cheltenham, UK: Elgar.
Vroman, Wayne. 1997. ‘‘Self-Employment Assistance: Revised Report.’’ Washington, DC:Urban Institute.
Waldinger, Roger. 1986. ‘‘Immigrant Enterprise: A Critique and Reformulation.’’ Theoryand Society 15(1–2): 249–285.
Waldinger, Rober, Howard Aldrich, and Robin Ward. 1990. Ethnic Entrepreneurs. New- bury Park, CA: Sage.
Walstad, William B., and Marilyn L. Kourilsky. 1998. ‘‘Entrepreneurial Attitudes andKnowledge of Black Youth.’’ Entrepreneurship Theory and Practice 23(2): 5–18.
Wilson, James Q. 2002. The Marriage Problem: How Our Culture Has Weakened Families.New York: HarperCollins.
Wilson, William J. 1987. The Truly Disadvantaged: The Inner City, the Underclass, and PublicPolicy. Chicago: University of Chicago Press.
References 229

8/9/2019 Race and Entrepreneurial Success - Black , Asian, And White Owned Business in the United States
http://slidepdf.com/reader/full/race-and-entrepreneurial-success-black-asian-and-white-owned-business 243/253
Wolff, Edward N. 2001. ‘‘Recent Trends in Wealth Ownership, from 1983 to 1998.’’ InThomas M. Shapiro and Edward N. Wolff, eds., Assets for the Poor: The Benefits of Spread-ing Asset Ownership (pp. 34–73). New York: Russell Sage Foundation.
Yoon, In-Jin. 1991. ‘‘The Changing Significance of Ethnic and Class Resources in Immi-grant Business.’’ International Migration Review 25(2): 303–331.
Yoon, In-Jin. 1993. ‘‘The Social Origins of Korean Immigration to the United States from1965 to the Present.’’ Paper No. 121, Papers of the Program on Population, East-WestCenter, Honolulu, Hawaii.
Yoon, In-Jin. 1995. ‘‘The Growth of Korean Immigrant Entrepreneurship in Chicago.’’ Eth-nic and Racial Studies 18(2): 315–335.
Yoon, In-Jin. 1997. On My Own: Korean Businesses and Race Relations in America. Chicago:University of Chicago Press.
Yuengert, Andrew M. 1995. ‘‘Testing Hypotheses of Immigrant Self-Employment.’’ Jour-nal of Human Resources 30(1): 194–204.
Zhou, M. 1992. Chinatown: The Socioeconomic Potential of an Urban Enclave. Philadelphia:Temple University Press.
Zhou, M. 1995. ‘‘Low-Wage Employment and Social Mobility: The Experience of Immi-grant Chinese Women in New York City.’’ National Journal of Sociology 9(1): 1–30.
Zhou, M. 2004. ‘‘Revisiting Ethnic Entrepreneurship: Convergencies, Controversies, andConceptual Advancements.’’ International Migration Review 38(3): 1040–1074.
Zissimopoulos, Julie, and Lynn Karoly. 2003. ‘‘Transitions to Self-Employment at OlderAges.’’ RAND Working Paper.
230 References

8/9/2019 Race and Entrepreneurial Success - Black , Asian, And White Owned Business in the United States
http://slidepdf.com/reader/full/race-and-entrepreneurial-success-black-asian-and-white-owned-business 244/253
Index
Adarand Constructors Inc. v. Pen a, 184Affirmative action programs, 20, 26–27,
183–185African Americans, 1, 8–9, 175
affirmative action programs and, 20, 26–27, 183–185
apprenticeships and, 105–106average sales and, 33–37, 97, 175Blinder-Oaxaca technique and, 121–122,
139–140 business outcome patterns and, 1–7, 9–
12, 121–125, 138–143 business success and, 62–66Characteristics of Business Owners (CBO)
data and, 99–108, 112–120, 126, 132–133, 136–138
children and, 98, 112–113closure probabilities and, 122college and, 99–100consumer discrimination and, 26, 132–
133
credit cards and, 116–117Current Population Survey (CPS) and,107
differential types of financing and, 114–117
education and, 3, 21, 98–101, 122, 124,137–138, 149, 181, 185–186
family businesses and, 101–106, 136–137,180–181
financial capital and, 107–119gender issues and, 125–130
government jobs and, 26–27high school dropouts and, 99home ownership and, 109–112human capital and, 101–107industry distribution and, 119–121, 130–
132
inheritance and, 105, 112–113, 125, 137intergenerational pickup rate and, 104–
105lending discrimination and, 98, 107–108,
113–114, 178marital status and, 102–103, 187–188median asset levels of, 109–111migration and, 21net worth of, 108–109, 178nonlinear decomposition method and,
121–122, 137–141nonmarital birth and, 102number of employees and, 37self-employment rates and, 16, 19, 21–22,
97, 104–105, 114–117, 175single-parent families and, 102–103slavery and, 4small business outcomes and, 137–138social networks and, 133–136startup capital and, 97–98, 111, 114–119,
130–132, 136, 178–179
wealth and, 3, 22–23, 107–119, 136work experience and, 106–107, 124–125,170
Alaskan natives, 155Aldrich, H., 25, 147, 150Aleuts, 201Allen, W. D., 24–25, 135Altonji, J. G., 109, 111Amato, P. R., 102American Indians, 155, 157, 201Annual Retail Trade Survey, 190
Annual Survey of Manufacturers, 190Apprenticeships, 53, 105–106, 186–187Asian Americans
average sales and, 35–37 business outcome patterns and, 2–7, 10–
12, 146–147, 167–172

8/9/2019 Race and Entrepreneurial Success - Black , Asian, And White Owned Business in the United States
http://slidepdf.com/reader/full/race-and-entrepreneurial-success-black-asian-and-white-owned-business 245/253
Asian Americans (cont.)Canada and, 145–146Characteristics of Business Owners (CBO)
data and, 103, 137, 146, 149–165, 172–174Chinese, 145, 164–166class resources and, 149–154closure probabilities and, 145education and, 3, 101, 149–151, 164–165,
169–170, 181, 185–186English language and, 148, 150–151, 164–
165ethnic resources and, 147–148family businesses and, 151–153, 180–181Filipino, 164, 166
hours worked by, 161–163, 165human capital and, 146, 149Indians, 164, 166industry differences and, 159–161
Japanese, 145, 165–166Korean, 145, 148, 164–166Latino group differences and, 45–47literature on, 145–146marital status and, 152, 167net worth of, 155niche markets and, 147–148
nonmarital births and, 152number of employees and, 37Public Use Microdata Sample File
(PUMS) and, 165regional differences and, 169retail trade and, 160rotating credit associations and, 157–158self-employment rates and, 15, 22, 145–
146, 213n3social networks and, 147–148, 155–158startup capital and, 12, 157–159, 167, 170,
172–173, 177, 179subgroups and, 45-47, 163–166success of, 6–7, 10–12, 62–66, 145–177Survey of Business Owners (SBO) and, 165Survey of Income and Program
Participation (SIPP) and, 155Survey of Small Business Finances (SSBF)
and, 157types of financing and, 155–158United Kingdom and, 145–146Vietnamese, 148, 166wealth levels of, 3, 23, 155work experience and, 152–153, 169–170
Aspen Institute, 182–183Astebro, T., 66, 149Avery, R. B., 111, 125
Bates, T., 3, 183–184, 197, 199African Americans and, 98, 112, 116, 118,
121, 133, 135
Asian Americans and, 146, 148–151, 155,159–160, 164–166ownership disparities and, 24–25, 44success determinants and, 66, 68, 86–
87Becker, G., 113Bellotti, J., 182Bernhardt, I., 66, 149Bitler, M., 112, 157Bjelland, M., 202Blanchard, L., 26, 113
Blanchflower, D. G., 3, 22, 26, 98, 113, 125,178, 182, 184
Blau, D. M., 109Blinder, A. S., 121, 167Blinder-Oaxaca decomposition technique,
121–122, 139–140Boden, R., 45, 65, 86, 121, 202Bonacich, E., 145, 148, 165Borjas, G., 2, 25–26, 132–133, 147, 160Boston, T. D., 2, 20, 176, 184Boyd, R. W., 25–26, 101, 148–150, 166
Bradford, W. D., 2, 176Bronars, S., 26, 132–133Bruce, D., 65Bruderl, J., 68Brush, C., 64–65Bucks, B. K., 1, 176Business Information Tracking Series
(BITS), 45, 67, 87, 118Business outcomes
African Americans and, 1–7, 9–12, 121–125, 138–143
age of business and, 90Asian Americans and, 2–7, 10–12, 146–
147, 167–172causes of black/white differences in, 121–
125data sources for, 13–14education and, 10, 50–53, 66–67 (see also
Education)industry sector and, 84–90policy implications for, 182–188racial patterns in, 1–12, 33–48 (see also
Racial patterns)regression analysis and, 61–66
Business ownership, 1, 98, 175African Americans and, 97–143 (see also
African Americans)
232 Index

8/9/2019 Race and Entrepreneurial Success - Black , Asian, And White Owned Business in the United States
http://slidepdf.com/reader/full/race-and-entrepreneurial-success-black-asian-and-white-owned-business 246/253

8/9/2019 Race and Entrepreneurial Success - Black , Asian, And White Owned Business in the United States
http://slidepdf.com/reader/full/race-and-entrepreneurial-success-black-asian-and-white-owned-business 247/253
Closure, 68–69, 122, 145, 177–178Coate, S., 25Cobb-Clark, D. A., 22
Coleman, S., 26, 113College, 99–100, 181Conley, D., 111Construction industry, 160–161Consumer discrimination, 26, 132–133Cooper, A. C., 65Credit cards, 116–117Current Population Survey (CPS), 6–9, 47,
107, 189, 204–205 business ownership and, 21–26consumer discrimination and, 26
dataset description of, 199–201education and, 23–24individual/business-level data and, 201–
203microdata of, 13–14minority estimates of, 27–33Outgoing Rotation Group Files and, 13–
14, 199–201SBO/SMOBE comparisons and, 29–32self-employment and, 14–15, 19
Davidsson, P., 135Dawkins, C. J., 25Devine, T. J., 65Disadvantaged-business-enterprise (DBE)
programs, 184Doolittle, F., 182Doraszelski, U., 109, 111Drake, S. C., 4, 136Drinkwater, S., 146Du Bois, W. E. B., 4, 136Dunn, T. A., 4, 24, 102, 136
inheritances and, 58intergenerational links and, 95success determinants and, 50, 53–54work experience and, 56
Education, 8, 10, 91accounting and, 51African Americans and, 3, 21, 98–101,
122, 124, 137–138, 149, 181, 185–186apprenticeships and, 53Asian Americans and, 3, 101, 149–151,
164–165, 169–170, 181, 185–186average sales and, 52Blinder-Oaxaca decomposition technique
and, 122 business success and, 50–53, 66–67, 100–
101, 149–151
college and, 99–100, 181Current Population Survey (CPS) and,
23–24
English language skills and, 24, 148, 150–151, 164–165gender and, 71graduate level, 67high school dropouts and, 52, 67, 99industry distribution and, 121Latinos and, 19marketing and, 51mentoring programs and, 186–187policy implications for, 181, 185–186work experience and, 56, 59–60, 68–70,
74, 106–107, 124–125, 152–153, 169–170Enchautegui, M. E., 184English language, 24, 148, 150–151, 164–
165Entrepreneurs
apprenticeships and, 186–187 business outcome patterns and, 1–7consumer discrimination and, 132–133correlation of preferences and, 53–55ethnic enclaves and, 147–148family businesses and, 53–59, 92–96
high-risk ventures and, 86inheritances and, 56–58minority clientele and, 148perceived earnings and, 21–22policy implications for, 182–188standard model for, 4–5strong desire for, 182
EquationsBlinder-Oaxaca, 139intergenerational pickup rate, 94nonlinear decomposition, 139, 141
self-employment probability, 94Eskimos, 201Ethnic enclaves, 25, 147–148. See also Social
networksEvans, D., 5, 21
Fairlie, Robert W., 2–4, 184, 201African Americans and, 97–98, 102, 113–
114, 117, 119, 122, 135–136, 139Asian Americans and, 146, 169family businesses and, 53–54nonlinear decomposition, 122, 138–141,
167ownership disparities and, 19–24, 26social networks and, 25startup capital and, 83, 97success determinants and, 50
234 Index

8/9/2019 Race and Entrepreneurial Success - Black , Asian, And White Owned Business in the United States
http://slidepdf.com/reader/full/race-and-entrepreneurial-success-black-asian-and-white-owned-business 248/253
Family businesses, 107African Americans and, 101–106, 136–
137, 180–181
apprenticeships and, 53, 105–106Asian Americans and, 151–153, 180–181 background effects and, 53–54, 58–59,
61–66 business outcome effects and, 67–69Characteristics of Business Owners (CBO)
data and, 179–180children and, 53–54closure probability and, 68correlation of abilities and, 53–54correlation of preferences and, 53–55
data sensitivity and, 78gender and, 71, 74human capital and, 53, 151–154inheritances and, 56–58, 68–69, 74, 105,
112–113, 125, 137, 210n14intergenerational links and, 53–59, 68–69,
92–96policy implications for, 179–181racial patterns in, 103–106regression analysis of, 61–66single-parent families and, 102–103
startup capital and, 89–90study conclusions for, 179–181work experience and, 56, 179–180
Farber, H. S., 169Feagin, J. R., 25, 86, 121, 135Fernandez, M., 145, 150Finance, insurance, and real estate (FIRE)
industries, 151Fink, B., 182Fratoe, F., 135, 148Frazier, E. F., 4, 136
Gazelles, 176Gender issues, 207n3
African Americans and, 125–130 business success and, 64–65, 71–76education and, 71inheritance and, 74social networks and, 64–65spouse influence and, 65–66Survey of Minority- and Women-Owned
Business Enterprises (SMOBE/SWOBE)and, 190–197
work experience and, 74Germany, 68, 182Gil, R., 147Gittleman, M., 111, 125Glazer, N., 103
Government jobs, 26–27Graham, D., 109Greeks, 2
Greene, P., 148Growth. See also Business success barriers to, 2–3minority estimates of, 27–33population, 28–29
Guy, C., 182
Handy, J., 191, 197Hao, L., 23, 155Hartmann, W. R., 147Headd, B., 45, 87, 149, 197, 202
High school dropouts, 52, 67, 99Hildebrand, V., 22Holtz-Eakin, D., 2, 4, 24
African Americans and, 102, 112, 125, 136inheritances and, 58intergenerational links and, 95startup capital and, 83success determinants and, 50, 53–54work experience and, 56
Home ownership, 83–84, 109, 111–112Honig, B., 135
Hout, M., 3–4African Americans and, 98, 102–105, 136Asian Americans and, 145ownership disparities and, 24success determinants and, 53
Howell, D., 25, 86, 121, 135Human capital, 97, 188
African Americans and, 101–107apprenticeships and, 53Asian Americans and, 146, 149, 151–154
business success and, 59–60, 69–70, 93
education and, 66–67, 149–151 (see alsoEducation)
family-business background and, 53–59,67–69, 179–180
general business, 53, 105intergenerational links and, 53–59, 92–
96policy implications for, 181racial patterns in, 106–107regression analysis of, 61–66social networks and, 147–148 (see also
Social networks)specific business and, 53, 105standard model of, 4–5study conclusions for, 181work experience and, 56, 59–60, 68–70,
74, 106–107, 124–125
Index 235

8/9/2019 Race and Entrepreneurial Success - Black , Asian, And White Owned Business in the United States
http://slidepdf.com/reader/full/race-and-entrepreneurial-success-black-asian-and-white-owned-business 249/253
Hurh, W. M., 145, 150Hurst, E., 22, 111
Imani, N., 25, 86, 121, 135Income. See also Business successpersonal wealth importance and, 22–23self-employment earnings and, 21–22wage discrimination and, 25
Individual development accounts (IDAs),186
IndustryAfrican Americans and, 119–121, 130–
132Asian Americans and, 159–161
business success and, 84–87construction, 160–161high-risk, 86personal services, 85–86, 120, 160retail, 160skilled labor and, 121startup capital and, 87–90, 130–132survival rates and, 84–87transportation, communications, and
public utilities, 120Inheritances, 210n4
African Americans and, 105, 112–113,125, 137
gender and, 74success determinants and, 56–58, 68–69
Initiative 200, 184Intergenerational links
African Americans and, 104–105 business success and, 53–59, 68–69, 92–
96closure probability and, 68–69estimation of, 93–96
pickup rate and, 94Internal Revenue Service (IRS), 6Italians, 2, 182
Jews, 2 Jianakoplos, N. A., 111, 125 Joint Center for Political and Economic
Studies, 2 Jones, F. L., 140 Joulfaian, D., 83, 112, 125 Jovanovic, B., 5, 21, 149
Kalnins, A., 147Kassoudji, S., 24, 150, 160Kauffman Firm Survey (KFS), 203Kawaguchi, D., 26, 133
Kennickell, A. B., 1, 176Kihlstrom, R., 21Kijakazi, K., 199
Kim, K., 145, 150Knight, F., 149Kosanovich, W. T., 182Kourilsky, M. L., 22, 182Krashinsky, H. A., 66, 83, 169Kwuon, I. J., 158
Laband, D., 4, 24, 50, 53, 55, 102, 105,136
Laffont, J.-J., 21Langlois, A., 25
Latinos, 176, 190average sales and, 33–37
business outcome patterns and, 1–12education and, 19median asset levels of, 110number of employees and, 37ownership rates and, 15personal wealth importance and, 22–23self-employment rates and, 19, 21–22social networks and, 25subgroups, 45-47
success rates and, 62–66Legal issues, 184, 186Lentz, B., 4, 24, 53, 55, 60, 102, 105, 136Levine, K., 3, 26, 98, 109, 111, 113, 178Light, I., 25, 145, 147, 158, 165Liquidity, 2, 182
African Americans and, 107personal wealth importance and, 22–23startup capital and, 81–84
Loan Program, 183Loans
African Americans and, 178Asian Americans and, 155–160discrimination in, 26, 98, 107–108, 113–
114, 178entry barrier reduction and, 184–185rotating credit associations and, 157–158social networks and, 147, 155–158Survey of Small Business Finances (SSBF)
and, 157Loewen, J. W., 145Lofstrom, M., 23–24Logit regressions, 139, 210nn9,10, 212n10Lohmann, H., 65Lombard, K. V., 65Lucas, R., 149Lusardi, A., 22
236 Index

8/9/2019 Race and Entrepreneurial Success - Black , Asian, And White Owned Business in the United States
http://slidepdf.com/reader/full/race-and-entrepreneurial-success-black-asian-and-white-owned-business 250/253
McLanahan, S., 102Mar, D., 145, 160Marion, J., 184
Menchik, P. L., 111, 125Mentoring, 186–187Mentor-Protege Program, 186Mexican Americans. See LatinosMeyer, B., 4, 21, 24–26, 133, 135Miller, S. M., 201Min, P., 2, 24, 145, 148, 150, 165Minority Business Enterprise Legal
Defense and Education Fund, 183Mitchell, K., 114Mitchell-Kernan, C., 102
Modell, J., 145, 165Moore, R. L., 1, 25, 176Moynihan, D. P., 103Myers, S. L., Jr., 183–184Myrdal, G., 4, 136
National Center for Health Statistics, 102,152
National Federation of IndependentBusiness (NFIB), 55, 57, 65
National Longitudinal Surveys (NLS), 54,
204National Survey of Small Business
Finances (NSSBF), 113Native Americans, 155, 157, 201Nonlinear decomposition method, 121–
122, 137–141, 167North American Industry Classification
System (NAICS), 200–201Nucci, A. R., 65, 86, 121, 202
Oaxaca, R., 121, 140, 167
Oliver, M. L., 109Oswald, A. J., 22, 125, 182Outgoing Rotation Group Files, 13–14,
199–201
Pacific Islanders, 155, 157, 201Panel Study of Income Dynamics (PSID),
204African Americans and, 103, 107, 119, 124ownership disparities and, 23–24success determinants and, 68
Pearce, D. K., 114Personal services, 85–86, 120, 160Policy
affirmative action and, 20, 26–27, 183–185contracting programs and, 185
educational, 185–186entrepreneurship promotion and, 182entry barrier reduction and, 184–185
Initiative 200, 184mentoring programs and, 186–187minority programs and, 183–185new ideas and, 185–188Proposition 209, 184racial patterns and, 182–188set-aside programs and, 183–184U.S. Small Business Administration and,
182–183Polivika, A. E., 201Porter, M., 148
Portes, A., 163Preisendorfer, P., 68Proposition 209, 184Protected-market hypothesis, 147–148Public Use Microdata Sample File (PUMS),
165, 204
Racial patterns, 49affirmative action and, 20, 26–27, 183–
185average sales and, 33–37
Blinder-Oaxaca decomposition techniqueand, 121–122
blocked mobility and, 150–151 broader economic inequality and, 176 business outcome patterns and, 1–7, 33–
40 (see also Business outcomes)C corporations and, 33Characteristics of Business Owners (CBO)
data and, 41–45, 197–199Current Population Survey (CPS) and,
13–15
data sources for, 6–9education and, 3, 99–101 (see also
Education)employment distributions and, 40family businesses and, 101–106financial capital and, 107–119human capital and, 106–107lending discrimination and, 98, 107–108,
113–114, 178policy implications for, 182–188regression analysis and, 62–66set-aside programs and, 183–184startup capital and, 117–119subgroups and, 45-47, 163–166Survey of Business Owners (SBO) and,
190–197
Index 237
8/9/2019 Race and Entrepreneurial Success - Black , Asian, And White Owned Business in the United States
http://slidepdf.com/reader/full/race-and-entrepreneurial-success-black-asian-and-white-owned-business 251/253
Racial patterns (cont.)Survey of Minority-Owned Business
Enterprises (SMOBE) and, 190–197
twentieth-century trends and, 20–21Ransom, M., 140Rauch, J. E., 135Razin, E., 25Rees, H., 22Regression analysis, 10
age of business and, 90 black/white outcome differences and,
138–143Blinder-Oaxaca technique and, 121–122,
139–140
business success and, 61–66, 92data sensitivity and, 77–80gender and, 71–76industry estimates and, 87–90inheritances and, 68–69intergenerational links and, 93–96logit, 139, 210nn9,10, 212n10marital status and, 65–66multiple imputation and, 80–81nonlinear decomposition method and,
121–122, 138–141
part-time employment and, 62startup capital and, 62, 87–90work experience and, 69–70
Rendall, M. S., 111, 125Retail trade, 190
African Americans and, 119, 135Asian Americans and, 150–151, 159–160success determinants and, 84–89
Reynolds, P., 2, 84, 119Rice, M. F., 183Richmond v. J. A. Croson Co., 184
Robb, Alicia M., 191, 197, 199African Americans and, 98, 112–114,
117–119, 121–122, 132Asian Americans and, 146, 149, 151,
157industry sector and, 86ownership disparities and, 26success determinants and, 65–66, 84, 87
Rosen, H., 2–4African Americans and, 98, 102–105, 112,
125, 136Asian Americans and, 145ownership disparities and, 24success determinants and, 53startup capital and, 83
Rotating credit associations, 157–158
Sandefur, G., 102Saxenian, A., 147Scholz, J. K., 109, 111
Schumpeter, J. A., 149S corporations, 197Self-employment, 4. See also Business
ownershipAfrican Americans and, 16, 19, 21–22, 97,
104–105, 114–117, 175Asian Americans and, 15, 22, 145–146,
213n3asset levels and, 23
business success and, 49–96 (see also
Business success)
C corporations and, 29, 33closure probabilities and, 68–69, 122, 145,
177–178consumer discrimination and, 26Current Population Survey (CPS) and,
14–15definition of, 14–15demographics of, 1education and, 23–24 (see also Education)employment distributions and, 40family businesses and, 53–59, 92–96
federal government and, 182–188gender and, 64–65, 125–130inheritances and, 56–58, 68–69intergenerational links and, 54–56, 58–59,
92–96limited English ability and, 24, 148, 150–
151, 164–165loan discrimination and, 26, 98, 107–108,
113–114, 178perceived earnings and, 21–22personal wealth importance and, 22–
23policy implications for, 182–188preference for, 182pushed/pulled into, 150–151regression analysis of, 61–66S corporations and, 197single-parent families and, 102–103social networks and, 24–25, 133–136spouse influence and, 65–66standard economic model and, 21–22twentieth century trends and, 20–21type of work and, 22wage discrimination and, 25wealth and, 1welfare rolls and, 182
Seltzer, J., 102
238 Index

8/9/2019 Race and Entrepreneurial Success - Black , Asian, And White Owned Business in the United States
http://slidepdf.com/reader/full/race-and-entrepreneurial-success-black-asian-and-white-owned-business 252/253
Service Corps of Retired Executives(SCORE), 186
Servon, L. J., 183
Shah, A., 22Shapiro, T. M., 109Single-parent families, 102–103Slavery, 4Small Business Act, 186Small businesses, 137
causes of black/white outcomedifferences and, 121–125
Characteristics of Business Owners (CBO)data and, 47–48, 85, 177
closure probability and, 68–69, 122, 145,
177–178consumer discrimination and, 132–133correlation of preferences and, 53–55data sensitivity and, 77–80family businesses and, 53–59, 92–96 (see
also Family businesses)intergenerational links and, 53–56, 68–69,
92–96lending discrimination and, 26, 98, 107–
108, 113–114, 178Survey of Small Business Finances (SSBF)
and, 157U.S. Small Business Administration and,
29, 182–183, 186Small disadvantaged businesses (SDBs),
183Social networks, 24–25
African Americans and, 133–136Asian Americans and, 147–148, 155–158English language and, 148ethnic resources and, 147–148gender and, 64–65
as information source, 147–148loans and, 147, 155–158market access and, 147–148protected-market hypothesis and, 147–
148Sowell, T., 25Srinivasan, R., 65Standard Metropolitan Statistical Areas
(SMSAs), 25Startup capital
African Americans and, 97–98, 111, 114–119, 130–132, 136, 178–179
age of business and, 90–92alternative sources for, 114, 116–117Asian Americans and, 12, 157–159, 167,
170, 172–173, 177, 179
business success and, 62, 81–84, 87–92closure probabilities and, 177–178credit cards and, 116–117
data sensitivity and, 78equity issues and, 116family businesses and, 89–90industry distribution and, 87–90, 130–132lending discrimination and, 26, 98, 107–
108, 113–114, 178liquidity and, 81–84owner wealth and, 83–84regression analysis and, 62study conclusions for, 177–179
Stutzer, A., 182
Survey of Business Owners (SBO), 6–7, 9–10, 200, 204–205, 213n6
Asian Americans and, 46, 165average sales and, 36–37casual businesses and, 77Current Population Survey (CPS)
estimates and, 29–32dataset description of, 189–197individual/business-level data and, 201–
203Latinos and, 46
minority estimates of, 27–33ownership disparities and, 14, 41, 45, 47–
48racial pattern data and, 41–45
Survey of Consumer Finances (SCF), 57, 83Survey of Income and Program
Participation (SIPP), 22–23, 109, 155, 204Survey of Minority- and Women-Owned
Business Enterprises (SMOBE/SWOBE),190
Survey of Minority-Owned Business
Enterprises (SMOBE), 7, 9–10, 200, 204–205
average sales and, 37casual businesses and, 77C corporations and, 29, 33Current Population Survey (CPS)
estimates and, 29–32dataset description of, 189–197individual/business-level data and, 201–
203industry sector and, 85minority estimates of, 27–33ownership disparities and, 14, 41, 45, 47–
48racial pattern data and, 41–45regression analysis and, 65
Index 239

8/9/2019 Race and Entrepreneurial Success - Black , Asian, And White Owned Business in the United States
http://slidepdf.com/reader/full/race-and-entrepreneurial-success-black-asian-and-white-owned-business 253/253
Survey of Small Business Finances (SSBF),203
African Americans and, 105, 112–113, 117
Asian Americans and, 157ownership disparities and, 26success determinants and, 57, 83
Swinton, D., 191, 197
self-employment and, 1startup capital and, 81–84whites and, 3, 108–112, 155
Weathers, R., 2White, S., 84, 119Whites, 175
Asian business outcome comparison and,
240 Index


