Race Differences in Educational Attainment in Post-Apartheid South Africa Tim B. Heaton Department of Sociology Brigham Young University AcheampongYaw Amoateng Center for Sociological Research University of Johannesburg Mikaela Dufur Department of Sociology Brigham Young University
Transcript
Race Differences in Educational Attainment in Post-Apartheid South Africa
Tim B. Heaton
Department of Sociology
Brigham Young University
AcheampongYaw Amoateng
Center for Sociological Research
University of Johannesburg
Mikaela Dufur
Department of Sociology
Brigham Young University
Introduction
Even though in colonial South Africa discrimination in the vital sectors of the economy was
prevalent, after the Nationalists swept to power in 1948, this subtle form of racism and its
accompanying discrimination gave way to a more overt and purposive policy of discrimination,
especially, in the sphere of education. From the 1950s to the mid-1990s, no other social
institution reflected the government's racial philosophy of apartheid more clearly than the
education system. Because the schools were required both to teach and to practice apartheid, they
were especially vulnerable to racial oppression. Following the political transition in 1994, steps
were taken to address racial inequality. The paper examines trends in racial inequality in the
post-apartheid period. In particular, we focus on the increasing difference in educational
attainment as children move through the ages when primary and secondary education take place.
Using national surveys taken from 2002 to 2009, we address four key questions. First, how much
racial inequality in education exists for children aged 7 to 18. Second, how much of this
inequality is due to differences in household structure, household resources, and school quality.
Third, have inequalities narrowed in the period from 2002 to 2009. Finally, do changes in family
and school context account for any trend in inequality during this period.
The Education Context in South Africa
Education has been viewed as a source and reflection of social and economic inequality, both
because of its recognized value as a key component of human development and because of its
contribution to individual earnings and national economic development (Lloyd and Hewett,
2009). In fact, Van der Berg (2005) has observed that in South Africa, considerable variations in
educational quality may account for much of the residual earnings differential that is usually
ascribed to labour market discrimination. Besides its role as transmitter of social values, the
education system assumed economic importance in the twentieth century as it meant to prepare
young Africans for low-wage labour and protect the privileged white minority from competition.
In explaining the government's new education policy as outlined in the 1953 Bantu Education
Act to the South African Parliament, the then Minister of Native Affairs, Dr. Hendrik F.
Verwoed stated:
There is no space for him [the "Native"] in the European Community above certain forms of labour. For this reason it is of no avail for him to receive training which has its aim in the absorption of the European Community, where he cannot be absorbed. Until now he has been subjected to a school system which drew him away from his community and misled him by showing him the greener pastures of European Society where he is not allowed to graze (quoted in Kallaway, 2002: 92).
The ideological framework for Bantu education had its origins in a manifesto crafted in 1939 by
Afrikaner nationalists. Based on the racist and paternalistic view that the education of blacks was
a special responsibility of a superior white race, this document called for "Christian National
Education" and advocated separate schools for each of South Africa's "population groups"-
whites, Africans, Indians, and Coloureds. Segregated education disadvantaged all black groups,
but was particularly devastating for Africans. In a pamphlet released in 1948, the organization
asserted: "... the task of white South Africa with regard to the native is to Christianize him and
help him culturally... [N]ative education and teaching must lead to the development of an
independent and self-supporting and self-maintaining native community on a Christian National
basis" (quoted in Hlatshwayo, 2000:64).
Essentially, the 1953 Bantu Education Act not only sought to extend apartheid to black schools
by bringing African education under the control of the government, but it also sought to create a
separate and unequal system of black education, but it also ended the relative autonomy of the
Mission schools which hitherto educated mainly Africans by making government funding
conditional on acceptance of a racially discriminately curriculum administered by a new
Department of Bantu Education.
Bantu education served the interests of white supremacy by denying black people access to the
same educational opportunities and resources enjoyed by white South Africans. It denigrated
black people's history, culture, and identity through the promotion of myths and racial
stereotypes in its curricula and textbooks. African people and communities were portrayed as
traditional, rural, and unchanging. Bantu education treated blacks as perpetual children in need of
parental supervision by whites, which greatly limited the student's vision of "her place" in the
broader South African society (Hartshorne, 1992:41).
Bantu education schools suffered terribly from government's neglect. Enormous disparities in
funding between white and black schools and student-teacher ratios adversely affected the
quality of education for black students. The Bantu Education Account of 1955 made matters
worse by mandating that African education be funded by the general poll tax collected from
Africans rather than from the General Revenue Account used to fund white education. Even after
the separate account was abolished in 1972, education of African children still remained grossly
under-resourced, receiving one-tenth of the money afforded to whites and struggling with 56:1
student-teacher ratios (Hartshorne, 1992:41).
In an interview in 2006, Obed Bapela, a leading member of the ruling African National
Congress, described his experience in overcrowded Bantu education schools in Alexandra
township (in Johannesburg's northern suburbs):
… the school that I went to was an overcrowded school, there were quite many of them in Alexandra that were overcrowded, there were not enough schools to take care of all of us so we
used to share classes. There would be a morning class that goes up to 11 o'clock and then we'll go home and then other kids of the same grade will come after 11 o'clock up to 2 o'clock and therefore the teachers will then run two sets of class … in some situations they will even use a tree in the schoolyard… We were around 70 to 80 [pupils in class] when I was in grade 1 and grade 2 (Quoted in Hartshorne, 1992).
Thus, on the eve of the 1976 Soweto uprising over inferior quality education, there were glaring
discrepancies in education among racial groups in South Africa. For instance, teacher: pupil
ratios in primary schools averaged 1:18 in white schools, 1:24 in Asian schools, 1:27 in coloured
schools, and 1:39 in black schools. Moreover, whereas 96 percent of all teachers in white schools
had teaching certificates, only 15 percent of teachers in black schools were certified. Secondary-
school pass rates for black pupils in the nationwide, standardized high-school graduation
examinations were less than one-half the pass rate for whites. Using data from South Africa's
1980 census, it was observed that roughly 21% of the White population and 22% of the Black
population were enrolled in school1 (South African Institute of Race Relations, 1983).
And, as late as 1982 the Apartheid government of South Africa spent an average of R1,211 on
education for each White child, and only R146 for each Black child. Moreover, the quality of
teaching staff also differed – roughly a third of all White teachers had a university degree, the
rest had all passed the Standard 10 matriculation exam. Only 2.3% of Black teachers had a
university degree, and 82% had not even reached the Standard 10 matriculation (more than half
had not reached Standard 8). Education opportunities were heavily skewed towards preferential
treatment for Whites (South African Institute of Race Relations, 1983).
It is against this background of inequitable and unequal educational system engendered by the
apartheid government that the new democratic government has been striving to re-configure the 1 Differences in population distributions, however, mean that there were Black children of school age not enrolled in school.
country’s education system since the political transition in 1994. New policies and programmes
all aimed at making education structurally accessible to all who were previously denied, or had
limited access to education, and thus to realise the ideal of nine years of compulsory schooling.
Marginalised or vulnerable groups have received particular attention in the form of inclusive
education programmes and pro-poor funding policies. Government policy on learners with
special needs emphasises the mainstreaming of learners with mild learning disabilities into
ordinary schools; and school fee exemptions and, most recently, “no fee” schools have assisted
indigent learners into schools.
Moreover, education financing has been redirected specifically towards considerations of equity,
redress, accessibility and affordability (see e.g. Van der Berg and Burger, 2002). School
governance has been decentralised, with greater autonomy devolved onto school governing
bodies (including the right to charge fees). Educators’ qualifications have been improved. A new
curriculum high on knowledge and skills and based on the values of the Constitution has been
introduced and streamlined and procedures set in place to monitor educational quality. A major
policy shift is reflected in the South African Schools Act of 1996 which makes education
compulsory for all South Africans from the age of seven (grade 1) to age 15, or the completion
of grade 9.
Thus, in South Africa, all children of school-going age enter school and the majority complete
grade 9. Overall there is little gender disparity (Anderson, Case, and Lam, 2001; Department of
Education, 2006; Lam, Ardington, and Leibbrandt, 2008; Lloyd and Hewett, 2009). It has been
found that in 1995, 88% of the population aged 9 to 23 had attained grade 7, a figure which rose
to 93% in 2003. Moreover, in 2003 82% of the population had attained grade 9 which marks the
completion of the compulsory schooling phase, an increase of 7% from 1995 (Department of
Education, 2006).
The National Schools Nutrition Programme aims to ensure that the poorest learners have at least
one meal per school day. Orphans, foster children and those receiving a poverty-linked social
grant are exempted from paying fees and poorer parents might receive discounts. The
programme feeds about 7-million schoolchildren every day, including all those attending primary
schools in 13 rural and eight urban poverty nodes. The programme was extended in 2009 to
1 500 secondary schools around the country, feeding 1-million secondary school pupils from
grades 8 to 12.
Under the programme, the Department of Education has also established almost 2100 so-called
school gardens with the support of the Department of Agriculture, local government structures
and a number of NGOs. Other programmes the government implemented include reunification of
the education system, deracialization of schools, and focusing attention on curricula matters such
as early childhood development, HIV/Aids awareness programmes, school health and school
safety.
Even though the democratic government has consistently and persistently pursued policies to
ensure educational access and equality, the apartheid legacy remains in areas such as educational
financing, administration and the delivery of services (e.g. Hartley and Omarjee, 2008; Simkins,
1998; Lam, Ardington and Leibrandt , 2008; Van der Berg, 2005). On the basis of both local and
international measures and studies of learning achievement, it has been established that on the
whole, the country’s learners’ levels of achievement are not commensurate with the financial
investment the state has made in the education sector so far (Department of Education, 2006;
Taylor, Muller and Vinjevold, 2003).
The irony, as Van der Berg (2005) has rightly observed, is that the school system, which is
perceived to be the vehicle to transform an unequal society, remains largely unequal both in
terms of quantitative educational attainment and quality differentials.(see e.g. Hanushek, 2002b).
Nowhere is the apartheid legacy of racially segregated schools and under-resourcing of black
schools is more evident than in the large differentials between white and black levels of
education (Van der Berg, Louw, and Yu, 2005). Case and Deaton (1999) for example, found that
black teenagers had a backlog equivalent to almost 10 years of completed education.
While the old racial differences have been substantially reduced as a result of racial integration
in schools, there still remains considerable variation in quality amongst mainly black schools
which perform much weaker relative to their white counterparts (Fuller, Pillay, and Sirur, 1995;
Van der Berg, Wood, and Le Roux, 2002). Van der Berg (2005) has noted that quality
differentials between mainly white and mainly black schools are also reflected in the quality of
the matriculation exam itself in terms of both the standard at which Matric is passed as well as
the subject choice. For instance, the Department of Education (2001b) noted that only 15.5% of
black candidates studied math at the Higher Grade level in 2001; even at the Standard Grade
level, the success rate for blacks was lower than the national average (at 23% versus 32%). A
similar differential has been observed between predominantly black schools with average pass
rates of 43% and white schools with pass rates of 97% (Van der Berg, 2005).Grade repetition,
which has been identified as one of the most important problems in educational systems in many
developing countries (see e.g. Gomes-Neto and Hanushek, 1994; Lam, Ardington, and
Leibrandt, 2008) contributes to both low average levels of schooling and high schooling
inequality (Lee, Zuze, and Ross, 2005).Using a panel study of youth in the city of Cape Town,
Lam, Ardington and Leibrandt (2008) found large racial differences in grade advancement.
Specifically, they found that 84% of white students who were in grades 8 and 9 in 2002
successfully advanced three grades by 2005, compared to 44% of coloured student and only 32%
of African students (74% of African students were still enrolled in school). The present study
It is against this background of continuing inequalities that we examine educational inequality in
post-apartheid South Africa. Much prior research is based on people who were enrolled or had
completed school during the apartheid era. This study begins with a time period when new
enrolees were born in the Post-apartheid period. Prior research also focuses on completed
education, making it difficult to determine where in the education process inequalities emerge.
We focus on educational attainment for children aged 7 through 18, allowing us to identify more
precise points where inequality emerges. Finally, this study makes an initial attempt to
distinguish different sources of inequality including household structure, household
socioeconomic resources and school quality.
Effects of household Structure, resources and school quality on education
Household Structure. A long tradition of research suggests that the number of parents available
to children has strong effects on educational outcomes. Children raised by two biological,
married parents score higher on both math and reading tests than children in other family types
(Cavanagh, Schiller, and Reigle-Crumb, 2006; Formby and Cherlin, 2007; McLanahan and
Sandefur, 1994; Hofferth, 2006). These patterns hold in both cross-sectional and longitudinal
analyses (Sun and Li, 2011). Similar patterns exist for self-reported grades, educational
expectations, and high school completion and post-secondary schooling (Sun, 2003; Sun and Li,
2009; Heard, 2007; Astone and McLanahan, 1991; Ermisch and Francesconi, 2001). The trends
hold for both younger children (Artis, 2007) and adolescents (Brown, 2006).
Some of these differences may be in part due to related patterns in child social and emotional
outcomes. Children in two-parent, biological, married families report higher self-esteem and
lower stress than children in other family types (Beck, Cooper, and McLanahan, 2010; Demo
and Fine, 2010). They also engage in less drug and alcohol use, fewer delinquent or criminal
acts, and they have lower scores on scales of both internal and external behavior problems
(Deleire and Kalil, 2002; Albrecht and Teachman, 2003; Fomby and Cherlin, 2007). Because
they experience fewer emotional and delinquency problems, these children experience fewer
obstacles to school success.
Some studies have suggested that the reason children in “non-traditional” families may do worse
on both scholastic and social measures is because they have regular access to only one parent
instead of two. An extensive body of research shows that, indeed, children raised by single
parents experience lower academic outcomes than do those in two-parent, biological, married
parent families (McLanahan and Sandefur, 1994; Hofferth, 2006; Schiller, Khemelkov, and
Wang, 2002, Magnuson and Berger, 2009). Children whose parents divorce experience
significant stressors before, during, and after the actual dissolution of the marriage (Demo and
Fine, 2010; Amato, 2000). Children dealing with these stressors may be less equipped to handle
school demands, and parents going through divorces may be less able to help children with their
academic needs (Amato, 2000).
While the deficits experienced by children in “non-traditional” family types are often attributed
to children having access to only one parent, children in stepparent or cohabiting families score
lower on academic outcomes than do their peers in married, biological families (Astone and
McLanahan, 1991; Deleire and Kalil, 2002). In fact, comparisons between stepparent families
and single-parent families show similar educational outcomes, with both family types having
negative effects compared to two biological, married parents (Artis, 2007; Coleman, Ganong,
and Fine, 2000; Manning and Lamb, 2003). Other family structures with multiple adults, such as
children being raised by grandparents, have high levels of heterogeneity and mixed outcomes
concerning child academic achievement (Hayslip and Kaminski, 2005).
Studies concerning the effects of family structure on children’s academic achievement are not
limited to parental factors. The presence and number of siblings also has an effect on child
outcomes. With few exceptions, the literature shows living in large families with many siblings
is associated with lower academic achievement (Blake, 1989; Downey, 1995, 2001; Parcel and
Menaghan, 1994; Kuo and Hauser, 1997). Having more siblings is negatively related both to
achievement test scores (Downey, 1995, 2001; Parcel and Menaghan, 1994) and to measures of
academic attainment such as post-secondary education (Steelman and Powell, 1989; Conley,
2000, 2001). These patterns are likely related both to dividing resources more finely across
multiple siblings (Downey 1995, 2001) and to selectivity issues concerning which parents are
likely to have large families (Guo and Van Wey 1999a, 1999b).
Resources. One of the reasons household structure issues are so influential on child educational
outcomes is because of the ways such structures affect the acquisition and distribution of key
resources that encourage academic growth and achievement. For example, children in single-
parent families tend to have many fewer financial resources than do children in two-parent
families (McLanahan and Sandefur, 1994; Avellar and Smock, 2005; McLanahan and Percheski,
2008). Such families may find it more difficult to provide as many social or emotional resources
for children with only one adult in the home (Simon 2002; Fomby and Cherlin, 2007). Children
in large families find both financial and interpersonal resources diluted across multiple family
members (Downey 1995, 2001). These examples highlight the crucial role of both
socioeconomic and interpersonal resources on academic development.
A large body of research associates poverty and low socioeconomic status with lower academic
achievement. Sufficient material support is the foundation for family life, and studies examining
the effects of poverty on child outcomes clearly establish that material deprivation is inimical to
favorable child development (Duncan and Brooks-Gunn, 1997; Duncan, Brooks-Gunn, &
Klebanov 1994; Garrett, Ng’andu & Ferron, 1994). In contrast, increases in family income are
linked to increases in children’s educational development (Huston et al., 2001). The relationship
between SES and academic achievement appears to have its roots in the way socioeconomic
disadvantage affects both children’s physical environment and health (Guo and Harris, 2000) and
cognitive stimulation at home (Votruba-Drzal, 2003; Parcel and Menaghan, 1994). For example,
deficits in academic development have been related to maternal stress caused by poverty
(Conger, Conger, and Martin, 2010; Nievar and Luster, 2006; Lovejoy, et al., 2000).
The relationship between SES and cognitive growth is stronger for children in poor families than
for other children (Mistry, Biesanz, Taylor, Burchinal, and Cox, 2004). Results of a meta-
analysis of five studies show that extreme poverty often leads to “adultification” of children,
where young people are expected to provide significant labor that brings necessary income to the
family, thus diverting attention from academic pursuits (Dodson and Dickert, 2004). The effects
of economic status appear to reach beyond selectivity issues; for example, welfare strategies that
mandate maternal employment do little to increase children’s academic progress unless they are
coupled with meaningful increases in family income (McGroder, Zaslow, Papilo, Ahluwalia,
Brooks, et al., 2005; Zaslow, Moore, Brooks, Morris, Tour, Redd, and Emig, 2002).In addition,
children from families long mired in profound poverty see few increases in achievement even
when family SES increases (Alderson, Gennetian, Dowsett, Imes, and Huston, 2008). While
some researchers question whether additional financial resources matter once basic needs are
met, long-term extreme poverty has substantial negative effects on academic development
(Mayer, 1997). Fundamentally, low SES can block growth both through denying fundamental
needs that stifle growth and by preventing parents from investing surplus physical and social
resources in their children’s education (Bradley and Corwyn, 2002; Duncan and Mangunson,
2003).
School Quality and Resources. While resources and structures at the family level are important
predictors of child educational attainment and achievement, interventions at the family level are
often difficult and expensive. As a result, interventions are often targeted at schools, a setting
where the number of children brought together in a single setting represents a potential economy
of scale. Debate continues, however, as to whether such policies are effective in increasing
academic achievement.
One difficulty in assessing the role school quality plays in promoting academic achievement is in
how school quality is measured across studies. Research that uses average student achievement
as a measure of school quality may conflate the characteristics and preparation children bring
from their families with skills received at school. Other studies use indicators of school
environment that really measure neighbourhood characteristics (Pong 1998). In this paper, we
focus on the financial, human, and social resources available to children at their schools as the
appropriate measure of school quality.
Basic school facilities play an important role in student achievement. Research shows that
schools with poor ventilation increase absenteeism due to asthma and other respiratory problems.
Increased absenteeism, unsurprisingly, is associated with lower academic achievement (Smedje
and Norback, 1999). In addition, at least one study links carbon dioxide build up due to poor
ventilation in schools with poorer performance on standardized tests (Myhrvoid et al., 1996).
Uncomfortably low or high temperatures affect student ability to concentrate and learn
(Schneider, 2002). Poor lighting has a significant depressive effect on student learning,
increasing off-task behaviour and decreasing test scores, as do poor acoustics and high external
noise. In general, newer buildings in better condition are associated with increased student
achievement (Schneider, 2002).
In addition, the concept of resource dilution can be extended from families to schools. Although
definitions of “small” vary widely across studies, most studies indicate that children and
adolescents in smaller schools, where resources are shared among fewer students, do better on
standardized tests (Lee and Smith, 1997). Smaller schools that can concentrate on students’
specific needs and improve teacher attitudes toward their jobs also prevent dropout and increase
graduation rates (Farber 1998). Conclusions regarding reductions in classroom size are mixed
and are the subject of continued debate (Grubb, 2008, 2009; Jepsen & Rivkin, 2009; Sims,
2009).
As is true with family resources, there is much debate as to how important school resources
beyond basic necessities are for creating academic growth. Some studies suggest a link between
additional school resources and increased achievement. Initial studies of school capital focused
largely on resource arguments, with key indicators including teacher salaries and teacher-student
ratios (for example, Coleman et al., 1966; Hallinan, 1988). These studies, however, failed to
support the notion that characteristics of the schools themselves were important predictors of
educational achievement. In addition, some findings suggest that financial resources are
sometimes invested in schools where students are already performing poorly (Parcel and Dufur,
2001). At the same time, other studies link school social and financial resources to greater
that financial resources are necessary but not sufficient for academic progress gains support from
research that focus on human and social resources. Such resources, in the form of well-trained
teachers who invest in their students, seem to be related to positive academic achievement and
growth (Dufur, Parcel, and McKune, 2008; Parcel and Dufur, 2001; Hoffmann and Dufur, 2008).
While researchers are still untangling exactly how school quality should be measured and how
resources at school promote academic achievement, the bulk of research suggests a link between
school quality and growth. Together, high-quality family and school resources help to create an
environment in which children can thrive (Reynolds et al. 2004; Hoffmann and Dufur, 2008;
Parcel, Dufur, and Zito, 2010).
Data
The Sample
The data for the study came from the eight waves (2002-2009) of the General Household Survey
(GHS)2 (Statistics South Africa, 2010). The GHS was a multi-stage stratified sample which was
drawn using Probability Proportional to Size (PPS) principles. It was drawn from the master
2 Stats SA revised the population model to produce mid-year population estimates during 2008 in the light of the findings of the Community Survey 2007 and new HIV/AIDS and mortality data. The new data have been used to adjust the benchmarking for all previous datasets. Weighting and benchmarking were also adjusted for the provincial boundaries that came into effect in December 2006. The data for the GHS 2002 to GHS 2009 as presented in this release are therefore comparable.
sample which Statistics South Africa uses to draw samples for its regular household surveys. The
master sample is drawn from the database of enumeration areas (EAs) established during the
demarcation phase of the 1996 Population Census. As part of the master sample, small EAs
consisting of fewer than 100 households are combined with adjacent EAs to form primary
sampling units (PSUs) of at least 100 households, to allow for repeated sampling of dwelling
units within each PSU. The sampling procedure for the master sample involved explicit
stratification by province and within each province, by urban and non-urban areas. Within each
stratum, the sample was allocated disproportionately. A PPS sample of PSUs was drawn in each
stratum, with the measure of size being the number of households in the PSU.
All together approximately 3 000 PSUs were selected for each wave of the survey. In each
selected PSU a systematic sample of ten dwelling units was drawn, thus, resulting in
approximately 26 000 dwelling units per survey. The person file collected background
demographic information such as age, sex, population group, school attendance, level of
education, disability status, health etc, while the household file contained information like
dwelling type, ownership of the dwelling and other household assets, water, sanitation,
environmental issues, transport, and expenditure3.
Measures and Statistical Analysis
3 With the exception of the 2009 survey for which data collection was spread over a three-month period, data collection for all waves of the survey was done only during July (Statistics South Africa, 2010)..
Our focus is on racial inequality in schooling. To assess recent changes we focus on youth aged 7
through 18. These are the ages when most people go through primary and secondary school.
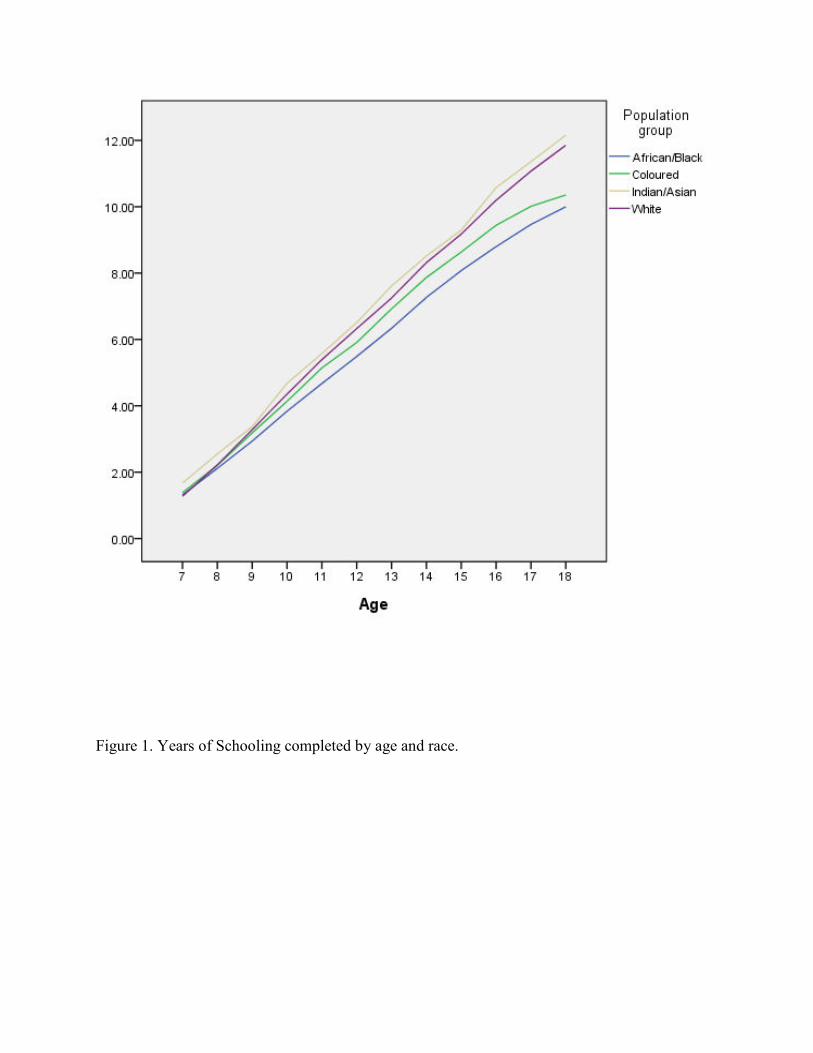
More specifically, we focus on the years of schooling completed. Most people in this age group
fall in the range from no schooling to grade 12 (95%) coded from 0 for no education to 13 for
grade 12. A few students reported to have a certificate or diploma at less than grade 12 were
given a code of 12 (< 1%), and students with a grade 12 certificate or diplomat coded 13 (2%). A
few had post secondary education and were given a score of 14. Students with distance learning
(NTC) Yaw, does NTC stand for distance learning?) were given a score of 13. Race differences
in highest level of education are shown in Figure 1. In order to focus on education gaps by race
that are not due to age or yearly fluctuations in the sampling frame, we create a measure of
education that is free of these influences. We calculate the unstandardized residual from a
regression predicting highest level of education with dummy variables for each year of age and
each survey year. Subsequent analysis uses this residual as the dependent variable. The residual
shows the gap between how much education a person actually has at the predicted education
based on age and year of the survey.
Independent variables include race coded as dummy variables for Colored, Indian/Asian, and
White with African as the implicit category. The small percentage listing some other race group
is excluded from the analysis. Household structure is indexed by dummy variables for the
presence of a household head and partner and the number of household members aged 17 or
younger. Household resources are measured by education for the male and female head and/or
partner and by an index of household possessions, source of income and expenditures. We use
mean substitution for education if a male or female head is not present.
The household index includes the quality of roof and walls (coded from 1 for very weak to five
for very good), dichotomous variables for electricity, land phone line and cell phone, source of
income (coded 3 for salary or business income, 2 for other sources and 1 for no income), and
household expenditures (coded from 1 for below 400 Rand to 8 for over 10000 Rand).
Cronbach’s Alpha for this index is .627. The scale is used because household income was not
included in most years of the survey. School quality is measured as a neighborhood variable by
aggregating the responses in each primary sampling unit. This index is the average of the sum of
people who report the school has problems because of lack of books, poor teaching, lack of
teachers, poor facilities, high fees and large classes. Cronbach’s Alpha for this index is .585.
We ask a series of increasing complex questions about the racial gap in education. First, how big
is the gap? Second, how much of the gap is due to household and school environments? Third,
how does the gap increase as children age? Fourth, is there a trend in the magnitude of the gap
across survey years? Fifth, is there a trend across survey years in the increasing gap as children
age? Finally, are the trends explained by household and school characteristics?
These questions are addressed with a series of OLS regression models. The first model includes
all the dummy variables for race. The second model adds household and school characteristics to
model 1. The third model includes dummy variables for race and interactions between age and
race. The fourth model adds interactions between survey year and race to model 3. The fifth
model adds interactions between race, age and survey year to model 4. The final model adds
school and household characteristics to model 5.
Results
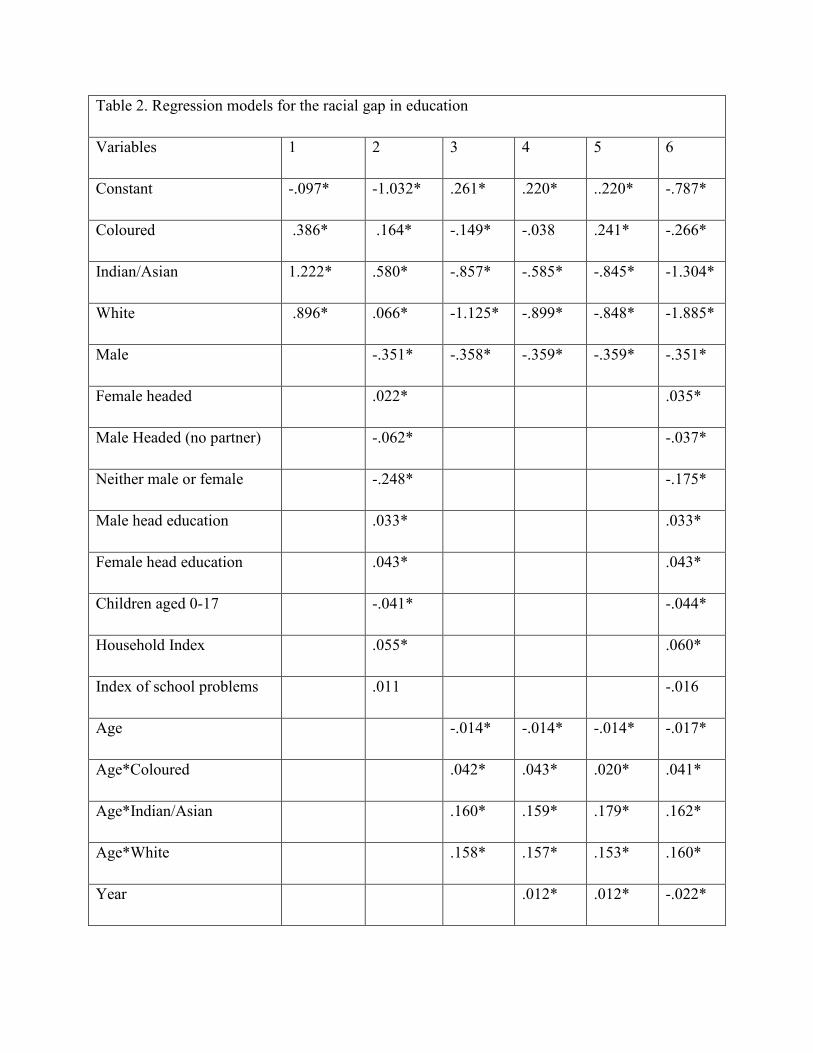
Results of the regression models are shown in Table 1. The first model simply shows the overall
gap in highest level of education averaged across all ages and all years of the survey. The
constant term in this model shows the average residual for Africans to be nearly .1 years lower
than average, Coloureds are more than a third of a year above Africans, Whites are nearly a full
year above Africans and the Indian/Asian group excels with a value 1.22 years above Africans.
The differences are widely known and are reported for reference as other variables are added to
the analysis.
The second model adds controls for family and school characteristics. Coefficients for these
variables generally fit with prior research. One important exception is that children in female
headed households have slightly more education than households that report both a head and a
spouse/partner. Male headed households without a female partner show a modest disadvantage,
and children in households without either have a substantial disadvantage. Greater education of
the household head and partner are associated with higher educational attainment, and the female
partner’s education matters somewhat more than education of the male. Presence of more
children under age 17 is associated with lower educational attainment. The index of household
economic status is positively associated with children’s education. The index of school problems
does not have a statistically significant relationship with educational attainment. This may well
be due to inadequate measurement.
Of particular interest is the shift in coefficients for race variables after family and school
characteristics are taken into account. The coefficients for Coloureds and Indian/Asians drop by
more than half, suggesting that a substantial share of their educational advantage is because they
live in favorable family contexts. The coefficient for Whites drops by over ninety percent,
suggesting that almost all of their educational advantage is because they live in favorable family
contexts.
The next model examines the growing racial gap in education for older children. The negative
coefficient for age shows the pattern for Africans relative to other groups since African is the
implicit comparison group. Results show that the age graded slope is lower for Africans,
somewhat higher for Coloureds, and substantially higher for Whites and the Indian/Asian group.
Indeed, the coefficients for these two groups (i.e. Whites and Indian/Asians?) indicate that the
gap between them and Africans increased by .15 years for each year of age. This is consistent
with Figure 1 which shows a gap of nearly two years by the time children reach age 18.
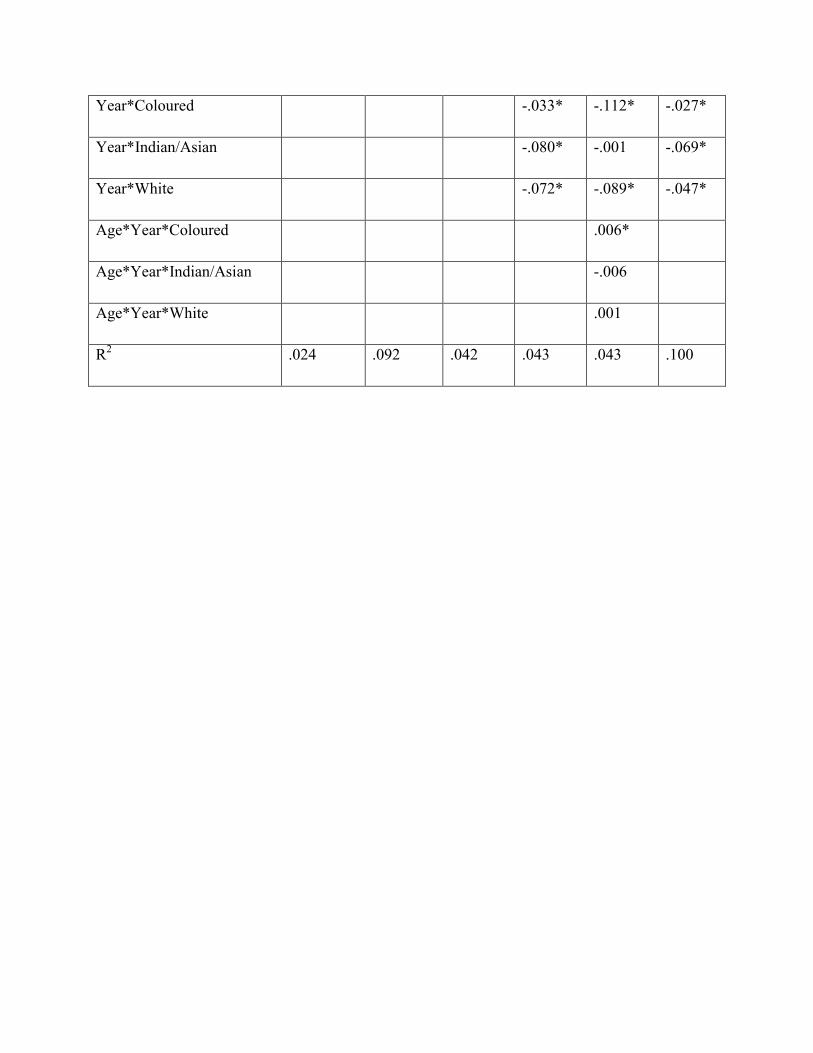
The next two models explore trends across surveys in the average race difference and in the
racial difference in age graded slopes. Coefficients for survey year (reflecting the trend for
Africans since they are the implicit comparison) and the interactions of year and race indicate a
narrowing of the educational gap between Coloureds and Africans of about .03 per year, while
the gaps between Africans and both Whites and Indian/Asians is narrowing by between .0 and
.08 per year. While these trends suggest a decline in inequality, this decline is small relative to
the overall differences in model 1.
Three way interactions between age, survey year and race are designed to see if the age graded
slope is changing over time. Coefficients for Whites and Asian/Indians are not statistically
significant. The interaction for Coloureds is slightly positive, suggesting the difference in the
slopes may actually be growing. Overall, these interactions do not increase the explanatory
power (R2) of the model suggesting they are not particularly important.
The final model adds household and school variables to the model with trends across survey to
see if these characteristics explain any of the trends. The coefficient for year becomes negative
and the coefficient for the interaction of White and trend becomes less negative. These shifts
suggest that the household circumstances of Africans are improving and without this
improvement Africans would actually be doing worse over time. On the other hand, part of the
relative position of Whites may be that their household circumstances are not improving as much
as is the case for other groups. Otherwise, adding household variables does not have much of an
impact on the other coefficients.
Conclusions
Nationally representative household survbeys from 2002 to 2009 from post-apartheid South
Africa demonstrate that substantial educational inequality still exists. This inequality is not
evident at ages when children begin school but becomes increasingly evident at older ages. This
pattern suggests that African and Coloured children either drop out or repeat grades to the extent
that by age 18 they have a two year education disadvantage compared with White and Asian
children. A substantial share of this disadvantage is because of family background. A much
smaller share is because of school characteristics. There is some indication that the trend may be
narrowing, but not enough to eliminate inequality in the near future. These results imply the need
for more effective education policy that should address both issues of racial inequality and
disadvantaged family background.
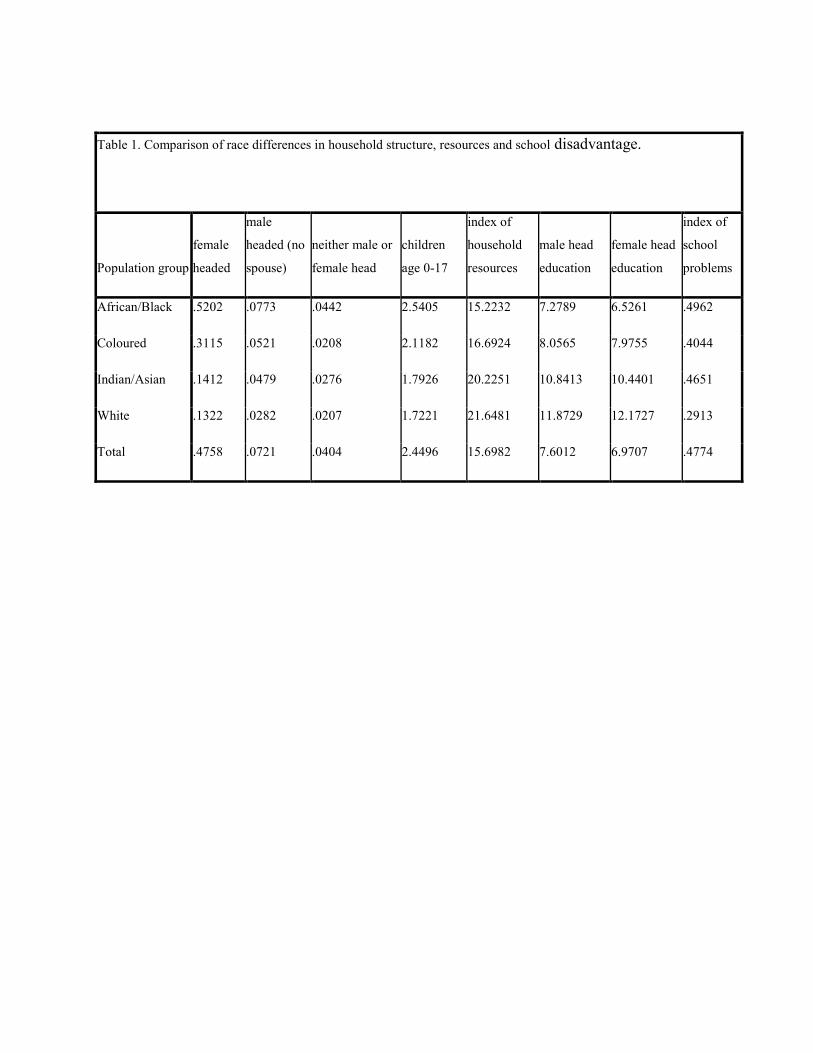
Table 1. Comparison of race differences in household structure, resources and school disadvantage.