113
Racial and Ethnic Disparities in U.S. Health Care: A Chartbook Holly Mead, Lara Cartwright-Smith, Karen Jones, Christal Ramos, Kristy Woods, and Bruce Siegel

Racial and Ethnic Disparitiesin U.S. Health Care: A Chartbook
HHoollllyy MMeeaadd,, LLaarraa CCaarrttwwrriigghhtt--SSmmiitthh,, KKaarreenn JJoonneess,,CChhrriissttaall RRaammooss,, KKrriissttyy WWooooddss,, aanndd BBrruuccee SSiieeggeell

Racial and Ethnic Disparities inU.S. Health Care: A Chartbook
Holly Mead, Lara Cartwright-Smith, Karen Jones,Christal Ramos, and Bruce Siegel
Department of Health PolicySchool of Public Health and Health Services
The George Washington University
Kristy WoodsMaya Angelou Research Center on Minority Health
Wake Forest University School of Medicine
March 2008
Support for this research was provided by The Commonwealth Fund. The views presented here are those of the authors and not necessarily those of The Commonwealth Fund or its directors, officers, or staff. This and other Fund publications are available online at www.commonwealthfund.org. To learn more about new publications when they become available, visit the Fund’s Web site and register to receive e-mail alerts. Commonwealth Fund pub. no. 1111.

3
THECOMMONWEALTH
FUND
Contents
About the Authors & Acknowledgments.........................................................................................................................6 Technical Notes.............................................................................................................................................................7 Chapter 1 Introduction .............................................................................................................................................8 Chapter 2 The Demographics of America.............................................................................................................10Chart 2-1 United States Population .........................................................................................................................12Chart 2-2 Projected Population of the United States ...............................................................................................13Chart 2-3 Low-Income Status..................................................................................................................................14Chart 2-4 Median Family Income ............................................................................................................................15Chart 2-5 Educational Attainment............................................................................................................................16Chart 2-6 Language Proficiency..............................................................................................................................17Chart 2-7 Median Age .............................................................................................................................................18 Chapter 3 Disparities in Health Status and Mortality...........................................................................................19Chart 3-1 Health Status...........................................................................................................................................24Chart 3-2 Chronic Condition or Disability ................................................................................................................25Chart 3-3 Chronic Conditions and Poverty ..............................................................................................................26Chart 3-4 Life Expectancy .......................................................................................................................................27Chart 3-5 Infant Mortality.........................................................................................................................................28Chart 3-6 Infant Mortality by Birthplace of Mother ...................................................................................................29Chart 3-7 Obesity ....................................................................................................................................................30Chart 3-8 Smoking ..................................................................................................................................................31Chart 3-9 Diabetes ..................................................................................................................................................32Chart 3-10 Cardiovascular Disease...........................................................................................................................33Chart 3-11 Mortality from Heart Disease ...................................................................................................................34Chart 3-12 Breast Cancer .........................................................................................................................................35Chart 3-13 Colorectal Cancer....................................................................................................................................36Chart 3-14 Prostate Cancer ......................................................................................................................................37Chart 3-15 Cervical Cancer.......................................................................................................................................38

4
THECOMMONWEALTH
FUND
Chart 3-16 Infection-Related Cancers .......................................................................................................................39Chart 3-17 Acquired Immune Deficiency Syndrome (AIDS)......................................................................................40Chart 3-18 Asthma ....................................................................................................................................................41Chart 3-19 Asthma Mortality......................................................................................................................................42Chart 3-20 Frequent Mental Distress ........................................................................................................................43 Chapter 4 Disparities in Access to Health Care ...................................................................................................44Chart 4-1 No Regular Doctor or Provider ................................................................................................................47Chart 4-2 Usual Place of Health Care .....................................................................................................................48Chart 4-3 Forgone Care ..........................................................................................................................................49Chart 4-4 Forgone Dental Care or Prescription Drugs ............................................................................................50Chart 4-5 Angioplasty..............................................................................................................................................51 Chapter 5 Disparities in Health Insurance Coverage ...........................................................................................52Chart 5-1 Health Insurance Coverage.....................................................................................................................55Chart 5-2 Insurance Status .....................................................................................................................................56Chart 5-3 Insurance Status by Income....................................................................................................................57Chart 5-4 Working Uninsured..................................................................................................................................58Chart 5-5 Insurance Coverage for Children by Citizen Status.................................................................................59Chart 5-6 Trends in Insurance Coverage for Children by Citizen Status .................................................................60 Chapter 6 Disparities in Quality.............................................................................................................................61Chart 6-1 Availability of Quality Care.......................................................................................................................66Chart 6-2 Heart Attack Outcomes ...........................................................................................................................67Chart 6-3 Geographic Disparities ............................................................................................................................68Chart 6-4 Safety: Complications of Care .................................................................................................................69Chart 6-5 Safety: Postoperative Complications.......................................................................................................70Chart 6-6 Safety: Use of Restraints in Psychiatric Care ..........................................................................................71Chart 6-7 Safety: Use of Restraints in Long-Term Care..........................................................................................72Chart 6-8 Timeliness: Doctor Appointment Wait Times...........................................................................................73Chart 6-9 Timeliness: Emergency Department Wait Times.....................................................................................74Chart 6-10 Timeliness: Delayed Treatment for Appendicitis .....................................................................................75Chart 6-11 Timeliness: Heart Attack Intervention......................................................................................................76

5
THECOMMONWEALTH
FUND
Chart 6-12 Effectiveness: Cholesterol Screening......................................................................................................77Chart 6-13 Effectiveness: Cancer Screening ............................................................................................................78Chart 6-14 Effectiveness: Breast Cancer Screening .................................................................................................79Chart 6-15 Effectiveness: Vaccination.......................................................................................................................80Chart 6-16 Effectiveness: Childhood Dental Care.....................................................................................................81Chart 6-17 Effectiveness: Prenatal Care ...................................................................................................................82Chart 6-18 Effectiveness: Mental Health Treatment..................................................................................................83Chart 6-19 Effectiveness: Hospital Care for Pneumonia ...........................................................................................84Chart 6-20 Effectiveness: Hospital Care for Heart Failure.........................................................................................85Chart 6-21 Efficiency: Unnecessary Emergency Department Use ............................................................................86Chart 6-22 Efficiency: Avoidable Hospitalization .......................................................................................................87Chart 6-23 Efficiency: End-of-Life Care.....................................................................................................................88Chart 6-24 Patient-Centeredness: Communication with Doctor ................................................................................89Chart 6-25 Patient-Centeredness: Unasked Questions.............................................................................................90Chart 6-26 Patient-Centeredness: Satisfaction with Provider....................................................................................91Chart 6-27 Patient-Centeredness: Hospice Care Consistent with Patient Wishes ....................................................92Chart 6-28 Patient-Centeredness: Trust....................................................................................................................93 Chapter 7 Strategies for Closing the Gap .............................................................................................................94Chart 7-1 Childhood Vaccine Coverage ..................................................................................................................97Chart 7-2 Blood Pressure Control ...........................................................................................................................98Chart 7-3 Preventive Care Screening Rates ...........................................................................................................99Chart 7-4 Medical Homes Remedy Disparities......................................................................................................100Chart 7-5 Reminders for Preventive Care in Medical Homes................................................................................101Chart 7-6 Use of Care by Low-Income Immigrant Children...................................................................................102Chart 7-7 Reminders for Preventive Care and Insurance......................................................................................103Chart 7-8 Uninsured Are More Likely to Go Without Needed Care .......................................................................104Chart 7-9 Appropriate Dialysis Care......................................................................................................................105Chart 7-10 Improvement in Cardiovascular Care ....................................................................................................106Chart 7-11 Heart Attack Care..................................................................................................................................107 Chart Notes ...............................................................................................................................................................108

6
THECOMMONWEALTH
FUND
Holly Mead, Ph.D., is an assistant research professor in the Department of Health Policy, George Washington University School of Public Health and Health Services. Dr. Mead has conducted research around disparities in chronically ill patients’ self-management skills, as well as access barriers for vulnerable populations, including minorities, the uninsured, and the underserved.
Lara Cartwright-Smith, J.D., is a senior research assistant and M.P.H. candidate in the Department of Health Policy, George Washington University School of Public Health and Health Services. She practiced law for six years before coming to GWU and now works on projects to improve health care quality and reduce disparities.
Karen Jones, M.S., is a senior research scientist in the Department of Health Policy, George Washington University School of Public Health and Health Services. There she provides the primary statistical analysis and data management support for a variety of public health research projects.
Christal Ramos is a research assistant and M.P.H. candidate in the Department of Health Policy, George Washington University School of Public Health and Health Services. She has worked on projects to improve the quality of care for the underserved. She received her B.A. from Johns Hopkins University.
Kristy Woods, M.D., M.P.H., a nationally recognized expert on sickle cell disease, is the former director of the Maya Angelou Research Center on Minority Health at Wake Forest University School of Medicine.
Bruce Siegel, M.D., M.P.H., is a research professor in the Department of Health Policy, George Washington University School of Public Health and Health Services. There he leads work on quality improvement with a focus on vulnerable populations and the safety net. He has served previously as a hospital chief executive and New Jersey State Health Commissioner.
About the Authors
Acknowledgments
The authors would like to thank Dr. Anne Beal for her ongoing support, encouragement, and good humor through the course of this project. Thanks also to Dr. Leighton Ku for sharing his work and to Karen Ho for her assistance in obtaining additional data. Finally, thanks to the reviewers of this chartbook for their time and valuable comments.

7
THECOMMONWEALTH
FUND
Technical Notes
Source Data: The information in this chartbook is drawn from a variety of sources, ranging in scope from national surveys to single-site studies. The vast majority of the data were previously published. We were selective in the data we chose to present and the charts are by no means an exhaustive review of disparities in health care. Because the source data varies, the charts also vary in their scope and specificity. Some charts show data for four or five races, some for only two or three. We did not include categories for multiple races or “other.” This report uses the term “black” to refer to people who reported a single race of black or African American and uses the term “Hispanic” for people who reported an ethnicity of Hispanic or Latino. Wherever possible, we used “non-Hispanic” to distinguish whites, and sometimes blacks, from Hispanics, but often data were collected only by race, not ethnicity. Where it does not specify “non-Hispanic,” whites, blacks, and Hispanics may not be mutually exclusive categories.
References and Methodology: On each chart, we have included the primary reference for the data presented. Explanatory notes regarding the data in the charts are included in the Chart Notes section. Where data are age adjusted, we have noted this on the charts. Adjustments for other factors may be noted on the chart, where space allows, or in the Chart Notes section.

8
THECOMMONWEALTH
FUND
Chapter 1. Introduction
Many Americans are in poor health and do not receive the best medical care. While these problems affect people of all groups and walks of life, the challenges are especially acute for racial and ethnic minorities. Myriad research studies and reports have documented that minorities are in poorer health, experience more significant problems accessing care, are more likely to be uninsured, and often receive lower quality health care than other Americans.1,2
These differences may be caused in part by factors such as income, education, and insurance coverage. But even after adjusting for these determinants, disparities often persist. Given the rapidly growing diversity of this nation, an increasing number of minority Americans find themselves at risk of disease and not getting the carethey need.
The goal of this chartbook is to create an easily accessible resource that can help policy makers, teachers, researchers, and practitioners begin to understand disparities in their communities and to formulate solutions. Given the magnitude of the body of disparities research, we do not intend to create an exhaustive report that simply presents existing data. Rather we seek to prompt thinking about why these
disparities may exist, and more importantly, what may be done to eliminate these gaps. Our hope is to offer a systematic set of data coupled with a discussion that we hope can educate a broad audience about the challenges and opportunities to improve the health and health care of all Americans.
This chartbook also incorporates an evolving understanding of the nature and etiology of disparities. Many studies have pointed to the role of bias, miscommunication, lack of trust, and financial and access barriers in allowing disparities to occur. This chartbook also reflects emerging evidence that disparities may be a function of the overall performance of the health system where one lives, or of the quality of providers that care for many minorities. Hence, some disparities observed in national analyses may be due to failures in the health care system that result in barriers to care for minorities. Other disparities may be due to minorities disproportionately living in regions where quality is suboptimal or receiving care from providers whose quality similarly needs improvement. Understanding these underlying dynamics will help policy makers and health professionals design the most effective strategies for reducing disparities.

9
THECOMMONWEALTH
FUND
The chartbook is divided into the following chapters:
The Demographics of America highlights the changes in the United States’ population. It presents information on the population by race/ethnicity, income, and language.
Disparities in Health Status and Mortality addresses disparities in a number of the focus areas of the Healthy People 2010 Initiative.
Disparities in Access to Health Care offers a picture of the challenges minority Americans face in receiving needed health care. This chapter includes information on access to primary care, as well as more specialized services.
Disparities in Health Insurance Coverage provides a snapshot of why insurance coverage varies by raceand ethnicity.
Disparities in Quality documents that racial and ethnic disparities exist across all the domains of quality articulated by the Institute of Medicine.
Strategies for Closing the Gap includes a sample of the modest but growing body of knowledge on strategiesthat may lessen or eliminate disparities in health and health care.
The United States leads the world in health care spending, yet this has not translated into better health or assurances of access to high quality health care for all its residents. Conscious, thoughtful action will be needed to confront and address disparities with changes in policy, as well as a redesign of many parts of our health system. Disparities pose a major challenge to a diverse 21st-century America. A first step in meeting this challenge will be ensuring we have the information we need.
Notes
1. Agency for Healthcare Research and Quality, National Healthcare Disparities Report. 2003–2006.
2. Institute of Medicine, Unequal Treatment: Confronting Racial and Ethnic Disparities in Health Care (Washington, D.C.: National Academy of Sciences, 2003).

10
THECOMMONWEALTH
FUND
Chapter 2. The Demographics of America
The United States is a diverse nation and is expected to become substantially more so over the next several decades. The current population is approximately 67 percent non-Hispanic white, 12 percent black, 14 percent Hispanic, 1 percent American Indian/Alaska Native, and4 percent Asian (Chart 2-1). The U.S. Census Bureau projects that by 2050, populations that have historically been called “minorities” will make up nearly 50 percent of the total U.S. population (Chart 2-2). The biggest increase will be in the Hispanic population, which is expected to double between 2000 and 2050. If racial and ethnic disparities in health and health care continue unchanged, many more Americans will be at risk of disease and poor quality health care.
Marked differences in income and education also occur along racial and ethnic lines. These factors are significant predictors of health status and the ability to obtain high-quality health care. For example, blacks and Hispanics are twice as likely to live in poverty as whites and Asians. Similarly we see that a much greater proportion of blacks and Hispanics are “near poor,” meaning their income is 100 percent to 200 percent of the federal poverty level1(Chart 2-3).
Using a different indicator of economic status, median family income is $20,000 to $25,000 higher for non-Hispanic whites and Asians than for blacks, Hispanics, and American Indians/Alaska Natives (Chart 2-4). All this is particularly remarkable given how income significantly influences health status, access to health care, and health insurance coverage.2 Blacks and Hispanics also have lower rates of educational attainment than whites and Asians (Chart 2-5). Higher educational levels have been linked to use of preventive services3 and longer life.4
Communication barriers due to language issues may also influence whether minorities can get high-quality health care.5 Approximately one-sixth of the U.S. population speaks a language other than English at home, and this number may rise as the proportion of Hispanic residents increases (Chart 2-6).
Notably, the Hispanic population is much younger on average than the other demographic groups, with a median age of 25.8 years compared with 38.6 years for the white population (Chart 2-7). As a result, it is likely that Hispanics consume less health care than other groups and are underrepresented in research on the use and quality of health care.

11
THECOMMONWEALTH
FUND
For this reason, we have included age adjusted data wherever possible in this chartbook. The presence of disparities in conditions and treatments that mainly affect older individuals (e.g., cardiovascular disease and treatment) could become more apparent among Hispanics as their population ages.
Notes
1. Federal Poverty Level = $18,850 for a family of four in 2004.Source: Federal Register. 2004;69(30).
2. National Center for Health Statistics, Health, United States, 2006: With Chartbook on Trends in the Health of Americans. 2006 (Table 60); J. Graves and S. Long, Why Do People Lack Health Insurance?(Washington, D.C.: The Urban Institute, 2006).
3. U. Sambamoorthi and D. D. McAlpine, “Racial, Ethnic, Socioeconomic, and Access Disparities in Use of Preventive Services Among Women,” Preventive Medicine, Nov. 2003 37(5):475–84.
4. A. Lleras-Muney, “The Relationship Between Education and Adult Mortality in the United States,” Review of Economic Studies, Jan. 2005 72(1):189–221.
5. Institute of Medicine, Unequal Treatment: Confronting Racial and Ethnic Disparities in Health Care (Washington, D.C.: National Academy of Sciences, 2003).

12
THECOMMONWEALTH
FUND
67
12 14
0.8 4.20
20
40
60
80
100
White, non-Hispanic
Black Hispanic AI/AN Asian
Chart 2-1. Minorities compose one-third of the U.S. population; Hispanics compose the largest minority group, followed by blacks.
AI/AN = American Indian/Alaska Native.Source: National Center for Health Statistics. Health, United States, 2006: With Chartbook on Trends in the Health of Americans. 2006.
Percentage of United States population, 2005

13
THECOMMONWEALTH
FUND
2050
50
15
24
8.05.3
White, non-Hispanic
Black
Hispanic
Asian
Other
Chart 2-2. Minority groups will compose almost half of theU.S. population by 2050; the biggest increase will occur
within the Hispanic population.
Note: Numbers add up to more than 100 percent because of rounding and because some categories are not mutually exclusive.Note: “Other” includes the following categories: American Indian/Alaska Native, Native Hawaiian/other Pacific Islander,and two or more races.Source: United States Census Bureau. U.S. Interim Projections by Age, Sex, Race and Hispanic Origin. 2004.
Projected percentage change in racial/ethnic compositionof the United States population, 2000 to 2050
2000
69
133.8
13
2.5

14
THECOMMONWEALTH
FUND
13 8.625 22 9.8
19 15
24 30
16
0
20
40
60
80
100
Total White, non-Hispanic
Black Hispanic Asian
100% to less than 200% FPLBelow 100% FPL
Chart 2-3. Blacks and Hispanics are twice as likelyto live in poverty as whites and Asians.
Federal Poverty Level (FPL) is based on family income and family size and composition. In 2004, FPL was $18,850 for a family of four. Source: Federal Register. 2004;69(30):7336–38. Source: National Center for Health Statistics. Health, United States, 2006: With Chartbook on Trends in the Health of Americans. 2006.
Percentage of population by Federal Poverty Level, 2004

15
THECOMMONWEALTH
FUND
49,94054,698
33,255 34,397 33,144
59,324
0
10,000
20,000
30,000
40,000
50,000
60,000
70,000
Total White, non-Hispanic
Black Hispanic AI/AN Asian
Chart 2-4. Median family income is substantially higherfor whites and Asians than for other groups.
AI/AN = American Indian/Alaska Native.Source: United States Census Bureau. Census 2000.
Median family income in U.S. dollars, 1999

16
THECOMMONWEALTH
FUND
89
56
30
80
45
17
57
30
11
88
67
50
0
20
40
60
80
100
High school graduateor more
Some college or more Bachelor's degree ormore
White, non-Hispanic Black Hispanic Asian
Chart 2-5. Blacks and Hispanics havelower levels of educational attainment.
Note: “Some college” includes respondents who had completed some college but had not completed a degree and those who had completed an associate’s degree.Source: United States Census Bureau. Current Population Survey, Annual Social and Economic Supplement. 2003.
Percentage of population age 25 and olderby education level achieved, 2003

17
THECOMMONWEALTH
FUND
82
2.7
3.811 0.7
English Only Asian/Pacific Islander
Other Indo-European Spanish
Other
Chart 2-6. Nearly one-sixth of the U.S. population speaksa language other than English at home.
Notes: The total population of the United States was 281,421,906 in 2000.Numbers add up to more than 100 percent because of rounding.Source: United States Census Bureau. Census 2000.
Percentage of population age 5 and older by language spoken at home, 2000

18
THECOMMONWEALTH
FUND
Chart 2-7. The Hispanic population is younger on averagethan other demographic groups in the United States.
AI/AN = American Indian/Alaska Native.Source: United States Census Bureau. Census 2000.
Median population age in years, 2000
35 3930 26
33 29
0
20
40
60
80
100
Total White, non-Hispanic
Black Hispanic Asian AI/AN

19
THECOMMONWEALTH
FUND
Chapter 3. Disparities in Health Status and Mortality
Racial and ethnic minorities experience disparities across a significant number of health status measures and health outcomes. These racial and ethnic differences are driven by issues such as income, education, and work status, as well as poor housing, neighborhood segregation, and other environmental factors within communities. But disparities in health status and outcomes may also result from failures within the health care system. Problems accessing services and lower quality of care for minority populations clearly impact the health of these populations.
The Evidence
General Health Status
Minorities generally rate their health as poorer than whites (Chart 3-1). Non-Hispanic blacks are the most likely of all races examined to report they are in fair or poor health, with nearly 20 percent of non-Hispanic blacks reporting this compared with 11 percent of non-Hispanic whites. Hispanics and American Indians/Alaska Natives are nearly as likely as non-Hispanic blacks to report fair or poor health; 17.8 percent of Hispanics and 16 percent of American Indians/Alaska Natives rate their own health along these lowest categories.
While disparities in self-reported health status narrowedfor most minority groups in the 1990s, in more recent years the gap has not decreased and, in some instances, has increased. Most notably, the percentage of blacks who reported their health as either fair or poor increased by5 percentage points from 2004 to 2005.1
Blacks are also most likely to have a chronic illness or disability, with almost half reporting such a condition (Chart 3-2). The disparity in chronic illness between blacks and whites persists across income levels and after adjusting for age. Blacks with family incomes below 200 percent of the poverty level are 26 percent more likely to suffer from a chronic condition than whites (Chart 3-3). While both black and white individuals with incomes at or above 200 percent of the poverty level are less likely to be living with chronic illness than their poorer counterparts, the disparity between blacks and whites still exists and, in fact, is greater at this higher income level. Blacks at or above 200 percent of the poverty level are 40 percent more likely to have a chronic illness or disability than whites.
Life expectancy is another measure commonly used to gauge the health of populations. Since the beginning of the 20th century, life expectancy at birth in the United States

20
THECOMMONWEALTH
FUND
has increased and the gap between blacks and whites2
has narrowed. However, disparities still exist. In 2003, the life expectancy at birth of whites was 78 years, a full 5.3 years longer then the life expectancy for blacks (Chart 3-4). Many factors may contribute to this disparity, including higher rates of infant mortality, HIV, homicide, and heart disease in blacks.3 The gap between blacks and whitesfor life expectancy at age 65 is smaller but still persists.
When examining infant mortality as an indicator of the health and well-being of a population, blacks are by far the worst off among all the races or ethnicities examined. The infant mortality rate for non-Hispanic blacks in 2003 was almost 2.5 times greater than for whites (Chart 3-5). American Indians/Alaska Natives also have higher infant death rates than non-Hispanic whites.
Non-Hispanic blacks and American Indians/Alaska Natives are also more likely than whites to have low birthweight and very low birthweight babies, conditions which are closely linked to infant mortality and which can be diminished with timely prenatal care.4 Perhaps not surprisingly, non-Hispanic blacks and American Indians/Alaska Natives have the lowest percentages of pregnant women receiving prenatal care among all the groups examined (see Chapter 6, Chart 6-17).
Little progress appears to have been made in reducing infant death rates for all races and ethnicities, with a very
slight decline (less than one percentage point) in an eight-year period (Chart 3-5). Although improvement has been minimal, the infant mortality rates for blacks have declined slightly more than the rates for other groups. Interestingly, infant mortality rates are smaller for all racial and ethnic groups for mothers born outside the United States. Again, the most substantial difference is seen in the black population, where the infant death rate for U.S.-born women is 14.2 per 1,000 live births compared with 9.1 per 1,000 live births for foreign-born black women (Chart 3-6).
Risk Factors and Specific Diseases
Disparities are also widespread across a number of risk factors for disease and disability. Blacks are much more likely than whites to be overweight or obese. Nearly seven of 10 black individuals are either overweight or obese (69%) compared with 54 percent of white individuals (Chart 3-7). Data also show differences in smoking rates by race and ethnicity. American Indians/Alaska Natives are more likely than non-Hispanic whites to smoke, which could explain some of their health disparities, including higher occurrences of asthma (see below). Nearly 29 percent of the American Indian/Alaska Native population are current smokers compared with 22 percent of whites (Chart 3-8). Non-Hispanic blacks, Hispanics, and Asians are all less likely than whites to smoke.

21
THECOMMONWEALTH
FUND
Minority Americans are much more likely to have diabetes than whites. This is especially important given diabetes’role as a major risk factor for many other disorders, including heart and kidney diseases. American Indian/Alaska Native individuals are at the greatest risk for diabetes of all the races and ethnicities examined. American Indians/Alaska Natives are twice as likely as non-Hispanic whites to have diabetes with nearly 18 percent of this population suffering from the condition. A stark disparity is present for other Americans as well, as nearly 15 percent of the non-Hispanic black population and 14 percent of the Hispanic population have been diagnosed with the disease compared with only 8 percent of non-Hispanic whites (Chart 3-9).
The disparities between white and black populations are similarly striking when examining cardiovascular disease and cancers. Black women have a higher prevalence than white women for four related conditions—heart failure, coronary heart disease, hypertension, and stroke. Black men have a higher prevalence than white men for three of the four conditions—heart failure, hypertension, and stroke (Chart 3-10). While heart disease was the number one killer among all groups in the United States in 2003,5rates of mortality for black men and women were much higher than for white men and women (Chart 3-11).
Similarly, blacks experience higher incidence and mortality rates from many cancers that are amenable to
early diagnosis and treatment (Charts 3-12 to 3-15). Blacks are more likely than non-Hispanic whites to suffer from colorectal, prostate, and cervical cancer. Blacks are also more likely to die from these three diseases as compared with their non-Hispanic white counterparts (Charts 3-13 to 3-15). Notably, non-Hispanic white women have the highest incidence of breast cancer. Black women, however, still have the highest mortality rate from this disease among all races and ethnicities (Chart 3-12).
The higher breast cancer mortality rate for black women may be linked in part to problems with access to high-quality health care. While black women are just as likely to have had a mammogram as non-Hispanic white women (see Chapter 6, Chart 6-14), they are more likely to receive inadequate communication of their screening results compared with white women, particularly if their mammogram results are abnormal.6 Black breast cancer patients are also less likely to receive a complete diagnostic evaluation within 30 days of a patient-noted abnormality or abnormal mammogram.7
Hispanics have a higher incidence rate of infection-related cancers, including stomach, liver, and cervical cancers (Chart 3-16). Hispanic men and women are 1.5 to 2 times more likely than non-Hispanic men and women to have these cancers.

22
THECOMMONWEALTH
FUND
Infection-related cancers are more common in developing countries than in the United States and their incidence and mortality rates are high among first-generation Hispanic immigrants to the United States.8 Hispanic women are also less likely to be screened for cervical cancer than both white and black women (see Chapter 6, Chart 6-13).
One of the most striking health disparities is the prevalence of AIDS. The case rate for black adults and adolescents is 10 times greater than for white adults and adolescents (Chart 3-17). Yet black HIV patients are less likely to receive antiretroviral therapy, even after controlling for access to care.9 AIDS cases are also substantially more common in the Hispanic population than the white population; Hispanics are 3.5 times more likely to have AIDS than whites.
Hispanics who speak only Spanish have been found to have less knowledge about AIDS transmission.10 They are also less likely to seek an HIV test and more likely to have later diagnoses of HIV. Hispanics are less likely to adhere to antiretroviral therapy.11 Language barriers and lack of interpreters are some factors identified as barriers to medical adherence.12
Asthma is another health condition that disproportionately impacts minorities. Asthma prevalence is highest among
blacks, followed closely by American Indians/Alaska Natives. Over 9 percent of both minority groups suffer from the condition (Chart 3-18). Mortality rates for asthma, an outcome that should be wholly preventable through the management of the disease, are also higher for these two minority groups. In 2003, the rate of asthma-related deaths was 3.3 per 100,000 black individuals and 2 per 100,000 American Indian/Alaska Native individuals compared with only 1 per 100,000 for non-Hispanic white individuals (Chart 3-19).
Large disparities are also seen in the area of mental health. American Indians/Alaska Natives have the highest rates of frequent mental distress, with nearly 18 percent of the population reporting 14 or more mentally unhealthy days (Chart 3-20). Notably, alcohol dependence and post-traumatic stress disorder are particularly prevalent in American Indians, who are also less likely than the general population to seek help for these ailments.13 Non-Hispanic black and Hispanic individuals are also somewhat more likely than non-Hispanic whites to report frequent mental distress, with 12 percent of non-Hispanic blacks and 10 percent of Hispanics reporting the condition.
23
THECOMMONWEALTH
FUND
Notes
1. National Center for Health Statistics, Health, United States,2006: With Chartbook on Trends in the Health of Americans. 2006 (Hyattsville, Md.: National Center for Health Statistics). Datanot shown.
2. Life expectancy data are only available for the black andwhite populations.
3. S. Harper et al., “Trends in the Black-White Life Expectancy Gapin the United States, 1983–2003,” Journal of the American Medical Association, Mar. 21, 2007 297(11):1224–32.
4. J. L. Murray and M. Bernfield, “The Differential Effect of Prenatal Care on the Incidence of Low Birth Weight Among Blacks and Whites in a Prepaid Health Care Plan,” New England Journal of Medicine,Nov. 24, 1988 319(21):1385–91.
5. American Heart Association, Heart Disease and Stroke Statistics –2006 Update. 2006. Available at http://www.americanheart.org/downloadable/heart/113535864858055-1026_HS_Stats06book.pdf.
6. B. A. Jones et al., “Adequacy of Communicating Results from Screening Mammograms to African American and White Women,” American Journal of Public Health, Mar. 2003 97(3):531–38.
7. J. G. Elmore et al., “Racial Inequalities in the Timing of Breast Cancer Detection, Diagnosis, and Initiation of Treatment,” Medical Care, Feb. 2005 43(2):141–48.
8. American Cancer Society, Cancer Facts and Figures for Hispanics/Latinos 2006–2008. Available at http://www.cancer.org/downloads/STT/CAFF2006HispPWSecured.pdf.
9. K. A. Gebo et al., “Racial and Gender Disparities in Receipt of Highly Active Antiretroviral Therapy Persists in a Multistate Sampleof HIV Patients in 2001,” Journal of Acquired Immune Deficiency Syndromes, Jan. 1, 2005 38(1):96–103.
10. J. E. Miller, “Differences in AIDS Knowledge Among Spanish and English Speakers by Socioeconomic Status and Ability to Speak English,” Journal of Urban Health, Sept. 2000 77(3):415–24.
11. R. E. Campo et al., “Antiretroviral Treatment Considerations in Latino Patients,” AIDS Patient Care and STDs, June 2005 19(6):366–74.
12. D. A. Murphy et al., “Barriers and Successful Strategies to Antiretroviral Adherence among HIV-Infected Monolingual Spanish-Speaking Patients,” AIDS Care, Apr. 2003 15(2):217–30.
13. J. Beals et al., “Prevalence of Mental Disorders and Utilization of Mental Health Services in Two American Indian Reservation Populations: Mental Health Disparities in a National Context,” American Journal of Psychiatry, Sept. 2005 162(9):1723–32.

24
THECOMMONWEALTH
FUND
62 65
51 5347
62
26 2429 30
3729
12 1120 18 16
8.7
0
20
40
60
80
100
Total White, non-Hispanic
Black, non-Hispanic
Hispanic AI/AN Asian
Excellent/Very good Good Fair/Poor
AI/AN = American Indian/Alaska Native.Note: Data are age adjusted.Source: National Center for Health Statistics. National Health Interview Survey. 2005.
Percentage of adults age 18 and over, 2005
Chart 3-1. Minority groups (except Asians) are more likelythan whites to report their health status as fair or poor.

25
THECOMMONWEALTH
FUND
4048
29 25
39
0
20
40
60
80
100
Total White Black Hispanic Asian
Chart 3-2. Blacks are most likely to sufferfrom a chronic condition or disability.
Percentage of adults ages 18 to 64 withany chronic condition or disability, 2005
Note: Adults are considered to have a chronic condition or disability if they reported that a disability, handicap, or chronic disease kept them from working full-time or limited housework or other daily activities, or if they reported having diabetes or sugar diabetes, high blood pressure, asthma, bronchitis, emphysema, or other lung conditions, heart disease, heart failure, or heart attack.Source: The Commonwealth Fund. Health Care Quality Survey. 2006.

26
THECOMMONWEALTH
FUND
50
32
63
453923
0
20
40
60
80
100
Under 200% FPL 200% FPL or more
White Black Hispanic
Chart 3-3. Even at higher incomes, blacks are more likely to sufferfrom a chronic condition or disability than whites and Hispanics.
Percentage of adults ages 19 to 64 with any chronic disease or disability, by poverty level, 2005
Federal Poverty Level (FPL) is based on family income and family size and composition. In 2004, FPL was $18,850 for a family of four. Source: Federal Register, 2004 69(30):7336–38.Notes: Data are age adjusted. Adults are considered to have a chronic condition or disability if they reported that a disability, handicap, or chronic disease kept them from working full-time or limited housework or other daily activities, or if they reported having diabetes or sugar diabetes, high blood pressure, asthma, bronchitis, emphysema, or other lung conditions, heart disease, heart failure, or heart attack. Source: The Commonwealth Fund. Biennial Health Insurance Survey. 2005.

27
THECOMMONWEALTH
FUND
Note: Based on 1990 post-censal estimates of the United States resident population.Source: National Center for Health Statistics. Health, United States, 2006: With Chartbook on Trends in the Health of Americans. 2006.
Life expectancy in years of life remaining, 2003
78
19
73
17
0
20
40
60
80
100
At birth At age 65
White Black
Chart 3-4. Life expectancy at birth is five years lowerfor blacks compared with whites.

28
THECOMMONWEALTH
FUND
7.66.3
15
6.39.0
5.36.8 5.7
14
5.6
8.7
4.8
0
5
10
15
20
25
Total White, non-Hispanic
Black, non-Hispanic
Hispanic AI/AN Asian/PacificIslander
1995 2003
Chart 3-5. Infant mortality rates are still more than two timeshigher for blacks than for whites, despite a slight decline
for all groups in the past eight years.
Deaths per 1,000 live births by maternalrace/ethnicity, 1995 and 2003
AI/AN = American Indian/Alaska Native.Note: Infant is defined as a child under one year of age.Source: T. J. Matthews and M. F. MacDorman, “Infant Mortality Statistics from the 2003 PeriodLinked Birth/Infant Death Data Set,” National Vital Statistics Reports, May 3, 2006 54(16):1–29.

29
THECOMMONWEALTH
FUND
7.25.7
14
6.4 6.35.2 4.4
9.6
5.1 4.5
0
5
10
15
20
25
Total White, non-Hispanic
Black Hispanic Asian/PacificIslander
Born in the U.S. Born outside the U.S.
Note: Infant is defined as a child under one year of age.Source: T. J. Matthews and M. F. MacDorman, “Infant Mortality Statistics from the 2003 PeriodLinked Birth/Infant Death Data Set,” National Vital Statistics Reports, May 3, 2006 54(15):1–29.
Infant deaths per 1,000 live births by maternal birthplace, 2003
Chart 3-6. Infant mortality rates for foreign-born womenare lower than those for American-born women.

30
THECOMMONWEALTH
FUND
Note: Obesity is defined as a Body Mass Index (BMI) of 30 kg/m2 or more.Overweight is defined as BMI of 25 to 29.9 kg/m2. Source: The Commonwealth Fund. Health Care Quality Survey. 2006.
24 2237
21
31 32
32
28
24
5.00
20
40
60
80
100
Total White Black Hispanic Asian
Overweight
Obese
55 54
69
49
29
Chart 3-7. Seven of 10 blacks are either overweight or obese;blacks are substantially more likely to be obese than other groups.
Percentage of adults 18 to 64 who are overweight or obese, 2006

31
THECOMMONWEALTH
FUND
19 22 1811 6.0
29
0
20
40
60
80
100
Total White, non-Hispanic
Black, non-Hispanic
Hispanic Asian AI/AN
Chart 3-8. American Indians/Alaska Natives are more likelyto smoke than whites; blacks, Hispanics, and Asians
are less likely to smoke.
Percentage of adults age 18 and overwho are current smokers, 2002–2004
AI/AN = American Indian/Alaska Native.Notes: Current smokers are defined as ever smoking 100 cigarettes in their lifetime and smoking nowevery day or on some days. Data are age adjusted to the 2000 U.S. standard population. Source: National Center for Health Statistics. Health, United States, 2006: With Chartbook on Trends in theHealth of Americans. 2006.

32
THECOMMONWEALTH
FUND
9.6 8.015 14 18
0
20
40
60
80
100
Total White, non-Hispanic
Black, non-Hispanic
Hispanic AI/AN
Chart 3-9. American Indians/Alaska Natives are more likelyto have diabetes than other groups.
Percentage of people age 20 years or older with diabetes, 2005
AI/AN = American Indian/Alaska Native.Source: National Institutes of Health, National Diabetes Information Clearinghouse. Total Prevalence of Diabetes Among People Aged 20 Years or Older, United States, 2005.

33
THECOMMONWEALTH
FUND
Chart 3-10. Black men and women are most likely to haveheart failure, high blood pressure, and stroke; black women are
also more likely than other women to have coronary heart disease.
Note: Data were only available for the largest Hispanic subpopulation, Mexican Americans. Note: Data are age adjusted for Americans age 20 and older.Source: T. Thom et al., “Heart Disease and Stroke Statistics—2006 Update,” Circulation, Feb. 14, 2006 113(6):e85–e151.
Heart Failure
2.5 3.1 2.71.9
3.5
1.6
0
5
10
15
20
White Black Mexican American
High Blood Pressure
3142
2831
45
29
0
20
40
60
80
100
White Black Mexican American
Stroke
2.34.0
2.62.63.9
1.8
0
5
10
15
20
White Black Mexican American
Coronary Heart Disease
8.97.4
5.65.47.5
4.3
0
5
10
15
20
White Black MexicanAmerican
Male Female
Percentage of people age 20 or older, 2003

34
THECOMMONWEALTH
FUND
287 287
364
207 203
158
104128
146
254
187190
0
50
100
150
200
250
300
350
400
Total White, non-Hispanic
Black Hispanic AI/AN Asian/PacificIslander
Male Female
AI/AN = American Indian/Alaska Native.Note: Data are age adjusted.Source: National Center for Health Statistics. Health, United States, 2006: With Chartbook on Trends in the Health of Americans. 2006.
Heart disease deaths per 100,000 resident population (all ages), 2003
Chart 3-11. Black men and women are more likely to diefrom heart disease than all other racial/ethnic groups.

35
THECOMMONWEALTH
FUND
121131
119
8087
0
20
40
60
80
100
120
140
Total White, non-Hispanic
Black Hispanic Asian/PacificIslander
26 26
34
1613 13
0
10
20
30
40
50
Total White, non-Hispanic
Black Hispanic AI/AN Asian/PacificIslander
AI/AN = American Indian/Alaska Native.Note: Data are age adjusted.Source: National Center for Health Statistics. Health, United States, 2006: With Chartbook on Trends in the Health of Americans. 2006.
New cases per 100,000 female population, 2003 Deaths per 100,000 female population, 2000–2003
Incidence Mortality
Chart 3-12. Minority women have lower rates of breast cancerthan white women, but black women are more likely
to die from the disease.

36
THECOMMONWEALTH
FUND
20 20
27
14 13 13
0
10
20
30
40
50
Total White, non-Hispanic
Black Hispanic AI/AN Asian/PacificIslander
All
57 58
73
4451
42 43
53
3035
0
20
40
60
80
100
T o tal White, no n-H ispanic
B lack H ispanic A sian/ P acif icIslander
Male Female
Chart 3-13. Blacks have higher incidence of and mortality from colorectal cancer than all other racial/ethnic groups.
New cases per 100,000 population, 2003 Deaths per 100,000 population, 2000–2003
Incidence Mortality
AI/AN = American Indian/Alaska Native.Note: Data are age adjusted to the U.S. standard population.Source: National Center for Health Statistics. Health, United States, 2006: With Chartbook on Trends in the Health of Americans. 2006.

37
THECOMMONWEALTH
FUND
160 157
238
127
98
0
50
100
150
200
250
Total White, non-Hispanic
Black Hispanic Asian orPacific
Islander
29 26
64
2218
11
0
20
40
60
80
Total White, non-Hispanic
Black Hispanic AI/AN* Asian/PacificIslander
Chart 3-14. Black men are 50 percent more likelyto have prostate cancer than whites but are
more than twice as likely to die from it.
AI/AN = American Indian/Alaska Native.Note: Data are age adjusted.Source: National Center for Health Statistics. Health, United States, 2006: With Chartbook on Trends in the Health of Americans. 2006.
New cases per 100,000 male population, 2003 Deaths per 100,000 male population, 2000–2003
Incidence Mortality

38
THECOMMONWEALTH
FUND
8.06.3
10
14
7.7
0
5
10
15
20
25
Total White, non-Hispanic
Black Hispanic Asian/PacificIslander
Chart 3-15. Hispanic women are twice as likely to havecervical cancer than whites; black women are
twice as likely to die from the disease.
AI/AN = American Indian/Alaska Native.Note: Data are age adjusted. Source: National Cancer Institute, Surveillance Epidemiology and End Results (SEER)Cancer Statistics Review, 1975–2003.
New cases per 100,000 female population, 2003
Incidence Mortality
2.6 2.3
5.0
3.42.8 2.5
0
5
10
Total White, non-Hispanic
Black Hispanic AI/AN Asian/PacificIslander
Deaths per 100,000 female population, 2000–2003

39
THECOMMONWEALTH
FUND
9.45.84.8
7.7
2.8
8.6
151516
10
0
5
10
15
20
25
Male Female Male Female Female
Stomach Liver Cervical
Hispanic Non-Hispanic
Chart 3-16. Hispanics are more likely to suffer frominfection-related cancers than non-Hispanics.
Note: Data are age adjusted to the 2000 U.S. standard population.Source: H. L. Howe et al., “Annual Report to the Nation on the Status of Cancer, 1975–2003, Featuring Cancer Among U.S. Hispanic/Latino Populations,” Cancer, Oct. 15, 2006 107(8):1711–42.
Incidence of selected infection-related cancersper 100,000 population, 1999–2003

40
THECOMMONWEALTH
FUND
Chart 3-17. Blacks are 10 times more likely than whites andnearly three times more likely than Hispanics to have AIDS.
AI/AN = American Indian/Alaska Native.AIDS = Acquired Immune Deficiency Syndrome.Source: Centers for Disease Control and Prevention. HIV/AIDS Surveillance Report. 2006.
7.5
75
26
104.9
0
20
40
60
80
100
White Black Hispanic AI/AN Asian/PacificIslander
AIDS case rate per 100,000 population foradults/adolescents age 13 and older, 2005

41
THECOMMONWEALTH
FUND
Chart 3-18. Blacks and American Indians/Alaska Natives aremore likely to suffer from asthma than other racial/ethnic groups.
7.7 7.69.4
6.29.2
4.9
0
5
10
15
20
25
Total White, non-Hispanic
Black, non-Hispanic
Hispanic AI/AN Asian
AI/AN = American Indian/Alaska Native.Note: Data are age adjusted to the 2000 United States standard population.Source: L. Akinbami, Asthma Prevalence, Health Care Use and Mortality: United States, 2003–05. National Center for Health Statistics.
Percentage of population all ages who currently have asthma, 2005

42
THECOMMONWEALTH
FUND
Chart 3-19. Blacks are three times more likelyto die from asthma than whites.
1.41.1
3.3
1.3
2.01.7
0
1
2
3
4
5
Total White, non-Hispanic
Black, non-Hispanic
Hispanic AI/AN Asian
Number of asthma deaths per 100,000 people, 2003
AI/AN = American Indian/Alaska Native.Note: Data are age adjusted to the 2000 United States standard population.Source: L. Akinbami, Asthma Prevalence, Health Care Use and Mortality: United States, 2003–05. National Center for Health Statistics.

43
THECOMMONWEALTH
FUND
12 1018
9.6 6.1
0
20
40
60
80
100
White, non-Hispanic
Black, non-Hispanic
Hispanic AI/AN Asian/PacificIslander
AI/AN = American Indian/Alaska Native.Note: Frequent mental distress is defined as having 14 or more mentally unhealthy days in the year.Source: Centers for Disease Control and Prevention. Behavioral Risk Factor Surveillance System. 2005.
Chart 3-20. American Indians/Alaska Natives are nearly twiceas likely as whites to have frequent mental distress.
Percentage of noninstitutionalized adultsover 18 with frequent mental distress, 2005

44
THECOMMONWEALTH
FUND
Chapter 4. Disparities in Access to Health Care
Minority Americans are more likely to have problems accessing high-quality health care than whites. This disparity in access is especially problematic as individuals without a stable, ongoing relationship to a provider are less likely to obtain preventive and specialty services,1,2,3
and less likely to experience improved health outcomes.
Socioeconomic factors and health insurance status are significant and powerful predictors of access.4Socioeconomic status and insurance, however, do not explain all of the racial and ethnic disparities in access to care. Numerous studies have shown that even when accounting for insurance and income, disparities in access to care still exist. In the past several years, researchers have begun to explore a wide range of other factors that may explain the racial and ethnic differences in access, many of which reflect failings in the health care system. These include factors such as geographic isolation that makes finding and getting to care difficult,5 language and cultural barriers that deter non-English speaking patients from seeking out care,6,7 and the availability of support services such as child care and transportation.8,9,10
The Evidence
Minorities are less likely to have a usual source of care than whites. Chart 4-1 indicates that black, Hispanic, and
Asian adults are all more likely to be without a regular doctor than white individuals. Lack of access is especially acute for Hispanics, who are over three times as likely as whites to have no regular provider. Income and insurance status are likely contributing to this disparity, but studies have shown that even when controlling for these factors, Hispanics are still more likely to lack a regular sourceof care.11
Hispanics’ choice of location of care is also telling (Chart4-2). Hispanics are the least likely of the racial and ethnic groups examined to use private physicians as their place of care and the most likely to use community health centers (CHC). Hispanics’ high usage of CHCs may be explained by the facilities’ support services (e.g., interpreter services, off-peak hours, and transportation), willingness to provide care despite patients’ inability to pay, and convenient locations, often in low-income areas.12
Blacks are more likely than whites to use the emergency department (ED) as their regular place of care (Chart 4-2). Low income, lack of insurance, and lack of social supports all factor into minorities’ lack of access and increased use of the ED.13,14 Community and geographic factors may also contribute to the differences in where minority and white individuals seek out care. Private physiciansmay not be as willing or able to locate in poor,

45
THECOMMONWEALTH
FUND
racially or economically segregated neighborhoods, leaving hospital EDs and CHCs as the most readily available alternatives for minority populations.15
The barriers and obstacles that impede Hispanics’ access to a regular provider may also lead them to forgo care when needed. In 2006, almost half of Hispanics reported they did not always get care when needed, compared with 43 percent of blacks and 41 percent of whites (Chart 4-3). Asians also are more likely to go without needed care.
Blacks, however, are more likely than both whites and Hispanics to report delaying or forgoing dental care and prescription drugs (Chart 4-4). This disparity may be driven more by income and insurance than race. These services are hard to obtain for low-income, uninsured individuals because of their cost, and may be perceivedas less important than other types of health care.
Financial barriers are also frequently an issue for the Medicaid population, as limited coverage for both dental services and prescription drugs translates into out-of-pocket costs that enrollees simply cannot afford.16,17
Substantial disparities are also found for high-technology health care services, even when insurance status doesnot vary. One study found that among Medicare recipients, black men were much less likely to receive angioplasties than white men (Chart 4-5). Given the high prevalence and mortality rates of heart disease among blacks, it is unlikely that this difference is explained by clinical need.
Notes
1. U. Sambamoorthi and D. D. McAlpine, “Racial, Ethnic, Socioeconomic, and Access Disparities in Use of Preventive Services Among Women,” Preventive Medicine, Nov. 2003 37(5):475–84.
2. S. Liang et al., “Rates and Predictors of Colorectal Cancer Screening,” Preventing Chronic Disease, Oct. 2006 3(4):A117.
3. P. K. J. Han et al., “Decision Making in Prostate-Specific Antigen Screening,” American Journal of Preventive Medicine, May 2006 30(5):394–404.
4. J. B. Kirby, G. Taliaferro, and S. H. Zuvekas, “Explaining Racialand Ethnic Disparities in Health Care,” Medical Care, May 2006 44(5 Suppl):I64–I72.
5. J. C. Probst et al., “Effects of Residence and Race on Burden of Travel for Care: Cross-Sectional Analysis of the 2001 U.S. National Household Travel Survey,” BMC Health Services Research, Mar. 9, 2007 7(1):40.
6. K. P. Derose and D. W. Baker, “Limited English Proficiency and Latinos’ Use of Physician Services,” Medical Care Research and Review, Mar. 2000 57(1):76–91.
7. A. A. Greek et al., “Family Perceptions of the Usual Source of Care Among Children with Asthma by Race/Ethnicity, Language, and Family Income,” Journal of Asthma, Jan./Feb. 2006 43(1):61–69.
8. S. R. Collins, K. Davis, M. M. Doty, and A. Ho, Wages, Health Benefits, and Workers' Health (New York: The Commonwealth Fund, Oct. 2004).

46
THECOMMONWEALTH
FUND
9. J. A. Gwira et al., “Factors Associated with Failure to Follow Up After Glaucoma Screening: A Study in an African American Population,” Ophthalmology, Aug. 2006 113(8):1315–19.
10. K. T. Call et al., “Barriers to Care Among American Indians in Public Health Care Programs,” Medical Care, June 2006 44(6):595–600.
11. M. M. Doty and A. L. Holmgren, Health Care Disconnect: Gaps in Coverage and Care for Minority Adults: Findings from The Commonwealth Fund Biennial Health Insurance Survey (2005)(New York: The Commonwealth Fund, Aug. 2006).
12. S. Rosenbaum and P. Shin, Health Centers Reauthorization: An Overview of Achievements and Challenges (Washington, D.C.: Kaiser Commission on Medicaid and the Uninsured. Mar. 2006).
13. S. H. Zuvekas and G. S. Taliaferro, “Pathways to Access: Health Insurance, the Health Care Delivery System, and Racial/Ethnic Disparities, 1996–1999,” Health Affairs, Mar./Apr. 2003 22(2):139–53.
14. R. Hong, B. M. Baumann, and E. D. Boudreaux, “The Emergency Department for Routine Healthcare: Race/Ethnicity, SocioeconomicStatus, and Perceptual Factors,” Journal of Emergency Medicine,Feb. 2007 32(2):149–58.
15. E. C. Norton and D. O. Staiger, “How Hospital Ownership Affects Access to Care for the Uninsured,” RAND Journal of Economics,Spring 1994 25(1):171–85.
16. L. A. Cohen et al., “Dental Visits to Hospital Emergency Departments by Adults Receiving Medicaid: Assessing Their Use,” Journal of the American Dental Association, 2002 133(6):715–24.
17. J. P. Hall, N. K. Kurth, and J. M. Moore, “Transition to MedicarePart D: An Early Snapshot of Barriers Experienced by Younger Dual Eligibles with Disabilities,” American Journal of Managed Care,Jan. 2007 13(1):14–18.

47
THECOMMONWEALTH
FUND* Compared with whites, differences remain statistically significant after adjusting for age, income, and insurance.Source: The Commonwealth Fund. Health Care Quality Survey. 2006.
Chart 4-1. Almost 2.5 times as many Hispanics as whitesreport having no doctor.
2721
28
51
23
0
20
40
60
80
100
Total White Black Hispanic Asian
Percentage of adults ages 18 to 64 reporting no regular doctor, 2006
*

48
THECOMMONWEALTH
FUND
93 5 2
62
13 12
19
44
21
815
5
75
7 4 4 7
77
0
20
40
60
80
100
Doctor's office orprivate clinic
Communityhealth center
Emergency room
No regular placeof care
Hospitaloutpatient
White Black Hispanic Asian
*
*
**
* Compared with whites, differences remain statistically significant after adjusting for insurance or income.Source: The Commonwealth Fund. Health Care Quality Survey. 2006.
Chart 4-2. Hispanics are least likely of all racial/ethnic groupsto use a private doctor and most likely to use a
community health center as their usual place of care.
Percentage of adults ages 18 to 64 by usual place of care, 2006

49
THECOMMONWEALTH
FUND
Chart 4-3. Asians and Hispanics are more likely thanwhites and blacks to go without needed care.
45 43 4454 52
0
20
40
60
80
100
Total White Black Hispanic Asian
* *
Percentage of adults ages 18 to 64 reportingnot always getting care when needed, 2006
* Compared with whites, differences remain statistically significant after adjusting for income.Source: The Commonwealth Fund. Health Care Quality Survey. 2006.

50
THECOMMONWEALTH
FUND
10 7.212 8.911
6.27.0 4.4
0
20
40
60
80
100
Dental care Prescription drugs
White, non-Hispanic Black, non-Hispanic Hispanic AI/AN Asian
AI/AN = American Indian/Alaska Native. N/A = No data available for dental care.Note: Values are for reference person in the family, excluding families with a reference person age under 18.Source: Agency for Healthcare Research and Quality. National Healthcare Disparities Report. 2006.
Chart 4-4. Blacks are more likely to forgo dental care andprescription drugs than whites; American Indians/Alaska Natives
were most likely to go without prescription drugs.
17.0
N/A
Percentage of families in which a member was unable to receive orwas delayed in receiving needed dental care or prescription drugs, 2003

51
THECOMMONWEALTH
FUND
Chart 4-5. Black men with Medicare are much less likelyto receive angioplasties than white men with Medicare.
Note: Estimates are age adjusted.Source: A. K. Jha et al., “Racial Trends in the Use of Major Procedures Among the Elderly,”New England Journal of Medicine, Aug. 18, 2005 353(7):683–91.
28
1720
17
0
10
20
30
40
50
Men Women
White Black
Rate of angioplasty per 1,000 Medicare enrollees, 2001

52
THECOMMONWEALTH
FUND
Chapter 5. Disparities in Health Insurance Coverage
Lack of health insurance coverage continues to be a significant issue in the United States. More than one of six Americans is uninsured and the percentage of individuals in the country without coverage is growing; from 2000 to 2005 the population of uninsured grew from 14.2 percent to 15.9 percent.1 Without insurance, individuals are less likely to have a usual source of care, to use preventive or specialty care, to obtain needed prescription drugs, and to receive the highest quality services.2, 3, 4
Racial and ethnic disparities in insurance status are driven by a number of factors that disproportionately affect minority populations. Cost is a major barrier to insurance coverage for minorities. Many low-income families make too much money to be eligible for public programs, but not enough to afford private coverage. Minorities are less likely to have employer-sponsored coverage, which contributes to lower rates of coverage.5 Moreover, uninsured minorities are poorer than uninsured whites and less likely to be able to purchase private insurance.6
Lack of health insurance may also be attributable in part to lack of knowledge of public programs and eligibility criteria among eligible individuals, many of whom are minorities.7 Enrollment barriers, such as long and complicated applications and onerous documentation requirements (income, assets, and citizenship), also serve
as obstacles for many minorities who are entitled to support.8 Moreover, for immigrant families, confusion and fear about eligibility requirements and immigrant status inhibit many individuals from obtaining coverage.9
The Evidence
More than one of three Hispanics and American Indians/Alaska Natives do not have health insurance. These proportions are nearly triple that for whites (Chart 5-1). Blacks and Asians are also more likely than whites to lack health insurance, with nearly one of five members of both groups going without coverage.
The issue of coverage appears to be especially grave for Hispanic individuals. Hispanics are much more likely than whites and blacks to have interrupted coverage, suggesting that they face additional problems that impede their ability to get and keep health insurance coverage. Chart 5-2 demonstrates that, according to one survey, almost half of the Hispanic population in the United States is likely to be uninsured at some point during the year compared with one-quarter of the black population and one-fifth of the white population.
This disparity persists and, in fact, increases forHispanics at higher income levels. Almost one-third
53
THECOMMONWEALTH
FUND
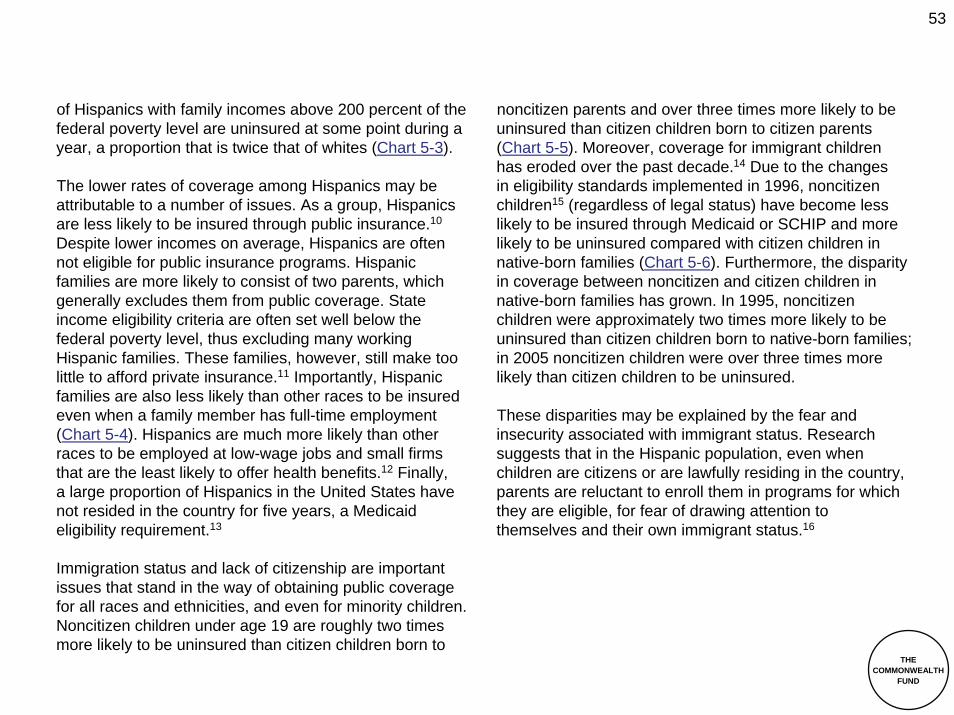
of Hispanics with family incomes above 200 percent of the federal poverty level are uninsured at some point during a year, a proportion that is twice that of whites (Chart 5-3).
The lower rates of coverage among Hispanics may be attributable to a number of issues. As a group, Hispanics are less likely to be insured through public insurance.10
Despite lower incomes on average, Hispanics are often not eligible for public insurance programs. Hispanic families are more likely to consist of two parents, which generally excludes them from public coverage. State income eligibility criteria are often set well below the federal poverty level, thus excluding many working Hispanic families. These families, however, still make too little to afford private insurance.11 Importantly, Hispanic families are also less likely than other races to be insured even when a family member has full-time employment (Chart 5-4). Hispanics are much more likely than other races to be employed at low-wage jobs and small firms that are the least likely to offer health benefits.12 Finally,a large proportion of Hispanics in the United States have not resided in the country for five years, a Medicaid eligibility requirement.13
Immigration status and lack of citizenship are important issues that stand in the way of obtaining public coverage for all races and ethnicities, and even for minority children. Noncitizen children under age 19 are roughly two times more likely to be uninsured than citizen children born to
noncitizen parents and over three times more likely to be uninsured than citizen children born to citizen parents (Chart 5-5). Moreover, coverage for immigrant childrenhas eroded over the past decade.14 Due to the changesin eligibility standards implemented in 1996, noncitizenchildren15 (regardless of legal status) have become less likely to be insured through Medicaid or SCHIP and more likely to be uninsured compared with citizen children in native-born families (Chart 5-6). Furthermore, the disparity in coverage between noncitizen and citizen children in native-born families has grown. In 1995, noncitizenchildren were approximately two times more likely to be uninsured than citizen children born to native-born families; in 2005 noncitizen children were over three times more likely than citizen children to be uninsured.
These disparities may be explained by the fear and insecurity associated with immigrant status. Research suggests that in the Hispanic population, even when children are citizens or are lawfully residing in the country, parents are reluctant to enroll them in programs for which they are eligible, for fear of drawing attention to themselves and their own immigrant status.16

54
THECOMMONWEALTH
FUND
Notes
1. C. DeNavas-Walt, B. D. Proctor, and C. H. Lee, “Income, Poverty and Health Insurance Coverage in the United States, 2005,” United States Census Bureau, Aug. 2006. Available at http://www.census.gov/prod/2006pubs/p60-231.pdf.
2. B. Starfield and L. Shi, “The Medical Home, Access to Care,and Insurance: A Review of Evidence,” Pediatrics, May 2004113(5 Suppl):1493–98.
3. E. Bradley et al., “Racial and Ethnic Differences in Time to Acute Reperfusion Therapy for Patients Hospitalized with Myocardial Infarction,” Journal of the American Medical Association, Oct. 6, 2004 292(13):1563–72.
4. S. R. Collins, K. Davis, M. M. Doty, J. L. Kriss, and A. L. Holmgren, Gaps in Health Insurance: An All-American Problem (New York: The Commonwealth Fund, Apr. 2006).
5. M. Lillie-Blanton and C. Hoffman, “The Role of Health Insurance Coverage in Reducing Racial/Ethnic Disparities in Health Care,” Health Affairs, Mar./Apr. 2005 24(2):398–408.
6. Ibid.
7. G. Kenney, J. Haley, and A. Tebay, “Familiarity with Medicaid and SCHIP Programs Grows and Interest in Enrolling Children Is High,” Snapshots of America’s Families, 2003 3(2). Urban Institute.
8. L. Ku, D. C. Ross, and M. Broaddus, “Survey Indicates the Deficit Reduction Act Jeopardizes Medicaid Coverage for 3 to 5 Million U.S. Citizens,” Center on Budget and Policy Priorities. Feb. 17, 2006.
9. J. Kincheloe, J. Frates, and E. R. Brown, “Determinants of Children’s Participation in California’s Medicaid and SCHIP Programs,” Health Research and Educational Trust, Apr. 2007 42(2):847–66.
10. M. M. Doty and A. L. Holmgren, Health Care Disconnect: Gaps in Coverage and Care for Minority Adults: Findings from The Commonwealth Fund Biennial Health Insurance Survey (2005)(New York: The Commonwealth Fund, Aug. 2006).
11. K. Quinn, Working Without Benefits: The Health Insurance Crisis Confronting Hispanic Americans (New York: The Commonwealth Fund, Feb. 2000).
12. Ibid.
13. Ibid.
14. L. Ku, M. Lin, and M. Broaddus, Improving Children’s Health:A Chartbook About the Roles of Medicaid and SCHIP (Washington, D.C.: Center on Budget and Policy Priorities, Jan. 2007).
15. Immigrant children is defined as foreign-born children who are not citizens. The data, which come from the Current Population Survey, do not differentiate between lawful, permanent resident immigrant children, undocumented children, and those with visas.
16. K. Quinn, Working Without Benefits: The Health Insurance Crisis Confronting Hispanic Americans (New York: The Commonwealth Fund, Feb. 2000).

55
THECOMMONWEALTH
FUND
17 1218
35 35
16
0
20
40
60
80
100
Total White,non-
Hispanic
Black,non-
Hispanic
Hispanic AI/AN Asian
Percentage of people under age 65 withouthealth insurance coverage, 2004
Chart 5-1. Hispanics are most likely to lack health insurancecoverage, with more than one-third uninsured.
AI/AN = American Indian/Alaska Native.Note: Data are age adjusted to the 2000 U.S. standard population.Note: The category “uninsured” includes persons who had no coverage as well as those who had only Indian Health Service coverage or only a private plan that paid for one type of service, such as accidents or dental care.Source: National Center for Health Statistics. National Health Interview Survey. 2004.

56
THECOMMONWEALTH
FUND
Chart 5-2. Nearly half of Hispanics report being uninsuredat some point in the past year.
* Compared with whites, differences remain statistically significant after adjusting for income.Note: Data include adults uninsured at time of survey or insured at time of survey but uninsured at some point in the previous year.Source: The Commonwealth Fund. Health Care Quality Survey. 2006.
2621
28
49
19
0
20
40
60
80
100
Total White Black Hispanic Asian
*
Percentage of adults ages 18 to 64 uninsured anytime in the past year, 2006

57
THECOMMONWEALTH
FUND
45
16
46
15
31
58
10
46
0
20
40
60
80
100
Income under 200% FPL Income at or above 200% FPL
White Black Hispanic Asian
Federal Poverty Level (FPL) is based on family income and family size and composition. In 2004, FPL was $18,850 for a family of four. Source: Federal Register. 2004;69(30):7336–38. Note: Data include adults uninsured at time of survey or insured at time of survey but uninsured at some point in the previous year.Source: The Commonwealth Fund. Health Care Quality Survey. 2006.
Chart 5-3. Even at high income levels,Hispanics are more likely to be uninsured.
Percentage of adults ages 18 to 64 uninsuredat some point during the year by income, 2006

58
THECOMMONWEALTH
FUND
Chart 5-4. Hispanics are least likely to have continuous insurance coverage even when a family member has full-time employment.
* Compared with whites, differences remain statistically significant after adjusting for income.Source: The Commonwealth Fund. Health Care Quality Survey. 2006.
78 8275
84
53*
0
20
40
60
80
100
Total White Black Hispanic Asian
Percentage of adults ages 18 to 64 insured all yearwith at least one full-time worker in their family, 2006
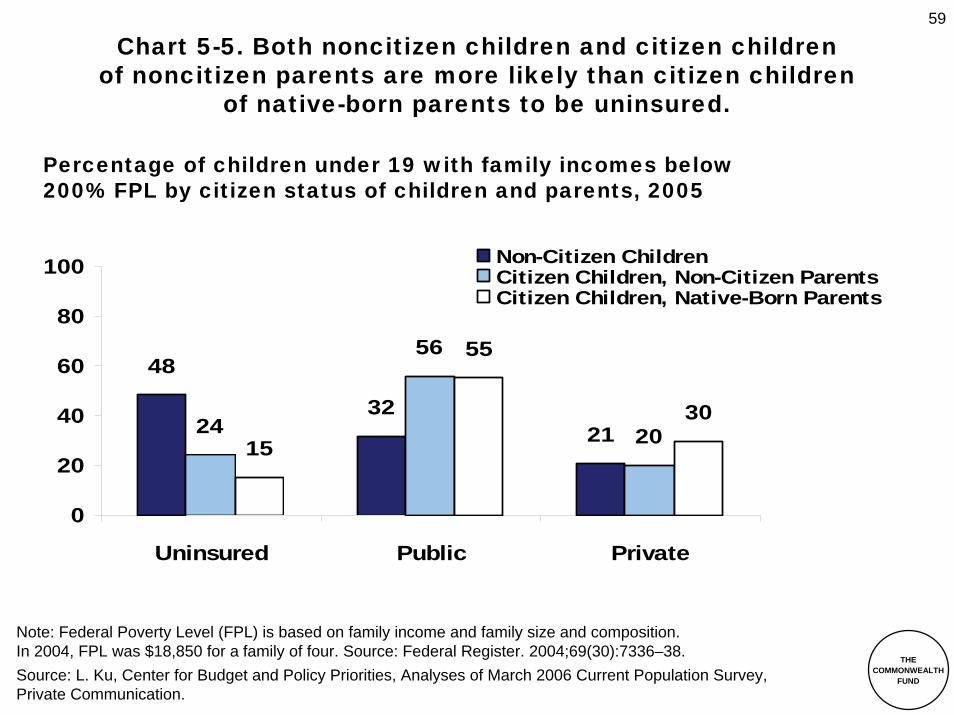
59
THECOMMONWEALTH
FUND
Chart 5-5. Both noncitizen children and citizen childrenof noncitizen parents are more likely than citizen children
of native-born parents to be uninsured.
Note: Federal Poverty Level (FPL) is based on family income and family size and composition.In 2004, FPL was $18,850 for a family of four. Source: Federal Register. 2004;69(30):7336–38.Source: L. Ku, Center for Budget and Policy Priorities, Analyses of March 2006 Current Population Survey, Private Communication.
48
322124
56
2015
55
30
0
20
40
60
80
100
Uninsured Public Private
Non-Citizen ChildrenCitizen Children, Non-Citizen ParentsCitizen Children, Native-Born Parents
Percentage of children under 19 with family incomes below200% FPL by citizen status of children and parents, 2005

60
THECOMMONWEALTH
FUND
19
45 4436
15
53 48
30
0
20
40
60
80
100
Uninsured Medicaid/SCHIP Uninsured Medicaid/SCHIP
1995 2005
Percentage of children with family incomes below 200% of the Federal Poverty Level, by citizen status and type of coverage, 1995 and 2005
Chart 5-6. Immigrant children have become more likely to beuninsured in the past decade than citizen children; disparity in
coverage between immigrant and citizen children has also grown.
U.S. Citizen Children Born in Native-Born Families Immigrant
Children
Federal Poverty Level (FPL) is based on family income and family size and composition. In 2004,FPL was $18,850 for a family of four. Source: Federal Register. 2004;69(30):7336–38.Note: Immigrant children includes all foreign-born children who are not U.S. citizens, regardless of legal status.Source: L. Ku, M. Lin, and M. Broaddus, Improving Children’s Health: A Chartbook About the Roles of Medicaid and SCHIP (Washington, D.C.: Center on Budget and Policy Priorities. Jan. 2007).

61
THECOMMONWEALTH
FUND
Chapter 6. Disparities in Quality
According to the Institute of Medicine (IOM), health care should exhibit six key characteristics in order to be deemed high-quality care; it should be safe, timely, effective, efficient, patient-centered, and equitable.1 The IOM defines these domains of quality as follows:
(1) Safe – Care avoids causing injury to patients from the care provided.
(2) Timely – Wait times and delays are minimized for those who receive and provide care.
(3) Effective – Services are provided based on scientific knowledge to all who could benefit and are not provided to those who would not benefit.
(4) Efficient – Care avoids wasting equipment, supplies, ideas, and energy.
(5) Patient-Centered – Care is delivered with “compassion, empathy, and responsiveness to the need, values, and expressed preferences of the individual patient” and ensures that patients “have the education and support they need to make decisions and participate in their own care.”
(6) Equitable2 – Care does not vary in quality because of personal characteristics, including gender, ethnicity, geographic location, or socioeconomic status.
The care provided must satisfy all six of these elements tobe high quality. In all areas, we see significant disparities inthe quality of care delivered to racial and ethnic minorities. All of the charts in this chapter showing disparities are examples of inequitable care, and therefore poor-quality care.
The Evidence
The sources of these disparities are the subject of considerable debate. Differences in quality may be the result of differential treatment of patients by individual providers,3but emerging evidence also points to variation in quality among providers depending on the race or ethnicity of their patients. In one study, primary care physicians that primarily cared for black patients were more likely to report difficultyin providing high-quality care than physicians who primarily cared for white patients4 (Chart 6-1). Specifically, these physicians reported they were less able to provide accessto high-quality subspecialists, to high-quality diagnostic imaging, to nonemergency hospital admissions, and tohigh-quality ancillary services.
In another investigation, risk-adjusted mortality after heart attack was found to be significantly higher in hospitals that disproportionately serve blacks5 (Chart 6-2). Theevidence suggests that settings that provide largevolumes of care to minorities may be challenged

62
THECOMMONWEALTH
FUND
in ensuring all their patients receive services of thehighest quality.
Regional variation in quality may also play a role in observed national health care disparities. Chart 6-3 is especially suggestive of this: states with the largest numbers of white residents have the highest quality of hospital care for Medicare patients.6 None of this is surprising given the financial challenges often facing providers of care to poorer, minority populations and the legacy of segregation. However, this evidence showsthat addressing disparities may, in large part, require confronting systemic shortcomings in quality as well asin access to care and health insurance coverage.
Safety
Each year in the United States, medical errors cause an estimated 44,000 to 98,000 deaths and cost an estimated $29 billion in lost income, disability, and increased health care costs. Unfortunately, minorities bear a large share of the consequences of unsafe care.7 Errors and avoidable complications from surgery affect minorities more than non-Hispanic whites. For example, Asians and Hispanics are more likely to die from complications during hospitalization than non-Hispanic whites (Chart 6-4).Non-Hispanic blacks are much more likely to suffer postoperative pulmonary embolism or deep vein thrombosis than non-Hispanic whites (Chart 6-5).
In addition, minorities may be disproportionately subjected to practices that can cause injuries. In one study, black
youths were two times more likely and Hispanic youths were 70 percent more likely than white youths to have restraints upon admission to a psychiatric hospital, even when controlled for psychiatric condition8 (Chart 6-6). In a three-month snapshot of Medicaid and Medicare data, higher percentages of Asian or Pacific Islander and Hispanic residents of long-stay nursing homes were physically restrained than residents of other races (Chart 6-7).
Timeliness
Receiving medical treatment in a timely fashion can reduce mortality and long-term disability from many conditions, including stroke, heart attack, and bacterial infections. Minority patients often experience longer wait times for health care. For example, minorities are less likely to get a same day or next day appointment to see a doctor than whites and are more likely to be unable to get an appointment until six or more days later9 (Chart 6-8). Between 1997 and 2004, black patients seeking emergency department care were more likely to have left without being seen than white patients, which may be due to long wait times (Chart 6-9).
Minorities are also more likely to suffer some conditionsthat may be caused or exacerbated by delays in care. Non-Hispanic blacks and Hispanics are more likely than whites or Asians to be hospitalized for perforated appendix,a condition which is avoidable with timely diagnosisand surgery (Chart 6-10). The disparity diminishesas income increases, and equalizes for whites and

63
THECOMMONWEALTH
FUND
Hispanics. For blacks, however, the delay in time is substantially higher than whites, even at higher income levels.
Timeliness to interventions is also critical when faced with life-threatening conditions, such as heart attacks. One study showed that minorities in general face longer “door-to-balloon”10 times for cardiac catheterizations than whites, and that blacks in particular suffer from the longest times. Blacks’ door-to-balloon times were on average almost 20 minutes longer than times for whites. Many factors may contribute to the additional delays experienced by minorities. In the case of cardiac catheterization, issues such as hospital resources and patient insurance coverage are associated with the timeliness of treatment.11 However, the same study showed that even when controlling for age, sex, hospital characteristics, insurance status, and other factors, minority patients still had longer door-to-balloon times than white patients (Chart 6-11).
Effectiveness
Minorities in general lag behind the white population in screening rates for illnesses that are preventable or that may benefit from early diagnosis. This issue is particularly problematic for Hispanics. For instance, Hispanics are less likely to have had blood cholesterol (Chart 6-12) and colorectal cancer screenings (Chart 6-13) than the other races and ethnicities examined. Hispanic women also have lower rates of mammograms (Chart 6-14) and pap smears (Chart 6-13) than non-Hispanic white and black women. Elderly Hispanic adults are least likely to have had a
pneumococcal vaccine (Chart 6-15) and Hispanic children are least likely to have had dental visits (Chart 6-16) among all other races and ethnicities examined.
Despite higher income and higher rates of insurance, Asians have low rates for preventive care, such as mammograms12 (Chart 6-14) and pneumococcal vaccinations (Chart 6-15). Of note, while black women have generally lower income and coverage rates than other groups, they actually have high rates of screening for breast and cervical cancer (Chart 6-13 and Chart 6-14). Targeted programs like the Centers for Disease Control and Prevention’s National Breast and Cervical Cancer Early Detection Program may increase preventive care for populations that otherwise may not receive care due to low income and low rates of insurance.
American Indian/Alaska Native women are the least likely of all races and ethnicities examined to have had prenatal care in their first trimester, despite a federal program dedicated to providing health services for AmericanIndians and Alaska Natives13 (Chart 6-17). Hispanicsand blacks also lag significantly behind whites in rates of prenatal care. Lack of this care is linked to higher occurrences of low birthweight births and infant mortality (see Chapter 3).
Although the percentage difference in receipt of many of these preventive services is small, such differencesare significant over large populations and equateto thousands or even millions of minorities who arenot receiving essential screenings and vaccinations.

64
THECOMMONWEALTH
FUND
In addition to lower rates of preventive care, racial and ethnic minorities are also less likely to receive appropriate treatment for some conditions, in a variety of settings. For example, Hispanic and non-Hispanic black patients with significant depression are less likely than whites to have received outpatient treatment for depression (Chart 6-18). Minorities are also less likely than whites to receive all recommended inpatient hospital care for pneumonia and heart failure (Chart 6-19 and Chart 6-20). These data are particularly notable because they show that while the quality of this care has improved for all groups in recent years, the disparities between all groups have persisted.
Efficiency
Avoidable hospital and emergency room care may represent problems in prevention and access. It also represents waste. It is less expensive to provide primary care than emergency care, and it is certainly much less expensive to prevent hospitalization altogether.14 Blacks are more likely than whites to go to the emergency room for conditions that could have been treated by a primary care provider (Chart 6-21). Minorities are also more likely to be hospitalized for conditions that can often be managed effectively on an outpatient basis (also knownas ambulatory care sensitive conditions). For instance, blacks are more likely than whites to be hospitalized for congestive heart failure, and blacks and Hispanics are more likely than whites to be hospitalized for diabetesand pediatric asthma (Chart 6-22).
Blacks also have higher rates of admission to the intensive care unit in their last months of life, which may result from patient and family choice or from cultural differences,15 but may also show a lack of awareness regarding options for end-of-life care (Chart 6-23). In this case, blacks may be receiving larger amounts of costly but futile care. In addition, blacks are less likely than whites to receive hospice care consistent with their wishes (Chart 6-27).
Patient-Centeredness
Patient-centered care requires effective communication between provider and patient. Hispanics and Asians report more difficulty communicating with their doctors than both whites and blacks (Chart 6-24). Nearly twice as many Hispanics had questions they did not ask at their last doctor visit than whites (Chart 6-25). Adults whose primary language is not English are more likely to report that their providers sometimes or never listened carefully, explained things clearly, respected what they said, and spent enough time with them (Chart 6-26). This is true even for the non-Hispanic white population. The disparity is greater for the Asian population than for the Hispanic population, perhaps because of the greater availability of language services in health care facilities for Spanish-speaking patients.16
Similarly, Asian or Pacific Islander hospice patients are least likely to receive end-of-life care consistent with their wishes (Chart 6-27). This may be due to language or cultural barriers.

65
THECOMMONWEALTH
FUND
Besides language factors, distrust of the medical community may also prevent the delivery of truly patient-centered care. Black and Hispanic patients reported lower confidence and less trust in their specialist than white patients (Chart 6-28).
Notes
1. Institute of Medicine, Committee on Quality of Health Care inAmerica, Crossing the Quality Chasm: A New Health System for the 21st Century (Washington, D.C.: National Academies Press, 2001).
2. We do not specifically address the domain of equity again in the quality section because all of the disparities we address in this section show inequity in health care quality.
3. K. A. Schulman et al., “The Effect of Race and Sex on Physicians’ Recommendations for Cardiac Catheterization,” New England Journal of Medicine, Feb. 25, 1999 340(8):618–26.
4. P. B. Bach et al., “Primary Care Physicians Who Treat Blacksand Whites,” New England Journal of Medicine, Aug. 5, 2004 351(6):575–84.
5. J. Skinner et al., “Mortality After Acute Myocardial Infarction in Hospitals that Disproportionately Treat Black Patients,” Circulation, Oct. 25, 2005 112(17):2634–41.
6. The state quality ranking for this chart is based on the average of the 24 quality indicators tracked and analyzed by the Medicare Quality Improvement Organization Program; S. F. Jencks et al., “Change in the Quality of Care Delivered to Medicare Beneficiaries, 1998–1999 to 2000–2001,” Journal of the American Medical Association, Jan. 15, 2003 289(3):305–12.
7. Agency for Healthcare Research and Quality, National Healthcare Disparities Report, 2006.
8. A. Donovan et al., “Two-Year Trends in the Use of Seclusion and Restraint Among Psychiatrically Hospitalized Youths,” Psychiatric Services, July 2003 54(7):987–93.
9. This is likely the result of lower access to health care among minorities. See Chapter 3.
10. Door-to-balloon time is the time from hospital arrival to first treatment of the clogged artery with balloon therapy.
11. E. Bradley et al., “Racial and Ethnic Differences in Time to Acute Reperfusion Therapy for Patients Hospitalized with Myocardial Infarction,” Journal of the American Medical Association, Oct. 6, 2004 292(13):1563–72.
12. See Chart 2-4, Chart 5-1, and Chart 5-2.
13. Indian Health Service, http://www.ihs.gov.
14. “Non-HMO plans spend an average of US$206 per physician visit, US$795 per emergency room visit, and US$5285 per hospital admission plus US$576 per night in the hospital.” D. Polsky and S. Nicholson, “Why Are Managed Care Plans Less Expensive: Risk Selection, Utilization, or Reimbursement?” Journal of Risk & Insurance, Mar. 2004 71(1):21–40.
15. H. R. Searight and J. Gafford, “Cultural Diversity at the End of Life: Issues and Guidelines for Family Physicians,” American Family Physician, Feb. 1, 2005 71(3):515–22.
16. Spanish is by far most common foreign language spoken in theUnited States. National Health Law Program. Language ServicesAction Kit 35. 2004. Available at http://www.commonwealthfund.org/usr_doc/LEP_actionkit_0204.pdf?section=4057.

66
THECOMMONWEALTH
FUND
Chart 6-1. Primary care physicians visited chiefly by black patients were more likely to report they were unable to provide high-quality
care to all their patients than those visited primarily by white patients.
1928
0
20
40
60
80
100
Physicians visited primarily bywhite patients
Physicians visited primarily byblack patients
Note: Data are from a survey of physicians visited by Medicare patients.Source: P. B. Bach et al., “Primary Care Physicians Who Treat Blacks and Whites,”New England Journal of Medicine, Aug. 5, 2004 351(6):575–84.
Percentage of physicians reporting that they were not ableto provide high-quality care to all of their patients, 2000–2001

67
THECOMMONWEALTH
FUND
15 1820 24
0
20
40
60
80
100
Hospitals with no black AMIadmissions
Hospitals with 33.6% blackAMI admissions
30-day mortality 90-day mortality
Chart 6-2. Mortality after heart attacks is higher inhospitals with more admissions of black patients than in
those with no admissions of blacks.
Note: Adjusted for income, hospital ownership status, hospital volume, census region, urban status, and hospital surgical treatment intensity. Source: J. Skinner et al., “Mortality After Acute Myocardial Infarction in Hospitals that Disproportionately Treat Black Patients,” Circulation, Oct. 25, 2005 112(17):2634–41.
Percentage of Medicare patients with risk-adjusted mortalityafter acute myocardial infarction (AMI), 2002 and 2003

68
THECOMMONWEALTH
FUND
Chart 6-3. States with the largest percentage of white residentshave the highest Medicare quality rankings.
0
20
40
60
80
100
NH VT ME ND UT IA CO WI CT MN OR NE FL AL NJ CA OK IL GA AR TX MS LA PR
1 2 3 4 5 6 7 8 9 10 11 12 41 42 43 44 45 46 47 48 49 50 51 52
Note: Medicare rankings are shown for the top 12 and the bottom 12 states only.Sources: S. F. Jencks et al., “Change in the Quality of Care Delivered to Medicare Beneficiaries,1998–1999 to 2000–2001,” Journal of the American Medical Association, Jan. 15, 2003 289(3):305–12; United States Census Bureau, Census 2000.
Percentage of population that is non-Hispanic white according to2000 census by Medicare Quality Ranking for 2000–2001

69
THECOMMONWEALTH
FUND
134 133 133 140155
0
40
80
120
160
200
Total White, non-Hispanic
Black, non-Hispanic
Hispanic Asian/PacificIslander
Chart 6-4. Safety: Asians/Pacific Islanders and Hispanicsare more likely to die from complications in hospital care
than whites and blacks.
Note: Complications of care include postoperative pneumonia, urinary tract infection, and blood clot in the leg. Note: Estimates are adjusted by age, gender, age–gender interactions, comorbidities, and DRG clusters. Source: Agency for Healthcare Research and Quality. National Healthcare Disparities Report. 2006.
Deaths per 1,000 discharges with complicationsof care in hospitalization, 2003

70
THECOMMONWEALTH
FUNDNote: Estimates are adjusted by age, gender, age–gender interactions, comorbidities, and DRG clusters. Source: Agency for Healthcare Research and Quality. National Healthcare Disparities Report. 2006.
Chart 6-5. Safety: Blacks are more likely to sufferpostoperative complications than other racial/ethnic groups.
9.1
13.3
8.27.2
8.7
02468
101214
Total White, non-Hispanic
Black, non-Hispanic
Hispanic Asian/PacificIslander
Rate of postoperative pulmonary embolus or deep vein thrombosis per 1,000 surgical discharges, 2003

71
THECOMMONWEALTH
FUND
1.0
2.01.7
0.0
1.0
2.0
3.0
4.0
5.0
White Black Hispanic
Note: p<.05 for Black and Hispanic odds ratios.Note: Data are adjusted for age, sex, admission status, and year.Source: A. Donovan et al., “Two-Year Trends in the Use of Seclusion and Restraint Among Psychiatrically Hospitalized Youths,” Psychiatric Services, July 2003 54(7):987–93.
Chart 6-6. Safety: Black and Hispanic youthsare more likely to be restrained upon admission
to a psychiatric hospital than white youths.
Likelihood of youths ages 5 to 18 being restrained uponadmission to psychiatric hospital (odds ratio), 2000–2001
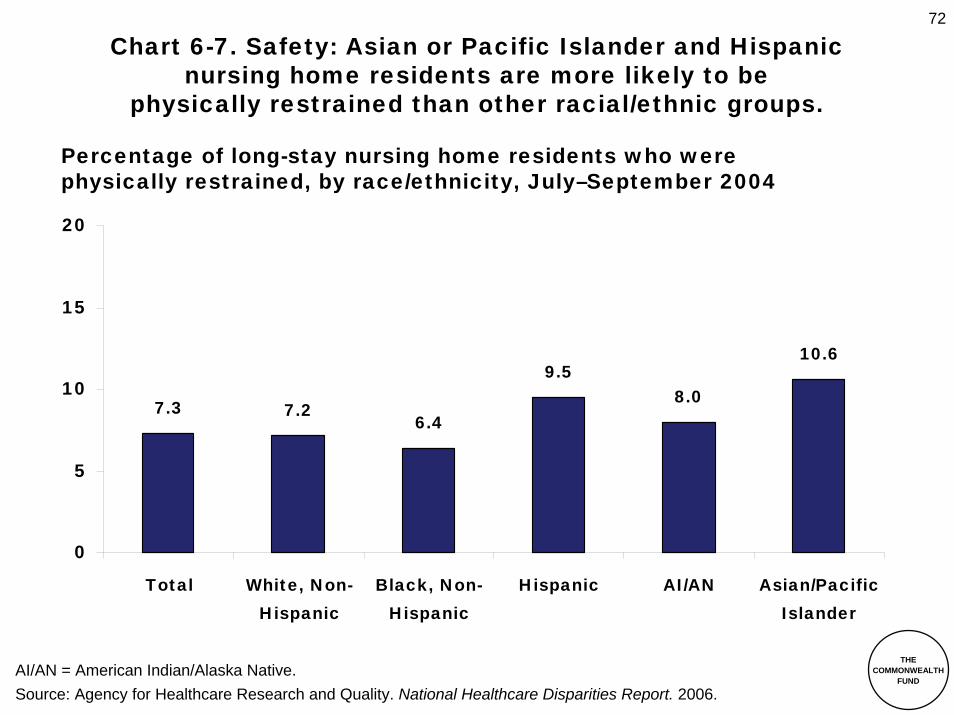
72
THECOMMONWEALTH
FUNDAI/AN = American Indian/Alaska Native.Source: Agency for Healthcare Research and Quality. National Healthcare Disparities Report. 2006.
Chart 6-7. Safety: Asian or Pacific Islander and Hispanicnursing home residents are more likely to be
physically restrained than other racial/ethnic groups.
Percentage of long-stay nursing home residents who werephysically restrained, by race/ethnicity, July–September 2004
7.3 7.26.4
9.58.0
10.6
0
5
10
15
20
Total White, Non-Hispanic
Black, Non-Hispanic
Hispanic AI/AN Asian/PacificIslander
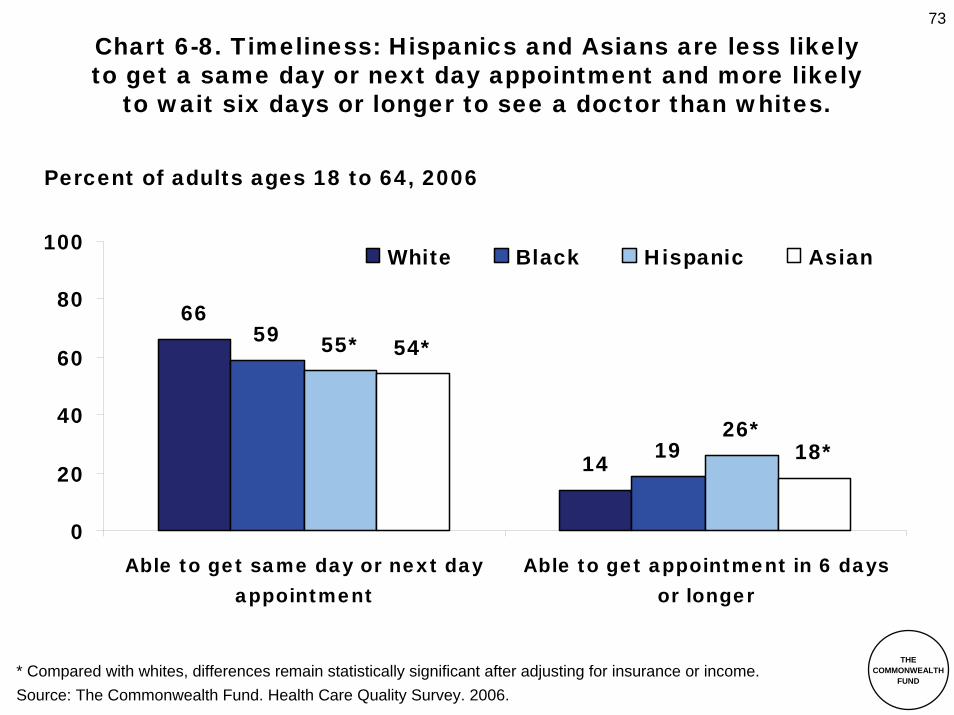
73
THECOMMONWEALTH
FUND
66
14
59
1926*
55*
18*
54*
0
20
40
60
80
100
Able to get same day or next dayappointment
Able to get appointment in 6 daysor longer
White Black Hispanic Asian
Chart 6-8. Timeliness: Hispanics and Asians are less likelyto get a same day or next day appointment and more likely
to wait six days or longer to see a doctor than whites.
* Compared with whites, differences remain statistically significant after adjusting for insurance or income.Source: The Commonwealth Fund. Health Care Quality Survey. 2006.
Percent of adults ages 18 to 64, 2006

74
THECOMMONWEALTH
FUND
2.52.7
2.02.1
1.61.41.41.0
0.0
1.0
2.0
3.0
4.0
5.0
1997-1998 1999-2000 2001-2002 2003-2004
Black
White
Chart 6-9. Timeliness: Blacks are more likely than whitesto leave the emergency department without being seen.
Source: Agency for Healthcare Research and Quality. National Healthcare Disparities Report. 2006.
Percent of emergency department visits in whichthe patient left without being seen, 1997–2004

75
THECOMMONWEALTH
FUND
303
369 360342
308304 302284
340 332311
284292269
314
266
0
50
100
150
200
250
300
350
400
Less than $25,000 $25,000-$34,999 $35,000-$44,999 $45,000 or more
White, non-Hispanic Black or African American, non-Hispanic Hispanic Asian/Pacific Islander
Chart 6-10. Timeliness: Blacks are more likely than whitesto suffer a perforated appendix, a condition brought on by
delayed treatment, regardless of neighborhood income status.
Note: Estimates are adjusted by age and gender to the 2000 U.S. standard population.Source: Agency for Healthcare Research and Quality. National Healthcare Disparities Report. 2006.
Perforated appendix rate per 1,000 admissions with appendicitis by median income of patient’s zip code, 2003

76
THECOMMONWEALTH
FUND
103106
122
114115
109
106 107106 106
90
95
100
105
110
115
120
125
Mean time Adjusted mean time
White Black Hispanic American Indian Asian
Note: Second group is adjusted for age, sex, insurance status, clinical characteristics, time since symptom onset, time of hospital arrival, prehospital electrocardiogram performed, and hospital characteristics. Source: E. Bradley et al., “Racial and Ethnic Differences in Time to Acute Reperfusion Therapy for Patients Hospitalized with Myocardial Infarction,” Journal of the American Medical Association, Oct. 6, 2004 292(13):1563–72.
Chart 6-11. Timeliness: Blacks with myocardial infarctionsexperience longer door-to-balloon times than all other groups.
Door-to-balloon time in minutes formyocardial infarction patients, 1999–2002

77
THECOMMONWEALTH
FUND
73 73 7568 68
76
0
20
40
60
80
100
Total White, non-Hispanic
Black, non-Hispanic
Hispanic AI/AN Asian
Chart 6-12. Effectiveness: Hispanics and American Indians/Alaska Natives are less likely to have had a blood cholesterol
screening in the past five years than whites, blacks, and Asians.
AI/AN = American Indian/Alaska Native.Note: Estimates are age adjusted to the 2000 U.S. standard population. Source: Agency for Healthcare Research and Quality. National Healthcare Disparities Report. 2005.
Percentage of adults age 18 and over who had their blood cholesterol checked within the preceding five years, 2003

78
THECOMMONWEALTH
FUND
44
80
39
83
30
75
0
20
40
60
80
100
Colorectal cancer screening inadults ≥ age 50
Pap smear in women ≥ age 18
White, non-Hispanic Black, non-Hispanic Hispanic
Source: H. L. Howe et al., “Annual Report to the Nation on the Status of Cancer, 1975–2003, Featuring Cancer Among U.S. Hispanic/Latino Populations,” Cancer, Oct. 15, 2006 107(8):1711–42.
Chart 6-13. Effectiveness: Hispanics are less likely to receive colorectal and cervical cancer screenings than non-Hispanics.
Percentage of adults who received screeningfor colorectal and cervical cancers, 2003

79
THECOMMONWEALTH
FUND
70 70 70 6558
0
20
40
60
80
100
Total White, non-Hispanic
Black, non-Hispanic
Hispanic Asian
Chart 6-14. Effectiveness: Hispanic and Asian women areless likely to report they have had a mammogram within
the past two years than white and black women.
Note: Estimates are age adjusted to the 2000 U.S. standard population. Source: Agency for Healthcare Research and Quality. National Healthcare Disparities Report. 2006.
Percent of women age 40 and over who report theyhad a mammogram within the past two years, 2003

80
THECOMMONWEALTH
FUND
57 61
39 34 35
0
20
40
60
80
100
Total White, non-Hispanic
Black, non-Hispanic
Hispanic Asian
Chart 6-15. Effectiveness: Minorities are less likely to haveever received a pneumococcal vaccination than whites.
Note: Estimates are age adjusted to the 2000 U.S. standard population. Source: Agency for Healthcare Research and Quality. National Healthcare Disparities Report. 2006.
Percentage of adults age 65 and over who haveever had a pneumococcal vaccination, 2004

81
THECOMMONWEALTH
FUND
4958
37 34
4539
0
20
40
60
80
100
Total White, non-Hispanic
Black, non-Hispanic
Hispanic AI/AN Asian
Chart 6-16. Effectiveness: Minority children, especially Hispanics,are less likely to have had a dental visit in the past year than whites.
Percentage of children ages 2 to 17 whohad a dental visit in the past year, 2002
AI/AN = American Indian/Alaska Native.Note: Because AI/ANs sampled in the Medical Expenditure Panel Survey (the data source for this chart) are largely nonreservation, urban AI/ANs, the dental care data may not be representative of all AI/ANs in the United States.Source: Agency for Healthcare Research and Quality. National Healthcare Disparities Report. 2005.

82
THECOMMONWEALTH
FUND
84 89
76 7871
85
0
20
40
60
80
100
Total White, non-Hispanic
Black, non-Hispanic
Hispanic AI/AN Asian/PacificIslander
Chart 6-17. Effectiveness: Minority women are less likelythan white women to have received prenatal care
in the first trimester of pregnancy.
AI/AN = American Indian/Alaska Native.Note: Reference population includes women of all ages with live births.Source: Agency for Healthcare Research and Quality. National Healthcare Disparities Report. 2006.
Percentage of mothers with prenatal care in first trimester, 2003

83
THECOMMONWEALTH
FUND
65 6760 58
0
20
40
60
80
100
Total White, non-Hispanic
Black, non-Hispanic
Hispanic
Chart 6-18. Effectiveness: Minorities with depression areless likely than whites to receive treatment for their condition.
Note: Major depressive episode is defined as a period of at least two weeks when a person experienced a depressed mood or loss of interest or pleasure in daily activities and had a majority of the symptoms for depression.Source: Agency for Healthcare Research and Quality. National Healthcare Disparities Report. 2006.
Percentage of adults age 18 and over with a major depressive episode in the past year who received treatment for depression in the past year, 2004

84
THECOMMONWEALTH
FUND
Chart 6-19. Effectiveness: Among Medicare patients, Hispanics are least likely to receive all recommended hospital care for pneumonia.
Note: Recommended hospital care for pneumonia includes having blood cultures collected before the administration of the first antibiotics dose, receiving the first dose of antibiotic within 4 hours of arrival at the hospital, receiving the recommended empirical antibiotic regimen that is consistent with current guidelines, screening for influenza vaccine statuses and vaccinating prior to discharge for patients age 50 and over discharged during the winter, and screening for pneumococcal vaccine statuses and vaccinating prior to discharge for patients age 65 and over.Source: Agency for Healthcare Research and Quality. National Healthcare Disparities Report. 2006.
Percentage of Medicare patients with pneumonia who receivedall recommended hospital care, 2002 and 2004
54 5548 45
55 5664 66
58 5463 61
0
20
40
60
80
100
Total White Black Hispanic NativeAmerican
Asian
2002 2004

85
THECOMMONWEALTH
FUND
Chart 6-20. Effectiveness: Among Medicare patients, Hispanicsand Native Americans are less likely to receive all recommended
care for heart failure than whites, blacks, and Asians.
Note: Recommended hospital care for heart failure includes receiving evaluation of left ventricular ejection fraction, and prescription of an angiotensin-converting enzyme (ACE) inhibitor at discharge for patients with left ventricular systolic dysfunction.Source: Agency for Healthcare Research and Quality. National Healthcare Disparities Report. 2006.
73 73 7569 69
7678 78 78 73 7279
0
20
40
60
80
100
Total White Black Hispanic NativeAmerican
Asian
2002 2004
Percentage of Medicare patients with heart failure who receivedall recommended hospital care, 2002 and 2004

86
THECOMMONWEALTH
FUND
23 20
35
17
0
20
40
60
80
100
Total White Black Hispanic
Chart 6-21. Efficiency: Blacks are more likely than whites orHispanics to visit the emergency department for conditions
that could have been treated by a primary care provider.
Note: Controlled for insurance coverage and poverty status.Source: The Commonwealth Fund. Biennial Health Insurance Survey. 2005.
Percentage of adults ages 19 to 64 who report using emergency room for conditions that could have been treated by primary care provider, 2005
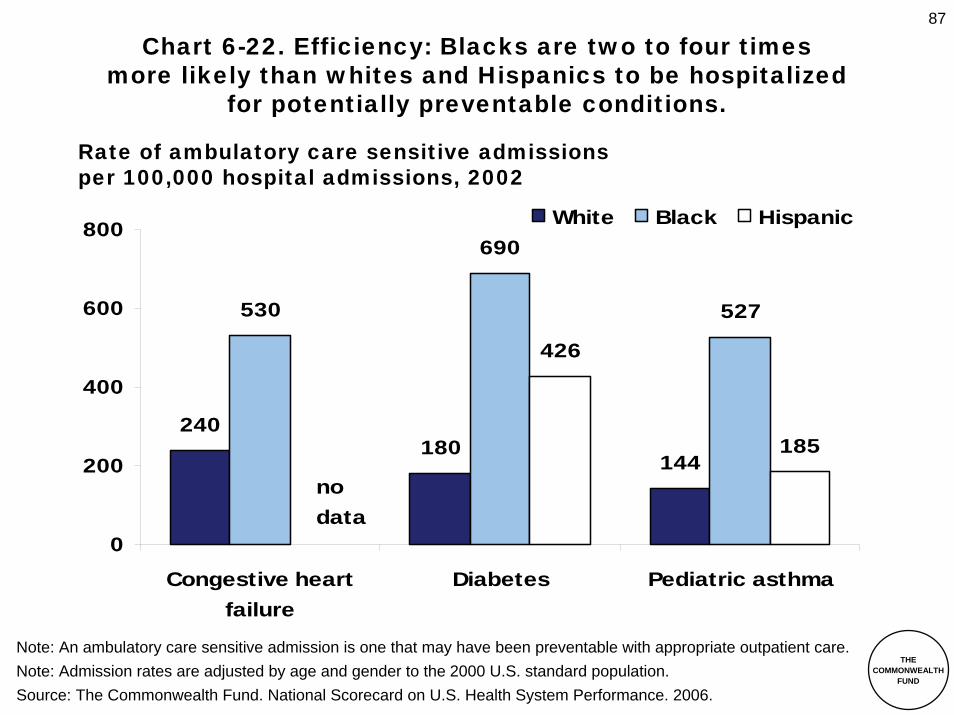
87
THECOMMONWEALTH
FUND
240180
144
530
690
527
426
185
0
200
400
600
800
Congestive heartfailure
Diabetes Pediatric asthma
White Black Hispanic
no data
Chart 6-22. Efficiency: Blacks are two to four timesmore likely than whites and Hispanics to be hospitalized
for potentially preventable conditions.
Rate of ambulatory care sensitive admissionsper 100,000 hospital admissions, 2002
Note: An ambulatory care sensitive admission is one that may have been preventable with appropriate outpatient care.Note: Admission rates are adjusted by age and gender to the 2000 U.S. standard population. Source: The Commonwealth Fund. National Scorecard on U.S. Health System Performance. 2006.

88
THECOMMONWEALTH
FUND
3.7 4.1
0.0
5.0
10.0
White Black
Chart 6-23. Efficiency: Blacks with Medicare receivemore end-of-life care than whites with Medicare.
Note: Data are age adjusted and correlations are weighted by the size of the black population.Source: K. Baicker et al., “Who You Are and Where You Live: How Race and Geography Affect the Treatment of Medicare Beneficiaries,” Health Affairs Web Exclusive (Oct. 7, 2004):var33–var44.
Percentage of Medicare beneficiaries admitted tointensive care unit in last six months of life, 1998–2001

89
THECOMMONWEALTH
FUND
66 68 6857
49
66 6961
5648
0
20
40
60
80
100
Total White Black Hispanic Asian
Felt Doctor Listened to Them Understood Everything Doctor Said
Note: Population includes adults with health care visits in the past two years.Source: The Commonwealth Fund. Health Care Quality Survey. 2001.
Chart 6-24. Patient-centeredness: Asians and Hispanics areless likely to understand their doctor and less likely to
feel their doctor listened to them than blacks and whites.
Percentage of adults ages 18 to 64 reportingease of communication during doctor visits, 2001

90
THECOMMONWEALTH
FUND
12 10 1319
14
0
20
40
60
80
100
Total White Black Hispanic Asian
Chart 6-25. Patient-centeredness: Hispanics are twice as likelyas whites to leave the doctor’s office with unasked questions.
Percentage of adults ages 18 to 64 reporting they had questionsthat they did not ask on last visit to doctor, 2001
Note: Population includes adults with health care visits in the past two years.Source: The Commonwealth Fund. Health Care Quality Survey. 2001.

91
THECOMMONWEALTH
FUND
9.3 8.9 11 12 8.3 9.016 12 16 18
0
20
40
60
80
100
Total White, non-Hispanic
Black, non-Hispanic
Hispanic AI/AN Asian
English OtherPreferred language
no data
no data
AI/AN = American Indian/Alaska Native.Note: Percentages are adjusted for nonresponse based on how many of the four questions had a response.Source: Agency for Healthcare Research and Quality. National Healthcare Disparities Report. 2006.
Chart 6-26. Patient-centeredness: Adults whose preferred languageis not English are more likely than English-speaking adults
to report dissatisfaction with their health care provider.
Percentage of adults age 18 and over who report their health providers sometimes or never listened carefully, explained things clearly,respected what they had to say, and spent enough time with them, 2003

92
THECOMMONWEALTH
FUND
Chart 6-27. Patient-centeredness: Asian or Pacific Islanderhospice patients are least likely to receive end-of-life care
consistent with their wishes.
94.5 95.289.1 88.3 90.7
81.8
0
20
40
60
80
100
Total White, Non-Hispanic
Black, Non-Hispanic
Hispanic AI/AN Asian/PacificIslander
Percentage of hospice patients who received careconsistent with their wishes, 2005
AI/AN = American Indian/Alaska Native.Source: Agency for Healthcare Research and Quality. National Healthcare Disparities Report. 2006.

93
THECOMMONWEALTH
FUND
79 81
6372
0
20
40
60
80
100
Total White Black Hispanic
Chart 6-28. Patient-centeredness: Blacks and Hispanicsare less likely to report confidence and trust
in their specialty physician than whites.
Note: p=.005. Source: N. L. Keating et al., “Patient Characteristics and Experiences Associated with Trust in Specialist Physicians,” Archives of Internal Medicine, May 10, 2004 164(9):1015–20.
Percentage of patients reporting that they completely trustedtheir specialist physician, 1999–2000

94
THECOMMONWEALTH
FUND
Chapter 7. Strategies for Closing the Gap
The prevalence and persistence of health and health care disparities can seem daunting. Yet there is a new and emerging body of knowledge centered on possible strategies and interventions that may be able to lessen and perhaps even eliminate these differences.
The choice of interventions is not inconsequential; it is largely determined by assumptions about the etiology of a given disparity or the assumed nature of the difference. Some disparities may be driven, for example, by gaps in access and insurance coverage, and the appropriate strategy will entail directly addressing these shortcomings. An observed disparity in care for a specific population group at a given site may instead be addressed with a highly targeted intervention, such as culturally competent educational materials or enhanced interpreter services. Alternatively, disparities in quality of care by a provider may be addressed by promoting maximal adherence to certain guidelines, seeking to ensure that all patients receive evidence-based care for their condition; such an approach may rely on established quality improvement (QI) techniques. Disparities that are embedded in regional or inter-institutional variation in quality may be prime candidates for an approach that seeks to raise quality for all patients in a community or even a state.
Given this complexity and the paucity of systematic reviews documenting such solutions, the information presented in this chapter is designed more to highlight
potentially successful strategies identified in the literature than to present “proven” interventions.
Disparities are complicated phenomena and we may never know exactly how they arise. Given the many factors that can underlie such differences, it may be difficult or impossible to pinpoint what precise intervention or trend led to their reduction. Here we show a variety of public health and health system changes that may be linked to closing these gaps.
The Evidence
An emphasis on improving public health services such as childhood immunization appears to play a role in lessening disparities. As seen in Chart 7-1, disparities between racial and ethnic groups for the recommended childhood vaccine series declined from 2002 to 2005, as immunization rates rose for the general population. It may be more difficult to identify the precise strategies that helped to especially eliminate these differences, but efforts such as the Vaccines for Children Program (which provides free vaccines to doctors who serve eligible children),1 improved education of parents, school policies, and better adherence to guidelines by providers may all have played a role.
Access to a high-quality system of health care mayalso reduce disparities. Many researchers and policymakers have speculated that the Department

95
THECOMMONWEALTH
FUND
of Veterans Affairs (VA) system serves as a model of a health care delivery and finance system with equitable treatment for all patients regardless of race or ethnicity. While disparities in blood pressure control between whites and blacks cared for in VA hospitals exist, they are considerably narrower than those found outside the VA (Chart 7-2). This may be in part due to the coverage of prescription drugs (with cost sharing) available to veterans under CHAMPVA.2
Access to a usual source of care also appears to help reduce disparities. Having a regular doctor appears to have a marked effect on increasing the likelihood that individuals will receive certain preventive services, such as a blood pressure check or cholesterol screening (Chart 7-3). It also is correlated with dramatically reduced disparities between whites, blacks, and Hispanics for this measure. Regardless of income or insurance status, individuals who report a regular source of care are more likely to receive these services. Hence, having a usual source of accessible, convenient care may have a marked impact on disparities in care received.
This relationship is reinforced by recent research emphasizing the importance of having a “medical home.” The concept medical home includes not only having a regular provider or place of care, but also reporting no difficulty contacting the provider by phone, or getting advice and medical care on weekends or evenings, and always or often finding office visits well organized and running on time.3 When adults have such a medical home, the percentage of patients who receive needed medical care
increases across all groups and racial and ethnic disparities are virtually eliminated (Chart 7-4). When minorities have medical homes, they are also just as likely as majority groups to receive reminders for preventive care visits (Chart 7-5). In this latter case ethnic and racial disparities are seen for patients who report a regular source of care, but not a medical home.
Reminders of preventive care visits are strongly associated with an increase of the percentage of adults getting important preventive services.4
Insurance coverage may also be an important strategyto overcome disparities. Insured immigrant children are much more likely to have well-child visits than uninsured immigrant children. They are also much less likely to use the emergency department (Chart 7-6), which illustratesthe powerful effect that insurance may have on the abilityto access appropriate services. Insurance may also be associated with a lessening of other differences. When insured, minorities are as likely as whites to receive reminders for preventive care visits (Chart 7-7). In the absence of coverage, minorities, especially Hispanics,lag behind whites on this measure. Moreover, while the uninsured are consistently more likely than the insured to forgo physician visits, the differential between Hispanics and all other groups is considerably less for those who have insurance (Chart 7-8). In other words, having insurance seems to particularly lessen the disparities between Hispanics and others for receiving remindersfor preventive visits and seeing a doctor.

96
THECOMMONWEALTH
FUND
Efforts designed to improve the quality of health services may also result in closing these gaps. If every person received the indicated care at the right time, then theoretically differences (and disparities) in their care would not exist. However, a different dynamic might be observed; it is conceivable that QI efforts could lead to faster change for some populations; actually increasing gaps.5 To date there is not enough definitive evidence to conclude which dynamic is more common.
In one major federal QI effort aimed at improving suboptimal quality in hemodialysis care, a focus on quality measurement, provider feedback, and education resultedin significant improvement for all patients. Interestingly, however, it also led to a dramatic drop in black–white disparities over the course of the initiative (Chart 7-9). Similar trends have been observed for health plans. Ascare improved for patients (arguably due to the plans and national quality efforts), the gaps between blacks and whites on many measures, such as beta-blocker use after acute myocardial infarction (heart attack), narrowed (Chart 7-10).
These results tend to support the recent emphasis, best articulated in the Institute of Medicine’s report, Unequal Treatment: Confronting Racial and Ethnic Disparities in Healthcare, on using rigorous application of evidence-based care to reduce disparities.
Some data, on the other hand, show that even though overall quality is improving, racial and ethnic disparities persist6 (Chart 7-11). In the case of heart attack patients, the percentage of those who received recommended hospital
care increased for all races and ethnicities from 2002 to 2004. However, disparities between racial/ethnic groups and whites persisted.
Clearly, much more work needs to be done to identify solutions to disparities. Given the nature of disparities, no single approach will prove to be a panacea. There are many things we do not know about the role of strategies like cultural competence training in reducing disparities, but these solutions will emerge as more of our public health and health care systems confront issues of equity.
Notes
1. R. K. Zimmerman et al., “The Vaccines for Children Program: Policies, Satisfaction, and Vaccine Delivery,” American Journal of Preventive Medicine, Nov. 2001 21(4):243–49.
2. Department of Veterans Affairs, CHAMPVA Handbook, Nov. 2006.
3. A. C. Beal, M. M. Doty, S. E. Hernandez, K. K. Shea, and K. Davis, Closing the Divide: How Medical Homes Promote Equity in Health Care: Results From The Commonwealth Fund 2006 Health Care Quality Survey (New York: The Commonwealth Fund, June 2007).
4. Ibid.
5. A. N. Trivedi et al., “Trends in the Quality of Care and Racial Disparities in Medicare Managed Care,” New England Journal of Medicine, Aug. 18, 2005 353(7):692–700.
6. G. C. Fonarow et al., “Association Between Performance Measures and Clinical Outcomes for Patients Hospitalized with Heart Failure,” Journal of the American Medical Association, Jan. 3, 2007297(1):61–70; B. E. Landon et al., “Improving the Managementof Chronic Disease at Community Health Centers,” NewEngland Journal of Medicine, Mar. 1, 2007 356(9):921–34.

97
THECOMMONWEALTH
FUND
6674
6268
76
667174 76 7677
71 7676 7780
0
20
40
60
80
100
2002 2003 2004 2005
White, non-Hispanic Black, non-Hispanic Hispanic Asian
Chart 7-1. Racial and ethnic disparities in childhoodimmunization rates have declined as overall coverage increased.
Percentage of children ages 19 to 35 months who receivedcomplete 4:3:1:3:3:1 vaccine series, 2002–2005
Note: The 4:3:1:3:3:1 vaccine series includes four or more doses of diphtheria, tetanus toxoids, and pertussis vaccine (DTP), three or more doses of poliovirus vaccine, one or more doses of any measles-containing vaccine (MCV), three or more doses of Haemophilus influenzae type b vaccine (Hib), three or more doses of hepatitis B vaccine (HepB), and one or more doses of varicella vaccine.Source: Centers for Disease Control and Prevention. National Immunization Surveys. 2002–2005.

98
THECOMMONWEALTH
FUND
56 5449
44
0
20
40
60
80
100
VA non-VA
White Black
Chart 7-2. Disparities in blood pressure control are smaller atVeterans Administration hospitals compared with other hospitals.
Note: Blood pressure control means control to below 140/90 mm Hg.Source: S. U. Rehman et al., “Ethnic Differences in Blood Pressure Control Among Men at Veterans Affairs Clinics and Other Health Care Sites,” Archives of Internal Medicine, May 9, 2005 165(9):1041–47.
Percentage of male patients with blood pressure under controlat VA and non-VA hospitals, 2001–2003

99
THECOMMONWEALTH
FUND
Chart 7-3. Preventive care screening rates are higher forall adults with a regular doctor; disparities in screenings
narrow for Hispanics with a regular doctor.
Blood Pressure Check in Past Year
73
49
76
52
79
57
0
20
40
60
80
100
Regular Doctor No Regular Doctor
White Black Hispanic
Cholesterol Check in Past Five Years
92
78
9689
70
87*
0
20
40
60
80
100
Regular Doctor No Regular Doctor
White Black Hispanic
Percentage of adults ages 19 to 64 who reported receiving preventive care screening in past five years, 2005
* Compared with whites, differences are statistically significant after controlling forpoverty status and insurance at p<.05.Source: The Commonwealth Fund. Biennial Health Insurance Survey. 2005.

100
THECOMMONWEALTH
FUND
Chart 7-4. Racial and ethnic differences in getting neededmedical care are minimal for adults with medical homes;
disparities decline substantially compared with adults withno regular source of care.
Percentage of adults ages 18 to 64 reportingalways getting care they need when they need it
Note: Having a medical home includes having a regular provider or place of care, reporting no difficulty contacting provider by phone, or getting advice and medical care on weekends or evenings, and always or often finding office visits well organized and running on time.Source: The Commonwealth Fund. Health Care Quality Survey. 2006.
74767474
50525352
343138 44
0
20
40
60
80
100
Total White Black Hispanic
Medical home
Regular source of care, not a medical home
No regular source of care/ER

101
THECOMMONWEALTH
FUND
Chart 7-5. Minorities with medical homes are just as likelyas whites to receive reminders for preventive care visits.
Percentage of adults ages 18 to 64 receiving a reminderto schedule a preventive visit by doctor’s office
Note: Having a medical home includes having a regular provider or place of care, reporting no difficulty contacting provider by phone, or getting advice and medical care on weekends or evenings, and always or often finding officevisits well organized and running on time.Source: The Commonwealth Fund. Health Care Quality Survey. 2006.
64646665
49485452
22 23 25 21
0
20
40
60
80
100
Total White Black Hispanic
Medical homeRegular source of care, not a medical homeNo regular source of care/ER

102
THECOMMONWEALTH
FUND
52
1.0
30
4.0
0
20
40
60
80
100
Had well-child visit in past year Had two or more ER visits in pastyear
Insured Immigrant Uninsured Immigrant
Chart 7-6. Insured immigrant citizen children are more likelyto receive well-child visits and less likely to have
multiple ER visits than uninsured immigrant children.
Note: Federal Poverty Level (FPL) is based on family income and family size and composition. In 2004, FPL was $18,850 for a family of four. Source: Federal Register. 2004;69(30):7336–38. Source: L. Ku. Analyses of the Centers for Disease Control and Prevention, National Center for Health Statistics, 2005 National Health Interview Survey. Center for Budget and Policy Priorities.
Percentage of immigrant children with incomes below 200% FPL who had well-child visit or multiple ER visits in past year, 2005
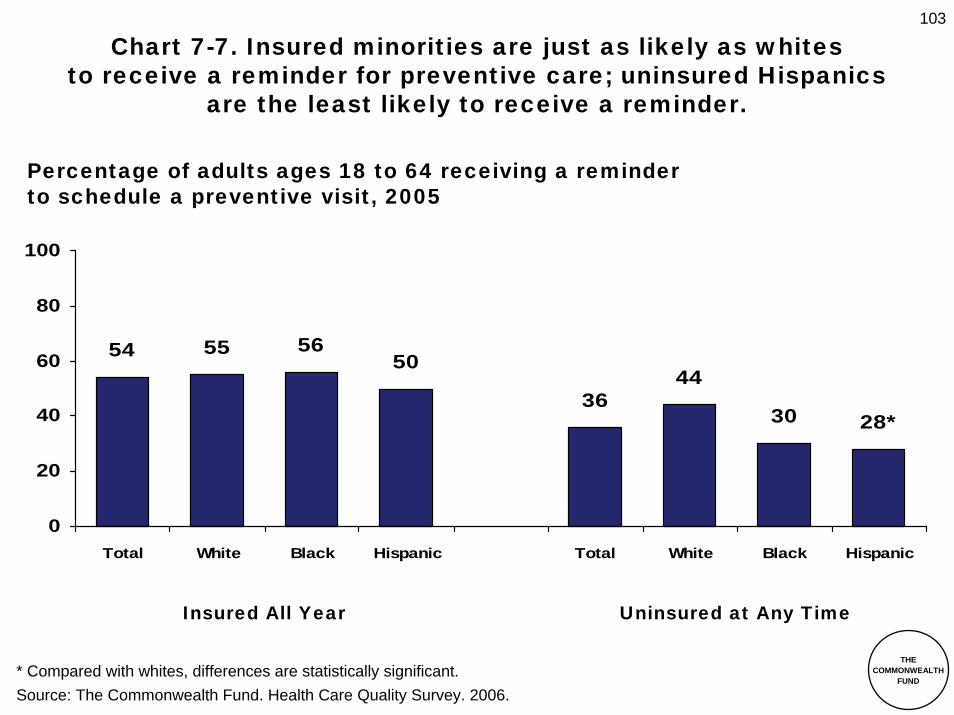
103
THECOMMONWEALTH
FUND
Chart 7-7. Insured minorities are just as likely as whitesto receive a reminder for preventive care; uninsured Hispanics
are the least likely to receive a reminder.
Percentage of adults ages 18 to 64 receiving a reminderto schedule a preventive visit, 2005
* Compared with whites, differences are statistically significant.Source: The Commonwealth Fund. Health Care Quality Survey. 2006.
54 55
3644
28*30
5056
0
20
40
60
80
100
Total White Black Hispanic Total White Black Hispanic
Insured All Year Uninsured at Any Time

104
THECOMMONWEALTH
FUND
17 1727
7.0 7.0 12
0
20
40
60
80
100
White Black Hispanic
Uninsured anytime in past year Insured all year
Chart 7-8. Ethnic disparity in forgoing needed care is substantially lower for insured Hispanics compared with uninsured Hispanics.
Note: Health problems are defined as any chronic condition or disability.Note: Estimates are adjusted percentages based on logistic regression, controlling for poverty status.Source: M. M. Doty and A. L. Holmgren, Health Care Disconnect: Gaps in Coverage and Care forMinority Adults: Findings from The Commonwealth Fund Biennial Health Insurance Survey (2005)(New York: The Commonwealth Fund, Aug. 2006).
Percentage of adults ages 19 to 64 with health problemsand no doctor’s visit in past year, 2005

105
THECOMMONWEALTH
FUND
3643
54
70
85 87767370
6253
46
83 84
6963
0
20
40
60
80
100
1993 1994 1995 1996 1997 1998 1999 2000
WhiteBlack
Chart 7-9. Quality improvement efforts in dialysis careare associated with improved quality overall and
smaller disparities between black and white patients.
Note: p<0.001.Source: A. R. Sehgal, “Impact of Quality Improvement Efforts on Race and Sex Disparities in Hemodialysis,” Journal of the American Medical Association, Feb. 26, 2003 289(8):996–1000.
Percentage of patients age 18 and over receivingadequate hemodialysis dose, 1993–2000

106
THECOMMONWEALTH
FUND
76
94
64
93
0
20
40
60
80
100
1997 2002
White Black
Chart 7-10. Improved quality of heart attack carein Medicare plans is associated with a reduction
in the disparity between black and white patients.
Note: p<0.001.Source: A. N. Trivedi et al., “Trends in the Quality of Care and Racial Disparities in Medicare Managed Care,” New England Journal of Medicine, Aug. 18, 2005 353(7):692–700.
Percentage of eligible enrollees in Medicare managed care plans who received beta blocker prescriptions, 1997 and 2002

107
THECOMMONWEALTH
FUND
81 77 7180 80
86 83 80 86 80
0
20
40
60
80
100
White Black Hispanic NativeAmerican
Asian
2002 2004
Chart 7-11. The percentage of heart attack patients whohave received recommended hospital care has increased;
however, racial and ethnic disparities persist.
Note: Recommended hospital care for AMI includes administrations of aspirin and beta-blocker within 24 hours of hospital arrival and at discharge, receiving a prescription of angiotensin-converting enzyme (ACE) inhibitor at discharge for patients with left ventricular systolic dysfunction, and giving smoking cessation counseling for smoking patients.Source: Agency for Healthcare Research and Quality. National Healthcare Quality Report. 2006.
Percentage of acute myocardial infarction (AMI) patients who received recommended hospital care, Medicare beneficiaries, 2002 and 2004

108
THECOMMONWEALTH
FUND
Chapter 2. The Demographics of America
Chart 2-1: Literature Source: National Center for Health Statistics. Health, United States, 2006: With Chartbook on Trends in the Health of Americans. 2006. Data Source: United States Census Bureau: Monthly post-censal resident populations by age, sex, race, and Hispanic origin. 2004. Available at http://www.census.gov/popest/national/.
Chart 2-2: Data Source: United States Census Bureau. U.S. Interim Projections by Age, Sex, Race and Hispanic Origin. 2004. Available at http://www.census.gov/ipc/www/usinterimproj/.
Chart 2-3: Literature Source: National Center for Health Statistics. Health, United States, 2006: With Chartbook on Trends in the Health of Americans. 2006. Data Sources: C. DeNavas-Walt, B. Proctor,L. C. Hill. Income, poverty, and health insurance coverage in the United States: 2004. United States Census Bureau. Annual Demographic Survey, March Supplement. 2004. Available at: http://pubdb3.census.gov/macro/032005/pov/new01_000.htm Note: Percent of poverty level is based on family income and family size and composition using United States Census Bureau poverty thresholds.
Chart 2-4: Data Source: Census 2000 Summary File 3 (SF3) –Sample Data. Available at http://factfinder.census.gov.
Chart 2-5: Data Source: United States Census Bureau. Current Population Survey, Annual Social and Economic Supplement. 2003.
Chart 2-6: Data Source: United States Census Bureau. Census 2000. Profile of Selected Social Characteristics: 2000 (Table DP-2). Available at http://factfinder.census.gov.
Chart 2-7: Data Source: United States Census Bureau. Census 2000. Census 2000 Summary File 1 (SF1) 100-Percent Data. Available at http://factfinder.census.gov.
Chapter 3. Disparities in Health Status and Mortality
Chart 3-1: Data Source: National Center for Health Statistics.National Health Interview Survey. 2005. Note: Estimates are basedon household interviews of a sample of civilian noninstitutionalized population.
Chart 3-2: Data Source: The Commonwealth Fund. Biennial Health Insurance Survey. 2005.
Chart 3-3: Data Source: The Commonwealth Fund. Biennial Health Insurance Survey. 2005.
Chart 3-4: Literature Source: National Center for Health Statistics. Health, United States, 2006: With Chartbook on Trends in the Healthof Americans. 2006. Data Source: D. L. Hoyert et al., “Deaths: Final Data for 2003,” National Vital Statistics Reports, Apr. 19, 2006:54(13):1–120.
Chart 3-5: Literature Source: T. J. Matthews and M. F. MacDorman, “Infant Mortality Statistics from the 2003 Period Linked Birth/Infant Death Data Set,” National Vital Statistics Reports, May 3, 2006 54(15):1–29.
Chart 3-6: Literature Source: T. J. Matthews and M. F. MacDorman, “Infant Mortality Statistics from the 2003 Period Linked Birth/Infant Death Data Set,” National Vital Statistics Reports, May 3, 2006 54(15):1–29.
Chart 3-7: Data Source: The Commonwealth Fund. Health Care Quality Survey. 2006.
Chart 3-8: Literature Source: National Center for Health Statistics. Health, United States, 2006: With Chartbook on Trends in the Health of Americans. 2006. Data Source: National Center for Health Statistics. National Health Interview Survey. 2005.
Chart Notes
109
THECOMMONWEALTH
FUND
Chart 3-9: Data Source: National Institutes of Health, National DiabetesInformation Clearinghouse. Total Prevalence of Diabetes Among People Aged 20 Years or Older, United States, 2005. Available athttp://diabetes.niddk.nih.gov/dm/pubs/statistics/index.htm#8/.Note: For American Indians/Alaska Natives, the estimate of totalprevalence was calculated using the estimate of diagnosed diabetes from the 2003 outpatient database of the Indian Health Service andthe estimate of undiagnosed diabetes from the 1999–2002 National Health and Nutrition Examination Survey. For the other groups, 1999–2002 NHANES estimates of total prevalence (both diagnosed and undiagnosed) were projected to year 2005.
Chart 3-10: Literature Source: T. Thom et al., “Heart Disease and Stroke Statistics—2006 Update,” Circulation, Feb. 14, 2006 113(6):e85–e151. Data Source: National Health and Nutrition Examination Survey. 1999–2002.
Chart 3-11: Literature Source: National Center for Health Statistics. Health, United States, 2006: With Chartbook on Trends in the Health of Americans. 2006. Data Sources: National Center for Health Statistics, National Vital Statistics System (numerator data from annual mortality files; denominator data from national population estimates for race groups from Table 1 and unpublished Hispanic population estimates for 1985–1996 prepared by the Housing and Household Economic Statistics Division, United States Census Bureau); D. L. Hoyert et al., “Deaths: Final Data for 2003,” National Vital Statistics Reports, Apr. 19, 2006 54(13):1–120.
Chart 3-12: Data Source: National Center for Health Statistics. Health, United States, 2006: With Chartbook on Trends in the Health of Americans. 2006. Note: Estimates are based on 13 Surveillance Epidemiology and End Results (SEER) areas November 2005 submission and differ from published estimates based on 9 SEER areas or other submission dates.
Chart 3-13: Literature Source: National Cancer Institute. Surveillance Epidemiology and End Results (SEER) Cancer Statistics Review, 1975–2003. Available at http://seer.cancer.gov/statistics/. Data Source:
National Center for Health Statistics public use data file for total U.S. Note: Rates age adjusted to the 2000 U.S. Standard Population (19 age groups – Census P25-1130).
Chart 3-14: Literature Source: H. L. Howe et al., “Annual Report to the Nation on the Status of Cancer, 1975–2003, Featuring Cancer Among U.S. Hispanic/Latino Populations,” Cancer, Oct. 15, 2006 107(8):1711–42. Note: The data are from 38 cancer registries (Alabama, Alaska, California, Colorado, Connecticut, Delaware, District of Columbia, Florida, Georgia, Hawaii, Idaho, Illinois, Indiana, Iowa, Kentucky, Louisiana, Maine, Maryland, Massachusetts, Michigan, Minnesota, Missouri, Montana, Nebraska, Nevada, New Hampshire, New Jersey, New York, Oklahoma, Oregon, Pennsylvania, Rhode Island, South Carolina, Texas, Utah, Washington, West Virginia, Wisconsin) covering 82 percent of the United States population, 82 percent of the white, 80 percent of the black, and 92 percent of the Asian/Pacific Islander race groups, and 90 percent of the Hispanic ethnic group (regardless of race).
Chart 3-15: Literature Source: Centers for Disease Control and Prevention. HIV/AIDS Surveillance Report (Table 5a). 2006 17. Data Source: Centers for Disease Control and Prevention. HIV/AIDS Surveillance Report (Table 5a). 2006 17. Note: Estimates do not include U.S. dependencies, possessions, and associated nations, and cases of unknown residence. Figures are point estimates, which result from adjustments of reported case counts.
Chart 3-16: Literature Source: L. Akinbami, National Center for Health Statistics, Asthma Prevalence, Health Care Use and Mortality: United States, 2003–05. Data Source: National Center for Health Statistics, National Health Interview Survey, 2005.
Chart 3-17: Literature Source: L. Akinbami, National Center for Health Statistics, Asthma Prevalence, Health Care Use and Mortality: United States, 2003–05. Data Source: National Center for Health Statistics. Mortality Component of the National Vital Statistics System.
Chart 3-18: Data Source: Centers for Disease Control andPrevention. Behavioral Risk Factor Surveillance System. 2005.

110
THECOMMONWEALTH
FUND
Chapter 4. Disparities in Access to Healthcare
Chart 4-1: Data Source: The Commonwealth Fund. Health Care Quality Survey. 2006.
Chart 4-2: Data Source: The Commonwealth Fund. Health Care Quality Survey. 2006.
Chart 4-3: Data Source: The Commonwealth Fund. Health Care Quality Survey. 2006. Note: Data include adults age 18 to 64.
Chart 4-4: Literature Source: Agency for Healthcare Research and Quality. National Healthcare Disparities Report. 2006. Data Source: Agency for Healthcare Research and Quality, Center for Financing. Access and Cost Trends. Medical Expenditure Panel Survey.
Chart 4-5: Data Source: A. K. Jha et al., “Racial Trends in the Use of Major Procedures Among the Elderly,” New England Journal of Medicine, Aug. 18, 2005 353(7):683–91.
Chapter 5. Disparities in Health Insurance Coverage
Chart 5-1: Data Source: National Center for Health Statistics. National Health Interview Survey. 2005. Note: Estimates are based on household interviews of a sample of the civilian noninstitutionalized population. Health insurance coverage is based on the question, “What kind of health insurance or health care coverage does [person] have?” The category “uninsured” includes persons who had no coverage as well as those who had only Indian Health Service coverage or had only a private plan that paid for one type of service such as accidents or dental care. Beginning the third quarter of 2004, two additional questions were added to the NHIS insurance section to reduce potential errors in reporting of Medicare and Medicaid status. Estimates of uninsurance for 2004 are calculated with the responses to these questions included.
Chart 5-2: Data Source: The Commonwealth Fund. Health Care Quality Survey. 2006. Note: Data include adults ages 18 to 64. Includes adults uninsured at time of survey or insured at time of survey but uninsured in the previous year.
Chart 5-3: Data Source: The Commonwealth Fund. Health Care Quality Survey. 2006. Note: Data include adults ages 18 to 64. Includes adults uninsured at time of survey or insured at time of survey but uninsured in the previous year. Compared with whites, differences are statistically significant after controlling for income.
Chart 5-4: Data Source: The Commonwealth Fund. Health Care Quality Survey. 2006. Note: Data include adults uninsured at time of survey or insured at time of survey but uninsured in the previous year.
Chart 5-5: Literature Source: L. Ku, Center for Budget and Policy Priorities, Analyses of March 2006 Current Population Survey,Private Communication.
Chart 5-6: Literature Source: L. Ku, M. Lin, and M. Broaddus, Improving Children’s Health: A Chartbook About the Roles of Medicaid and SCHIP (Washington, D.C.: Center on Budget and Policy Priorities, Jan. 2007).
Chapter 6. Disparities in Quality
Chart 6-1: Data Source: P. B. Bach et al., “Primary Care Physicians Who Treat Blacks and Whites,” New England Journal of Medicine,Aug. 5, 2004 351(6):575–84.
Chart 6-2: Data Source: J. Skinner et al., “Mortality After Acute Myocardial Infarction in Hospitals that Disproportionately Treat Black Patients,” Circulation, Oct. 25, 2005 112(17):2634–41.
Chart 6-3: Data Sources: S. F. Jencks et al., “Change in the Quality of Care Delivered to Medicare Beneficiaries, 1998–1999 to 2000–2001,” Journal of the American Medical Association, Jan. 15, 2003 289(3):305–12; United States Census Bureau, Census 2000.

111
THECOMMONWEALTH
FUND
Chart 6-7: Data Source: Centers for Medicare & Medicaid Services, Nursing Home Minimum Data Set. Note: Data reflect care for the period 7/1/04 to 9/30/04. Age, gender, and race/ethnicity categories exclude records with missing values.
Chart 6-8: Data Source: The Commonwealth Fund. Health Care Quality Survey. 2006.
Chart 6-9: Literature Source: Agency for Healthcare Research and Quality. National Healthcare Disparities Report. 2006. Data Source: Centers for Disease Control and Prevention, National Center for Health Statistics, National Ambulatory Medical Care Survey and NationalHospital Ambulatory Medical Care Survey. Note: Percentages are based on the total number of visits for the variable of interest. For example, total percent is the percent of all emergency department visits where the patient left before being seen. All percentages are calculated using unweighted numbers.
Chart 6-10: Literature Source: Agency for Healthcare Research and Quality. National Healthcare Disparities Report. 2006. Data Source: Agency for Healthcare Research and Quality, Center for Delivery,Organization, and Markets, Healthcare Cost and Utilization Project, State Inpatient Databases, disparities analysis file, 2003. This file is designed to provide national estimates on disparities using weighted records from a sample of hospitals from the following 23 states:Arizona, California, Colorado, Connecticut, Florida, Georgia, Hawaii, Kansas, Maryland, Massachusetts, Mississippi, Missouri, New Hampshire, New Jersey, New York, Pennsylvania, Rhode Island, South Carolina, Tennessee, Texas, Vermont, Virginia, and Wisconsin.
Chart 6-11: Data Source: E. Bradley et al., “Racial and Ethnic Differences in Time to Acute Reperfusion Therapy for Patients Hospitalized with Myocardial Infarction,” Journal of the American Medical Association, Oct. 6, 2004 292(13):1563–72.
Chart 6-12: Data Source: Agency for Healthcare Research and Quality. National Healthcare Disparities Report. 2005.
Chart 6-4: Literature Source: Agency for Healthcare Research and Quality. National Healthcare Disparities Report. 2006. Data Source: Agency for Healthcare Research and Quality, Center for Delivery,Organization, and Markets, Healthcare Cost and Utilization Project, State Inpatient Databases, disparities analysis file, 2003. This file is designed to provide national estimates on disparities using weighted records from a sample of hospitals from the following 23 states:Arizona, California, Colorado, Connecticut, Florida, Georgia, Hawaii, Kansas, Maryland, Massachusetts, Mississippi, Missouri, New Hampshire, New Jersey, New York, Pennsylvania, Rhode Island, South Carolina, Tennessee, Texas, Vermont, Virginia, and Wisconsin.
Chart 6-5: Literature Source: Agency for Healthcare Research and Quality. National Healthcare Disparities Report. 2006. Data Source: Agency for Healthcare Research and Quality, Center for Delivery,Organization, and Markets, Healthcare Cost and Utilization Project, State Inpatient Databases, disparities analysis file, 2003. This file is designed to prove national estimates on disparities using weighted records from a sample of hospitals from the following 23 states:Arizona, California, Colorado, Connecticut, Florida, Georgia, Hawaii, Kansas, Maryland, Massachusetts, Mississippi, Missouri, New Hampshire, New Jersey, New York, Pennsylvania, Rhode Island, South Carolina, Tennessee, Texas, Vermont, Virginia, and Wisconsin. Note: Data exclude admissions specifically for DVT, obstetrics, plication of vena cava before or after surgery, and thromboembuli.
Chart 6-6: Data Source: A. Donovan et al., “Two-Year Trends in the Use of Seclusion and Restraint Among Psychiatrically Hospitalized Youths,” Psychiatric Services, July 2003 54(7):987–93. Note: Data include total number of events and their cumulative duration summarized for each patient and expressed as total events per 1,000 patient days. Derived quarterly tallies per 1,000 patient days and episode duration are expressed in minutes separately for seclusion and restraint episodes. Averages for event-specific outcomes were derived through least-squares means to effectively adjust for the effects of age, sex, race, and admission status. Observations werenot independent.

112
THECOMMONWEALTH
FUND
Chart 6-13: Literature Source: H. L. Howe et al., “Annual Report to the Nation on the Status of Cancer, 1975–2003, Featuring Cancer Among U.S. Hispanic/Latino Populations,” Cancer, Oct. 15, 2006 107(8):1711–42. Colorectal Screening Data Source: National Center for HealthStatistics. National Health Interview Survey, Sample Adult File. 2003. Available at http://www.cdc.gov/nchs/nhis.htm. Pap Smear Data Source: J. S. Schiller, P. F. Adams, and Z. C. Nelson, “Summary Health Statistics for the U.S. Population: National Health Interview Survey, 2003,” Vital Health Statistics 10, Apr. 2005 (224):1–104.
Chart 6-14: Literature Source: Agency for Healthcare Research and Quality. National Healthcare Disparities Report. 2006. Data Source: National Center for Health Statistics. National Health Interview Survey.
Chart 6-15: Literature Source: Agency for Healthcare Research and Quality. National Healthcare Disparities Report. 2006. Data Source: National Center for Health Statistics, National Health Interview Survey.
Chart 6-16: Literature Source: Agency for Healthcare Research and Quality. National Healthcare Disparities Report. 2005. Data Source: Agency for Healthcare Research and Quality, Center for Financing, Access and Cost Trends. Medical Expenditure Panel Survey.
Chart 6-17: Literature Source: Agency for Healthcare Research and Quality. National Healthcare Disparities Report. 2006. Data Source: Centers for Disease Control and Prevention, National Vital Statistics System.
Chart 6-18: Literature Source: Agency for Healthcare Research and Quality. National Healthcare Disparities Report. 2006. Data Source: Substance Abuse and Mental Health Services Administration, Office of Applied Studies. National Survey on Drug Use and Health.
Chart 6-19: Literature Source: Agency for Healthcare Research and Quality. National Healthcare Disparities Report. 2006. Data Source: Quality Improvement Organization Program. 2002–2004. Note: The denominator represents Medicare beneficiaries with pneumonia whoare hospitalized, all ages. Figures are calculated by averaging the
percentage of opportunities for care in which the patient received all five incorporated components of care.
Chart 6-20: Literature Source: Agency for Healthcare Research and Quality. National Healthcare Disparities Report. 2006. Data Source: Medicare Quality Improvement Organization Program. 2002–2004. Note: The denominator represents Medicare beneficiaries hospitalized for heart failure, all ages. Recommended hospital care includes the following measures: (1) receipt of evaluation of left ventricular ejection fraction, and (2) receipt of ACE inhibitor for left ventricular systolic dysfunction. Figures are calculated by averaging the percentage of the population that received each of the two incorporated componentsof care.
Chart 6-21: Data Source: The Commonwealth Fund. Biennial Health Insurance Survey. 2005.
Chart 6-22: Literature Source: The Commonwealth Fund. National Scorecard on U.S. Health System Performance. 2006. Data Source: HCUP data, AHRQ's 2005 National Health Care Quality Report.
Chart 6-23: Literature Source: K. Baicker et al., “Who You Are and Where You Live: How Race and Geography Affect the Treatment of Medicare Beneficiaries,” Health Affairs Web Exclusive (Oct. 7, 2004):var33–var44. Data Source: Data are from 79 hospital referral regions (HRRs) with the largest black population (representing 80% of the black elderly population) and come from Medicare claims, 1998–2001.
Chart 6-24: Data Source: The Commonwealth Fund. Health Care Quality Survey. 2001.
Chart 6-25: Data Source: The Commonwealth Fund. Health Care Quality Survey. 2006.
Chart 6-26: Literature Source: Agency for Healthcare Research and Quality. National Healthcare Disparities Report. 2006. Data Source: Agency for Healthcare Research and Quality. Center for Financing, Access and Cost Trends. Medical Expenditure Panel Survey.

113
THECOMMONWEALTH
FUND
Chart 6-27: Literature Source: Agency for Healthcare Research and Quality. National Healthcare Disparities Report. 2006. Data Source: National Hospice and Palliative Care Organization, Family Evaluation of Hospice Care survey data.
Chart 6-28: Literature Source: N. L. Keating et al., “Patient Characteristics and Experiences Associated with Trust in Specialist Physicians,” Archives of Internal Medicine, May 10, 2004 164(9):1015–20.
Chapter 7. Strategies for Closing the Gap
Chart 7-1: Data Source: Centers for Disease Control and Prevention. National Immunization Surveys. 2002–2005.
Chart 7-2: Data Source: S. U. Rehman et al., “Ethnic Differences in Blood Pressure Control Among Men at Veterans Affairs Clinics andOther Health Care Sites,” Archives of Internal Medicine, May 9, 2005 165(9):1041–47.
Chart 7-3: Data Source: The Commonwealth Fund. Biennial Health Insurance Survey. 2005.
Chart 7-4: Data Source: The Commonwealth Fund. Health Care Quality Survey. 2006.
Chart 7-5: Data Source: The Commonwealth Fund. Health Care Quality Survey. 2006.
Chart 7-6: Literature Source: L. Ku, Center for Budget and Policy Priorities. Analyses of the Centers for Disease Control and Prevention, National Center for Health Statistics, 2005 National Health Interview Survey.
Chart 7-7: Data Source: The Commonwealth Fund. Health Care Quality Survey. 2006.
Chart 7-8: Literature Source: M. M. Doty and A. L. Holmgren, Health Care Disconnect: Gaps in Coverage and Care for Minority Adults: Findings from The Commonwealth Fund Biennial Health Insurance Survey (2005) (New York: The Commonwealth Fund, Aug. 2006).
Chart 7-9: Data Source: A. R. Sehgal, “Impact of Quality Improvement Efforts on Race and Sex Disparities in Hemodialysis,” Journal of the American Medical Association, Feb. 26, 2003 289(8):996–1000.
Chart 7-10: Data Source: A. N. Trivedi et al., “Trends in the Quality ofCare and Racial Disparities in Medicare Managed Care,” New England Journal of Medicine, Aug. 18, 2005 353(7):692–700.
Chart 7-11: Literature Source: Agency for Healthcare Research and Quality. National Healthcare Quality Report. 2006. Data Source: Centers for Medicare and Medicaid Services, Medicare Quality Improvement Organization Program.


