89
PFIZER FACTS Racial Differences in Cancer A Comparison of Black and White Adults in the United States p
P F I Z E R F A C T S
Racial Differences in CancerA Comparison of Black and WhiteAdults in the United States
p
pU.S. Pharmaceuticals
PG006038© 2005 Pfizer Inc.All rights reserved.
Printed in USAJuly 2005 Pf
izer
Co
rpo
rate
Gra
ph
icD
esig
n,N
YH
Q23
012
7/20
05C
RW

p
This issue of Pfizer Facts, a collaboration between the National Medical Association (NMA) andPfizer, presents new analyses of national databases to gain insight into the burden of canceramong black adults, with comparisons to the white adult population.
About Pfizer: Pfizer Inc discovers, develops, manufactures, and markets leading prescriptionmedicines for humans and animals and many of the world's best-known consumer brands.
About NMA: The National Medical Association is the nation's oldest and largest organizationrepresenting the interest of more than 30,000 physicians of African descent and the patientsthey serve. For additional information, visit www.nmanet.org.

Approximately 177,000 blacks aged 20 and older will be diagnosed with cancer in2005—an annual rate of 722 new cases diagnosed per 100,000 black adults, excludingbasal and squamous cell skin cancers and carcinomas in situ. In contrast, the rateamong white adults is 665 new cases per 100,000. The higher cancer incidence inblacks is driven specifically by the higher rate in black men. Cancer incidence isslightly lower in black women than white women.
Cancer mortality is also higher in blacks than whites, with rates of 237 and 190 per100,000 blacks and whites, respectively. Cancer death rates have declined over thepast decade; however, black males have an age-adjusted mortality rate 36% higherthan white males. Mortality rates are lower in females than males, and black femaleshave a higher mortality rate than white females.
Five-year relative survival is lower in blacks than whites, 53% compared with 64%,respectively. Part of this disparity is because blacks are less likely to be diagnosed inthe more survivable local stage. Among women, 40% of blacks and 50% of whitesare diagnosed in the local stage. Among men, early diagnosis occurs in 54% and 58%of blacks and whites, respectively.
Analyses of specific cancers also reveal racial disparities. Blacks experience higherincidence and mortality, and lower five-year survival, with respect to four of the fivecancers addressed in this report: cancers of the prostate, colon and rectum, lung andbronchus, and uterine cervix. Although the incidence of breast cancer is lower amongblack women than white women, black females have higher mortality and lowerfive-year survival. The greatest racial disparity is observed for prostate cancer: blacksare 63% more likely to be diagnosed (380 cases vs. 233 cases per 100,000 population,respectively), and they are over twice as likely to die of prostate cancer (61 and 25deaths per 100,000 population, respectively). Lung cancer disproportionately affectsblack males, with 51% higher incidence (ages 20 and older) and 31% higher mortality(all ages) than observed in white men.
This issue of Pfizer Facts, a collaboration between the National Medical Association(NMA), the Special Populations Network of Region 2 NMA and Thomas JeffersonUniversity, and Pfizer, presents new analyses of national databases to gaininsight into the burden of cancer among black adults, with comparisons to the whiteadult population. The report addresses cancer morbidity and mortality, coexistingconditions experienced by cancer patients and survivors, cost of care, behavioral riskfactors and prevention. We present analyses of the Surveillance, Epidemiology, andEnd Results (SEER) Program, the National Health Interview Survey (NHIS), theBehavioral Risk Factor Surveillance System (BRFSS), the Medical Expenditure PanelSurvey (MEPS), and the Compressed Mortality File (CMF). We hope that theinformation presented in this report will encourage discussion and debate, andultimately lead to the development and implementation of effective interventions.
Edith P. Mitchell, MD, FACPClinical Professor of MedicineDivision of Medical OncologyJefferson Medical CollegeThomas Jefferson University
Robin P. Hertz, PhDSenior DirectorMargaret McDonald, PhDDirector
Population StudiesUS Outcomes ResearchPfizer Global Pharmaceuticals


Table of contentsTotal cancer
Incidence 1Mortality 3Survival 4Treatment 7Prevalence 8Source of payment for cancer treatment 9
Selected cancersBreast 13Prostate 19Lung and bronchus 25Colon and rectum 32Uterine cervix 40
Concurrent medical conditions 47
Behavioral risk factors 57
Demographic characteristics and environmental issues 63
AppendicesI. Methods 73II. Incidence and prevalence of selected cancers
in black and white adults 78III. Prevalence of concurrent medical conditions
in adults with cancer 80IV. Screening guidelines for selected cancers 81
About the analysesMeasuring the burden of cancer among black and white United States adults presents challenges,requiring analyses of multiple national data sources for morbidity, mortality and healthcare spendinginformation. The most current available data from these sources are used in the analyses;consequently, overlapping years, and in some instances, different years of data are used.
The data sources analyzed to produce a comprehensive healthcare profile of cancer among black andwhite adults ages 20 and older are listed below.
Morbidity and mortality
• Surveillance, Epidemiology, and End Results (SEER) Program, 1992–2001: Analyzed for cancerincidence, survival and treatment rates.
• National Health Interview Survey (NHIS) 1999–2003: Prevalence of cancer and concurrent medicalconditions.
• Compressed Mortality File (CMF) 1990–2002, Centers for Disease Control and Prevention:Death rates.
Healthcare expenses
• Medical Expenditure Panel Survey (MEPS), 1998–2002: Direct medical spending for cancer treatment.
Prevention, screening, demographic characteristics and environmental issues
• Behavioral Risk Factor Surveillance System (BRFSS), 2002: Prevalence estimates of screening tests forselected cancers.
• NHIS, 2003: Behavioral risk factor prevalence, demographic characteristics and environmentalissues.
• Current Population Survey (CPS), 2004. Bureau of Labor Statistics: Employment data.
To address sample size limitations inherent when analyzing cancer data, particularly when examiningcancer by subsets within the population (e.g. race, age groups) multiple years of data are combinedfor some analyses to increase sample sizes needed for reliable estimates. Even so, because of the lowincidence of male breast cancer among male adults (1.7 cases per 100,000 adult male population), thesample sizes are inadequate to yield reliable estimates for male breast cancer; therefore, all breastcancer analyses in this report are limited to women. On the other hand, basal and squamous cell skincancers are typically excluded from analyses of malignant neoplasms because of their high incidenceand cure rates. These cancers, and carcinomas in situ, are excluded from the category “total cancers”in this report. When analyzing prevalence of chronic conditions among black and white adults withand without a history of cancer, again, sample size limitations prevent further reporting of chronicconditions by years since cancer diagnosis.
Total cancerIncidence
Black adults have a higher incidence of cancer than white adults, with 722 new
cases compared with 665 new cases (excluding basal and squamous cell cancer
and carcinomas in situ) per 100,000 population aged 20 and older, respectively,
expected in 2005. This racial difference is attributable to the excess cancer rate
in black men. Prior to age 45, cancer rates are similar among men of both racial
groups; after this point, however, divergence occurs and rates for black men
increase considerably. The greatest disparity occurs between ages 70 to 74 when
cancer rates are 3,638 and 2,900 per 100,000 black and white men, respectively.
Among women aged 20 and older, blacks have a slightly lower incidence of
cancer than whites, 559 vs. 595 new cases per 100,000 black and white women.
This disparity is greater in older women.
Regardless of race, the burden of cancer is greater in men than women. There
are 772 and 575 new cases per 100,000 men and women, respectively, aged
20 and older.
Racial differences in cancer
1

Racial differences in cancer
2

Mortality
Cancer is the second leading cause of death in the United States. The overall
death rate from cancer is on the decline for both blacks and whites, and is
decreasing for the most incident cancers among males and females (prostate,
breast, lung, and colorectal cancers). However, blacks continue to have higher
cancer mortality rates than whites. In 2002, the mortality rate among black
males was 36% higher than among white males (317 vs. 234 deaths per
100,000), and the rate among black females was 17% higher than that among
white females (189 vs. 161 per 100,000).
Racial differences in cancer
3

Survival
Survival rates vary according to the specific type of cancer, as well as by race
and gender. By convention, five-year survival rates are considered, although
living beyond five years of diagnosis does not equate to being cured. Another
convention is reporting “five-year relative survival,” the likelihood or chance
of cancer patients surviving at least five years after diagnosis, relative to the
expected likelihood of cancer-free persons (matched on age, sex, race, and year
of observation) surviving at least five years.
Black adults have a lower five-year relative survival rate for cancer than whites,
53% vs. 64%. The disparity in relative survival is higher among women (51%
vs. 64%) than among men (56% vs. 64%).
Age-specific relative survival curves differ for men and women. For men, relative
survival rate disparity is greatest prior to age 35 and begins to narrow at age 50.
The likelihood of survival increases dramatically between ages 40 to 49 among
black men, and slightly at ages 50 to 54 among white men. Relative survival
declines at ages 70 to 74 in black men and 75 to 79 in white men. Among
women, however, the disparity as well as the decline in relative survival rates
is consistent by age.
Racial differences in cancer
4

Racial differences in cancer
5
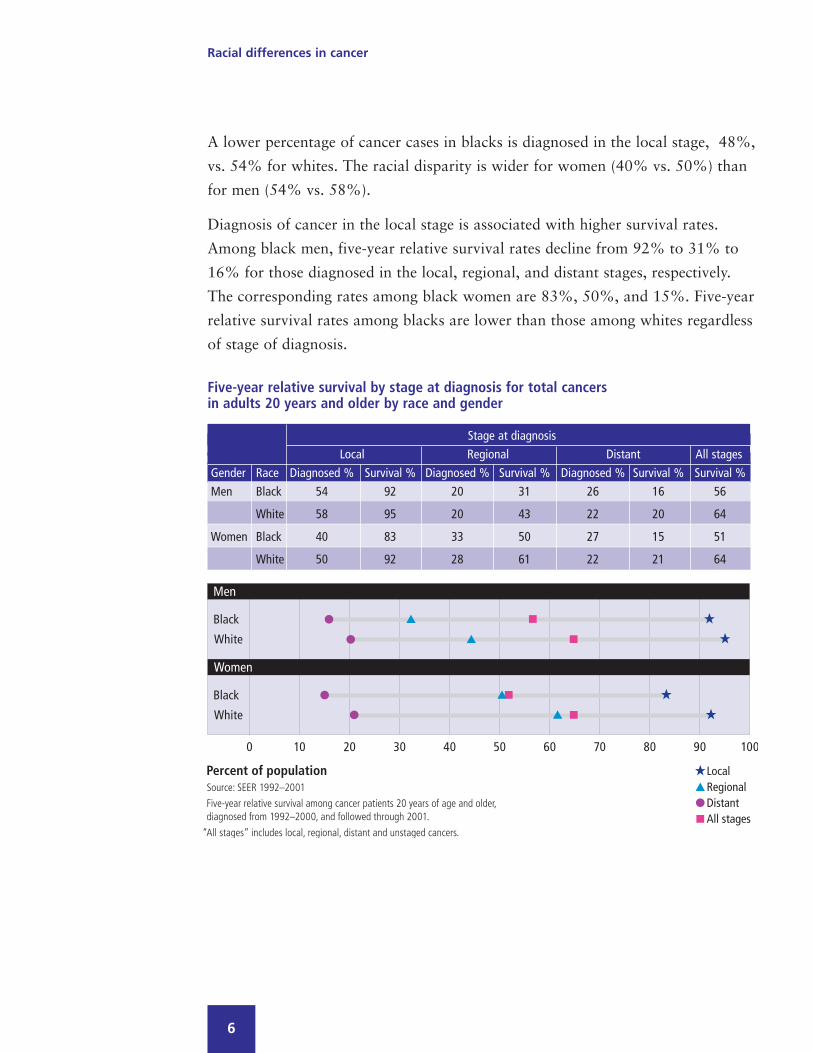
A lower percentage of cancer cases in blacks is diagnosed in the local stage, 48%,
vs. 54% for whites. The racial disparity is wider for women (40% vs. 50%) than
for men (54% vs. 58%).
Diagnosis of cancer in the local stage is associated with higher survival rates.
Among black men, five-year relative survival rates decline from 92% to 31% to
16% for those diagnosed in the local, regional, and distant stages, respectively.
The corresponding rates among black women are 83%, 50%, and 15%. Five-year
relative survival rates among blacks are lower than those among whites regardless
of stage of diagnosis.
Racial differences in cancer
6
Five-year relative survival by stage at diagnosis for total cancersin adults 20 years and older by race and gender
Stage at diagnosisLocal Regional Distant All stages
Gender Race Diagnosed % Survival % Diagnosed % Survival % Diagnosed % Survival % Survival %Men Black 54 92 20 31 26 16 56
White 58 95 20 43 22 20 64
Women Black 40 83 33 50 27 15 51
White 50 92 28 61 22 21 64

Treatment
Cancer treatment decisions, such as surgery and radiation, depend on many
factors, including the specific cancer site and the stage at which the cancer is
diagnosed. Differences in cancer stage at diagnosis among blacks and whites
may contribute towards differences in surgery and radiation treatment rates.
In this report, graphs showing total surgery and radiation rates by race and
gender include all stages of diagnosed cancer.
Surgical treatment for cancer varies by race and gender. Among adults aged
20 and older, 56% and 75% of black men and women, respectively, undergo
surgery, compared with 66% and 81% of white men and women. Radiation
treatment, regardless of race or gender, is similar: 31% and 29% of black
men and women receive radiation compared with 28% and 30% of white
men and women.
Racial differences in cancer
7

Prevalence
Prevalence, the percentage of the population with a history of cancer, is a
function of both new cases of cancer and survivability of cancer. The prevalence
of total cancers among adults aged 20 and older is lower among blacks than
whites. Three percent of black men and 4% of black women, compared with
5% and 7% of white men and women report a history of cancer (excluding
basal and squamous cell skin cancer).
Of the estimated 1.3 million black men and 2 million black women who have
ever been diagnosed with cancer, 20% and 18% were diagnosed in the past year.
Of the estimated 17 million white men and 27 million white women who have
ever been diagnosed with cancer, 21% and 16% were diagnosed in the past year.
Racial differences in cancer
8

Source of payment for cancer treatmentCancer-attributable spending
An estimated 527,000 black adults aged 40 and older with a history of cancer
spend $4.36 billion (B) a year on cancer treatment; $25.06B is spent annually
to treat an estimated 7.46 million white adults aged 40 and older. With changes
in therapies for some cancers since the most current time period for which
the Medical Expenditure Panel Survey (MEPS) data are available, and with
the exclusion from MEPS of costs associated with long-term care, this high
economic burden represents an underestimate of direct expenditures associated
with cancer care. Direct spending is a function of per person spending associated
with the specific cancer and the number of persons seeking treatment for that
cancer. (Spending for other non-epithelial cancers of the skin and for primary
and secondary malignant neoplasms with unspecified sites are excluded from
this section.)
Among middle-aged blacks and whites, private insurers pay for 62% and 72%
of annual cancer-related healthcare expenses, respectively. In this same age group,
Medicaid incurs 21% of total expenses associated with cancers among blacks,
and 4% of cancer expenses among whites.
Medicare is the largest payer of cancer-related expenses for older blacks and
whites, incurring 52% and 68% of total expenditures, respectively. Among older
blacks, Medicaid and other public payers incur 15% and 11% of total cancer
expenses, compared with 1% and 6% among older white adults.
Racial differences in cancer
9

Racial differences in cancer
10


Selected cancersBreast
Black women have lower incidence and prevalence rates of breast cancer than
white women, but they have a higher mortality rate and a lower survival rate.
In 2002, the mortality rate for breast cancer was 34 for blacks and 25 for whites
per 100,000 population of all ages, respectively. The five-year relative survival
rate was 74% for black women and 88% for white women.
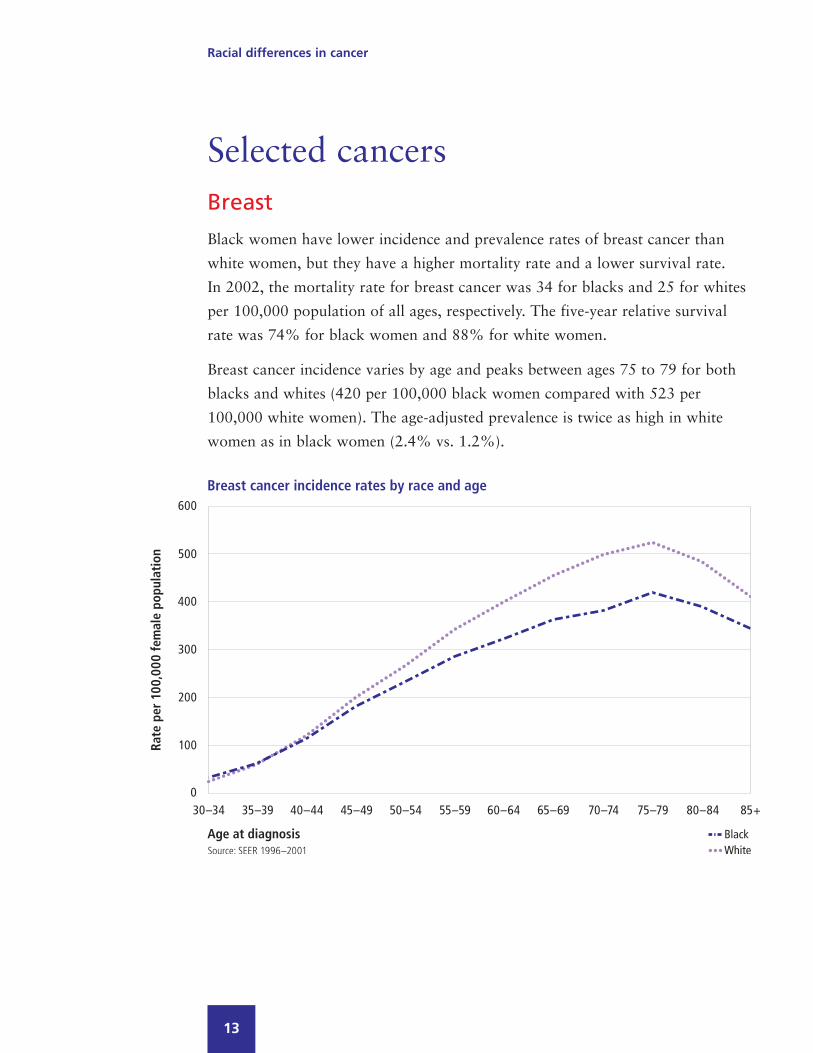
Breast cancer incidence varies by age and peaks between ages 75 to 79 for both
blacks and whites (420 per 100,000 black women compared with 523 per
100,000 white women). The age-adjusted prevalence is twice as high in white
women as in black women (2.4% vs. 1.2%).
Racial differences in cancer
13

From 1990 to 2002, breast cancer mortality declined for both black and white
females, but the drop was less for black females, leading to a growing racial
disparity (34 deaths per 100,000 black females compared with 25 deaths per
100,000 white females in 2002, a rate 36% higher in 2002 compared with 14%
higher in 1990).
Racial differences in cancer
14
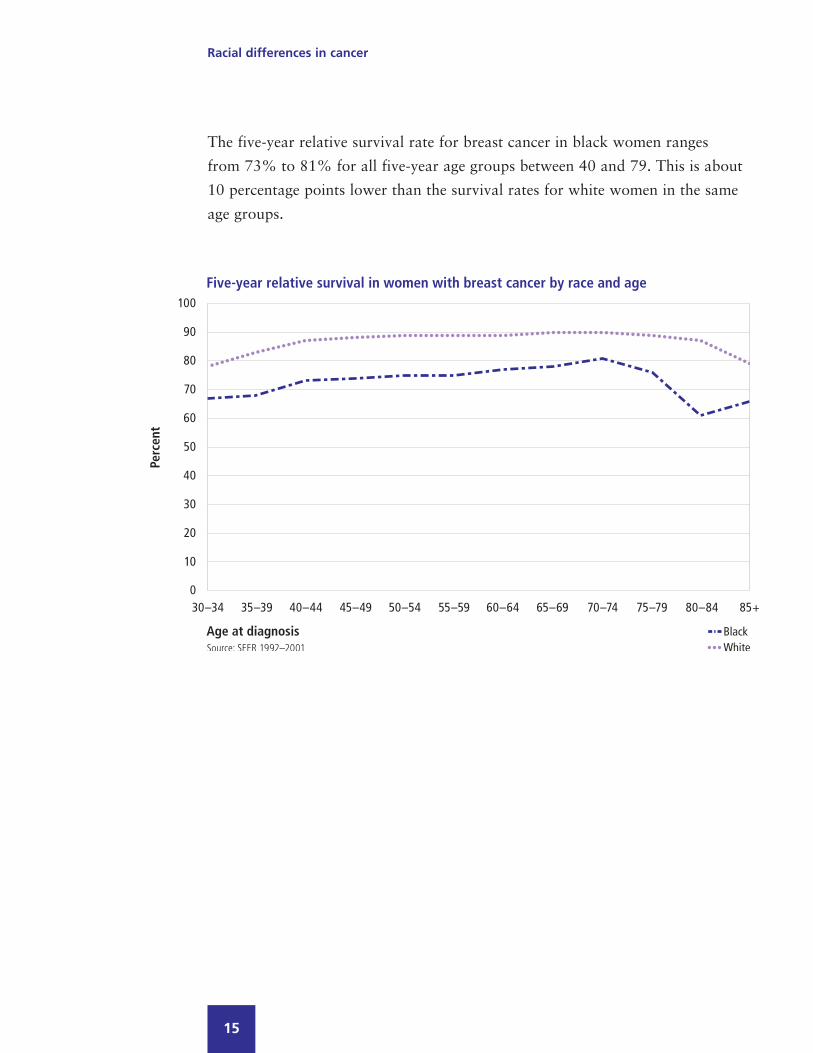
The five-year relative survival rate for breast cancer in black women ranges
from 73% to 81% for all five-year age groups between 40 and 79. This is about
10 percentage points lower than the survival rates for white women in the same
age groups.
Racial differences in cancer
15
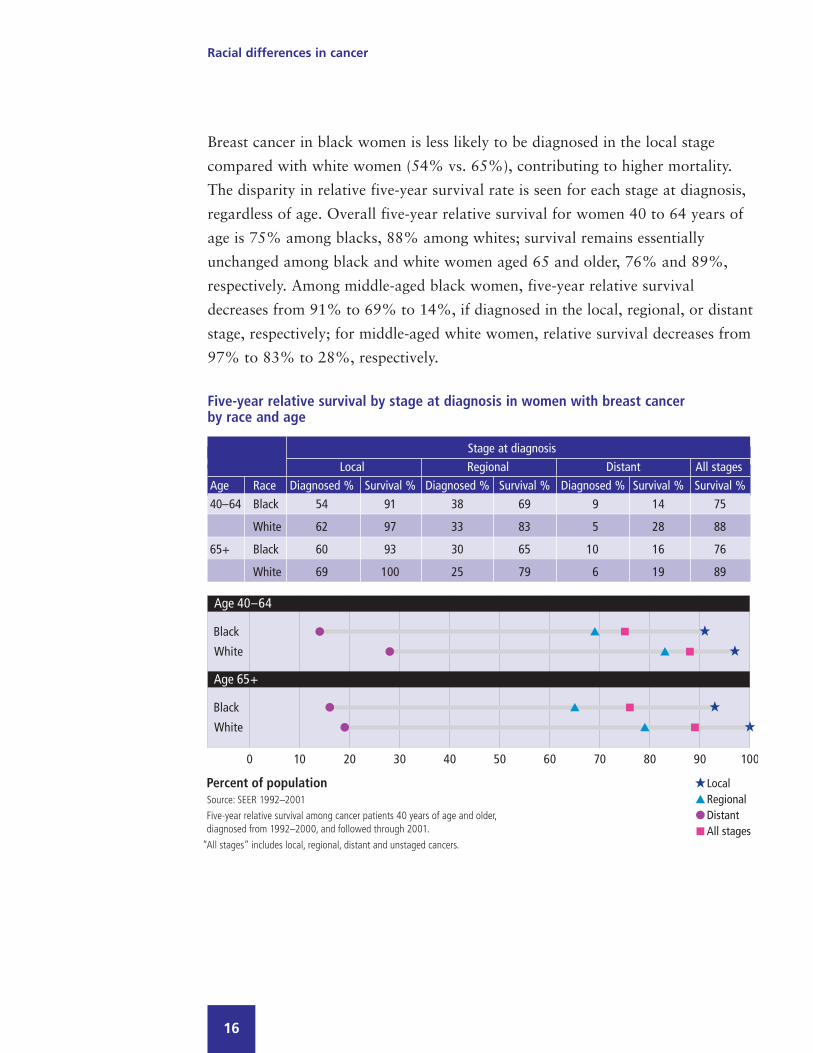
Breast cancer in black women is less likely to be diagnosed in the local stage
compared with white women (54% vs. 65%), contributing to higher mortality.
The disparity in relative five-year survival rate is seen for each stage at diagnosis,
regardless of age. Overall five-year relative survival for women 40 to 64 years of
age is 75% among blacks, 88% among whites; survival remains essentially
unchanged among black and white women aged 65 and older, 76% and 89%,
respectively. Among middle-aged black women, five-year relative survival
decreases from 91% to 69% to 14%, if diagnosed in the local, regional, or distant
stage, respectively; for middle-aged white women, relative survival decreases from
97% to 83% to 28%, respectively.
Racial differences in cancer
16
Five-year relative survival by stage at diagnosis in women with breast cancerby race and age
Stage at diagnosisLocal Regional Distant All stages
Age Race Diagnosed % Survival % Diagnosed % Survival % Diagnosed % Survival % Survival %40–64 Black 54 91 38 69 9 14 75
White 62 97 33 83 5 28 88
65+ Black 60 93 30 65 10 16 76
White 69 100 25 79 6 19 89
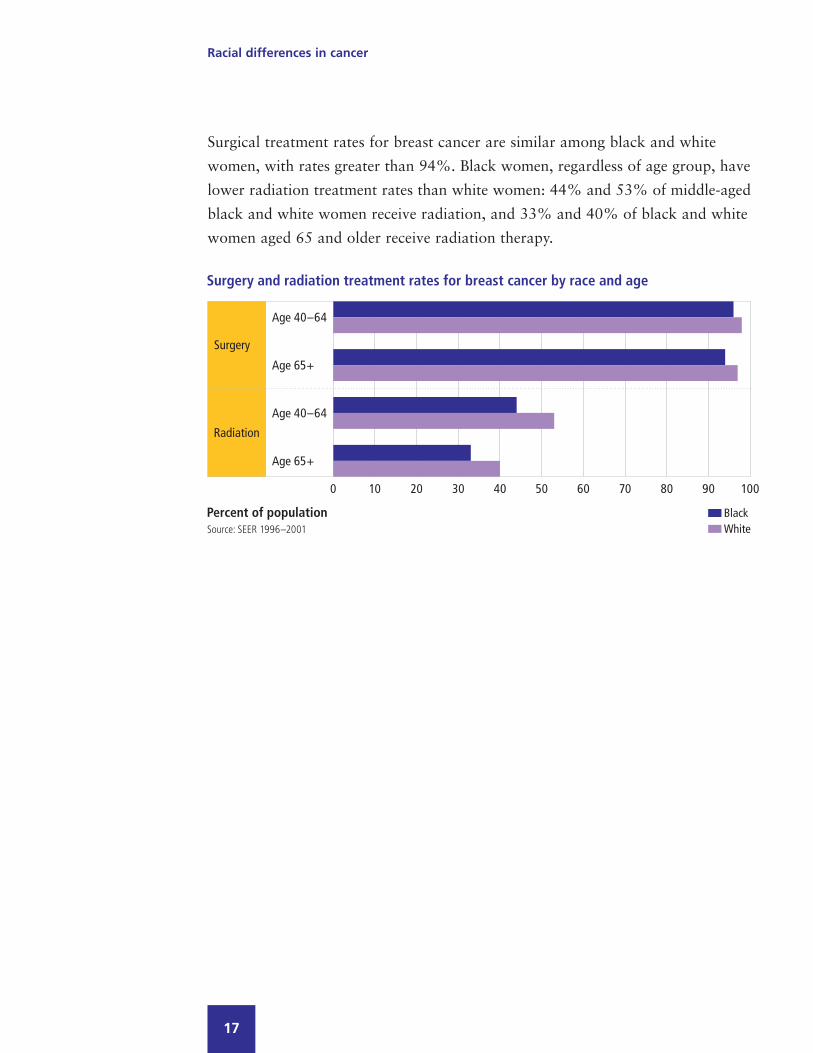
Surgical treatment rates for breast cancer are similar among black and white
women, with rates greater than 94%. Black women, regardless of age group, have
lower radiation treatment rates than white women: 44% and 53% of middle-aged
black and white women receive radiation, and 33% and 40% of black and white
women aged 65 and older receive radiation therapy.
Racial differences in cancer
17

Annual screening rates for breast cancer are similar for black and white women.
While the percent of women aged 40 and older who received a clinical breast
exam in the last year is about the same for blacks (69%) and whites (68%), a
higher percentage of black women have never received one (12% vs. 7%). This
disparity persists for Medicare-eligible women (16% vs. 13%).
Racial differences in cancer
18

Prostate
Both the incidence and prevalence rates (age-adjusted) of prostate cancer
are higher for blacks than whites. The mortality rate is higher and the relative
five-year survival rate is lower for blacks.
Prior to age 40, incidence rates are similar but begin to diverge between ages
40 to 44. This disparity increases and peaks between ages 70 to 74 for both
blacks and whites. At age 75, rates begin to decline for both black and white
men, although incidence continues to be greater in black men.
The prevalence of prostate cancer is much higher for older than younger men.
The prevalence rate for blacks is higher than for whites among men aged 65 and
older (10% vs. 9%).
Racial differences in cancer
19
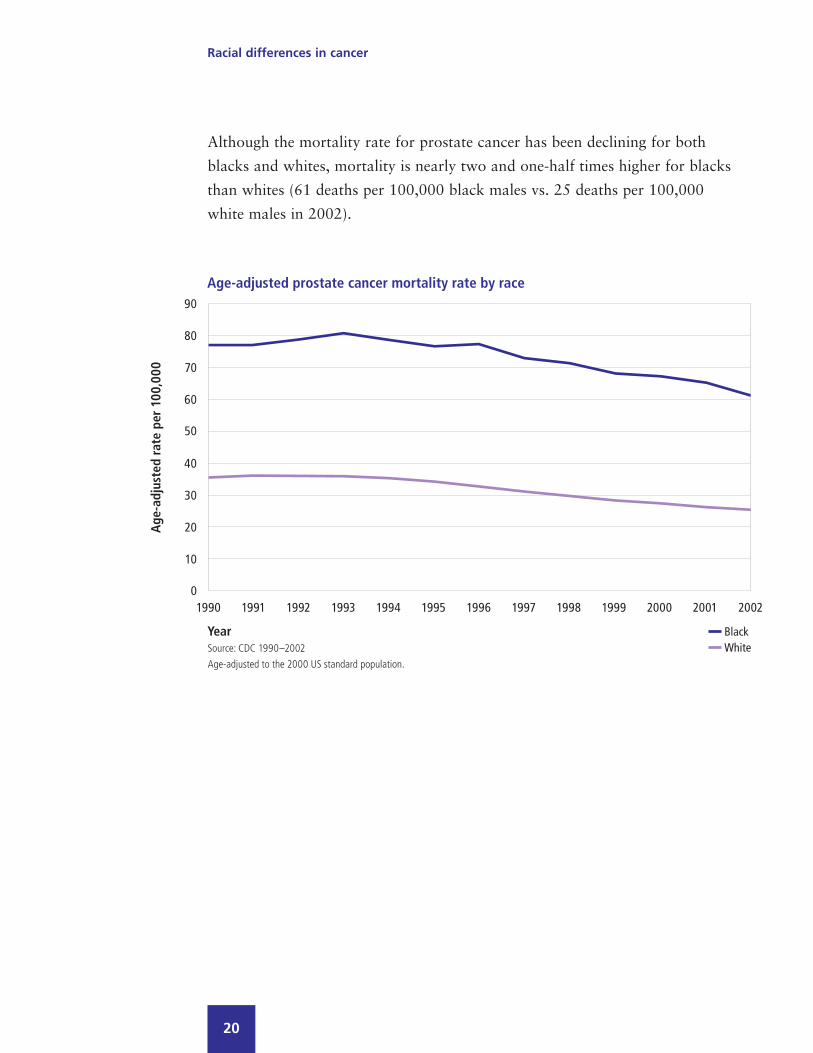
Although the mortality rate for prostate cancer has been declining for both
blacks and whites, mortality is nearly two and one-half times higher for blacks
than whites (61 deaths per 100,000 black males vs. 25 deaths per 100,000
white males in 2002).
Racial differences in cancer
20

The five-year relative survival rate for prostate cancer is greater than 90% for
blacks and whites diagnosed before age 80. Most prostate cancer is diagnosed in
the local/regional stage (91% for blacks and 94% for whites), but blacks are
50% more likely than whites to be diagnosed in the less survivable distant stage
(9% vs. 6%).
Racial differences in cancer
21
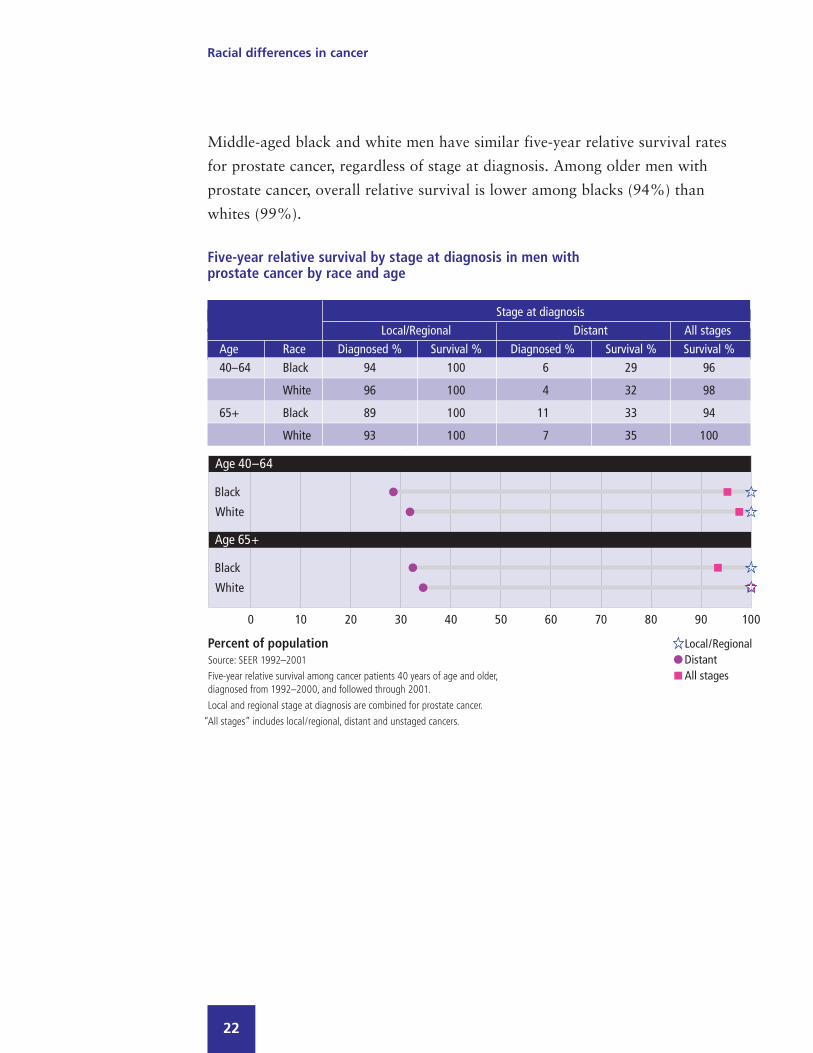
Middle-aged black and white men have similar five-year relative survival rates
for prostate cancer, regardless of stage at diagnosis. Among older men with
prostate cancer, overall relative survival is lower among blacks (94%) than
whites (99%).
Racial differences in cancer
22
Stage at diagnosisLocal/Regional Distant All stages
Age Race Diagnosed % Survival % Diagnosed % Survival % Survival %40–64 Black 94 100 6 29 96
White 96 100 4 32 98
65+ Black 89 100 11 33 94
White 93 100 7 35 100
Five-year relative survival by stage at diagnosis in men with prostate cancer by race and age

Among older adults, those aged 65 and older, blacks are less likely than whites
to undergo surgery (46% vs. 50%) or receive radiation therapy (36% vs. 38%).
For adults aged 40 to 64, blacks are less likely than whites to have surgery (71%
vs. 80%), but more likely to have radiation therapy (34% vs. 28%).
Racial differences in cancer
23
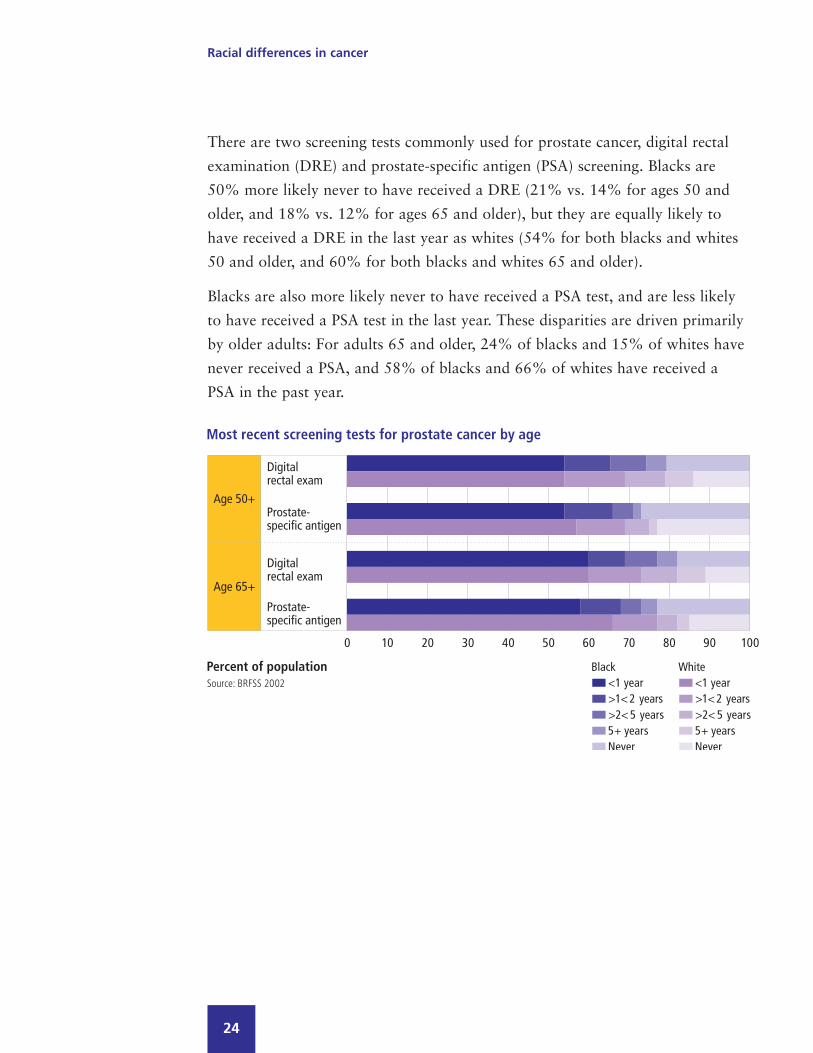
There are two screening tests commonly used for prostate cancer, digital rectal
examination (DRE) and prostate-specific antigen (PSA) screening. Blacks are
50% more likely never to have received a DRE (21% vs. 14% for ages 50 and
older, and 18% vs. 12% for ages 65 and older), but they are equally likely to
have received a DRE in the last year as whites (54% for both blacks and whites
50 and older, and 60% for both blacks and whites 65 and older).
Blacks are also more likely never to have received a PSA test, and are less likely
to have received a PSA test in the last year. These disparities are driven primarily
by older adults: For adults 65 and older, 24% of blacks and 15% of whites have
never received a PSA, and 58% of blacks and 66% of whites have received a
PSA in the past year.
Racial differences in cancer
24
Lung and bronchus
Blacks have a higher incidence of lung and bronchus cancer than whites, driven
by a large disparity across all ages for men. Blacks also have a higher mortality
rate and a lower five-year relative survival rate than whites, and these disparities
are more evident for males than females.
Lung cancer incidence is 51% higher in black men than white men (167 vs. 110
new cases per 100,000 men), and black men tend to be diagnosed at an earlier
age (median age 66 vs. 70). Although the overall incidence does not differ
strongly between black and white women (76 vs. 72 new cases per 100,000
women), black women tend to be diagnosed at an earlier age (median age 66 vs.
71), similar to men. Black women are twice as likely to be diagnosed before the
age of 50 as white women (11% vs. 5%).
Although black men are more likely to develop lung cancer than white men,
fewer than half as many black men are living with lung cancer (prevalence rate
0.13% vs. 0.30%). The prevalence for women is about the same for blacks and
whites (0.21% vs. 0.20%).
Racial differences in cancer
25

Racial differences in cancer
26

Lung cancer mortality rates have declined over time for males, but a large
disparity persists between blacks and whites (97 deaths vs. 74 deaths per
100,000 males in 2002). In contrast, the mortality rate has increased slightly
since 1990 for females, with little difference between blacks and whites
(41 deaths vs. 43 deaths per 100,000 females in 2002).
Racial differences in cancer
27
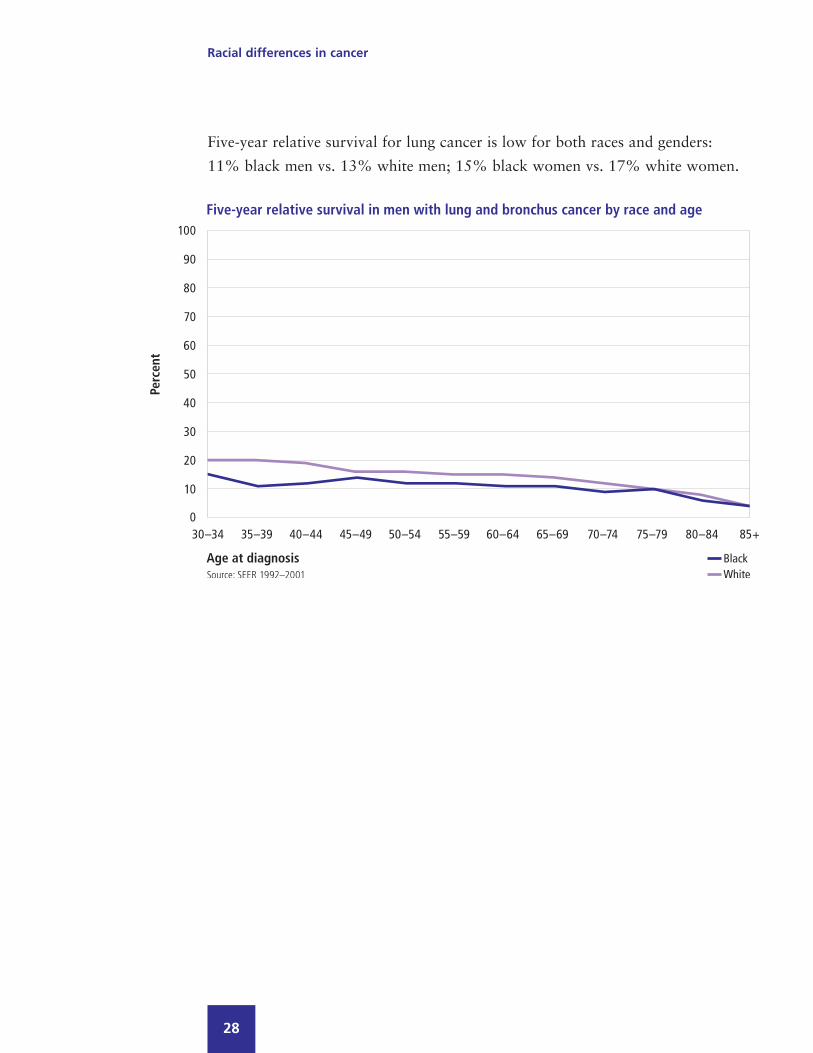
Five-year relative survival for lung cancer is low for both races and genders:
11% black men vs. 13% white men; 15% black women vs. 17% white women.
Racial differences in cancer
28

Racial differences in cancer
29
Early diagnosis of lung cancer results in the highest five-year relative survival
rates regardless of race or age. Black adults, however, are less likely to be
diagnosed early: 15% vs. 18% are diagnosed in the local stage. Survival is higher
among middle-aged adults diagnosed in the local stage compared with older
adults, although the racial disparity is greater among the middle-aged. Five-year
survival rates among middle-aged black men and women are 44% and 52%
compared with 55% and 64% among middle-aged white men and women.

Racial differences in cancer
30
Older black and white women with a local stage diagnosis have higher
five-year relative survival rates (45% and 47%) than their male counterparts
(36% and 40%).
Five-year relative survival by stage at diagnosis in adults with lung and bronchuscancer by race, gender and age
Stage at diagnosisLocal Regional Distant All stages
Age Gender Race Diagnosed Survival Diagnosed Survival Diagnosed Survival Survival% % % % % % %
40–64 Men Black 11 44 39 15 50 2 12
White 13 55 38 19 49 2 15
Women Black 16 52 39 20 45 2 16
White 18 64 36 23 46 3 21
65+ Men Black 17 36 43 9 40 1 10
White 18 40 42 12 40 1 12
Women Black 17 45 44 10 39 2 12
White 21 47 41 14 38 2 15

Racial differences in cancer
31
For both races, radiation treatment is slightly more common than surgery. Among
both genders, blacks are less likely to have surgery than whites regardless of age
group (34% vs. 40% for middle-aged men, 28% vs. 34% for older men; 43% vs.
47% for middle-aged women, 32% vs. 36% for older women). Blacks and whites
are about equally likely to have radiation therapy.

Colon and rectum
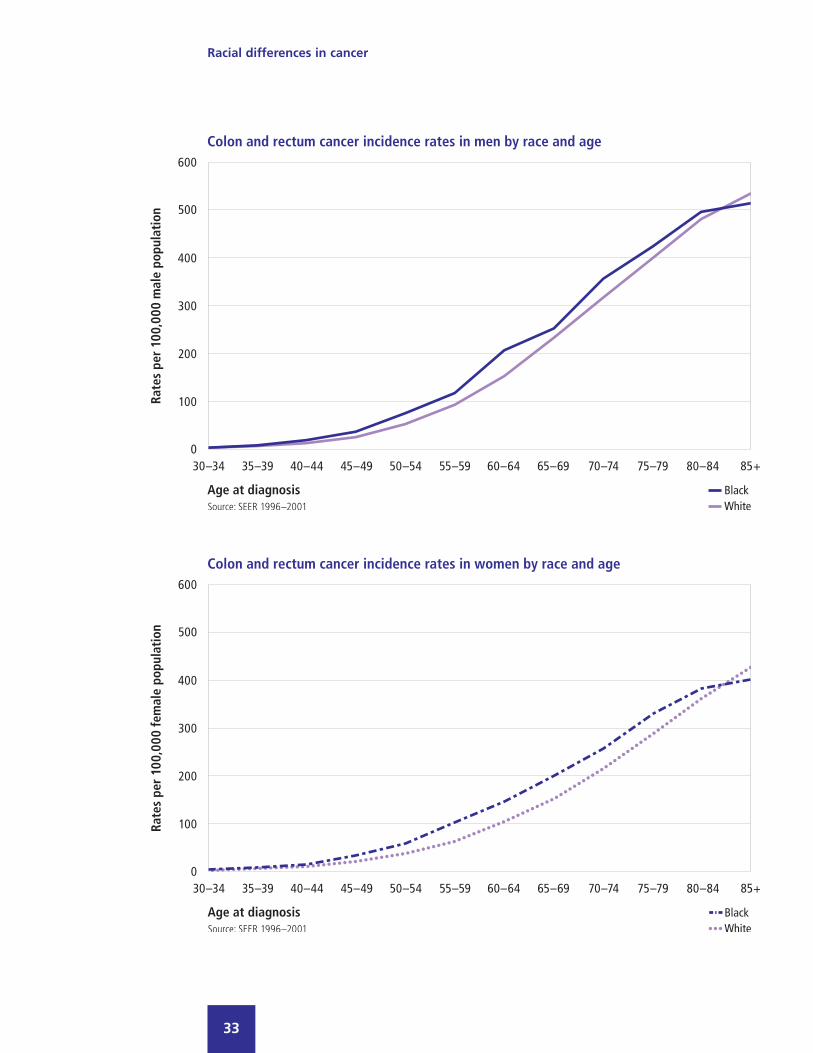
For both men and women, blacks have a higher incidence of colorectal cancer
than whites (101 vs. 89 per 100,000 men, and 79 vs. 64 per 100,000 women).
On average, blacks are likely to develop colorectal cancer at a younger age than
whites (median age 65 vs. 70 in men; 69 vs. 75 in women).
The prevalence of colorectal cancer, however, is lower among blacks (0.36% vs.
0.69% in men, and 0.39% vs. 0.63% in women), reflecting a much higher
mortality rate among blacks.
Racial differences in cancer
32
Racial differences in cancer
33

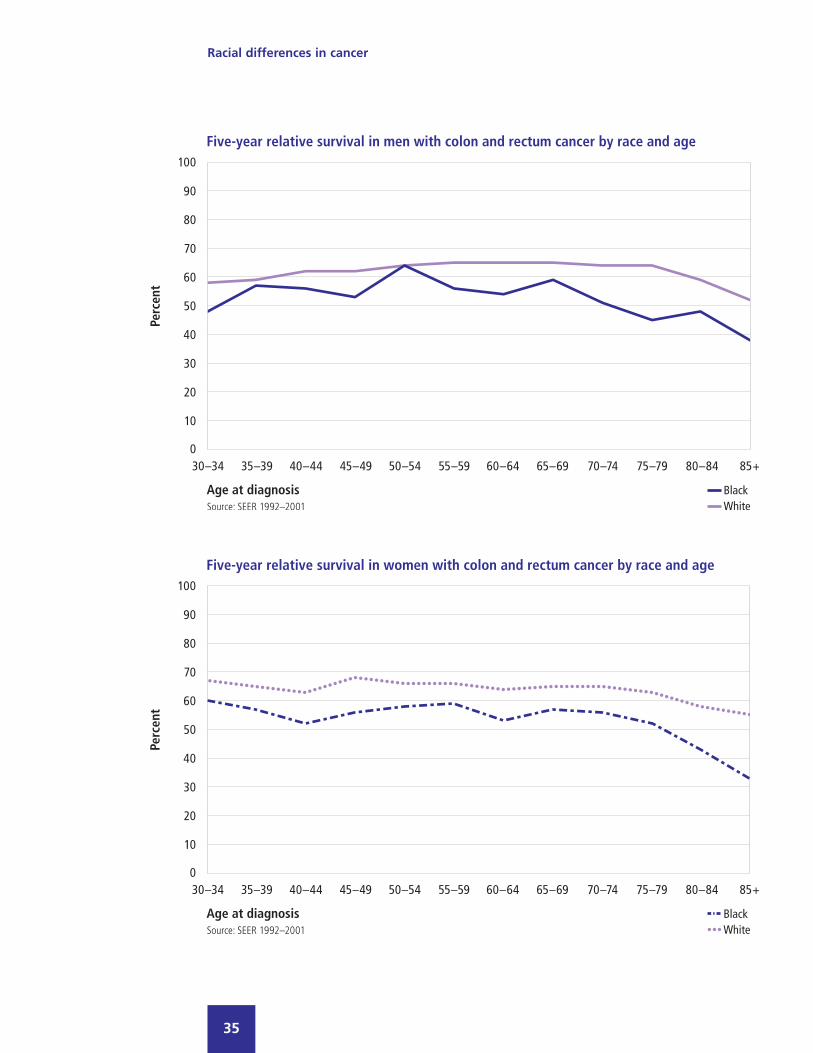
The five-year relative survival for colorectal cancer is lower for blacks than
whites regardless of age at diagnosis and stage at diagnosis. The overall relative
survival rates are 54% and 53% for black men and women, compared with
63% for both white men and women. A lower percentage of colorectal cancer
in blacks is diagnosed in the local stage compared with whites (37% vs. 41% in
men, and 37% vs. 39% in women).
Colorectal cancer mortality rates have been declining for both blacks and
whites, but the decrease has been less steep for blacks, and a large disparity
remains. In 2002, the mortality rates were 40% higher for blacks than whites
(33 vs. 23 deaths per 100,000 males, and 23 vs. 16 deaths per 100,000
females). In contrast, in 1990, mortality rates were 24% higher for black
males (37 vs. 30 deaths per 100,000 males) and 31% higher for black females
(26 vs. 20 deaths per 100,000 females).
Racial differences in cancer
34
Racial differences in cancer
35
Racial differences in cancer
36
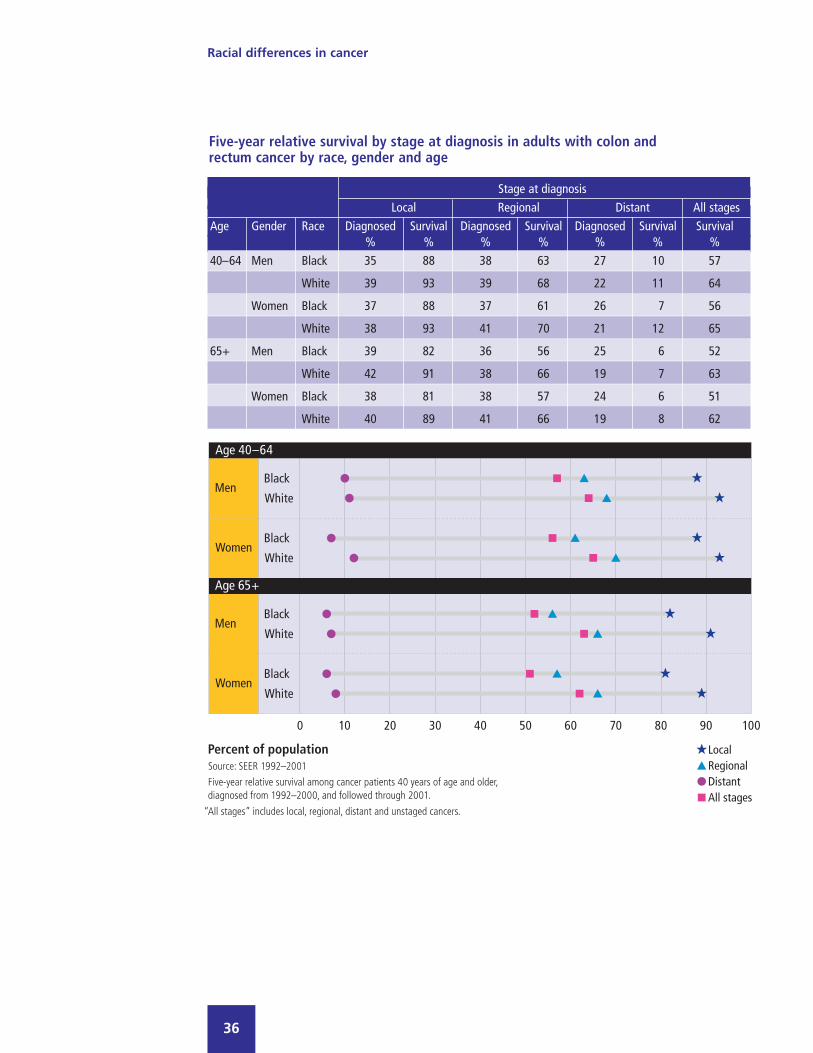
Five-year relative survival by stage at diagnosis in adults with colon and rectum cancer by race, gender and age
Stage at diagnosisLocal Regional Distant All stages
Age Gender Race Diagnosed Survival Diagnosed Survival Diagnosed Survival Survival% % % % % % %
40–64 Men Black 35 88 38 63 27 10 57
White 39 93 39 68 22 11 64
Women Black 37 88 37 61 26 7 56
White 38 93 41 70 21 12 65
65+ Men Black 39 82 36 56 25 6 52
White 42 91 38 66 19 7 63
Women Black 38 81 38 57 24 6 51
White 40 89 41 66 19 8 62

Racial differences in cancer
37
Screening for colorectal cancer presents real challenges for both races. Among
men aged 50 and older, blacks are more likely than whites never to have received
a fecal occult blood test (FOBT) (64% vs. 53%), or a sigmoidoscopy or
colonoscopy (57% vs. 48%).
The disparity is also evident for men aged 65 and older in spite of Medicare
coverage. While FOBT is covered annually, only 26% and 28% of black and
white men aged 65 and older received FOBT in the last year, and 55% and
46% have never had an FOBT. Similarly, 50% of Medicare-eligible black men
and 38% of Medicare-eligible white men have never had either a sigmoidoscopy
or colonoscopy.

Racial differences in cancer
38
Screening for colorectal cancer is also low among women. Only 21% of black
women and 22% of white women 50 and older received a FOBT in the past year.
Similar to men, Medicare-eligible women of both races are not necessarily
availing themselves of their benefits. Of women aged 65 and older, only 22%
and 25% received an FOBT in the last year. Although covered by Medicare,
52% of older black women and 42% of older white women have never been
screened for colorectal cancer using sigmoidoscopy or colonoscopy.

While surgery is performed in more than 90% of colorectal cancer cases, blacks
are slightly less likely than whites to have surgery. Blacks are also less likely to
receive radiation therapy, which occurs in fewer than 20% of cases.
Racial differences in cancer
39

Uterine cervix
Black women have a higher incidence of cervical cancer than white women, but
a lower prevalence. Age-adjusted mortality is higher in blacks, and five-year
relative survival rate is lower.
Cervical cancer affects women of all ages, but the incidence among black women
increases with age, unlike among whites. Overall, among women aged 20 and
older, the incidence of cervical cancer is 34% higher in blacks than whites (17.0
cases vs. 12.7 cases per 100,000 women). However, the disparity in incidence
widens to 50% in women between the ages of 55 to 59 (22.0 cases in blacks vs.
14.7 cases in whites per 100,000 women), and is more than two-fold in women
65 and older (30.3 cases vs. 13.1 cases per 100,000 women).
Racial differences in cancer
40

Cervical cancer mortality is much higher among black females compared with
white females. Although mortality rates declined over time for both blacks and
whites, the disparity remains strong. In 1990, there were 8 and 3 deaths per
100,000 black and white females, respectively. In 2002, the rate declined to 5
and 2 deaths, respectively.
Racial differences in cancer
41

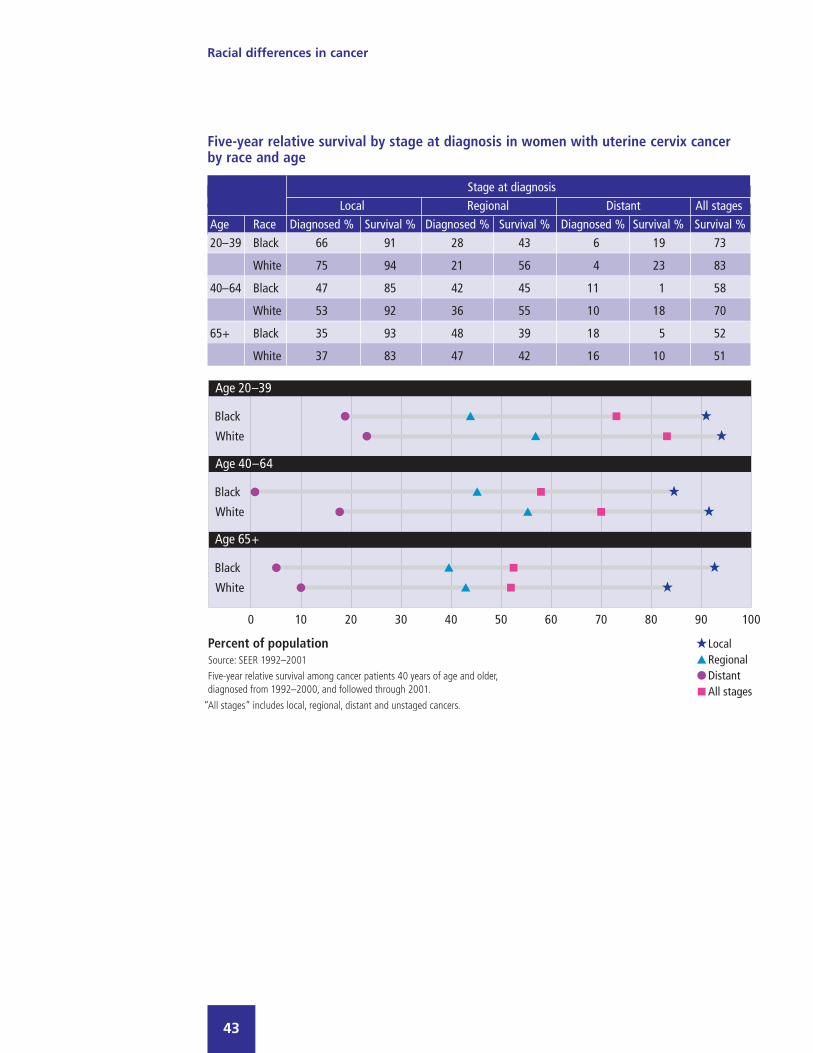
Overall, black women have a lower five-year relative survival rate for cervical
cancer than whites (61% vs. 71%). The disparity is strongest for women under
50. For black women under the age of 65, the five-year relative survival at each
stage of diagnosis is lower than the corresponding rate among whites. Blacks
are less likely than whites to be diagnosed in the local stage (49% vs. 58%).
Racial differences in cancer
42
Racial differences in cancer
43
Five-year relative survival by stage at diagnosis in women with uterine cervix cancerby race and age
Stage at diagnosisLocal Regional Distant All stages
Age Race Diagnosed % Survival % Diagnosed % Survival % Diagnosed % Survival % Survival %20–39 Black 66 91 28 43 6 19 73
White 75 94 21 56 4 23 83
40–64 Black 47 85 42 45 11 1 58
White 53 92 36 55 10 18 70
65+ Black 35 93 48 39 18 5 52
White 37 83 47 42 16 10 51

Racial differences in cancer
44
Black women are less likely than white women to receive surgery for cervical
cancer, regardless of age at diagnosis (74% vs. 81% for women aged 40 to 64,
and 52% vs. 60% for women aged 65 and older). Middle-aged black women are
more likely to receive radiation therapy than white women (59% vs. 50%), but
the rates are similar for older women (61% vs. 60%).
Racial differences in cancer
45
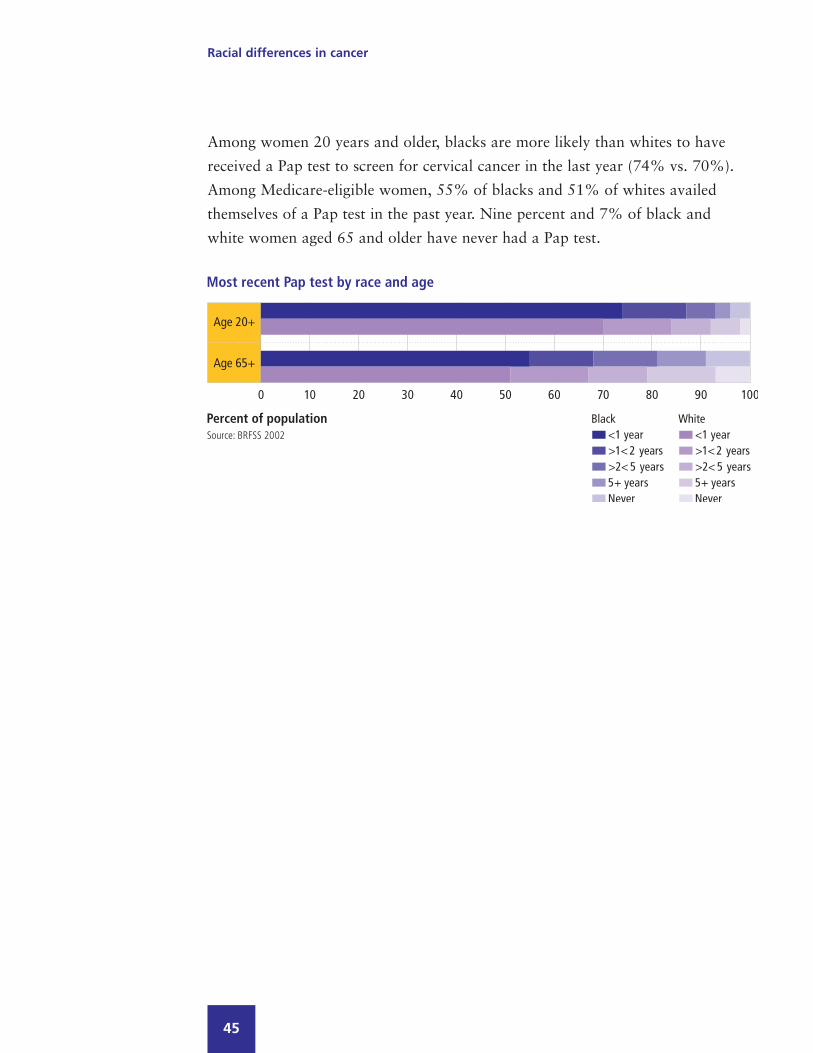
Among women 20 years and older, blacks are more likely than whites to have
received a Pap test to screen for cervical cancer in the last year (74% vs. 70%).
Among Medicare-eligible women, 55% of blacks and 51% of whites availed
themselves of a Pap test in the past year. Nine percent and 7% of black and
white women aged 65 and older have never had a Pap test.


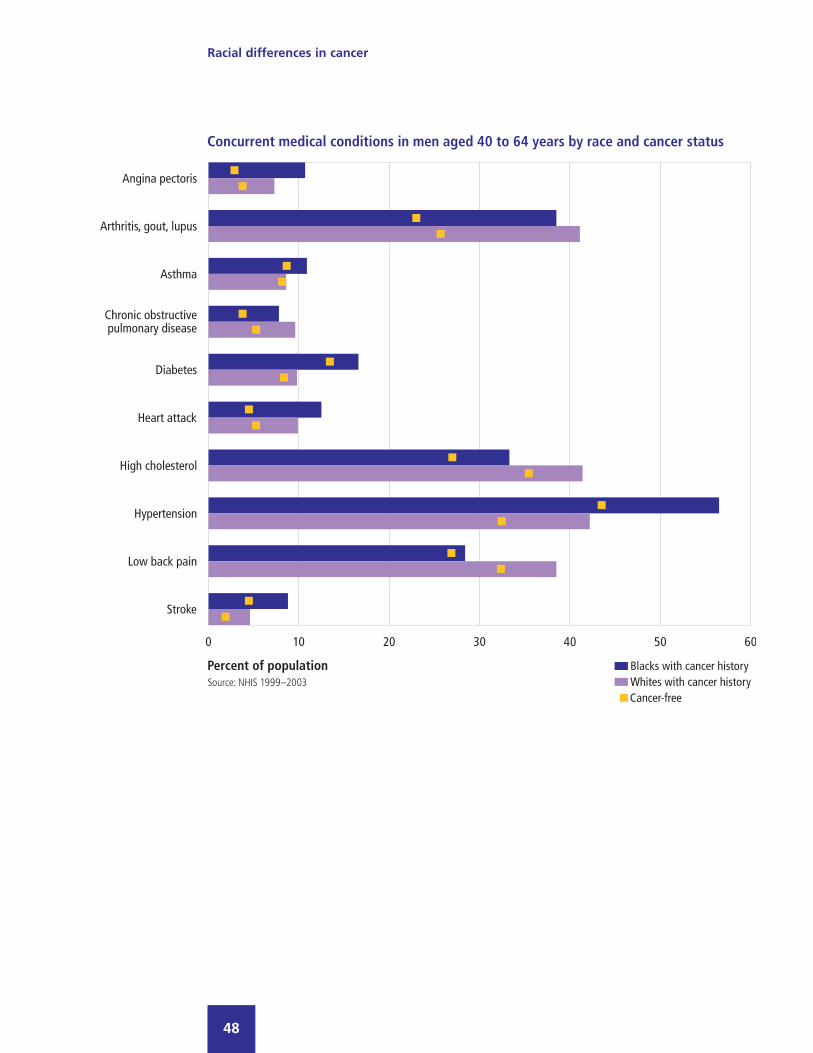
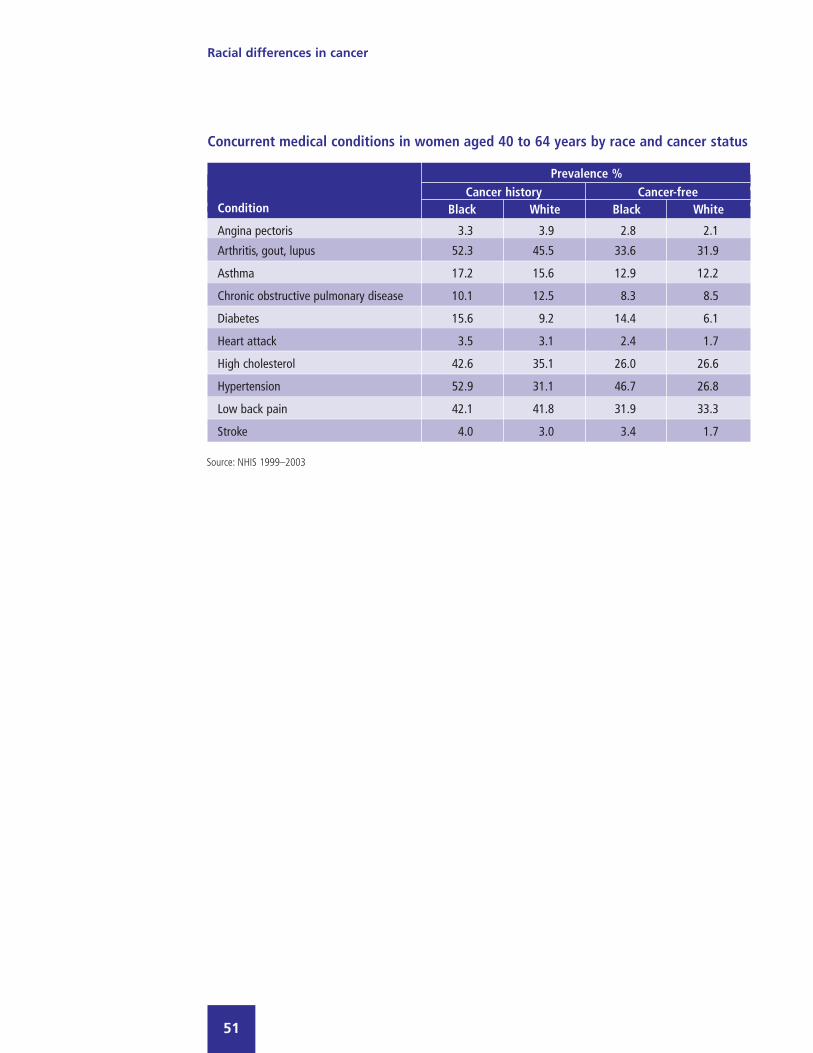
Concurrent medical conditionsRegardless of race, middle-aged and older adults, including those with a cancer
history, are frequently burdened by a variety of chronic diseases. Some pre-
existing concurrent conditions may impact cancer treatment decisions and affect
patient response to treatment. The concurrent medical conditions selected for
comparisons are conditions with particularly high diagnosed prevalence or costs
in the US population.
One consideration in comparing populations with and without cancer history
is their similarity with respect to age. Among middle-aged men, the mean age for
blacks and whites with cancer history is 55; for those who are cancer free, the
mean age is 50 for blacks, and 51 for whites. Among middle-aged women, the
mean age for blacks and whites with cancer history is 52 and 53 respectively;
for those who are cancer free, the mean age is 50 for both races.
Blacks have a higher prevalence of hypertension and diabetes than whites,
regardless of cancer status, age, or gender. Among middle-aged men with a
history of cancer, the prevalence of hypertension is 36% higher in blacks than
whites (57% vs. 42%), and the prevalence of diabetes is 70% higher (17% vs.
10%). The disparity in hypertension prevalence is even greater among middle-
aged women with cancer (53% vs. 31%; 70% higher for black women compared
with white women), while the diabetes disparity is about the same (16% vs. 9%;
70% higher for black women compared with white women).
Racial differences in cancer
47
Racial differences in cancer
48

Racial differences in cancer
49
Concurrent medical conditions in men aged 40 to 64 years by race and cancer status
Prevalence %Cancer history Cancer-free
Condition Black White Black White
Angina pectoris 10.7 7.3 2.9 3.8
Arthritis, gout, lupus 38.5 41.1 23.1 25.8
Asthma 10.9 8.6 8.7 8.2
Chronic obstructive pulmonary disease 7.8 9.6 3.8 5.3
Diabetes 16.6 9.8 13.5 8.4
Heart attack 12.5 9.9 4.5 5.3
High cholesterol 33.3 41.4 27.1 35.6
Hypertension 56.5 42.2 43.7 32.6
Low back pain 28.4 38.5 27.0 32.5
Stroke 8.8 4.6 4.5 1.9
.Source: NHIS 1999–2003

Racial differences in cancer
50
Racial differences in cancer
51
Concurrent medical conditions in women aged 40 to 64 years by race and cancer status
Prevalence %Cancer history Cancer-free
Condition Black White Black White
Angina pectoris 3.3 3.9 2.8 2.1
Arthritis, gout, lupus 52.3 45.5 33.6 31.9
Asthma 17.2 15.6 12.9 12.2
Chronic obstructive pulmonary disease 10.1 12.5 8.3 8.5
Diabetes 15.6 9.2 14.4 6.1
Heart attack 3.5 3.1 2.4 1.7
High cholesterol 42.6 35.1 26.0 26.6
Hypertension 52.9 31.1 46.7 26.8
Low back pain 42.1 41.8 31.9 33.3
Stroke 4.0 3.0 3.4 1.7
.Source: NHIS 1999–2003

Among older men with a history of cancer, blacks are less likely than whites to
have had a heart attack or angina, but more likely to have had a stroke. Some of
these findings may be partly attributable to differing survival rates between races
for cardiovascular and cerebrovascular disease. Among older women with history
of cancer, blacks are more likely than whites to have high cholesterol or to have
had a prior heart attack, but less likely to report having had lower back pain.
Racial differences in cancer
52

Racial differences in cancer
53
Concurrent medical conditions in men aged 65 years and older by race andcancer status
Prevalence %Cancer history Cancer-free
Condition Black White Black White
Angina pectoris 5.2 12.9 4.5 11.2
Arthritis, gout, lupus 55.0 48.2 35.3 44.1
Asthma 9.4 7.9 6.5 7.4
Chronic obstructive pulmonary disease 9.8 13.7 8.3 10.8
Diabetes 24.1 17.7 25.8 17.0
Heart attack 10.5 20.1 11.4 16.9
High cholesterol 37.1 44.2 33.3 40.3
Hypertension 69.3 55.0 68.1 50.7
Low back pain 28.0 31.7 26.5 26.4
Stroke 17.5 10.1 12.0 9.3
.Source: NHIS 1999–2003

Racial differences in cancer
54
Racial differences in cancer
55
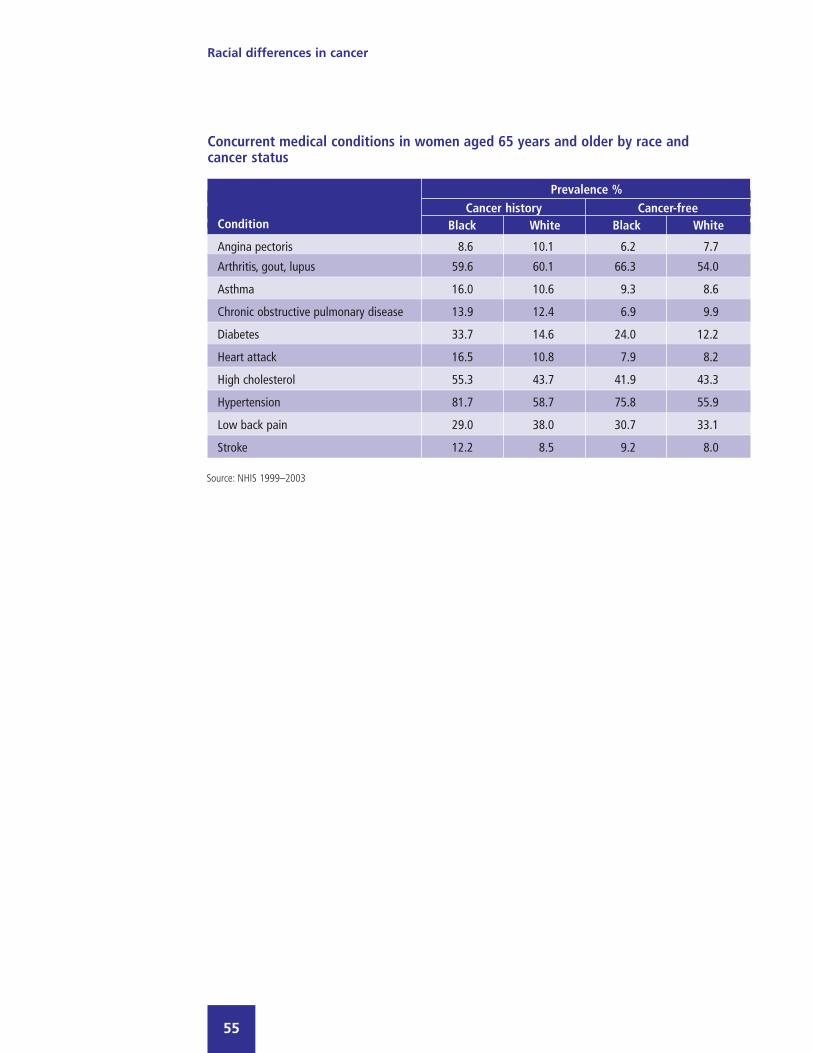
Concurrent medical conditions in women aged 65 years and older by race andcancer status
Prevalence %Cancer history Cancer-free
Condition Black White Black White
Angina pectoris 8.6 10.1 6.2 7.7
Arthritis, gout, lupus 59.6 60.1 66.3 54.0
Asthma 16.0 10.6 9.3 8.6
Chronic obstructive pulmonary disease 13.9 12.4 6.9 9.9
Diabetes 33.7 14.6 24.0 12.2
Heart attack 16.5 10.8 7.9 8.2
High cholesterol 55.3 43.7 41.9 43.3
Hypertension 81.7 58.7 75.8 55.9
Low back pain 29.0 38.0 30.7 33.1
Stroke 12.2 8.5 9.2 8.0
.Source: NHIS 1999–2003


Behavioral risk factorsSmoking is a well-known risk factor for some cancers, including cancer of the
lung, pharynx, esophagus, bladder, kidney and stomach. For both men and
women, and across age groups, blacks are less likely to report a history of
smoking than whites (37% vs. 49% overall).
A different pattern emerges when looking only at men with cancer history,
however. Black men with a history of cancer are more likely to have smoked
than white men with cancer history (75% vs. 65%). Black women, regardless of
cancer status, are less likely to have smoked than white women (38% vs. 55%
for those with cancer history, and 30% vs. 43% for those who are cancer-free).
Racial differences in cancer
57
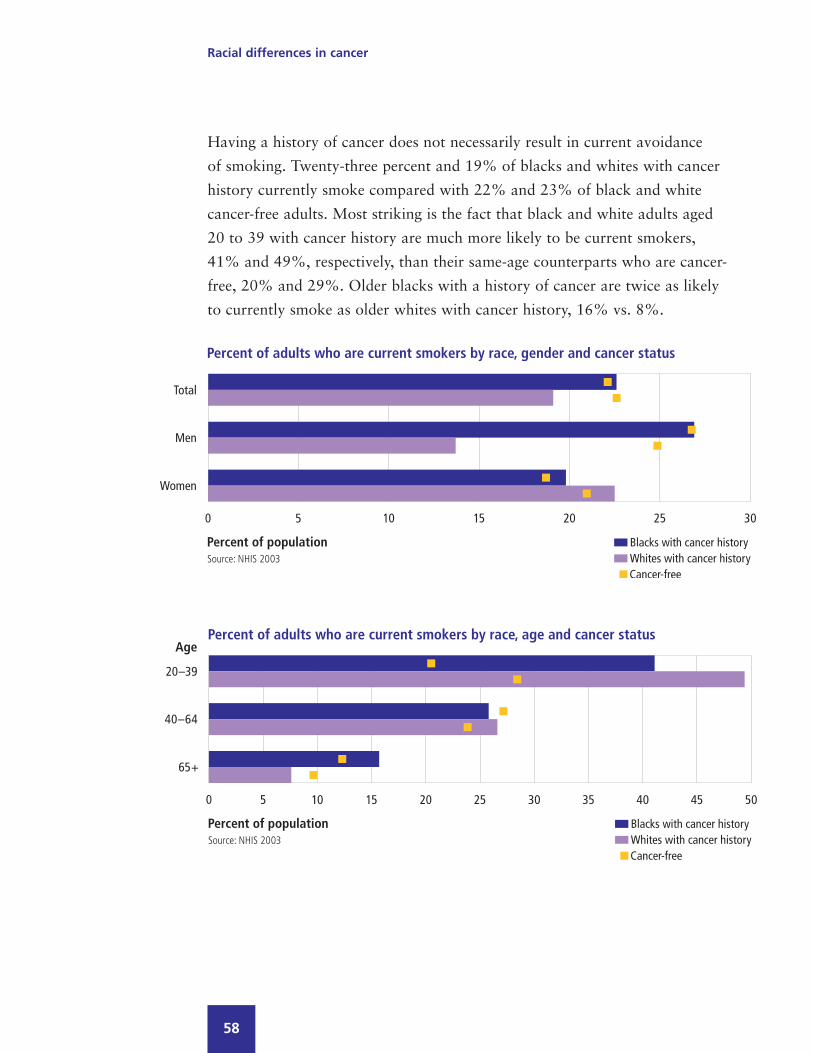
Having a history of cancer does not necessarily result in current avoidance
of smoking. Twenty-three percent and 19% of blacks and whites with cancer
history currently smoke compared with 22% and 23% of black and white
cancer-free adults. Most striking is the fact that black and white adults aged
20 to 39 with cancer history are much more likely to be current smokers,
41% and 49%, respectively, than their same-age counterparts who are cancer-
free, 20% and 29%. Older blacks with a history of cancer are twice as likely
to currently smoke as older whites with cancer history, 16% vs. 8%.
Racial differences in cancer
58

Lack of physical activity is another lifestyle factor that may increase risk for
certain cancers, including colorectal and breast cancer. Although a substantial
number of persons in both races report that they do not exercise regularly, black
men and women are much less likely to engage in vigorous or moderate exercise
than white men and women.
Racial differences in cancer
59

Obesity may increase the risk of pancreatic cancer, and breast cancer in post-
menopausal women.
Overall, and by gender, blacks with and without cancer are much more likely
to be obese than their white counterparts. Among women with cancer history,
47% of blacks and 22% of whites are obese.
Racial differences in cancer
60


Demographic characteristics andenvironmental issuesThis section presents information on demographic characteristics and healthcare
environment issues regardless of cancer history, in an effort to understand how
these factors may impact disparities in the burden of cancer between black and
white adults.
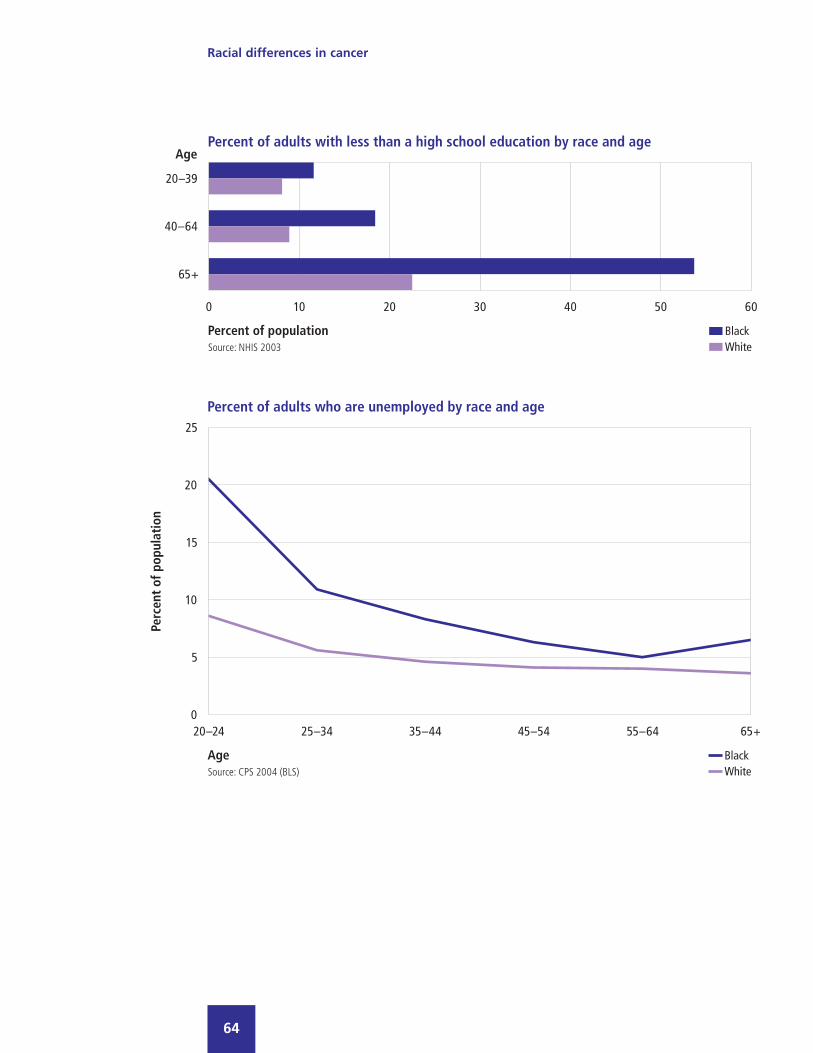
Twenty percent of black adults and 11% of white adults have less than a high
school education; this gap is smallest among the youngest age group, 12%
and 8%, respectively. The unemployment rate for adults aged 20 and older is
higher among blacks than whites, 10% vs. 5%. Among those aged 20 to 24,
the black unemployment rate is more than twice the white unemployment rate,
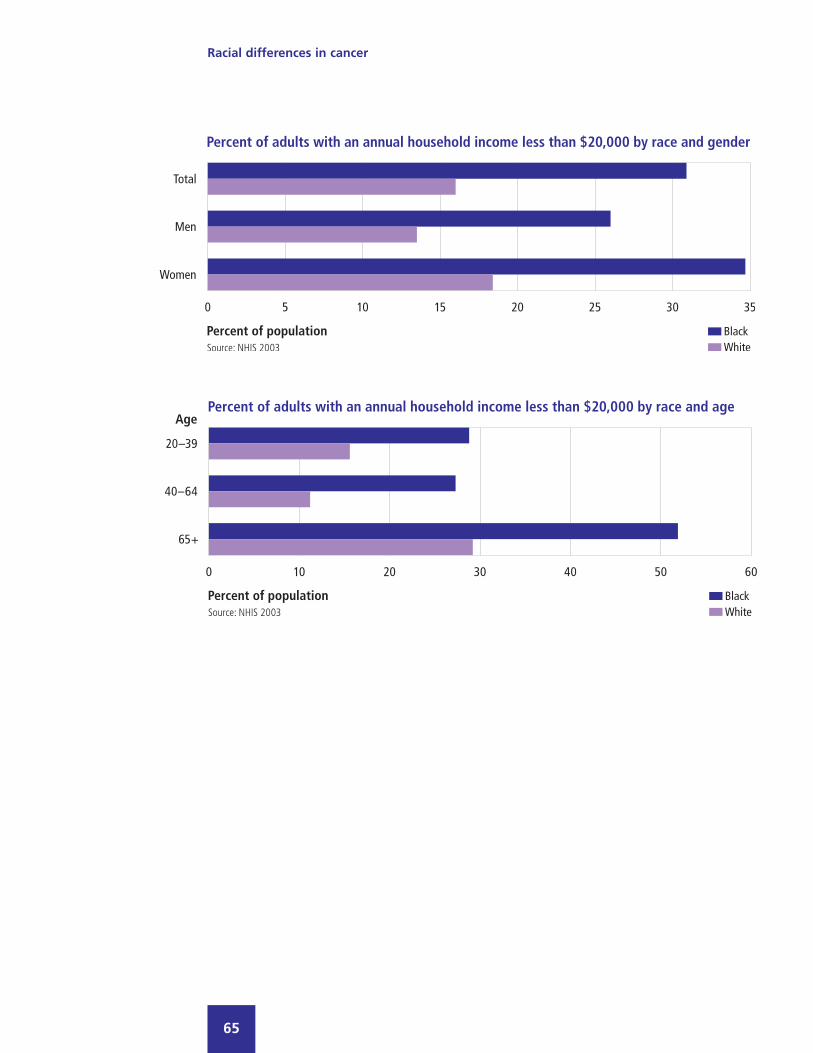
21% vs. 9%. Thirty-one percent of black adults and 16% of white adults report
an annual household income of less than $20,000. Blacks report a lower rate
than whites of being married or partnered, 46% vs. 68%.
Racial differences in cancer
63
Racial differences in cancer
64
Racial differences in cancer
65

Racial differences in cancer
66

Racial differences in cancer
67
Nineteen percent of black men and 9% of black women have no usual source of
care. Regardless of race, men are less likely than women to have a usual source
of care, as are adults aged 20 through 39.
Blacks overall, by gender and across all age groups, are more likely than whites
to report that their usual place of care is a clinic, hospital emergency room, or
hospital outpatient facility, rather than a doctor’s office. Twenty-one percent of
blacks and 14% of whites report that their usual place of care is a clinic, hospital
emergency room, or hospital outpatient facility. Sixty-four percent of blacks and
74% of whites report that their usual place of care is a doctor’s office. Regardless
of race, men are less likely than women to have been seen by a doctor in the past
year. Twenty-five percent of black men and 22% of white men have not been to
a doctor in the past year, compared with 13% and 10% of black and white
women, respectively.

Racial differences in cancer
68
Racial differences in cancer
69
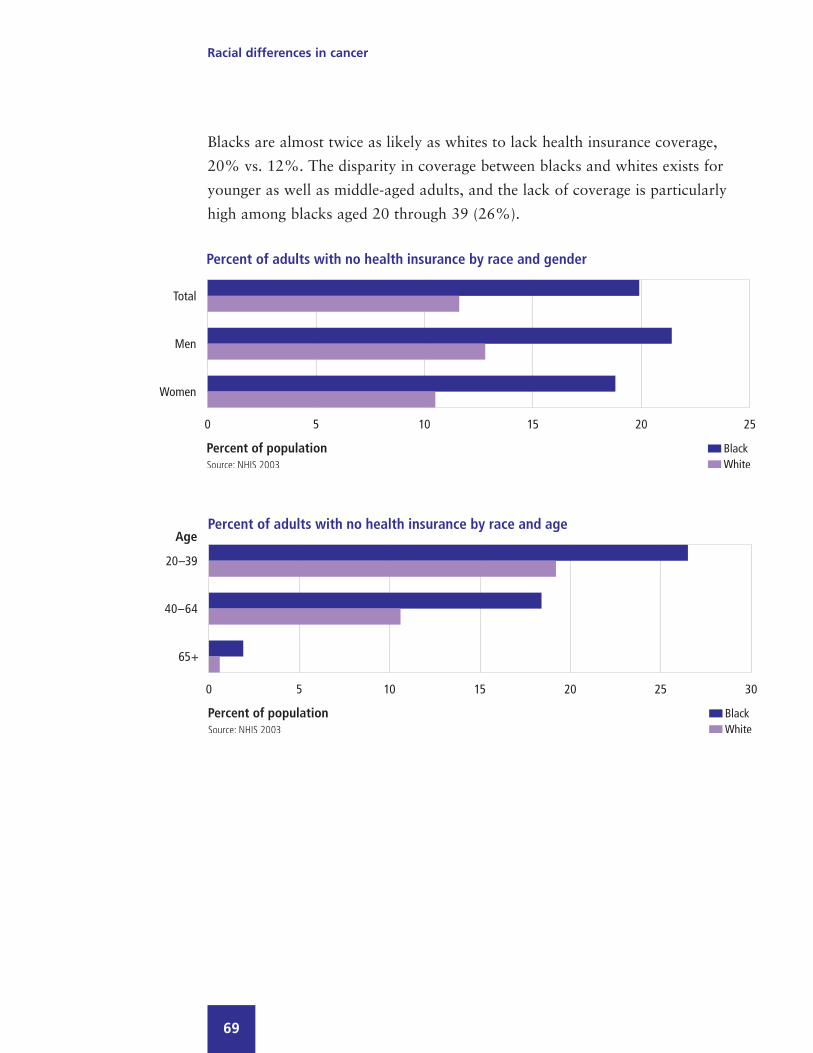
Blacks are almost twice as likely as whites to lack health insurance coverage,
20% vs. 12%. The disparity in coverage between blacks and whites exists for
younger as well as middle-aged adults, and the lack of coverage is particularly
high among blacks aged 20 through 39 (26%).

Racial differences in cancer
70
Blacks are less likely than whites to have private health insurance, 56% vs. 76%.
The percentage of blacks with Medicaid coverage (a means-tested program) is
three-fold greater than that of whites, 13% vs. 4%.
Fifty-six percent of blacks and 73% of whites aged 20 to 39 have private health
insurance; coverage increases slightly to 60% and 79%, respectively, among
adults 40 to 64. Blacks 65 and older are more likely than whites to be covered
solely by Medicare, 38% vs. 20%, and are more likely to have dual eligibility
coverage (i.e., Medicare and Medicaid), 15% vs. 4%. Only 28% of blacks 65
and older supplement Medicare with private insurance, compared with 63% of
older white adults.
Among persons with private health insurance, blacks are more likely than whites
to be enrolled in health maintenance organizations (HMO), 50% vs. 33%.


Appendix I: Methods
Data SourcesSurveillance, Epidemiology, and End Results (SEER) Program, 1992–2001US Department of Health and Human ServicesUS National Institutes of HealthNational Cancer Institute
The SEER Program of the National Cancer Institute is an authoritative source of informationon cancer incidence and survival in the United States. The SEER Program began collectingdata on cancer cases in 1973 and currently collects and publishes cancer incidence and sur-vival data from 14 population-based cancer registries and three supplemental registries cover-ing approximately 26% of the US population. The population-based data include stage ofcancer at the time of diagnosis and survival rates within each stage. Information on morethan 3 million in situ and invasive cancer cases is included in the SEER database and neo-plasms are coded using the International Classification of Diseases for Oncology (ICD-O).The population covered by SEER is comparable to the general US population with regard tomeasures of poverty and education. Approximately 170,000 new cases are added each yearwithin the SEER coverage areas. Adults aged 20 and older were selected for these analyses,and SEER incidence rates were age-adjusted to the 2000 US standard population aged 20and older.
National Health Interview Survey (NHIS), 1999–2003US Department of Health and Human ServicesCenters for Disease Control and PreventionNational Center for Health Statistics
NHIS is a nationally representative interview survey based on a sample of the civiliannon-institutionalized US population, including approximately 30,000 persons over the ageof 20. Surveys in the series have been conducted annually since 1957, with the last majorrestructuring occurring in 1997. The survey consists of personal interviews in a population-based national sample. Adults aged 20 and older were selected for these analyses.Approximately 36,000 adults are sampled annually.
Compressed Mortality File (CMF), 1990–2002US Department of Health and Human ServicesCenters for Disease Control and Prevention (CDC)National Center for Health Statistics
CMF is a county-level national mortality and population database. Counts and rates ofdeath can be obtained by place of residence (US, state, and county), age (16 groups), race(white, black, American Indian/Alaskan Native, Asian/Pacific Islander and other), gender,year, and underlying cause of death. Death rates shown in this fact book reflect the totalpopulation and are age-adjusted to the 2000 US standard population. Diagnostic classifica-tions for malignant neoplasms were based on the International Classification of Diseases,Ninth Revision, Clinical Modification (ICD-9-CM) codes 140 through 208 for years 1990through 1998, and ICD-10-CM codes C00 through C97 for years 1999 through 2002.
CDC WONDER On-line mortality database http://wonder.cdc.gov/Accessed: March 8, 2005.
Racial differences in cancer
73
Medical Expenditure Panel Survey (MEPS), 1998–2002US Department of Health and Human ServicesPublic Health ServiceAgency for Healthcare Research and Quality (AHRQ)
MEPS, conducted by the Agency for Healthcare Research and Quality (AHRQ) and theNational Center for Health Statistics (NCHS), collects data on healthcare use, expenditures,sources of payment, and insurance coverage. MEPS combines household-reported informa-tion with information obtained from providers, primarily on expenditures by source of pay-ment. Provider data are obtained through a supplemental follow-back survey of hospitalevents, physician office visits, and home healthcare. Payment information for prescriptionmedications is obtained directly from pharmacies. MEPS panel participants comprise anational probability sample representative of the US civilian non-institutionalized population,selected from households interviewed in the National Health Interview Survey (NHIS). Thetotal number of adults aged 20 years and older that participated in the surveys from 1998through 2002 is 57,660. Direct medical expenses reported in this fact book are adjusted toyear 2002 dollars. Because MEPS does not distinguish between primary and secondary diag-noses at an associated event, there is a possibility of double-counting expenses when theevent has more than one condition coded. As a result, when spending estimates are totaledover all conditions, some expenses will be double-counted.
Behavioral Risk Factor Surveillance System (BRFSS), 2002US Department of Health and Human ServicesCenters for Disease Control and Prevention (CDC)
The BRFSS is an ongoing system of surveys conducted by state health departments in cooper-ation with the CDC. The methods used are generally comparable from state to state andfrom year to year, allowing states to compare their risk factor prevalence with national dataand monitor the effects of interventions over time. The national probability sample interviewsare conducted by telephone and interview questions cover selected health issues and preven-tive health measures. In order to provide adequate sample sizes for smaller geographicallydefined populations of interest, some states are sampled disproportionately.
Current Population Survey (CPS), 2004US Department of LaborBureau of Labor Statistics (BLS)
The Current Population Survey (CPS), a monthly survey conducted by the Bureau of theCensus for the Bureau of Labor Statistics, is the primary source of information on thelabor force characteristics of the US population. The sample of about 50,000 households isscientifically selected to represent the civilian non-institutionalized population. Membersof sampled households 16 years of age and older are interviewed to obtain information ontheir employment status. Statistics derived from the CPS include employment, unemploymentrate, earnings, hours of work, and related indicators. This report includes unemploymentdata for the first quarter of 2004 among adults 20 years of age and older.
Racial differences in cancer
74

Definitions
Disease and risk factor definitions
Behavioral risk factorsEver-smoked: A person has “ever-smoked” if he/she smoked 100 or more cigarettes inhis/her lifetime.
Current smoker: A current smoker is defined as someone who has smoked 100 or morecigarettes in his/her lifetime and smokes every day or some days.
Obesity: A person was classified as obese if his/her body mass index (BMI) (weight inkilograms divided by height in meters squared), based on self-reported measurements,was greater than or equal to 30.
Lack of exercise: A person was classified as lacking exercise if he/she responded “never”to the questions “How often do you do VIGOROUS activities for at least 10 minutes thatcause heavy sweating or large increases in breathing or heart rate?” and “How often doyou do LIGHT OR MODERATE activities for at least 10 minutes that cause only lightsweating or a slight to moderate increase in breathing or heart rate?”
Cancer stagesThe extent of cancer spread at the time of diagnosis:
In situ: Refers to a pre-invasive cancer, confined to the site of origin.
Local: An invasive malignant cancer confined entirely to the organ where the cancer began.
Regional: Refers to a cancer that has spread to the body area adjacent to the primary tumor.
Distant: Refers to cancer that has spread from the original (primary) tumor to distant organsor distant lymph nodes; also known as distant metastasis.
All stages: Refers to local, regional, and distant as well as unstaged cancers.
Concurrent medical conditions and cancers (from NHIS)These were self-reported in response to the following questions:
For concurrent medical conditions—“Have you ever been told by a doctor or other healthprofessional that you have X?” with two exceptions:
Low back pain: Persons who reported having had low back pain in the past three months.
Chronic obstructive pulmonary disease: Persons who reported being told by a doctor orother health professional that they had emphysema or chronic bronchitis.
For cancers—“Have you ever been told by a doctor or other health professional that youhad cancer or a malignancy of any kind?”
Racial differences in cancer
75

Other definitions
Disease or condition ratesAge-adjusted incidence: The incidence percentage adjusted for differences in the agedistribution between the population of interest and a standard population.
Incidence: The number of new cases of a disease in a given time period among the populationat risk of the disease.
Prevalence percentage: Persons diagnosed with the disease or condition as a percentageof the population. Prevalence by years since diagnosis calculated as prevalence by current age(years) minus age at diagnosis (years).
Relative survival rate: The ratio of the observed survival rate for the patient group to theexpected survival rate for persons in the general population similar to the patient group withrespect to age, sex, race, and calendar year of observation. The relative survival rate is anestimate of the chance of surviving the effects of cancer.
Source of paymentThe payer source for medical care and health services reported in the Medical ExpenditurePanel Survey:
Private: Private insurance.
Medicaid: A jointly funded federal and state program that pays for medical and healthrelated services for eligible individuals and families with low incomes.
Medicare: The national health insurance program for adults 65 years of age and older,and other eligible adults who are disabled or have end-stage renal disease.
Other insurance: Primarily Workers’ Compensation and other insurance, such as home-owners’.
Other public insurance: Department of Veterans Affairs, Department of Defense, Tricare,Indian Health Service, and other federal, state, and local government, and other publicinsurance types.
Self-pay: Co-pays and other out-of-pocket expenses.
Racial differences in cancer
76
Racial differences in cancer
77
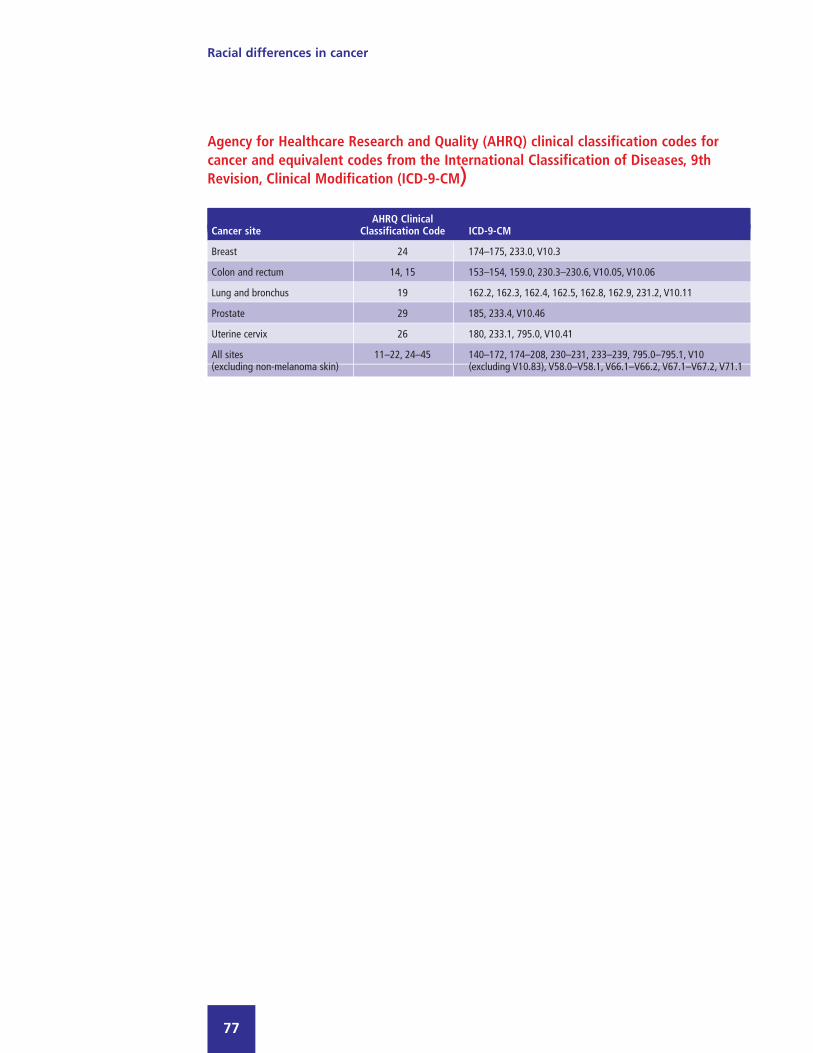
Agency for Healthcare Research and Quality (AHRQ) clinical classification codes forcancer and equivalent codes from the International Classification of Diseases, 9thRevision, Clinical Modification (ICD-9-CM)
AHRQ Clinical Cancer site Classification Code ICD-9-CM
Breast 24 174–175, 233.0, V10.3
Colon and rectum 14, 15 153–154, 159.0, 230.3–230.6, V10.05, V10.06
Lung and bronchus 19 162.2, 162.3, 162.4, 162.5, 162.8, 162.9, 231.2, V10.11
Prostate 29 185, 233.4, V10.46
Uterine cervix 26 180, 233.1, 795.0, V10.41
All sites 11–22, 24–45 140–172, 174–208, 230–231, 233–239, 795.0–795.1, V10(excluding non-melanoma skin) (excluding V10.83), V58.0–V58.1, V66.1–V66.2, V67.1–V67.2, V71.1

Racial differences in cancer
78
Appendix II: Incidence and prevalence of selectedcancers in black and white adults
Incidence rates per 100,000 at risk
Cancer Black White
Total 721.5 665.2 Men 965.8 774.3 Women 558.9 594.8 Age 20–39 65.0 77.7 Age 40–64 617.9 550.3 Age 65+ 2,317.7 2,236.5 Total 168.6 197.5 Women 168.6 197.5 Age 20–39 28.7 24.9 Age 40–64 203.4 240.0 Age 65+ 381.0 477.7 Total 87.6 74.9 Men 101.0 88.9 Women 78.7 64.3 Age 20–39 3.9 3.2 Age 40–64 61.4 46.0 Age 65+ 316.5 303.6 Total 112.8 88.0 Men 166.8 110.3 Women 76.3 72.2 Age 20–39 2.5 1.5 Age 40–64 90.8 59.5 Age 65+ 394.3 346.3 Total 379.9 233.2 Men 379.9 233.2 Age 20–39 0.4 0.2 Age 40–64 266.8 150.3 Age 65+ 1,438.2 942.3 Total 17.0 12.7 Women 17.0 12.7 Age 20–39 7.4 9.5 Age 40–64 20.2 15.7 Age 65+ 30.2 12.9
Source: SEER 1996–2001Note: Total incidence rates are age- and sex-adjusted.Gender-specific incidence rates are age-adjusted.Total cancer excludes basal and squamous cell skincancer and carcinomas in situ.
Total
Breast
Colon and rectum
Lung and bronchus
Prostate
Uterine cervix
Racial differences in cancer
79
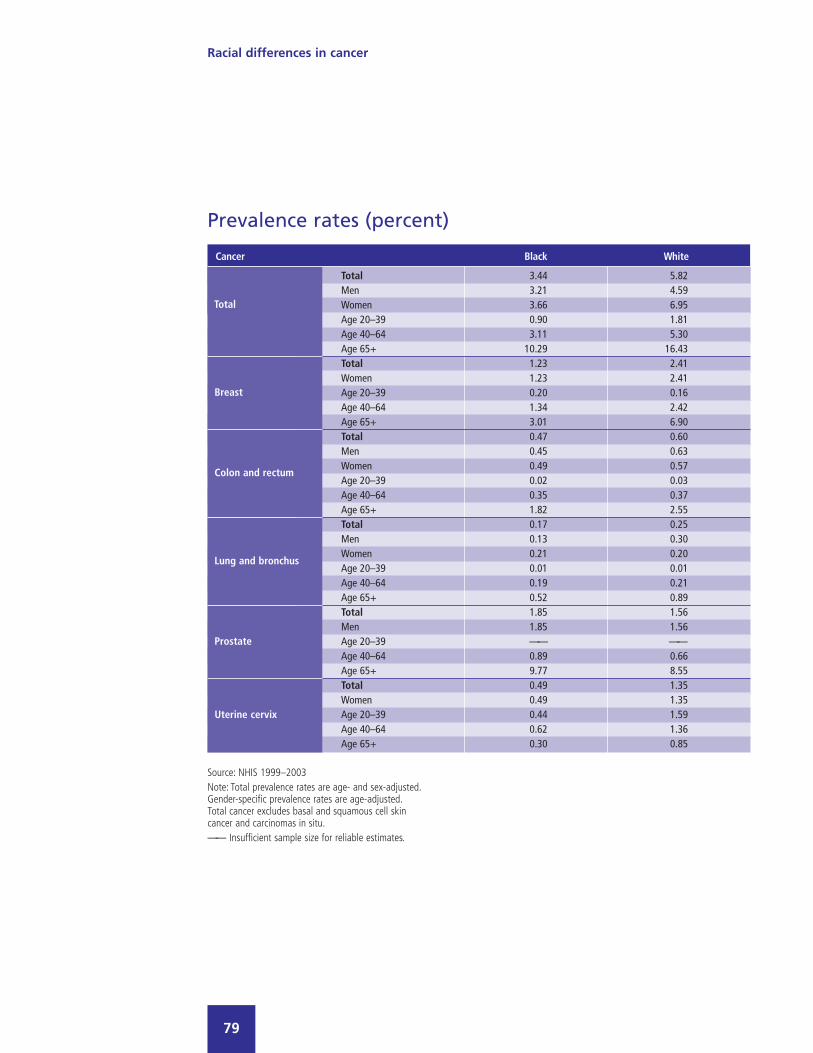
Prevalence rates (percent)
Cancer Black White
Total 3.44 5.82 Men 3.21 4.59 Women 3.66 6.95 Age 20–39 0.90 1.81 Age 40–64 3.11 5.30 Age 65+ 10.29 16.43 Total 1.23 2.41 Women 1.23 2.41 Age 20–39 0.20 0.16 Age 40–64 1.34 2.42 Age 65+ 3.01 6.90 Total 0.47 0.60 Men 0.45 0.63 Women 0.49 0.57 Age 20–39 0.02 0.03 Age 40–64 0.35 0.37 Age 65+ 1.82 2.55 Total 0.17 0.25 Men 0.13 0.30 Women 0.21 0.20 Age 20–39 0.01 0.01 Age 40–64 0.19 0.21 Age 65+ 0.52 0.89 Total 1.85 1.56 Men 1.85 1.56 Age 20–39 —— ——Age 40–64 0.89 0.66 Age 65+ 9.77 8.55 Total 0.49 1.35 Women 0.49 1.35 Age 20–39 0.44 1.59 Age 40–64 0.62 1.36 Age 65+ 0.30 0.85
Source: NHIS 1999–2003Note: Total prevalence rates are age- and sex-adjusted.Gender-specific prevalence rates are age-adjusted.Total cancer excludes basal and squamous cell skincancer and carcinomas in situ.—— Insufficient sample size for reliable estimates.
Total
Breast
Colon and rectum
Lung and bronchus
Prostate
Uterine cervix
Racial differences in cancer
80
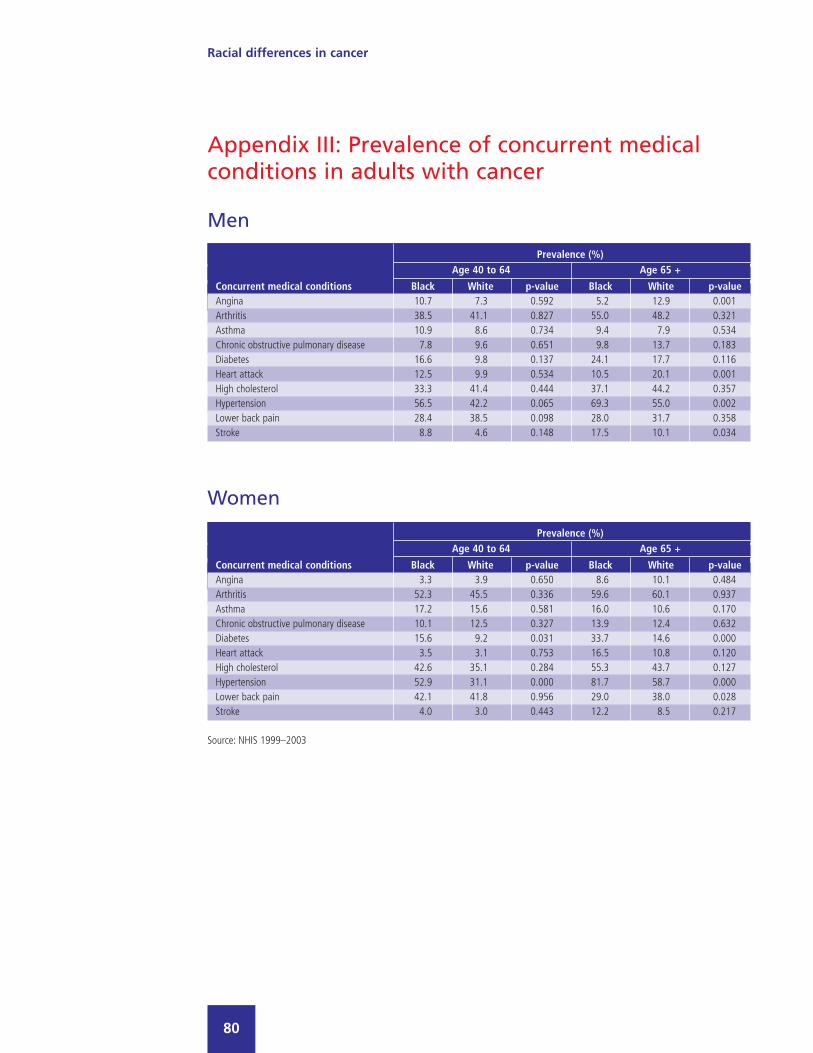
Appendix III: Prevalence of concurrent medicalconditions in adults with cancer
Prevalence (%)Age 40 to 64 Age 65 +
Concurrent medical conditions Black White p-value Black White p-valueAngina 10.7 7.3 0.592 5.2 12.9 0.001Arthritis 38.5 41.1 0.827 55.0 48.2 0.321Asthma 10.9 8.6 0.734 9.4 7.9 0.534Chronic obstructive pulmonary disease 7.8 9.6 0.651 9.8 13.7 0.183Diabetes 16.6 9.8 0.137 24.1 17.7 0.116Heart attack 12.5 9.9 0.534 10.5 20.1 0.001High cholesterol 33.3 41.4 0.444 37.1 44.2 0.357Hypertension 56.5 42.2 0.065 69.3 55.0 0.002Lower back pain 28.4 38.5 0.098 28.0 31.7 0.358Stroke 8.8 4.6 0.148 17.5 10.1 0.034
Prevalence (%)Age 40 to 64 Age 65 +
Concurrent medical conditions Black White p-value Black White p-valueAngina 3.3 3.9 0.650 8.6 10.1 0.484Arthritis 52.3 45.5 0.336 59.6 60.1 0.937Asthma 17.2 15.6 0.581 16.0 10.6 0.170Chronic obstructive pulmonary disease 10.1 12.5 0.327 13.9 12.4 0.632Diabetes 15.6 9.2 0.031 33.7 14.6 0.000Heart attack 3.5 3.1 0.753 16.5 10.8 0.120High cholesterol 42.6 35.1 0.284 55.3 43.7 0.127Hypertension 52.9 31.1 0.000 81.7 58.7 0.000Lower back pain 42.1 41.8 0.956 29.0 38.0 0.028Stroke 4.0 3.0 0.443 12.2 8.5 0.217
Women
Men
Source: NHIS 1999–2003
Racial differences in cancer
81
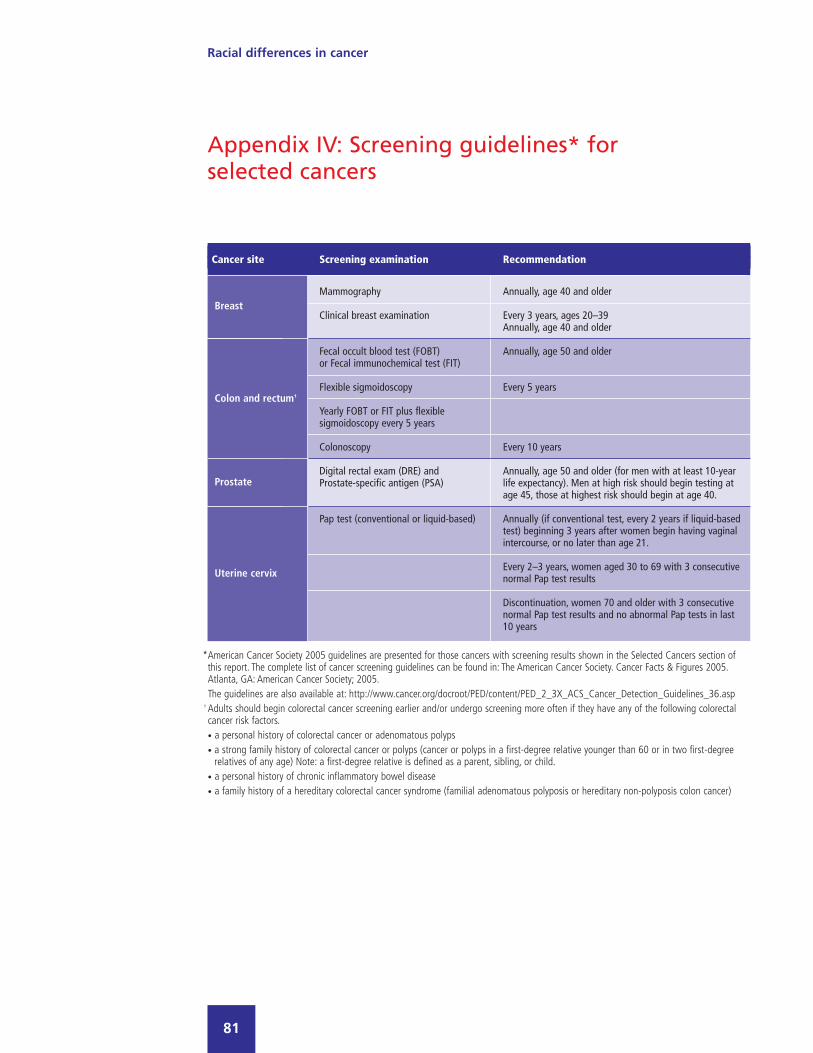
Appendix IV: Screening guidelines* forselected cancers
Cancer site Screening examination Recommendation
Breast Mammography Annually, age 40 and older
Clinical breast examination Every 3 years, ages 20–39Annually, age 40 and older
Colon and rectum† Fecal occult blood test (FOBT) Annually, age 50 and olderor Fecal immunochemical test (FIT)
Flexible sigmoidoscopy Every 5 years
Yearly FOBT or FIT plus flexible sigmoidoscopy every 5 years
Colonoscopy Every 10 years
Prostate Digital rectal exam (DRE) and Annually, age 50 and older (for men with at least 10-yearProstate-specific antigen (PSA) life expectancy). Men at high risk should begin testing at
age 45, those at highest risk should begin at age 40.
Uterine cervix Pap test (conventional or liquid-based) Annually (if conventional test, every 2 years if liquid-based test) beginning 3 years after women begin having vaginal intercourse, or no later than age 21.
Every 2–3 years, women aged 30 to 69 with 3 consecutive normal Pap test results
Discontinuation, women 70 and older with 3 consecutive normal Pap test results and no abnormal Pap tests in last 10 years
*American Cancer Society 2005 guidelines are presented for those cancers with screening results shown in the Selected Cancers section ofthis report. The complete list of cancer screening guidelines can be found in: The American Cancer Society. Cancer Facts & Figures 2005.Atlanta, GA: American Cancer Society; 2005.The guidelines are also available at: http://www.cancer.org/docroot/PED/content/PED_2_3X_ACS_Cancer_Detection_Guidelines_36.asp
† Adults should begin colorectal cancer screening earlier and/or undergo screening more often if they have any of the following colorectalcancer risk factors.• a personal history of colorectal cancer or adenomatous polyps • a strong family history of colorectal cancer or polyps (cancer or polyps in a first-degree relative younger than 60 or in two first-degree
relatives of any age) Note: a first-degree relative is defined as a parent, sibling, or child.• a personal history of chronic inflammatory bowel disease • a family history of a hereditary colorectal cancer syndrome (familial adenomatous polyposis or hereditary non-polyposis colon cancer)
Colon and rectum†
Prostate
Uterine cervix
Breast

p
This issue of Pfizer Facts, a collaboration between the National Medical Association (NMA) andPfizer, presents new analyses of national databases to gain insight into the burden of canceramong black adults, with comparisons to the white adult population.
About Pfizer: Pfizer Inc discovers, develops, manufactures, and markets leading prescriptionmedicines for humans and animals and many of the world's best-known consumer brands.
About NMA: The National Medical Association is the nation's oldest and largest organizationrepresenting the interest of more than 30,000 physicians of African descent and the patientsthey serve. For additional information, visit www.nmanet.org.

P F I Z E R F A C T S
Racial Differences in CancerA Comparison of Black and WhiteAdults in the United States
p
pU.S. Pharmaceuticals
PG006038© 2005 Pfizer Inc.All rights reserved.
Printed in USAJuly 2005 Pf
izer
Co
rpo
rate
Gra
ph
icD
esig
n,N
YH
Q23
012
7/20
05C
RW


![IMMUNOTOXICOLOGY Specialty Section · Collinge (Mark.Collinge@pfizer.com) and Jamie (DEWITTJ@ecu.edu)], Education Chair Florence Burlenson (fburleson@brt-labs.com) or Emanuela Corsini](https://static.documents.pub/doc/80x56/5e2a9dad6880d905167f8d10/immunotoxicology-specialty-section-collinge-markcollingepfizercom-and-jamie.jpg)


