Pulse repetition interval (PRI) PRI = 1 Pulse repetition frequency (PRF) Short pulse resolution Echoes Long pulses overlap Echoes Pulse width Pulse-on mean power Beam scan pattern Radar, EW & ELINT Testing: Identifying Common Test Challenges
Transcript
Pulse repetition interval (P
RI)
PRI =
1
P
ulse repetition fre
quency (PRF)
Short pulse
resolution
Echoes
Long pulses overlap
EchoesPulsewidth
Pulse-on mean power
Beam scan pattern
Radar, EW & ELINT Testing:
Identifying Common Test Challenges
2
Introduction
The roots of modern radar systems
stretch back to 1940 when the U.S.
Navy developed what was then
called radio detection and ranging
or RADAR. Today, this technology
has been adapted to applications
that range from the ubiquitous
supermarket door opener, which is
a simple moving-target indicator
(MTI), to highly complex shipboard
phased-array fire-control radars.
In military applications, two new
fields followed close on the heels
of radar: electronic intelligence
(ELINT) and electronic warfare
(EW). ELINT is used to extract
information from enemy radar
systems and provide insights
into coping with potential threats
attached to those radar signals:
ships, aircraft, missiles, and so on.
The associated development of
EW technologies provides active
and passive responses to those
potential threats.
From the simplest to the most
complex, all radar, EW and ELINT
systems pose a variety of chal-
lenges when it comes time to
test components, assemblies and
systems. To complicate matters, all
radars operate in an increasingly
cluttered spectral environment.
For example, the airwaves in an
urban setting may include count-
less wideband RF and microwave
emitters—and therefore potential
interferers—such as wireless com-
munications infrastructure, wireless
networking systems and civilian
radars.
This application note focuses on
test equipment that will help you
address the challenges you’re
most likely to face during system
development. To provide context,
the note starts with a review of
radar, EW and ELINT basics. After
providing an overview of key test
challenges, the remainder of this
note covers three main topics:
the generation of test signals, an
example of a synthetic test range,
and the validation and analysis of
radar signals.
3
Pulse repetition interval (P
RI)
PRI =
1
P
ulse repetition fre
quency (PRF)
Short pulse
resolution
Echoes
Long pulses overlap
EchoesPulsewidth
Pulse-on mean power
Beam scan pattern
Figure 1. Radar pulse terminology and tradeoffs
Primary radars suffer significant
signal losses from the transmitted
pulse to the received echo. The
transmitted signal must bounce off
and travel back from the target to
the receiver without amplification.
One way to overcome these large
signal losses is to transmit longer
pulses and integrate the larger
total energy in the received echo.
A longer pulse width thus provides
longer operating range for a given
antenna and transmit power
amplifier.
Radar “resolution” is also an
important characteristic related to
pulse width. The ability to resolve
small objects allows a radar to
provide a more detailed picture of
the target. A radar that can resolve
details down to 1 meter will provide
much more information about
approaching targets. A resolution
of 100 meters might render one
large target indistinguishable
from several smaller ones in
close formation.
If a radar’s pulse width is long,
echoes from adjacent targets can
bounce back together, overlapping
in time. To the radar, this appears
as one large target instead of
adjacent smaller targets. Thus, to
get the best radar resolution, a
narrower pulse width is desirable.
One can see that optimal range
and resolution involves conflicting
criteria. Best range implies a long
pulse whereas best resolution
implies a short pulse.
To solve the range-versus-
resolution optimization problem,
many radar systems use pulse
compression or modulation.
The linear frequency chirp is,
in concept, a simple modulation
to create and to decompress.
Frequency modulating (FM) the
radar pulse with a linear voltage
ramp creates a frequency-chirped
pulse. The chirped pulse is then
transmitted, as an uncompressed
pulse would normally be.
The radar receiver uses a special
filter with a significant linear
group delay opposite that of the
chirped pulse. The filter’s group
delay slows the lower-frequency
portion of the chirp and allows the
higher-frequency part of the chirp
to emerge from the filter earlier.
This has the effect of taking a long
pulse, easily integrated for greater
total power, and compressing it to a
short pulse easily identified among
other pulses.
4
Figure 2. Frequency chirped pulse compression
Chirped pulse
Dela
y
Frequency
Time Time
Compressed pulse
Minimally delayed high frequencies
Delayed low-frequency components
Receiver pulse filter
Pulse compression or modulation
offers other advantages in unambigu-
ous range. To see these advantages,
let us consider the pulse repetition
frequency.
The pulse-repetition frequency (PRF)
is dependent on the range capability
of the radar. Sending new pulses out
before previously sent pulses can
echo back can cause an ambiguity
in the echo response. Generally, it is
easiest to send a pulse out and wait
until all possible echo responses have
been received before sending the
next pulse. Providing an unambigu-
ous range response determines the
PRF or pulse-repetition interval (PRI)
between successive pulses.
There are many cases, however, in
which a slower PRF degrades overall
radar performance. For example, it
might be preferable to have a higher
PRF for a faster radar screen update
rate if the radar is tracking a fast
moving aircraft. In this case, the PRF
might allow an ambiguous return in
favor of a faster update rate.
One approach to eliminating the
clutter of echoing returns that
are not from a range of interest
is to use time or range gating.
This approach blanks on or off the
radar’s receiver, ignoring echoes
from objects either too close or
beyond the range of interest. An
example might be a time gate that
ignores echoes from the bow of
the ship the radar is mounted on.
Similarly, a missile might use time
gating to ignore echo returns beyond
the missile’s maximum range.
As mentioned earlier, pulse com-
pression can be used to eliminate
ambiguity between successive
pulses. Adding digital modulation to
each pulse allows the adjacent puls-
es to be uniquely encoded. Using
digital modulation techniques, such
as bi-phase keying, encodes pulses
so the round trip delay of each pulse
is easily measured unambiguously
using each pulse’s unique coding as
a separating tool.
Another important feature of many
radars is the ability to measure
Doppler shift from moving targets.
Measuring the change in frequency
of the RF carrier or phase shift with
time allows some radars to accurately
determine the target’s speed. MTIs
use Doppler shift in the return echo to
sense movement.
5
ELINT/EW basics — What’s out there?
The various design criteria that
influence the chosen radar pulse
pattern also convey a great deal of
information about the nature of the
platform attached to the radar. A
slow PRF with a long pulse might
indicate a weather radar scanning
across hundreds of miles, where
a fast PRF and a short pulse width
might indicate a missile’s terminal
homing radar scanning across a
Echo
Ignore early echoes
0
Ignore late echoes
Time or range
Ear
ly g
ate
Late
gat
e
Echoes
Sector scan
Raster scan
mile or two. The ELINT gained from
these signals conveys vastly different
information.
Similarly, the scan pattern of the
radar can also convey valuable
information about threats in the local
environment. For example, observing
the signal amplitude as a function of
time can reveal the type of antenna
the radar is scanning with and the
pattern the antenna is scanning out.
This type of intelligence is helpful
for understanding what the radar is
illuminating and how it is being used.
Beyond simply gathering ELINT
information about the radar and its
attached platform, knowledge about
the radar can enhance and guide
electronic warfare techniques. For
example, echo patterns can be syn-
thesized and broadcasted to an early
warning radar receiver to display
assets that are physically not there.
Missiles can track false radar returns
that alter their range gating to ignore
their intended targets. Doppler infor-
mation can also be used to confuse
targeting equipment.
Figure 3. Time gating or range gating
Figure 4. Antenna scan patterns
6
Modern radar & EW test challenges
The above review of some of the
design issues with radar, ELINT
and EW equipment highlights the
level of circuit complexity required.
Testing these modern radar systems
places unique demands on test
and measurement equipment. Let
us briefly consider some common
challenges encountered in testing.
Wide bandwidths are essential
for many radar signals. Chirped
or modulated pulses can require
gigahertz of bandwidth, demanding
broadband test equipment resources.
Very low phase noise is another
common requirement of radar test
equipment. Radars that use Doppler
shift information often measure the
rate of phase shift over time, as
radar pulses may not be long enough
to integrate cycles of frequency
difference. When making these
precise phase-change measurements,
phase noise must be kept very low,
placing stringent requirements on the
phase-noise performance of the test
instrumentation.
Similarly, dynamic range requirements
can challenge radar test systems.
Generally, this stems from the large
path losses encountered from the
transmitter through the return echo.
As we have seen thus far, the many
advantages of using compressed
pulses for better resolution and
unambiguous range frequently give
rise to the need for complex test
waveform synthesis. This can be
further compounded by the need for
added Doppler shifts for radars that
determine velocity.
Another challenge facing radar
system designers is the ubiquitous
use of software-defined radar
systems. Many modern types of
radar not only require test signals
and measurements in the traditional
analog RF fashion, but also in digital
formats. This multi-format testing
can present a real problem trying to
get good agreement between digital
signal measurements and analog
measurements.
Full-scale system test is often a
major issue for radar, ELINT and
EW equipment. The primary issue is
usually the cost of the test assets.
For example, simulating Doppler
shifts, clutter and other signal
elements to test a shipboard
fire-control radar may require a
ship and multiple test aircraft. Such
test platforms can quickly run into
a cost of many tens of thousands of
dollars per hour to accurately test
targeting performance.
Finally, many radars use phased-array
antenna systems. These systems use
wavefront time-of-arrival among many
antenna ports to steer the antenna
beam. This calls for test signals
and measurements that provide
multiple channels of phase-coherent
and phase-adjustable sources or
analyzers. The so-called multi-channel
array test system poses some very
real challenges to the radar
test engineer.
Having examined some of the
basics of radar systems and the
test challenges they pose, next we
will look at the unique features of
Agilent’s test equipment that make
some of the radar engineer’s difficult
test challenges much easier to solve.
We begin with the generation of radar
test signals.
7
Generating Test Signals
In the design and manufacture of
radar systems, many situations
require wideband microwave signal
generators. Test signal sources are
commonly used for applications such
as stable local oscillator (STALO) sub-
stitution, coherent oscillator (COHO)
testing and threat-emitter simulation.
Creating an accurate simulation of
received signals can be quite difficult.
Fortunately, today’s DSP-based signal
generators and arbitrary waveform
generators (AWGs) are capable of
producing simulated emitter signals
and electromagnetic environments
with realistic impairments and path
distortions that accurately portray dis-
tant targets. One important note: With
COTS signal generators and AWGs,
the simulated signals are typically
not coherent with the radar receiver.
However, non-coherent signals are
an effective way to test passive radar,
multi-static radar and electronic
countermeasure (ECM) systems.
Agilent signal sources and AWGs
The true power of an AWG is in its
ability to generate virtually any wave-
form downloaded into its memory. For
example, an AWG that can provide
both high resolution and wide
bandwidth—simultaneously—makes
it easy to create radar emitters and
targets scattered across a synthetic
test range that simulates hundreds of
cubic miles of airspace.
In the past, bandwidth was a crucial
limitation of most AWGs. Today, the
latest models have largely solved this
problem for many applications. For
example, the M8190A AWG provides
14-bit resolution up to 8 GSa/s and
12-bit resolution up to 12 GSa/s.
This makes it possible to generate
signals with alias-free bandwidths of
up to 5 GHz. Even greater alias-free
bandwidths can be created through
the use of combining and converting
technologies.
When selecting an AWG, perhaps
the most important consideration
is the spurious-free dynamic range
(SFDR) of the source. This is
affected by the bits of resolution
provided by the digital-to-analog
converter (DAC) within the AWG. It
also depends on the quality of the
frequency-conversion circuitry that
translates the arbitrary signal into
the microwave range.
Theoretically, each bit of resolution
should yield a maximum of 6.02
dB of SFDR. In practice, DACs are
often described in terms of the
effective number of bits (ENOB) or
an equivalent number of bits. After
accounting for linearity issues, the
actual SFDR per bit is less than the
theoretical 6.02 dB.
Broadband DACs also suffer from a
phenomenon called passband tilt,
which further lessens dynamic range
at the higher end of the frequency
band. Also, due to the (sin x)/x rolloff
of the sampling function, passbands
from the AWG roll off as frequency
increases; however, because this tilt
is inherent in the sampling function,
it is not considered when specifying
SFDR. Thus, an SFDR of 75 dB gener-
ally applies to the lowest frequency in
the band. Dynamic range will typically
be 5 to 7 dB lower at the upper end of
the band.
Figure 5. Agilent arbitrary waveform instruments
8
In addition to the number of bits and
the SFDR loss related to the sampling
function, upconversion to microwave
frequencies poses another set of
problems in the creation of useful sig-
nals. Upconversion can be performed
within the signal source or externally
with a separate device. This may
seem easy to do using just a mixer,
two filters and a fixed LO. In practice,
however, LO harmonics and spurs
often combine with the desired signal
to create in-band spurious signals
that can severely limit SFDR.
Many radars measure pulse-to-pulse
phase shifts as a way to derive values
for Doppler shift or target velocity.
To combat the addition of unwanted
phase noise into the upconversion
process, a signal generator must also
have low phase noise.
Agilent offers a full line of signal
sources and AWGs that offer excel-
lent SFDR and phase noise perfor-
mance. For example, the E8257D PSG
analog signal generator offers indus-
try-leading phase noise performance
as good as -143 dBc/Hz (typical) for a
1 GHz signal at a 10 kHz offset (option
UNY). For upconversion, the analog
PSG can also be configured with an
internal mixer or an internal mixer and
frequency doubler.
The E8267D PSG microwave vector
signal generator offers I/Q modula-
tion inputs and frequency coverage
up to 44 GHz (and higher with exter-
nal mixers). The modulation inputs
are compatible with the M8190A
AWG. Working together, these two
high-performance instruments can
deliver 2 GHz of signal bandwidth up
to 44 GHz with excellent SFDR and
phase noise.
Another way to mitigate many of
these issues is digital upconversion,
which is offered in the best of
today’s AWGs. When available
in a wide-bandwidth AWG, this
technique makes it possible to
directly generate the IF signal. In the
two-channel M8190A, each channel
has a separate digital upconversion
engine and the channels can
be used in “coupled mode” to
achieve full phase-coherent
output. Parameters such as carrier
frequency, amplitude and waveform
can be set independently and the
complex-valued I and Q data will be
upconverted digitally to the desired
frequency range while providing
excellent signal quality with SFDR of
up to 80 dBc and harmonic distortion
of less than 72 dBc (both values
are typical).
Memory configuration is another
important consideration when select-
ing an AWG or a vector signal genera-
tor with AWG capabilities. Either type
of instrument creates waveforms by
playing back digital information from
memory. The addition of standard or
optional capabilities for sequencing
and playback can further enhance the
utility of the signal generator.
The simplest way to organize
playback memory is to use a single
large block of fast RAM and play the
waveform directly from memory. This
works well for single pulses or very
short RF events; however, at the data
rates required to support 12 GSa/s at
12-bit resolution, the signal must be
very short. Some manufacturers have
extended this approach to work with
large RAID arrays, thereby enabling
longer playback times. 1
The single-block approach is of
somewhat limited usefulness because
most RF signals are repetitive. Even
with terabytes of memory or RAID
capacity, sequential playback times
will be limited to a few seconds
of signal.
1. RAID: redundant array of inexpensive discs
9
The solution is a more efficient
memory-access capability for
repetitive signals such as radar
pulse sequences. To support a
repetitive signal, fast playback
memory can be organized to
play signal segments as loops or
an infinite sequence. Advanced
sequencing capabilities such as
conditional branching make it
possible to create highly complex
segments and scenarios. In
addition, some Agilent sources offer
dynamic sequencing that supports
real-time modification of waveform
segments. When combined with
waveform memory large enough to
hold 2 GSa per AWG output channel
(M8190A), highly complex and
realistic signal scenarios of long
duration are possible.
Figure 6. Waveform segmenting, sequencing and scenarios
Desired pulse pattern
Digital pulse pattern
Segment#1
Segment#2
Segment#3
Segment#2
Segment#1
Samples
Memory sequences
Time
Once you’ve chosen a signal source
that provides adequate bandwidth,
SFDR, phase noise and sequencing
capabilities, the next challenge is
the digital creation of the desired
waveform using software tools
such as Signal Studio or SystemVue
from Agilent or MATLAB from The
MathWorks.
10
Easy pulse building for Agilent sources
Depending on the application, pulsed
radar signals utilize a wide range of
characteristics: pulse width; PRI or its
inverse, PRF; modulation; and more.
The creation of suitable test signals
is challenging, and the synthesis of
pulsed test signals is further complicat-
ed by the desired system diagnostics:
Doppler shift or pulse-to-pulse phase
shift may be needed to test velocity
measurement capabilities, and simula-
tion of antenna scanning patterns may
be needed to test an ELINT system.
To meet these needs, software tools
must support numerous pulse patterns
for signal creation and provide a wide
variety of antenna characteristics that
can be applied to synthesized signals.
To address these needs, Agilent
has created Signal Studio for Pulse
Building (N7620B). This software
provides an easy way to enter a
variety of pulse characteristics and
create signals that range from simple
on-off pulses to complex custom
compressed pulses.
For testing of radar components,
transmitters or receivers, Signal
Studio for Pulse Building lets you
specify parameters such as PRI, the
number of pulse repetitions, repetition
interval jitter and PRI wobbulation.
Available PRI patterns include
bursted, linear ramp, staggered and
stepped, and PRI jitter can be defined
as Gaussian, uniform or U-shaped.
PRI wobbulation can be selected as
sawtooth, sinusoidal and triangular.
These capabilities enable a variety of
receiver tests:
• Test system response to impair-
ments by creating pulse-width
patterns with jitter
• Test range gating and range/
Doppler ambiguity resolution with
complex PRI patterns
• Test MTI modes and Doppler pro-
cessing by adding frequency and
phase offsets
• Test clutter rejection performance
by creating custom pulses with
clutter
Each pulse definition stored in the
library can be aggregated into pulse
patterns and then synthesized as
complex sets of radar emissions.
Once the pulse parameters have been
entered, the next step is to download
the waveform to an AWG or signal
generator. The test stimulus will then
be ready for playback.
Figure 7. Agilent Signal Studio for pulse building
Key features:
Signal Studio for Pulse Building
This specialized version of Signal
Studio (N7620B) supports a wide
array of imported or software-defined
pulse shapes and antenna patterns.
Pulse parameters
• Rise and fall times
• Edge shape
• Jitter
• Pulse width pattern
• Modulation-on-pulse
Pattern parameters
• Number of pulse repetitions
• Pulse repetition interval (PRI) or
pulse repetition frequency (PRF)
► PRI patterns: bursted, linear
ramp, staggered, stepped
► PRI jitter: Gaussian, uniform
or U-shaped
► PRI wobulation: sawtooth,
sinusoidal, triangular
• Amplitude scaling
• Frequency offset
• Phase offset
• Additional off time
Modulation-on-pulse
• AM step
• Barker codes (seven types)
• BPSK and custom BPSK
• FM chirp (linear or nonlinear)
• QPSK and custom QPSK
• Polyphase codes
Antenna scanning patterns
• Circular
• Conical
• Custom
• Bidirectional raster
• Unidirectional raster
• Bidirectional sector
• Unidirectional sector
Antenna radiation patterns
• Rectangular
• Cosine (five variations)
• Blackman and exact Blackman
• Hamming
• Three-term
• User-defined
11
Antenn a pattern simulation
Signal Studio for Pulse Building
features a variety of antenna pattern
simulations that can be applied
to waveforms. This feature is
particularly useful for ELINT and EW
applications in which the system to
be tested needs to be immersed in a
signal-rich environment that mimics
real-world threats that may not be
available. Many of these ELINT and
EW systems use antenna pattern
information to identify the particular
threat being received.
Radar antenna patterns are somewhat
unique because they usually involve
a scanning or moving antenna beam
dictated by the nature of the radar’s
mission (Figure 8). For example, a ship
might have a rotating scan pattern
to view objects on the ocean surface
in all directions. A fighter jet likely
employs a forward sector scan for its
weather radar. A guided missile cruiser
may use a phased-array antenna for
its targeting radar, and the missile
launched from the ship could well use
a conical-scanning terminal radar.
Figure 8. Antenna scanning patterns
Testing ELINT and EW systems that
respond to these types of threats
requires the ability to produce the
appropriate pulse pattern that mimics
the scanning radars.
Agilent’s Signal Studio for Pulse
Building supports a variety of antenna
scan patterns, including circular pat-
terns commonly found on ships, sec-
tor patterns found on aircraft, conical
patterns often used on missiles,
and raster scans typical of targeting
phased arrays.
Rotational scan
Rotational scan
Bidirectional scan
Unidirectional scan
Conical scan
Raster scan
Unidirectional scan
Bidirectional scan
12
To accurately simulate a scanning
antenna, it is also necessary to
take into account the effects of the
antenna side lobes. Because all
directional radar beam antennas are
of a finite size, they all exhibit some
form of off-axis side lobe. Thus, as
a radar scans, the main lobe of the
antenna pattern is preceded by side
lobes, then the main beam and finally
more side lobes.
Combining the amplitude modulation
caused by the scanning antenna and
its side lobes with the pulse envelope
modulation and its internal pulse
compression modulation can be
quite complex.
Agilent has made this process easy
with Signal Studio for Pulse Building
by allowing the user to also define
antenna side lobes, pointing angles,
target location, scan rates, beam
widths, and roll off rates.
Signal Studio for Pulse Building also
allows the user to define the antenna
radiation patterns using popular
spatial transform windows. Blackman,
Hamming, Hanning, Rectangular, 3
Term, Cosine and even programmable
windows are available for describing
the spatial distribution of energy.
Figure 9. Antenna scanning simulation in signal studio for pulse building
Pulse pattern libraries
The need to generate feature-rich
pulse patterns to simulate complex
EW environments continues to
grow with sophisticated equipment
designed to respond to multiple
threats automatically. Many
organizations have cataloged
emissions from a variety of radar
sources to enable EW and targeting
equipment to be pre-programmed to
respond to each threat appropriately.
Signal Studio for Pulse Building is
designed to interface with popular
databases, including Microsoft®
Excel spreadsheets, to enable easy
import of pulse characteristics.
This handy import feature makes
it easy to generate realistic EW
mission scenarios to test radars and
countermeasure equipment.
13
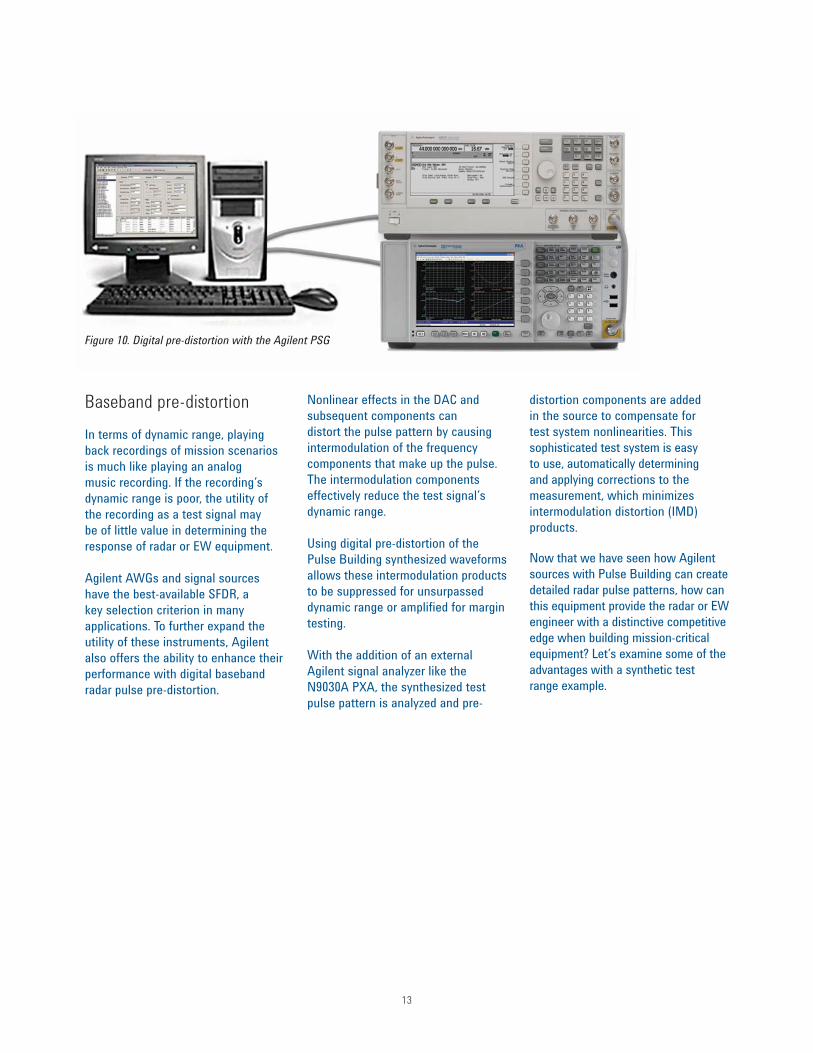
Baseband pre-distortion
In terms of dynamic range, playing
back recordings of mission scenarios
is much like playing an analog
music recording. If the recording’s
dynamic range is poor, the utility of
the recording as a test signal may
be of little value in determining the
response of radar or EW equipment.
Agilent AWGs and signal sources
have the best-available SFDR, a
key selection criterion in many
applications. To further expand the
utility of these instruments, Agilent
also offers the ability to enhance their
performance with digital baseband
radar pulse pre-distortion.
Nonlinear effects in the DAC and
subsequent components can
distort the pulse pattern by causing
intermodulation of the frequency
components that make up the pulse.
The intermodulation components
effectively reduce the test signal’s
dynamic range.
Using digital pre-distortion of the
Pulse Building synthesized waveforms
allows these intermodulation products
to be suppressed for unsurpassed
dynamic range or amplified for margin
testing.
With the addition of an external
Agilent signal analyzer like the
N9030A PXA, the synthesized test
pulse pattern is analyzed and pre-
distortion components are added
in the source to compensate for
test system nonlinearities. This
sophisticated test system is easy
to use, automatically determining
and applying corrections to the
measurement, which minimizes
intermodulation distortion (IMD)
products.
Now that we have seen how Agilent
sources with Pulse Building can create
detailed radar pulse patterns, how can
this equipment provide the radar or EW
engineer with a distinctive competitive
edge when building mission-critical
equipment? Let’s examine some of the
advantages with a synthetic test
range example.
Figure 10. Digital pre-distortion with the Agilent PSG
14
Simulation of scanning antennas
To illustrate the application of the
signal generator to test an EW
system, consider the problem of
testing a shipboard early warning
system. In this case, the EW system
receives the radar pulses hitting
the ship and analyzes them to
determine the nature of their source
and bearing angle to the source.
Examining the pulse patterns as well
as their varying amplitude caused
by the antenna scanning pattern
provides critical information to an
EW countermeasure system.
Synthetic Range Testing Example
As mentioned earlier, testing radars
can be challenging. Historically, the
radar engineer would rely on a field
test range, usually a large area where
several ships or airplanes could be
steered about to evaluate if the radar
would properly display their position
and velocity. Though field testing often
provides a realistic environment, it
is generally an inferior option for the
development engineer.
The challenges of working in the field
are the primary reason that many radar
test engineers choose to create a
synthetic test range. The synthetic test
range is a collection of test equipment
capable of simulating the types of
radar return echoes needed to test a
radar’s performance.
Though field testing can be helpful
in simulating environmental condi-
tions such as coastlines, mountains
and clouds, it is often impractical to
simulate realistic military mission
scenarios. For example, it can be
exorbitantly expensive to organize a
full-scale attack that includes dozens
of aircraft and ships approaching a
coastal early warning radar station. In
a similar vein, field testing may entail
significant safety issues (e.g., potential
collisions) that are not a factor in
laboratory testing.
Finally, with many large-scale field
tests it is often impossible to explore
multiple scenarios. The cost of
positioning radars and targets over
hundreds of miles of range multiple
times prevents fully exploring the
capabilities of a radar, EW or ELINT
receiver. Similarly, when testing
spacecraft radar systems, field testing
is cost prohibitive.
To overcome these issues, Agilent
signal generators and arbitrary wave-
form generators along with Signal
Studio for Pulse Building can create a
synthetic test range in the laboratory
environment, which is often preferred
by the radar and EW engineer.
The key to a successful test strategy
is to provide a realistic set of radar
pulse patterns and see if the EW
countermeasure system takes the
appropriate action such as jamming,
range gate pull-off, chaff dispensing,
and the like. In this example, we wish
to see how the EW system responds
to different radar signals such as
those from a pleasure boat’s radar or
a surface-skimming missile.
To implement this test, we need only
Agilent’s Signal Studio for Pulse
Building II and an Agilent PSG.
Using the appropriate radar pulse
definitions and antenna patterns, the
different threats can be played out
of the Agilent PSG to the EW system
to see if it takes the appropriate
action. In the case of the pleasure
boat, nothing should happen, while
in the case of the missile, the EW
system should initiate the appropriate
countermeasures.
Synthetic test ranges using Agilent
test instruments not only provide
realistic testing of shipboard
equipment at a fraction of the cost
of “live-fire” exercises, but they also
provide excellent training simulators.
For example, consider a ship that is
in port for maintenance or restocking.
Using a synthetic test range built
around Agilent sources, the ships
radar and EW receivers can be used
to train ship personnel to deal with
a variety of likely mission scenarios.
This can be done without alerting
unfriendly forces, which is a notable
downside of at-sea exercises.
15
Coherent multi-channel receiver test
Agilent sources and Signal Studio for
Pulse Building can be configured to
simulate phased-array radars. These
systems have many receiver inputs
and rely on the phase of arrival of the
incoming echoes. This can complicate
testing because the receive signal
must mimic a wavefront that contains
multiple radar echoes arriving from
distant points.
We address this need with signal
sources such as the PSG (E8257D
and E8267D) and the MXG (N5181B
and N5182B), each of which can
be coherently phase-locked and
provides the ability to adjust the
static phase relationship between
sources. This enables Agilent sources
to mimic pulse wavefront arrival for
multi-channel phased-array systems.
Possible approaches are described
in the application note Signal
Source Solutions for Coherent and
Phase-Stable Multi-Channel Systems
(publication 5990-5442EN).
Figure 11. Creating a synthetic test range for phased-array radars
Wavefront
Delay
Radar pulse
Phased array
Receiver Receiver
Coherentmulti-channel
phase-adjustablesources
Ret
urn
ech
o pu
lse
1 2 3 4 1 2 3 4
PSG
PSG
PSG
PSG
16
An alternative environment for system simulation and signal creation
Signal processing algorithms play
an important role in advanced radar
systems, especially high-performance
multi-mode systems. Algorithm
creation is a complex process that
becomes more efficient when devel-
opers have access to a sufficient set
of models for the various radar ele-
ments and functions: signal genera-
tion, multiple emitters, transmission,
antennas, transmit/receive switching,
clutter, noise, jamming, receiving,
signal processing, and measurements.
The Agilent W1905 radar model
library works within the Agilent
SystemVue system-level design
environment. SystemVue is an open
modeling environment focused
on physical-layer architectures at
baseband and RF. It replaces general-
purpose digital, analog and math envi-
ronments, and it connects to a variety
of FPGA and embedded-hardware
design flows.
The W1905 library provides more than
50 highly parameterized simulation
blocks (see Appendix, page 23) and
more than 40 higher-level reference
designs that can be used to create
working radar-system scenarios that
include radar processing blocks,
environmental effects such as clutter,
targets, and even hardware measure-
ments. The library is applicable to
pulsed-Doppler (PD) radar archi-
tectures as well as ultra-wideband
(UWB) radars, digital arrays, beam-
forming and frequency-modulated
continuous-wave (FMCW) radars.
With these tools, developers can
model different types of radar sys-
tems, create radar signal-processing
Figure 12. Return signals with clutter and jamming, as created with SystemVue and the
W1905 library
algorithms, evaluate system perfor-
mance and provide proof-of-concept
designs.
The W1905 library is also ideal for
those who need to generate precise
signals for verification of algorithms
and hardware, or those who want
to study the performance of radar
systems under various conditions.
For example, a key aspect of receiver
testing is assessing performance in
the presence of background clutter,
multipath, ambiguous echoes, jam-
ming interference and channel impair-
ments. SystemVue provides modeling
capabilities that support these needs
(Figure 12).
17
To test devices still in development,
SystemVue can be used to create
highly realistic multi-emitter test
signals. One of the key enabling
technologies is a SystemVue feature
called SignalCombiner. This feature
enables the creation and combination
of multi-emitter signals within the
simulation environment. Through
resampling, multiple emitters are
combined into a single waveform
that can be downloaded to a high-
precision AWG such as the M8190A
for playback. To learn more, please
see the application note Creating
Multi-Emitter Signal Scenarios with
COTS Software and Instrumentation
(Agilent publication 5991-1288EN). 1
Figure 13. An example combination of software and instrumentation that can be used to create and generate radar test signals
1. The “Results, part 2” section on page 6 of note 5991-1288EN describes the creation of a multi-emitter
environment that contains 16 radar signals, eight Barker-coded and eight LFM-chirped.
SystemVue Signal generator DUT
Signal analyzer
To illustrate the creation of a radar
signal, please see Figure 13. In this
configuration, an interface model
(“sink”) in SystemVue connects to a
vector signal generator such as the
PSG or MXG. Any radar waveforms
generated in a SystemVue simulation
can be automatically downloaded at
runtime to the signal generator, which
can produce the RF or IF test signals.
In addition, waveforms captured with
the signal analyzer can be transferred
to SystemVue for processing and use
in simulations.
18
When connected to appropriate
stimulus/response instrumentation,
this type of simulation platform can
be used to manually imitate missing
hardware blocks and thereby simulate
a working radar system. This enables
system-level validation earlier in the
development process, even when
working with partially implemented
hardware. As real hardware becomes
available, the simulation platform can
be easily refocused on the task of
providing targeted radar signals for
the instrumentation to be used
in testing.
For advanced analysis, SystemVue
and the W1905 library can be com-
bined with the 89600 VSA software.
The 89600 VSA provides advanced
general-purpose and standards-based
tools for measuring signal charac-
teristics in the time, frequency and
modulation domains. The software
can run on a PC or inside certain
Agilent signal analyzers, logic
analyzers and oscilloscopes.
In addition, the SystemVue/89600
combination provides an interface to
a range of test equipment that can
be used to verify the performance of
implemented hardware. Examples
include signal analyzers such as the
N9030 PXA, logic analyzers such as
the 16800 series and oscilloscopes
such as the Agilent Infiniium 90000
X-Series.
Figure 14. A MATLAB 3D visualization of pulsed-Doppler radar target returns with
clutter models
SystemVue also integrates with
MATLAB to enable analysis and
visualization of complex radar signals
(Figure 14). Capabilities include com-
plete mathematical modeling within
SystemVue using MATLAB math and
computation functions.
19
Figure 15. A real-time PXA helps you see, capture and understand highly elusive signals
Validation and Analysis of Radar Signals
Radar pulse analysis has become
more challenging as developers have
embraced the use of compression
technology to reduce ambiguity and
improve resolution and range. This
approach requires the availability
of capabilities such as wider
bandwidths, modulation analysis and
multi-domain displays in the analysis
equipment.
Developers are also incorporating
software-defined radar architectures
in which stable, flexible digital
implementations are rapidly replacing
traditional analog IF and baseband
signal processing. This too creates
test challenges because the access
to signals and the formats of those
signals changes radically from
baseband to RF.
spectrum analyzer, vector network
analyzer or combination analyzer with
frequency coverage up to 26.5 GHz.
The X-Series includes four models,
two of which are well-suited to radar
applications: the high-performance
PXA, which provides an analysis
bandwidth of 160 MHz; and the
versatile MXA, which provides a
strong balance of speed, performance
and cost effectiveness. Our latest
enhancement is the availability of
real-time spectrum analysis (RTSA)
for the PXA. RTSA provides a real-
time analysis bandwidth of up to 160
MHz and is an upgradeable option
for new and existing PXAs. Adding
RTSA creates a cost-effective solution
that provides real-time analysis and
traditional spectrum measurements
in a single instrument (Figure 15). A
real-time PXA provides the following
key capabilities:
• 100 percent probability of intercept
(POI) for signals with durations as
short as 3.57 µs
• Noise floor of -157 dBm at 10 GHz
(no preamp)
• 75 dB spurious-free dynamic range
• Frequency-mask triggering (FMT)
with a variety of conditional
capabilities
To address these challenges, Agilent
has created analysis instruments that
provide the performance and flexibility
needed to view virtually all radar
signals across a wide range of formats.
Agilent analysis tools
To meet different needs across a
range of price-and-performance
points, we offer the X-Series family
of benchtop signal analyzers and
two lines of portable analyzers. The
portable models include the handheld
spectrum analyzers (HSA) and the
FieldFox family. The HSA models
enable basic spectrum analyzer
measurements up to 20 GHz in the
field and are well suited to installation
and maintenance applications. A
FieldFox handheld can be configured
as a cable-and-antenna analyzer,
Figure 16. Agilent’s family of signal analysis tools
20
For thorough analysis of complex sig-
nals, the 89600 VSA software can be
used with, or run inside, the X-Series
signal analyzers. In addition to time-
and frequency-domain capabilities,
the 89600 VSA enables modulation-
domain measurements of compressed
radar pulses. In addition, the VSA
software is compatible with the RTSA
capabilities, including frequency-mask
trigger, and supports capture and
playback of culprit signals.
In ultra-wideband applications, Agilent
also offers high-performance digitizers
and oscilloscopes. For example, the
M9703A is an eight-channel, 12-bit
AXIe digitizer that can capture signals
from DC to 2 GHz. It provides up to
3.2 GSa/s with four channels and up
to 1.6 GSa/s with eight channels. The
M9703A supports long acquisitions
with up to 4 GB of internal memory.
The Infiniium 90000 X-Series and
Q-Series oscilloscopes are another
alternative: these offer bandwidth
of up to 63 GHz, sampling up to 160
GSa/s and up to 2 Gpoints of memory.
For advanced analysis, the M9703A
and the 90000 X-Series and Q-Series
scopes are compatible with the 89600
VSA software.
Figure 17. Viewing a chirp pulse with the 89600 VSA software
Deciding when to use an oscilloscope or a signal analyzer
Your analysis requirements will help you determine when to use an oscilloscope or
a signal analyzer. The key factors are analysis bandwidth and the required number
of measurement channels. Additional factors include dynamic range, spurious
performance and error vector magnitude (EVM) measurements.
Currently, the highest-performance signal analyzers have a maximum analysis
bandwidth of 160 MHz. Thus, if the required analysis bandwidth is 160 MHz or less,
then either a signal analyzer or scope can be used. If a wider bandwidth is required,
then a high-performance oscilloscope is the best choice.
If multiple phase-coherent channels are required, then an oscilloscope is often the
best choice. When one channel is enough, a standalone signal analyzer such as
the PXA usually has an advantage in the other factors: dynamic range, spurious
performance, and EVM performance and measurement speed.
To illustrate the capabilities of our
analysis tools, it will be worthwhile to
look at some example measurements.
This overview begins with essential
measurements such as pulse analysis
and continues with difficult signal-
quality measurements and, finally,
software-defined radar measurement
capabilities.
21
Figure 18. Pulse analysis with the N9051A measurement software
Figure 19. Advanced pulse analysis
with the W2650A OSA software
includes statistical capabilities
with histogram displays
Pulse analysis
The testing of radar, EW and ELINT
systems requires a variety of routine
measurements. As mentioned earlier,
measurements of pulse width and PRI
(or PRF) provide important informa-
tion about a radar system’s resolution
and range, and can reveal potentially
important intelligence information.
Automated measurements of pulse
parameters can accelerate radar
diagnostics and provide a wealth of
EW information.
Two software applications can be
used to automate these measure-
ments: The PXA and MXA signal
analyzers can be configured with
the N9051A pulse measurement
application, and oscilloscopes such as
the Infiniium 90000 can be equipped
with the W2650A oscilloscope signal
analysis (OSA) software. An X-Series
analyzer with N9051A is the better
choice when high dynamic range is
needed, pulse-modulation bandwidths
are less than 160 MHz, and spectrum
and spurious measurements are
needed. Multiple views enable
concurrent analysis of power vs. time,
frequency vs. time, phase vs. time or
power vs. frequency. Base capabilities
include PRI, PRF and pulse param-
eters such as width, duty cycle, rise
time, fall time, droop, overshoot and
ripple. An extended analysis option
enables statistical analysis of up to
200,000 pulses via trend analysis or
histogram plots.
An oscilloscope with W2650A can
handle bandwidths greater than 160
MHz and is the better choice when
dynamic range is less important than
bandwidth. The scope also provides
segmented memory, which simpli-
fies the analysis of a long series
of pulses. For pulse analysis, key
capabilities include PRF, PRI, pulse
frequency (mean, min, max, devia-
tion, excursion), pulse modulation
(chirp, Barker), and more. W2650A
also supports continuous-wave and
modulation measurements including
frequency hopping signal pattern
and duration.
22
Multi-format modulation analysis with the 89600 VSA
Software-defined radar architectures
present unique challenges in testing
because the signal format changes
from the familiar coaxial analog
microwave transmission line to the
digital bus that often resides deep
inside an FPGA. This type of mixed
analog-and-digital implementation
poses the problem of being able to
perform advanced analysis of modu-
lated pulses on vastly different signal
formats but with consistent results.
The 89600 VSA software inter-
faces with a variety of Agilent
instruments—signal analyzers,
oscilloscopes, logic analyzers, and
more—that can serve as analog or
digital front-ends for signal acquisi-
tion. In addition, the 89600 VSA is
compatible with the Agilent Advanced
Design System (ADS) circuit-modeling
software. Not only does this simplify
the process of learning how to make
measurements with an instrument,
it also ensures consistency between
measurements because the same
VSA algorithms are used to process
analog and digital signals.
Using a 16800 logic analyzer as the
front end for the 89600 VSA enables
use of the Agilent ATC2 FPGA design
core. The ATC2 design core allows
for seamless access to internal data
buses of supported FPGAs from Xilinx
and Altera, enabling sophisticated
signal analysis directly on real-time
FPGA design implementations.
Pulse compression
radar
Waveformexciter
DAC PA
LNAIF
COHO
STALO
Antenna
SynchronousI/Q detector
Pulse compressionfilter
(Correlation filter)
IQ
VSA
Logic analyzere VSA
Oscilloscope VSA
Signal analyzer VSA
ADS simulation VSA
Figure 20. Multi-format analysis with the 89600 VSA software
23
Appendix: Block List for the W1905 Radar Model Library
Agilent Channel Partners
www.agilent.com/find/channelpartners
Get the best of both worlds: Agilent’s
measurement expertise and product
breadth, combined with channel
partner convenience.
For more information on Agilent Technologies’ products, applications or services, please contact your local Agilent
office. The complete list is available at:
www.agilent.com/find/contactus
Americas Canada (877) 894 4414 Brazil (11) 4197 3600Mexico 01800 5064 800 United States (800) 829 4444
Asia Pacifi c Australia 1 800 629 485China 800 810 0189Hong Kong 800 938 693India 1 800 112 929Japan 0120 (421) 345Korea 080 769 0800Malaysia 1 800 888 848Singapore 1 800 375 8100Taiwan 0800 047 866Other AP Countries (65) 375 8100