Case study investigation of Indoor Air Quality during summer of the first PassivHaus in Mexico City Caso de estudio de la calidad del aire interior en verano del primer PassivHaus en Ciudad de México Moreno-Rangel, A., Mackintosh School of Architecture, The Glasgow School of Art, G3 6RQ, Glasgow, UK [email protected]/ [email protected]Sharpe, T., Musau, F., McGill, G. Mackintosh Environmental Architecture Research Unit, The Glasgow School of Art, G3 6RQ, Glasgow, UK [email protected]/ [email protected]/ [email protected]Innovación tecnológica: Este trabajo monitorea la calidad del aire del primer PassivHaus con el uso de unidades de monitoreo de bajo costo. Área de aplicación industrial: Calidad del aire, vivienda sustentable, vivienda y salud. Resumen Este estudio compara el primer y único, PassivHaus con una casa con las prácticas de construcción estándares en la Ciudad de México en términos de calidad del ambiente interior, especialmente la calidad del aire interior (IAQ) y la percepción de los ocupantes hacia éste. Las mediciones de IAQ se realizaron durante los meses de mayo, junio y julio. La temperatura, la humedad relativa, el bióxido de carbono y las partículas suspendidas 2.5 fueron monitoreados en la sala, la recámara y la cocina en cada una de las casas. Las mediciones simultáneas de la calidad del aire exterior se obtuvieron de la red local de monitoreo de la contaminación. Se utilizaron encuestas en
Transcript
Case study investigation of Indoor Air Quality during summer of the first PassivHaus in Mexico City
Caso de estudio de la calidad del aire interior en verano del primer PassivHaus en Ciudad de México
Moreno-Rangel, A., Mackintosh School of Architecture, The Glasgow School of Art, G3 6RQ, Glasgow, UK
Innovación tecnológica: Este trabajo monitorea la calidad del aire del primer PassivHaus con el uso de unidades de monitoreo de bajo costo.
Área de aplicación industrial: Calidad del aire, vivienda sustentable, vivienda y salud.
Resumen
Este estudio compara el primer y único, PassivHaus con una casa con las prácticas de construcción estándares en la Ciudad de México en términos de calidad del ambiente interior, especialmente la calidad del aire interior (IAQ) y la percepción de los ocupantes hacia éste. Las mediciones de IAQ se realizaron durante los meses de mayo, junio y julio. La temperatura, la humedad relativa, el bióxido de carbono y las partículas suspendidas 2.5 fueron monitoreados en la sala, la recámara y la cocina en cada una de las casas. Las mediciones simultáneas de la calidad del aire exterior se obtuvieron de la red local de monitoreo de la contaminación. Se utilizaron encuestas en línea y un diario de ocupación para obtener datos sobre enfermedades relacionadas con los edificios; la percepción de los ocupantes sobre la calidad del aire y el confort térmico; así como el comportamiento de los ocupantes de ambos departamentos. Los resultados sugieren que las mejoras de PassivHaus estándar protegerán a los ocupantes de la contaminación al aire exterior. Además, se la concentración de contaminación encontrada fue menor en el departamento con certificación PassivHaus que los encontrados en el ambiente externo. Esto contrasta con los resultados de la casa con las prácticas de construcción estándar en la que la contaminación interior fue mayor a la exterior.
Abstract
This study compares the first residential PassivHaus in Mexico City to a standard building practice home in terms of indoor environment quality, specifically indoor air quality (IAQ) and occupants’ perception towards it. IAQ was measured during the months of May, June and July. Temperature, relative humidity,
carbon dioxide, and PM 2.5 were monitored in the living room, bedroom and kitchen of each of the homes. Simultaneous outdoor measurements were collected from the local pollution monitoring network. Online surveys and an occupancy diary were used to gain data about building-related illnesses; occupants perception of IAQ and thermal comfort; as well as behaviour in both flats. Results suggest that the PassivHaus design helps to protect occupants from outdoor air pollution. Lower concentrations of PM2.5 were found in the PassivHaus flat, compared to the external environment. This contrasted with the results of the standard building practice home, in which PM2.5 was found to be higher than the outdoors.
Key Words: Calidad del aire interior, calidad del ambiente interior, PassivHaus, viviendas energéticamente eficientes, viviendas sustentables.
Key Words: Energy-efficient dwelling, Indoor air quality, indoor environment quality, PassivHaus, sustainable homes.
Año 1, No. 5 NOVIEMBRE-DICIEMBRE2013
1. Introduction
Interest in the influence of the indoor environment on human health in energy efficient dwellings is growing, especially in terms of indoor air pollution (1). However, many of the studies conducted on low-energy buildings tend to focus on energy consumption (2) and thermal comfort (3). The impact of energy efficient design strategies on indoor environmental quality remain neglected (4) moreover, an absence of knowledge and skills (5) for design-making decision makes it harder to understand. Despite this, research suggests that increased airtightness of building envelopes, low ventilation rates, use of new ventilation technologies and new building materials may diminish the quality of the indoor environment (6) if they are not adequately considered.Few studies have examined the trade-off between energy efficient buildings and human health (7). For instance, limited data are available to contrast the indoor air quality (IAQ) of low-energy dwellings with similar dwellings built using standard building practices. There is a scope for studies to focus on comparing IAQ of low-energy buildings as alike as possible to “standard” buildings, excluding the building elements related to the energy efficiency (8). There is a significant need for indoor air quality research in contemporary energy efficient dwellings, especially in polluted urban environments, where indoor air pollution of outdoor origin has a bigger impact on human health.Few studies have investigated indoor air pollution in contemporary homes. For instance, one study investigated indoor air
quality in eight houses the UK, both mechanically and naturally ventilated. It was found that both housing types had inadequate IAQ and thermal comfort, and that the ventilation system was not capable of ensuring adequate ventilation. Furthermore, problems with maintenance of the ventilation systems were identified (6).Another study focussed on assessing the approach to IAQ of different building certifications and standards, such as BREAAM multi-residential, BREAAM EcoHomes, BREAAM Domestic Refurbishment, the Code of Sustainable Homes, and PassivHaus. This study concludes that all ignore fundamental strategies for protecting human health and well-being (9).Studies have looked at how increased levels of airtightness required for low-energy homes can be a problem if indoor pollution sources are not adequately addressed and if there is insufficient ventilation. For instance, airtight homes with less than 5m3/m2/h@50Pa that rely on trickle vents for background ventilation may result in IAQ issues (10) related to problems in the design, construction and operation of the ventilation strategies (11).Low-energy homes are relatively new in Mexico. The project for NAMA for Sustainable Housing in Mexico in 2013 (12,13) and policies such as Sustainable building – environmental criteria and minimum requirements (NMX-AA-164-SCFI-2013) (14) are part of the Mexican government’s efforts to combat climate change. Therefore studies in Mexican low-energy homes tend to be more focused on energy consumption (15,16), CO2
emissions (17) and urban planning (18). Moreover, air pollution studies have been
Año 1, No. 5 NOVIEMBRE-DICIEMBRE2013
focused on outdoors rather than indoors (19–25); and studies conducted on IAQ often examine schools, offices or non-energy efficient buildings for their impact on health (26–28). Studies in thermal comfort in Mexican dwellings are more common (29,30) but not always in energy-efficient homes.This study aims to (a) investigate the indoor air quality of the first PassivHaus in Mexico City during summer and (b) to compare the results with a home built with standard practices but otherwise alike as possible to the PassivHaus. This study was conducted through physical IAQ measurements with low-cost monitors, alongside occupants’ diaries, in a PassivHaus and a standard building practice home. Online surveys were supplied to gain information on building characteristics and occupants’ perception of indoor air quality, Sick Building Syndrome (SBS) symptoms, thermal comfort and occupant behaviour. This paper discusses the methodological approach, presents the results of the study and discusses their implications. Finally, further research opportunities and conclusions are described.
2. Methodology
A quantitative approach on a case study (31) was adopted to examine IAQ in a certified PassivHaus flat in Mexico. This approach includes investigations into the effect of occupant behaviour on IAQ, the performance of the ventilation strategies, building related illnesses and perception of the indoor environment.The case study is limited to one PassivHaus and one standard building practice home. Both meet the following criteria: occupancy
of 2 adults, vertical residences on second floor (flats), similar location, and close to a local monitoring air pollution (<1km). Each of the occupants were approached by the designer of the PassivHaus dwellings (INHAB), followed by a visit to explain the study. Air quality data were simultaneously recorded every five minutes in the living room, main bedroom and kitchen during the summer of 2016 (May-July 2016). Occupant diaries were supplied to obtain information on activities which might influence the results, such as fluctuations in occupancy.Physical IAQ measurements were conducted in accordance with the ASTM Volume 11.07 Air Quality - D7297-14 - Standard Practice for Evaluating Residential Indoor Air Quality (32). The monitored parameters included temperature, relative humidity, CO2, and PM2.5. A series of three Foobot (temperature ±0.4°C, humidity ±4.0%RH, PM2.5 ±4µg/m3 or ±20%) and three NetAtMo (temperature ±0.3°C, humidity ±3.0%RH, CO2 ±50ppm or 5%) devices were installed in each room to eliminate any bias caused by the equipment. Outdoor measurements were downloaded from the local pollution monitoring network (REDMET and RAMA at the HGM station).Information on the building characteristics, occupants’ perception of IAQ and the indoor environment, and building-related health problems was collected using a respondent-friendly self-administrated (33–35) online survey. These questionnaires were designed using validated procedures (32,36–40); one questionnaire was applied for building characteristics and three for occupants’ perception in each household.The data was exported to Excel for initial inspection and then to SPSS for statistical
Año 1, No. 5 NOVIEMBRE-DICIEMBRE2013
analysis.
2.2. Building and household characteristics
The PassivHaus (PH) (Fig. 1A) and the standard building practice home (ST) (Fig. 1B) are located in Mexico City, within 280m from each other. They are one and two bedroom flats respectively, with no heating. The PassivHaus uses an extraction fan as a ventilation system, achieving a total airflow of 42m3/h (11.66l/s), whereas the standard flat relies completely on windows as the main source of ventilation. According to the surveys, none of the participants smoke indoors.
Figure 1. (A) PH and (B) ST flats in Mexico City.
2.3. Building construction
Both dwellings are flats located in a residential area in the Delegación Cuauhtémoc, Mexico City. Dwelling construction and energy efficiency are presented in Table 2.
Table 2. Building characteristics.Building characteristic
PH ST
Airtightness (q50) 0.59 m3/h*m3 Never testedFloor area 42 m2 70 m2
Window type Double 6mm, low-e-claro (PassivHaus certified)
Single 3mm (standard)
3. Results
3.1. Particulate Matter 2.5 results
The PM2.5 levels were usually lower in the PH than the ST (as illustrated in Table 3). High levels of PM2.5 (>25µg/m3 (41,42)) were recorded in both flats. However, when averaged, levels in the PH (M=17.87µg/m3) remain lower than the recommended guidelines of 25µg/m3, whereas those in the ST (M=26.24µg/m3) exceeded this level. Figure 2 compares PM2.5 levels over a week (July) in the living rooms of both dwellings and the outdoors. Mean PM2.5 in the living room in the PH (M=18.40µg/m3) remained below that of the ST (M=25.30µg/m3); similar results were found throughout the three months of the study in the bedrooms, kitchens and living rooms.The difference between indoor and outdoor levels suggests that the PH ventilation strategy suggests some level of protection, as it dissipates the pollution adequately over an extended period of time due to the low airflows and airtightness. During periods, of
1 kidCooking fuel Electric GasHeating fuel -- Electric (when
needed)No. of smokers 1 1Cigarettes ever smoked at home
No No
Mean hours occupied during weekdays
18 15
Mean hours occupied during weekends
16 13
Año 1, No. 5 NOVIEMBRE-DICIEMBRE2013
Figure 2. Indoor and outdoor PM2.5 concentrations in the living rooms at PH and ST flats (01-09/07/2016)
Figure 3. CO2 concentrations in the bedroom of the PH and ST in Mexico City (01-09/07/2016).
high ambient PM2.5, indoor levels of PM2.5
appear to be greater in the PH in contrast with the low background levels. This suggests that the ventilation strategy of the PH offers some protection against the exposure to ambient PM2.5 and it could improve with a better filtration. Peak in PM2.5 at the ST are associated the cooking episodes, however a close relation to the background levels was noticed. Noise problems from the ventilation system were
identified at the PH; occupants reported to turn it off during nights due to the constant background noise.
3.2. Carbon dioxide results
During nights in July, the PH dwelling recorded CO2 levels above the recommended level (>1,000ppm). However, the ST exceeded this threshold
Año 1, No. 5 NOVIEMBRE-DICIEMBRE2013
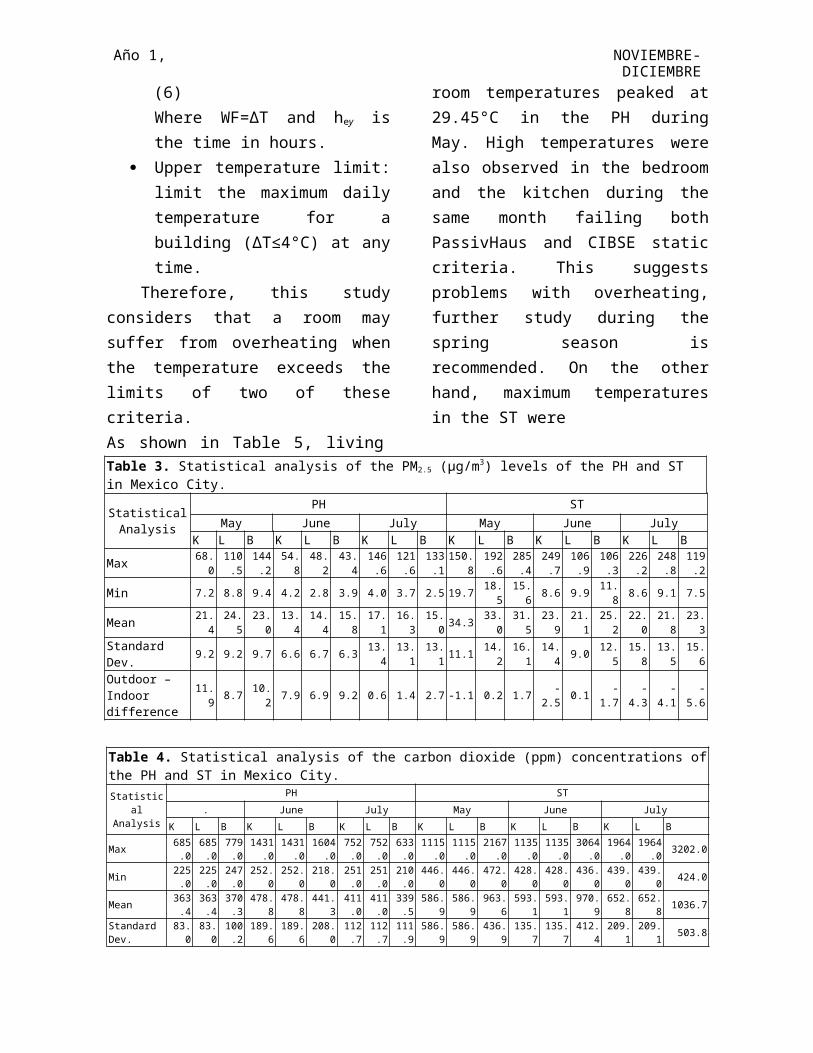
in all three months. Furthermore, mean levels above 3,000ppm were recorded at the ST bedroom during June and July nights, and above 2,000 during May. Significantly higher peak levels (>2,000ppm) were observed in the ST, peaking up to 3,202ppm in the bedroom at night. As illustrated in Figure 3, CO2
concentrations in the bedrooms were significantly higher during the night periods when both flats were reported occupied.Significantly high carbon dioxide levels (>2,000ppm) were recorded in the ST bedroom on three nights, with PH bedroom levels below the recommended guideline (1,000ppm) (43,44) (see Table 4). Mean carbon dioxide levels were considerably higher in the bedroom of the ST than the other rooms. This suggests major problems with ventilation in the main bedroom, as there is no ventilation strategy for the night (windows closed) and therefore no possibility to dissipate the CO2.
3.3. Temperature results
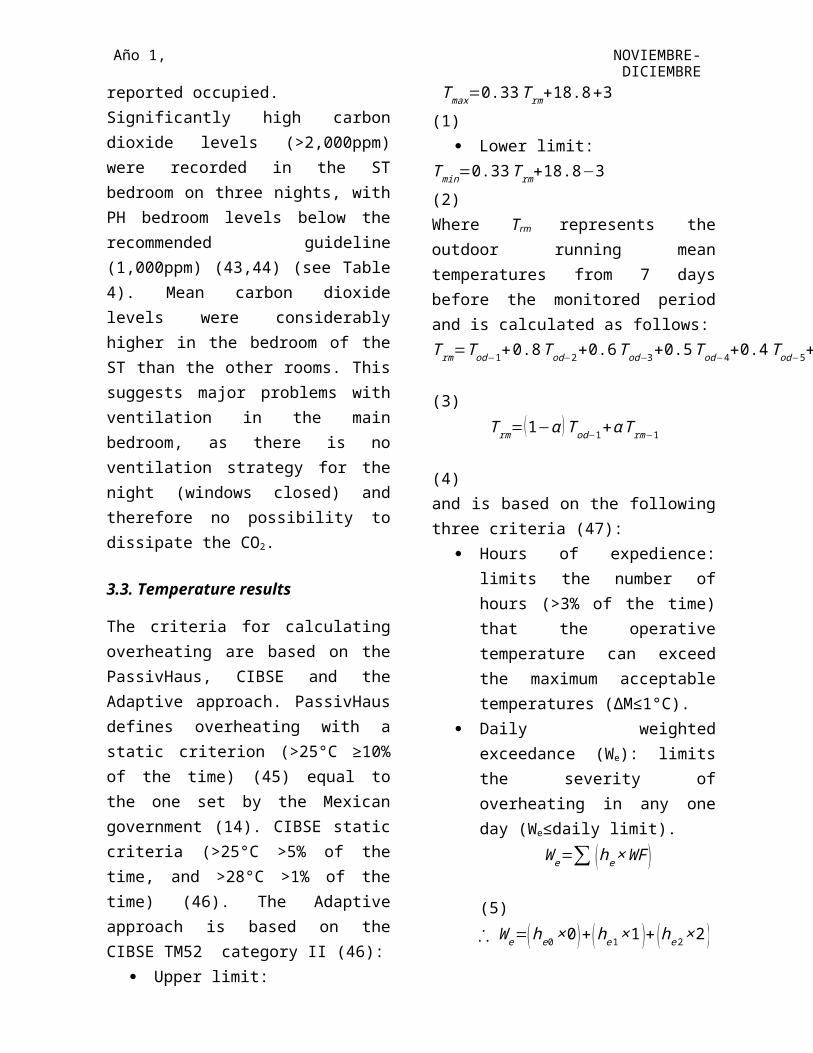
The criteria for calculating overheating are based on the PassivHaus, CIBSE and the Adaptive approach. PassivHaus defines overheating with a static criterion (>25°C ≥10% of the time) (45) equal to the one set by the Mexican government (14). CIBSE static criteria (>25°C >5% of the time, and >28°C >1% of the time) (46). The Adaptive approach is based on the CIBSE TM52 category II (46):
Upper limit: T max=0.33T rm+18.8+3 (1)
Lower limit: T min=0.33T rm+18.8−3 (2)Where Trm represents the outdoor running mean temperatures from 7 days before the
monitored period and is calculated as follows:T rm=T od−1+0.8 Tod−2+0.6 T od−3+0.5 T od−4+0.4 T od−5+0.3T od−6+0.2T od−7
(3)T rm=(1−α ) Tod−1+α Trm−1
(4)and is based on the following three criteria (47):
Hours of expedience: limits the number of hours (>3% of the time) that the operative temperature can exceed the maximum acceptable temperatures (ΔM≤1°C).
Daily weighted exceedance (We): limits the severity of overheating in any one day (We≤daily limit).
W e=∑ (he × WF ) (5)⸫ W e=( he 0× 0 )+(he1 ×1 )+(he2 ×2 ) (6)Where WF=ΔT and hey is the time in hours.
Upper temperature limit: limit the maximum daily temperature for a building (ΔT≤4°C) at any time.
Therefore, this study considers that a room may suffer from overheating when the temperature exceeds the limits of two of these criteria.As shown in Table 5, living room temperatures peaked at 29.45°C in the PH during May. High temperatures were also observed in the bedroom and the kitchen during the same month failing both PassivHaus and CIBSE static criteria. This suggests problems with overheating, further study during the spring season is recommended. On the other hand, maximum temperatures in the ST were
Año 1, No. 5 NOVIEMBRE-DICIEMBRE2013
Table 3. Statistical analysis of the PM2.5 (µg/m3) levels of the PH and ST in Mexico City.
Statistical Analysis
PH STMay June July May June July
K L B K L B K L B K L B K L B K L BMax 68.0 110.5 144.2 54.8 48.2 43.4 146.6 121.6 133.1 150.8 192.6 285.4 249.7 106.9 106.3 226.2 248.8 119.2
May June July May June July May June JulyB L K B L K B L K B L K B L K B L K B L K B L K B L K
PH-01 ●ST-01
24.36°C to 27.07°C during May failing the PassivHaus criteria in the living room and the kitchen. Mean temperatures in the PH ranged from 25.01°C to 25.73°C and in the ST 21.91°C to 24.52°C. On the online surveys, participants indicated general satisfaction with their thermal comfort on both flats, despite stating that on some occasions it gets too warm.
3.4. Relative Humidity results
Levels of relative humidity were observed above the recommended 60%RH across the rooms during June and July, with mean levels ranging from 44.4%RH to 58.1%RH in both flats (Table 6). Levels above 70%RH were observed in the PH only during June, and during June and July at the ST, which indicates conditions that could result in mould growth (48,49). This corresponds to the online surveys in which the ST occupants reported the presence of mould in the last 12 months.
3.5. Indoor air quality perception
Occupants were asked to rate the IAQ in their homes, using a rating scale of seven points. The scales were either unipolar (one extreme good, the other bad) or bipolar (the centre as ideal) depending on the variable as suggested by Raw (40):
Unipolar scale: ideal score: 1. A score higher than 3 requires further
investigation and a score above 5 is cause of concern. Any score greater than the mean should be investigated further and any figure above one standard deviation above the mean should be cause of concern.
Bipolar scale: ideal score: 4. A score outside the range 3-5 requires further investigation, a score outside the range 2-6 is cause of concern. Any figure above one standard deviation from the mean should also be cause for concern.
The scales rate the air in terms of freshness (fresh-stuffy), dryness (dry-humid), odours (odourless-smelly), movement (still-draughty), and overall satisfaction (satisfactory overall-unsatisfactory overall). The mean score of the PH for the fresh-stuffy scale (M=4.67) suggests that further investigation is required. The occupants are in overall satisfied with the conditions of the PH on the whole, even though they did not perceive the air to be particularly fresh. On the other hand, the mean at ST for the movement scale (M=5.67) require further investigation, whereas the odour scale (M=5.33) and the overall satisfaction scale (M=4.00) are causes of concern. This suggests a constant dissatisfaction with the IAQ in the ST as participants perceived the air to be either draughty
Año 1, No. 5 NOVIEMBRE-DICIEMBRE2013
or stuffy, in particular, perception of odours and overall satisfaction was poor (Table 9).
Table 9. Statistical analysis of the IAQ perception of the PH and ST in Mexico City.IAQ perception scale
As in the IAQ perception, participants were asked to complete the online surveys with seven point rate scales, with unipolar and bipolar scales using the scoring system suggested by Raw (40). The scales rate the thermal perception in terms of comfort (comfortable-uncomfortable), temperature (too hot-too cold), condition (stable-varies
during the day), and overall satisfaction (satisfactory overall-unsatisfactory overall).Results from both the PH and ST were generally satisfactory. In fact, both flats have equal results in the temperature scale (M=3.67). Nonetheless, small differences were observed among comfort scale (PH, M=2.00; ST, M=1.67), condition scale (PH, M=2.67; ST, M=2.33), and overall satisfaction (PH, M=2.00; ST, M=1.67). These scores suggest that thermal comfort is similar in both flats, possibly due to the adaptive comfort and the option to control the indoor environment (Table 10).
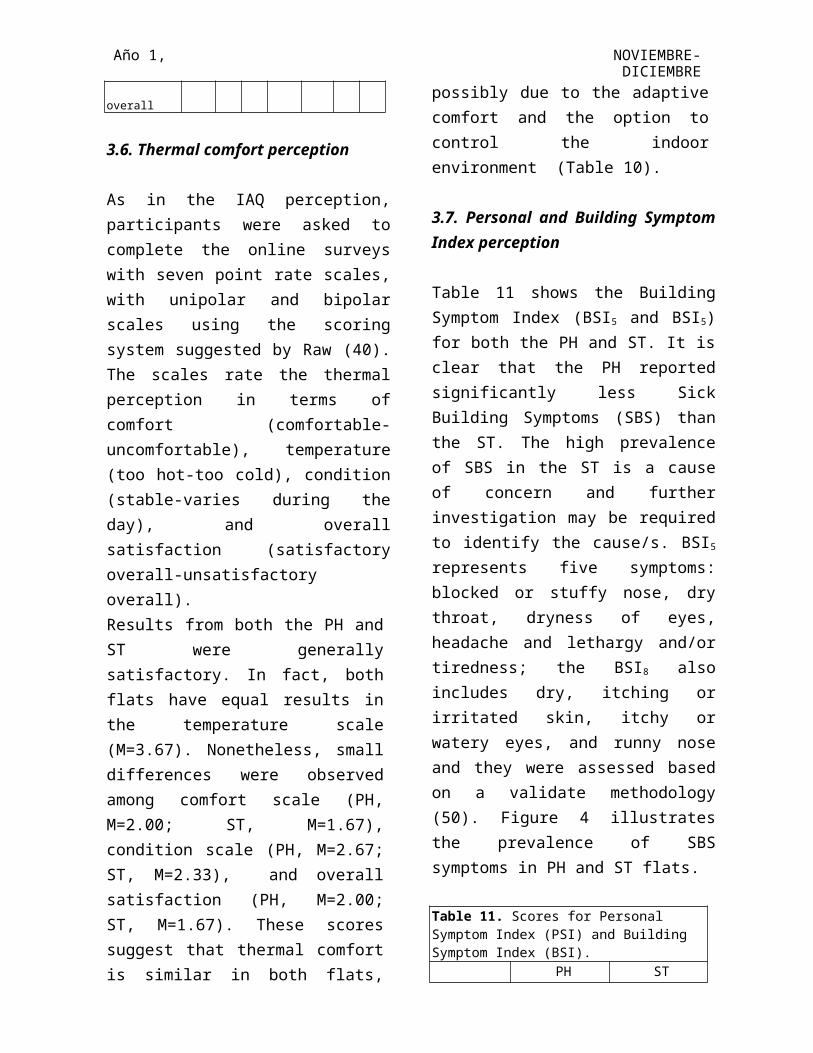
3.7. Personal and Building Symptom Index perception
Table 11 shows the Building Symptom Index (BSI5 and BSI5) for both the PH and ST. It is clear that the PH reported significantly less Sick Building Symptoms (SBS) than the ST. The high prevalence of SBS in the ST is a cause of concern and further investigation may be required to identify the cause/s. BSI5 represents five symptoms: blocked or stuffy nose, dry throat, dryness of eyes, headache and lethargy and/or tiredness; the BSI8 also includes dry, itching or irritated skin, itchy or watery eyes, and runny nose and they were assessed based on a validate methodology (50). Figure 4 illustrates the prevalence of SBS symptoms in PH and ST flats.
Table 11. Scores for Personal Symptom Index (PSI) and Building Symptom Index (BSI).
PH STParticipant A B C A B CAverage PSI5 3 0 0 6 5 7Average PSI8 3 0 2 4 3 5Average BSI5 1.00 4Average BSI8 1.66 6
Año 1, No. 5 NOVIEMBRE-DICIEMBRE2013
Figure 4. Presence of SBS in PH and ST flats in Mexico City.
4. Discussion
PM 2.5 peaked above the recommended 25µg/m3 in all months at the PH (Max 146.61µg/m3) and ST (Max 285.36µg/m3). However, PM2.5 concentrations were generally lower in the PH, with mean concentrations higher in the ST dwelling compared to the PH. It was also observed that PM2.5 levels in the ST were similar to those found outdoors.Statistical analysis shows that there is a significant correlation (<0.000) between indoor measurements in both flats and outdoor levels. Nevertheless, significant differences between indoor and outdoor PM2.5 concentrations were found. For instance, PH bedroom PM2.5 levels
(M=17.84µg/m3, SD=11.58) were lower than the outdoor levels (M=26.43µg/m3, SD=13.72) by 8.59µg/m3 (r=.489); whereas in the ST PM2.5 bedroom levels (M=26.80µg/m3, SD=14.99) were found to be higher than outdoors (M=25.49µg/m3, SD=13.32) by 1.30µg/m3. Similar results were observed in the kitchen and the living room. These results suggest that the ventilation strategy of the ST may be adequate to dissipate indoor air pollution with the trade-off of increasing concentrations of pollutants from outdoor origin. On the other hand, PH is effective in filtering the outdoor pollution, but indoor pollution takes longer to dissipate due to the low airflows. During the measurement period, windows were open as much as possible at the ST flat, whereas in the PH they were only open during cleaning and a few other occasions as stated by the building occupants.Carbon dioxide levels peaked above 1,000ppm in the living room, kitchen and bedroom during June at the PH and constantly in all rooms at ST in all months. Levels above 2,000ppm were observed in the bedroom in May; during June and July levels reached above 3,000ppm at the ST. These results suggest significant problems with ventilation, therefore improvement of the ventilation strategy is highly recommended, especially in bedrooms at night. Standard building practices in Mexico do not contemplate the use of trickle vents. However, small windows are a common ventilation practice and perhaps a better practice, as in many occasions trickle vents may produce inadequate ventilation (10).Overheating was found in the PH during May, as it failed the PassivHaus and CIBSE static criteria for overheating. However,
Año 1, No. 5 NOVIEMBRE-DICIEMBRE2013
when assessing overheating with the Adaptive approach, it only fails in the PH living room during May. These results suggest that the PH is warmer than the ST, which might be beneficial during winter as heating was due to internal gains and building elements rather than radiators. Moreover, this might be a trade for the additional protection against the outdoor environment. Temperature measurements peaked 29.26°C in the PH and 27.07°C in the ST dwelling, when the outdoor temperatures reached 27.20°C. Nor the PH or the ST used any active cooling strategy as source for temperature control. In theory, the PH should provide adequate protection from overheating as it is well insulated, but also has solar shading in the windows exposed to the sun. However, if overheating control is not well addressed from the design process, i.e. control of indoor heat sources, higher temperatures may be observed (47,51–54). Overheating in UK social housing flats built to PassivHaus standard has already been identified (47). If overheating is not well addressed it might cause health problems and peak pollution concentrations (51).Relative humidity levels rose to 70%RH in the ST during June and July, which supports the result of the online surveys as occupants reported the presence of mould in the last 12 months. RH levels above 60%RH were recorded in the PH during June and July. However, mean levels remained in between the 30-60%RH recommended levels, whereas outdoor levels reached 80%RH. Thus outdoor conditions did not have a significant impact on the results. On the other hand, it was noticed that occupancy had an impact on RH similar to CO2. The presence of the ventilation system in the PH may, therefore, have contributed to lower
the humidity as RH levels were consistently lower in the PH dwelling in general.Results from the occupant surveys suggest problems with the perception of IAQ in both flats. Surprisingly, the scale for overall satisfaction of IAQ was rated as satisfactory in the PH, even if the occupants expressed poor perception of air freshness; suggesting that the PH occupants did not consider the freshness of air influential or important to the overall air quality. On the other hand, the occupants of the ST stated overall dissatisfaction with the IAQ; this is supported by the other parameters as the odour and draught scale were causes of concern and dryness and freshness of air were identified as significant issues. Sick Building Syndrome Symptoms (SBS) were reported for the three occupants in each flat. The Building Symptom Index (BSI) was taken from the mean values of the Personal Symptom Index (PSI). The BSI8 for the ST was 6 and for the PH 1.66, whereas BSI5 was assessed to 4 for the ST and 1 for the PH, suggesting a high prevalence of SBS in the ST. Consequently ST households recorded in average 4 SBS (BSI5) per person.Results indicate that the higher prevalence of SBS, higher levels of PM2.5, CO2 and lower IAQ satisfaction scores converge in the ST flat. This suggests that improvements to the PassivHaus standard, when achieved correctly, may ensure the provision of higher indoor environment quality and an additional layer of protection against the outdoor pollution, resulting in a healthier indoor environment.Finally, some problems were identified in the PH: maintenance of the ventilation system, air filtration and noise. Solving them could help to provide even higher environmental quality. Maintenance and air
Año 1, No. 5 NOVIEMBRE-DICIEMBRE2013
filtration are closely related to each other. The owner understands the importance of air filtration, however the Filters F7, suggested by the PassivHaus Institute, were removed and air filtration was not possible. This was due to the difficulties in replacing such filters periodically as they are difficult to find in Mexico, but moreover, replacement of the filters may require specialised training to access the inlet (Fig 5a) to change the filter, and recalibrate the airflows to the 42m3/h required. Furthermore, the extraction fan (Fig 5b) is inaccessible for cleaning. Background noise was another issue as participants admitted to turn off the ventilation system at night for this reason. However, the extraction fan not always might be turned on again in the mornings as it lacks from an automatic switch and occupants forget to do it in the morning. If airtightness is to be achieved in Mexican dwellings in the future, special attention should be paid to the ventilation, not only to provide better indoor spaces but for the protection of the building itself.Further lines of inquiries could be focused on comparing the PH and the ST when unoccupied to assess the building elements without the bias of the occupant behaviours and if possible consider the installation of the filters for an adequate function of the ventilation system for the PH.
4. Conclusion
This study investigated the impact of the PassivHaus standard in the context of a Mexican dwelling. However, due to the limited number of study cases in Mexico (just one PassivHaus at the time of this study), it is not possible to generalise the results. Nevertheless, findings suggest that improvement to the indoor environment and
specifically the indoor air quality can be achieved with the implementation of the PassivHaus standard in Mexico City. For instance, low levels of PM2.5 and low concentrations of CO2 were observed in the PassivHaus. Recorded levels of PM2.5 in the ST dwelling were found to be higher than the outdoors (ΔMoutdoor-indoor bedroom 1.30µg/m3, living room 0.01µg/m3, and kitchen 0.79µg/m3); whereas the PH concentrations were lower than the outdoors (ΔMoutdoor-indoor bedroom 8.59µg/m3, living room 6.94µg/m3, and kitchen 8.06µg/m3) despite the high levels of airtightness. Despite this, particular problems with the ventilation system were identified, such as the background noise, maintenance and the lack of air filtration, which if solved could help to further reduce the pollution coming from outside.
Figure 5. Inlet (A) and extraction fan (B) of the ventilation system at the PH in Mexico City.
Año 1, No. 5 NOVIEMBRE-DICIEMBRE2013
Levels of CO2 in the PassivHaus dwelling suggest that the ventilation rates are adequate, as the background levels were below those recommended by the guidelines, peaking in rare occasions above 1,000ppm. CO2 levels at the ST were significantly above the recommended, on several occasions above the 2,000ppm. Overheating was not identified as a problem in either dwelling, though the PassivHaus recorded warmer temperatures. Further investigation is required as the occupants of the ST stated feeling uncomfortable during winter.The low levels of relative humidity observed in the PassivHaus suggest that the ventilation strategy may result in a potential reduction of mould proliferation. The higher levels (>70%RH) in the standard building practice flat were associated with the mould growth reported by the participants. No levels below 30%RH were recorded. Further investigation is recommended during winter, the dry season in Mexico City.Finally, the occupants’ perception of IAQ was satisfactory in the PassivHaus. However, the perception of freshness of air suggests further investigation. This in contrast to the ST flat, which all the criteria were rated unsatisfactory other than the freshness of the air. This suggests that PassivHaus occupants trade air freshness for additional protection against the outdoor pollution. However, the overall IAQ satisfaction was reported as satisfactory, hence the occupants did not consider the freshness important. Furthermore, the PassivHaus provides a environment with less SBS, as indicated by the BSI. On the other hand, the high presence of SBS at the ST requires further investigation. Further
studies of IAQ in different low energy homes in Mexico are required and should take place on a larger scale, including design, construction, operation and maintenance.
5. Acknowledgments
This work would not be possible without the support of INHAB and the participation of the building occupants, to which we are thankful. The authors are also grateful to Adam Hotson for editing this manuscript.This study was partially funded by CONACyT.
6. References
1. WHO. WHO guidelines for indoor air quality: selected pollutants. First Edit. Theakston F, editor. Vol. 9. Copenhagen: World Health Organization Regional Office for Europe; 2010. 454 p.
2. Emmerich SJ, Persil AK. Indoor air quality in Sustainable, energy efficient buldings. HVAC&R Res. 2012;18(1–2):4–20.
3. Sharpe T, Gregg M, Mawditt I. Characteristics and performance of MVHR systems A meta study of MVHR systems used in the Innovate UK Building Performance Evaluation. 2016.
4. Crump D, Dengel A, Swainson M. Indoor air quality in highly energy efficient homes—a review. … Report NF18. Milton Keynes: National House …. BRE press; 2009.
5. Sullivan L, Smith N, Adams D, Andrews I, Aston W, Bromley K, et al. Mechanical Ventilation With Heat Recovery in New Homes. London; 2013.
6. McGill G, Oyedele LO, McAllister
Año 1, No. 5 NOVIEMBRE-DICIEMBRE2013
K. Case study investigation of indoor air quality in mechanically ventilated and naturally ventilated UK social housing. Int J Sustain Built Environ. 2015;4(1):58–77.
7. Levin H. Integrating Indoor Air and Design for Sustainability. Indoor Air. 2005;(January 2005):1–6.
8. Mendell M. Do we Know Much about Low Energy Buildings and Health? In: ASHRAE IAQ: Environmental Health in Low Energy Buildings. Vancouver; 2013. p. 15–8.
9. McGill G, Oyedele LO, Mcallister K, Qin M. Effective indoor air quality for energy-efficient homes : a comparison of UK rating systems. Archit Sci Rev. 2015;8628(December).
10. Howieson S, Sharpe T, Farren P. Building tight - ventilating right? How are new air tightness standards affecting indoor air quality in dwellings? Build Serv Eng Res Technol. 2013;35(5):475–87.
11. Sharpe T, Charles A. VENTILATION PROVISION AND OUTCOMES IN MAINSTREAM CONTEMPORARY NEW-BUILDING FLATS IN LONDON, UK. In: Colorado U of, editor. PROCEEDINGS HEALTHY BUILDINGS 2015 AMERICA - Innovation in a Time of Energy Uncertainty and Climate Adaptation. Boulder, Colorado: International Society of Indoor Air Quality and Climate; 2016. p. 29–32.
12. Feist W. Technical Annex : Evaluation of social housing building types in Mexico: Study of energy efficiency, additional costs and CO2 mitigation as basis for the preparation of the "Suppeorted NAMA for Sustainable Housing in Mexico - Mitigation Actions and
Neuhauss W, Ebel W, Theumer, Susanne; Rivero M del C, et al. NAMA Apoyada para la Vivienda Sustentable en México – Acciones de Mitigación y Paquetes Financieros. Mexico; 2012.
14. Secretaria de Economía. NMX-AA-164-SCFI-2013 - Edificación sustentable - criterios y requerimientos ambientales mínimos [Internet]. NMX-AA-164-SCFI-2013 Mexico: http://biblioteca.semarnat.gob.mx/janium/Documentos/Ciga/agenda/DOFsr/DO3156.pdf; 2013 p. 1–158. Available from: http://biblioteca.semarnat.gob.mx/janium/Documentos/Ciga/agenda/DOFsr/DO3156.pdf
15. Molina CM. Estudio sectorial edificaciones sustentables. 2012;
16. Fernandez Marinez X, Gomez Brechtel F, Garnier J-Y, Kieffer G, Zahrer D, Bourges Diaz C, et al. Indicadores de Eficiencia energética en Mexico: 5 sectores, 5 retos. Mexico; 2011.
17. Ochoa Sosa R (Centro MM, Gingsburg A (Centro MM, Cobas E (Centro MM, Isarel J (Centro MM, Pérez Á (Centro MM. Vivienda Sustentable, la localización como factor estratégico para si desemeño ambiental, economico y social. Mexico; 2014.
18. Centro Mario Molina. Desarrollo Sustentable. Evaluación la Sustenatbilidad la Vivienda en México [Internet]. 2012;1–8. Available from: http://centromariomolina.org/desarrollo-sustentable/evaluacion-de-la-sustentabilidad-de-la-vivienda-en-mexico/
19. Holguín F, Téllez-Rojo MM, Hernández M, Cortez M, Chow JC, Watson JG, et al. Air pollution and
Año 1, No. 5 NOVIEMBRE-DICIEMBRE2013
heart rate variability among the elderly in Mexico City. Epidemiology. 2003;14(5):521–7.
20. Molina LT, Molina MJ. Improving air quality in megacities: Mexico City case study. Ann N Y Acad Sci. 2004;1023:142–58.
21. Edgerton S a, Bian X, Doran JC, Fast JD, Hubbe JM, Malone EL, et al. Particulate Air Pollution in Mexico City : A Collaborative Research Project. 2000;49(October):1221–9.
22. Borja-Aburto V, Loomis D, Bangdiwala S, Shy C, Rascon Pacheco R. Ozone, Suspended particles, and Daily Mortality in Mexico City. Epidemol. 1997;145(3):258–68.
23. BBC News. Mexico City’s dirty truth [Internet]. 2002 [cited 2005 May 20]. Available from: http://news.bbc.co.uk/1/hi/world/americas/1809705.stm
24. SEDEMA S del MA del DF. Calidad del Aire de la Ciudad de Mexico [Internet]. Calidad del Aire. 2015 [cited 2010 May 20]. Available from: http://www.aire.df.gob.mx/default.php
25. Yip M, Madl P. Air pollution in Mexico City: smog, health effects, fossil fuels [Internet]. 2000 [cited 2015 May 1]. Available from: http://biophysics.sbg.ac.at/mexico/air.htm#Pollution
26. Cortez-Lugo M, Mercado-García A, Hernández-Avila M, Meneses-González F, Palazuelos-Rendón E. Evaluación de la calidad del aire interior y exterior en un jardín de niños de la Ciudad de México. Salud Publica Mex. 1998;40(5):415–20.
27. Bell ML, Davis DL, Gouveia N, Borja-Aburto VH, Cifuentes L a. The avoidable health effects of air pollution in three Latin American
cities: Santiago, São Paulo, and Mexico City. Environ Res. 2006;100(3):431–40.
28. Rojas L. Implications of air pollution on helath in Mexico City’s Metropolitan Area and the potential benefits of applying control measures. Mexico;
29. Moreno Rangel A, Musau F. A better social housing for Mexico City: evaluation of desing and indoor environment of common typologies. In: PLEA2015 Architecture in (R)Evolution. Bologna: PLEA; 2015.
30. Gómez G, Bojórquez G, Ruiz P, Romero R, Ochoa J, Pérez M, et al. Comfort Temperatures Inside Low-Cost Housing. Case: Six warm climate cities in Mexico. In: 26th Conference on Passive and Low Energy Architecture, Quebec City, Canada. Quebec; 2009. p. 6.
31. Phelps AF, Ph D, Horman MJ, Ph D. Ethnographic Theory-Building Research in Construction. 2010;136(January):58–65.
32. ASTM. ASTM Volume 11.07 Air Quality - D7297-14 - Standard Practice for Evaluating Residential Indoor Air Quality [Internet]. 2014. Available from: http://www.astm.org/BOOKSTORE/BOS/1107.htm
33. Dillman DA, Tortora RD, Bowker D. Principles for Constructing Web Surveys. Jt Meet Am Stat Assoc [Internet]. 1998;1–16. Available from: http://survey.sesrc.wsu.edu/dillman/papers/1998/principlesforconstructingwebsurveys.pdf
34. Dillman DA, Bowker DK. The Web Questionnaire Challenge to Survey Methodologists. Online Soc Sci. 2000;53–93.
35. Denscombe M. The Length of Responses to Open-Ended Questions: A Comparison of Online
Año 1, No. 5 NOVIEMBRE-DICIEMBRE2013
and Paper Questionnaires in Terms of a Mode Effect. Soc Sci Comput Rev. 2008;26(3):359–68.
36. Berry R, Crump D, Brown V, Coward SKD. Indoor air quality in homes, part 1. Watford: BRE press; 1996. 1 p.
37. Berry R, Brown V, Coward SKD, Crump D. Indoor air quality in homes, part 2: Annexes. Watford: BRE press; 1996. 199 p.
38. Coward SKD, Llewellyn JW, Raw GJ, Brown V, Crump D, Ross D. Indoor Air Quality in Homes in England. First Edit. London: BRE bookshop; 2001. 1-92 p.
39. Crump D, Raw GJ, Upton S, Scivyer C, Hunter C, Hartless R. A protocol for the assessment of indoor air quality in homes and office buildings. First Edit. London: BRE bookshop; 2002. 48 p.
40. Raw GJ, Roys MS, Whitehead C, Tong D. Questionnaire desing for sick building syndrome: an empirical comparison of options. Environ Int. 1995;22(1):61–72.
41. Commission E. Air Quality Standards [Internet]. Air Quality. 2015 [cited 2015 Sep 10]. p. 2. Available from: http://ec.europa.eu/environment/air/quality/standards.htm
42. WHO. Air quality guidelines for Europe [Internet]. Sencond Ed. Theakston F, editor. WHO Regional Publications, European Series; No. 91. Copenhagen: WHO Regional Publications; 2000. 1-288 p. Available from: http://link.springer.com/10.1007/BF02986808%5Cnhttp://www.springerlink.com/index/10.1007/BF02986808
43. Porteous CD a. Sensing a Historic Low-CO 2 Future. In: Mazzeo DN, editor. Chemistry, Emission Control, Radioactive Pollution and Indoor Air Quality [Internet].
InTech; 2011. p. 213–46. Available from: http://www.intechopen.com/books/chemistry-emission-control-radioactive-pollution-and-indoor-air- quality/sensing-a-historic-low-co2-future
44. ASHRAE. ASHRAE standard 62.1-2007 Ventilation for Acceptable Indoor Air Quality. Vol. 2007. Atlanta, GA; 2007.
45. Bere J. Introduction to passive house [Internet]. First Edit. London: RIBA Publishing; 2013. 121 p. Available from: http://www.ihsti.com/CIS/Doc.aspx?AuthCode=45635f6&DocNum=305381&from=/CIS/Search.aspx?Authcode=45635f6&st=0&fs=0_doc_Type_False_AND%5E1_Last+5+years_PUBL_True_AND&t=Double-glazing+sealed+units&pt=s&pn=5&t=Double-glazing sealed units&pt=s&type=
46. CIBSE. TM52: The Limits of Thermal Comfort: Avoiding Overheating in European Buildings [Internet]. UK; 2013 p. 1–24. Available from: http://www.cibse.org/Knowledge/knowledge-items/detail?id=a0q20000008I7f5AAC
47. Tabatabaei Sameni SM, Gaterell M, Montazami A, Ahmed A. Overheating investigation in UK social housing flats built to the Passivhaus standard. Build Environ. 2015;92:222–35.
48. Johansson P, Ekstrand-tobin A, Svensson T, Bok G. International Biodeterioration & Biodegradation Laboratory study to determine the critical moisture level for mould growth on building materials. Int Biodeterior Biodegradation [Internet]. 2012;73:23–32. Available from:
Año 1, No. 5 NOVIEMBRE-DICIEMBRE2013
http://dx.doi.org/10.1016/j.ibiod.2012.05.014
49. Johansson P, Svensson T, Ekstrand-Tobin A. Validation of critical moisture conditions for mould growth on building materials. Build Environ [Internet]. 2013;62:201–9. Available from: http://dx.doi.org/10.1016/j.buildenv.2013.01.012
50. Raw GJ. A Questionnaire for Studies of Sick Building Syndrome: a Report To the Royal Society of Health. Building Research Research, editor. Watford: BRE press; 1995. 21 p.
51. Hasselaar E. Health risk associated with passive houses : An exploration. Building [Internet]. 2008;30(August):17–22. Available from: http://www.jstor.org/stable/10.2307/1208409
52. Peacock AD, Jenkins DP, Kane D. Investigating the potential of overheating in UK dwellings as a consequence of extant climate change. Energy Policy [Internet]. 2010;38(7):3277–88. Available from: http://dx.doi.org/10.1016/j.enpol.2010.01.021
53. Mlakar J, Štrancar J. Overheating in residential passive house: Solution strategies revealed and confirmed through data analysis and simulations. Energy Build. 2011;43:1443–51.
54. McLeod RS, Hopfe CJ, Kwan A. An investigation into future performance and overheating risks in Passivhaus dwellings. Build Environ [Internet]. 2013;70:189–209. Available from: http://dx.doi.org/10.1016/j.buildenv.2013.08.024