This discussion paper is/has been under review for the journal Atmospheric Measure-ment Techniques (AMT). Please refer to the corresponding final paper in AMTif available.
On differentiating ground clutter andinsect echoes from Doppler weatherradars using archived data
S. J. Rennie1, A. J. Illingworth1, and S. L. Dance1,2
1Department of Meteorlogy, University of Reading, Reading, UK2Department of Mathematics, University of Reading, Reading, UK
Received: 23 March 2010 – Accepted: 6 April 2010 – Published: 16 April 2010
Published by Copernicus Publications on behalf of the European Geosciences Union.
1843
Abstract
Normally wind measurements from Doppler radars rely on the presence of rain. Duringfine weather, insects become a potential radar target for wind measurement. However,it is difficult to separate ground clutter and insect echoes when spectral or polarimet-ric methods are not available. Archived reflectivity and velocity data from repeated5
scans provide alternative methods. The probability of detection (POD) method, whichmaps areas with a persistent signal as ground clutter, is ineffective when most scansalso contain persistent insect echoes. We developed a clutter detection method whichmaps the standard deviation of velocity (SDV) over a large number of scans, and candifferentiate insects and ground clutter close to the radar. Beyond the range of persis-10
tent insect echoes, the POD method more thoroughly removes ground clutter. A new,pseudo-probability clutter map was created by combining the POD and SDV maps.The new map optimised ground clutter detection without removing insect echoes.
1 Introduction
Ground clutter is a major contaminant of weather radar scans. It is particularly obstruc-15
tive when extracting comparatively weak insect echoes. Insects represent a potentialDoppler radar target for wind measurement during fine weather. Normally Dopplerradar wind observations for data assimilation in numerical weather prediction are onlyavailable from precipitation echoes, as is the case in the UK at present (N. Gaus-siat, personal communication, 2010). Recent efforts to utilize insect echoes for wind20
observations have been hampered by the difficulty of removing ground clutter con-tamination (Rennie et al., 2010). Although target detection and clutter filtering canbe accomplished using spectral analysis of the raw radar signal (e.g. Bachmann andZrnic, 2008a; Hubbert et al., 2009a,b; Unal , 2009), such methods were not availablewhen the utilization of insect echoes was explored. Therefore we sought to differentiate25
insect echoes and ground clutter using only reflectivity and velocity. Such a technique
1844
is also applicable to reanalysis of archives containing only the primary parameters (re-flectivity (Z ) and velocity (V )), or when no data from insect-free (viz winter) periods areavailable.
Many clutter detection methods for single polarisation radars have been used op-erationally (Alberoni et al., 2003; Meischner et al., 1997). “Simple” methods, such as5
mapping clutter using reflectivity, or identification by zero-velocity from Doppler radars,are being superseded by spectral methods and complex algorithms. There are recentexamples of spectral techniques in the literature. For example, the UK Met Office pro-duces a clutter indicator (ci) that describes the average pulse-to-pulse signal variability,which for “perfect” clutter should be 0 (Sugier et al., 2002). Ci can detect both ground10
clutter and anomalous propagation echoes (anaprop).Another new clutter identification parameter, the Clutter Phase Alignment (CPA)
(Hubbert et al., 2009a) is calculated as the ratio of the magnitude of the vector sumof the individual signal time series members divided by the sum of the magnitudes ofthe members. It has the advantage that it measures only phase changes and is un-15
affected by any variations in the power of the return. Improved clutter detection wasachieved by combining CPA with the Clutter Mitigation Decision algorithm (Hubbert etal., 2009b; Ice et al., 2009). The latter is a fuzzy logic algorithm (for single or dualpolarisation) which uses spectral and spatial characteristics.
In another example, Warde and Torres (2009) described a dynamic spectral method20
which utilises the high power and narrow spectral width of clutter, to optimally match thethe ground clutter environment. Such dynamic methods have advantages over staticclutter methods. However, the effectiveness of these methods must be reduced forweak signals where the ground clutter’s spectral characteristics are less representative.Bachmann and Zrnic (2008a) described a white clutter residue noise that obscured25
weak clear-air echoes. This noise remained after the near-zero velocity signals wereremoved, but could be filtered by further spectral analysis and filtering. Treatment ofsuch a “noisy” clutter signal would be an important factor when removing ground clutterfrom amongst weak insect echoes.
1845
Dual polarisation also offers a wide variety of methods (e.g. Friedrich et al., 2009;Gourley et al., 2007; Hurtado and Nehorai, 2008; Unal , 2009). Dual polarisation mayalso be used to discriminate airborne fauna (Bachmann and Zrnic, 2008b; Gauthreauxet al., 2008). The UK’s first dual polarisation radar has been demonstrated to success-fully discriminate insects and clutter (Rennie et al., 2008, 2010). Dual polarisation is5
more effective than single polarisation for identifying insects (e.g. Rennie et al., 2008)and also permits discrimination using only the data from individual scans.
The new clutter detection method described here arose from the endeavour to extractinsect echoes from the UK C-band weather radar network (Rennie et al., 2010). Duringthe field season for this work, the ci parameter mentioned above was produced by the10
UK Met Office for the long pulse scans only. It was apparent from the long pulse datathat the ci of insects was much greater than zero, so ci has the potential for futureinsect/clutter discrimination. However, in the absence of the raw signal informationor pre-processed spectral analysis, it was necessary to develop an alternative groundclutter detection method. The method used only reflectivity and velocity from archived15
scans. In this paper, Sect. 2 describes the radar data format and the general methodfor processing. Section 3 describes the development of two clutter detection methods,the probability of detection and the new standard deviation of velocity. In Sect. 4 thesemethods are appraised using an example and in Sect. 5 we propose an optimal solutionfor clutter detection based on the results.20
2 Data and processing
There are four operational single-polarisation Doppler radars in the UK, from whichdata were collected during the summers of 2007 (Chenies only), 2008 and 2009. Threeradars (Clee Hill, Cobbacombe and Dean Hill) have severe clutter that limits the area inwhich insects can be detected. Chenies has much less clutter, which is predominantly25
urban clutter because the radar is near London. The other radars’ clutter results mostlyfrom rural topography, which can be more difficult to detect due to non-stationary veg-
1846
etation (Sugier et al., 2002).The raw data comprise PPI (plan position indicator) conical scans that form a 2-D
map around the radar, with dimensions of 360 1◦ rays by 167 range gates of 600 m.The elevations are nominally 1◦ 2◦ 4◦ 6◦ and 9◦. To utilize insect returns, those sam-ple volumes which contain insect echoes must be separated from those which contain5
ground clutter, birds, other types of contamination, or empty sample volumes. Precip-itation echoes rarely coincide with insect echoes, and precipitation is also useful forwind observations. It may be supposed that a sample volume can contain a mixtureof echo sources, especially farther from the radar as the beam spreads. Backscatterfrom side-lobes can also contribute targets “observed” within the sample volume. This10
makes target identification more difficult. A generic scheme for processing Dopplerdata is described below.
The first stage in processing is to exclude data from empty sample volumes, andfrom weak signals for which the user should not trust the velocity measurement. Noisefrom the amplifier will yield a constant signal that is observed in empty sample volumes.15
Removal of all weak signals can be accomplished by applying a threshold above thisnoise signal to ensure a minimum signal-to-noise ratio. Alternatively the thresholdcould be specified by the lower limit of reflectivity for whatever target is of interest,e.g. precipitation above 0 dB. It must also be noted that the radar detection thresholdincreases with range due to beam spreading.20
Unreliable velocity measurements from weak signals or randomly-moving targetscould alternatively be identified using signal parameters such as Doppler width, or asignal quality index (SQI). SQI as produced by the UK Met Office is defined as |R1|/R0,i.e. power normalized modulus of the autocorrelation at lag one (Doviak and Zrnic,1984). In our experience, sample volumes excluded by either SQI or a suitable noise25
threshold are mostly coincident. The noise threshold option was used here because itdid not require an additional parameter beyond Z and V.
The next stage is to remove the ground clutter, which would constitute the bulk ofnon-meteorological and non-biological returns. The amount of ground clutter can vary
1847
greatly among radars, depending on the radar location, surrounding topography, andsuppression of side-lobes. In Sect. 1 a variety of techniques for identifying groundclutter was described, which utilise the characteristic motionlessness of the ground.The simplest method using only Z and V is to exclude near-zero velocities, but thisremoves valid insect or precipitation zero velocities and leaves too much ground clutter.5
In practice, ground clutter does not always give a consistent return. We found thatsample volumes which were very likely clutter-affected, e.g. those with a signal abovethe detection threshold located at the periphery of regions that were obvious groundclutter, could register a speed as great as 10 m s−1. For this reason more discriminatingmethods were sought.10
Final processing stages can include texture or Laplacian filtering, whereby large spa-tial changes in velocity or reflectivity between adjacent sample volumes indicate unre-liable measurements. This final stage is important to filter out birds, aeroplanes or anyother undesirable echoes, to ensure a wind product with minimal gross errors. We donot examine this further processing here.15
3 Clutter detection methods
Two clutter detection methods, probability of detection and standard deviation of veloc-ity, are described here. The variation of reflectivity over time was similarly explored,but proved less suitable so is not discussed here. Probability of detection is an estab-lished method (Alberoni et al., 2003) that uses accumulated counts over many scans,20
effectively creating a map of clutter.
3.1 Probability of detection (POD)
Probability of detection describes the frequency that a real target is detected withina sample volume. This may be determined from the frequency with which a samplevolume returns a signal above a threshold, ideally the same threshold used to remove25
1848
empty sample volumes. Aggregated threshold exceedance over a period of many daysto several months should indicate the ground clutter locations. The aggregate may benormalised to a value between 0 and 1, where 1 indicates 100% probability of clutter.Ideally the POD is created using scans close to the time of interest (e.g. recent monthsfor contemporary scans). This reduces problems from ground clutter changing over5
time, such as with the seasons.The POD characteristics for various targets are described below, assuming a thresh-
old close to the noise limit.
– Ground clutter: generally high POD values. Lower values may be retrieved inmarginal areas, e.g. where small changes in the beam propagation affect the10
presence of clutter echoes, or where the returned signal is at the threshold level.
– Precipitation: low POD values. Over a long period each sample volume will con-tain precipitation for only a small fraction of the time.
– Insects: insects normally occupy a shallow layer in the atmosphere, with distri-bution dependent upon the atmospheric conditions (e.g. Wood et al., 2009a,b).15
In the UK, from autumn to spring during dry weather, typically there are insectechoes within several hundred metres above ground level at all times of day andnight, so a POD formed using data from summer will have a high value close tothe radar.
– Birds: birds appear as random speckle, except during major migration periods,20
and will not contribute a high POD.
– Refraction: strong atmospheric refraction can reflect the signal back to the radar,or cause ground clutter or sea clutter to irregularly appear in some scans, i.e.anaprop. The POD will not detect this.
1849
3.2 Standard deviation of velocity (SDV)
The variation in velocity at a location over an extended period of time provides a newclutter detection method. The standard deviation (std. dev.) of velocity calculated overmany days should manifest different properties for different target types. Clutter shouldhave the most constant velocity, noise will yield variable velocity, and precipitation is too5
transient to detect. Regions with omnipresent insects will yield a moderate std. dev.arising from the typical spread of wind velocities.
The std. dev. is calculated for each sample volume over repeated scans, to forma map of values. A computationally cheap method is proposed. The std. dev. σ isdefined as the root mean square (RMS) of the difference between a value xn and the10
mean, x, i.e.,
σ =
√√√√ 1N
N∑n=1
(xn− x)2
where N is the number of samples, or in this context scans. However, by assumingthat x= 0, the calculation simplifies to the RMS of velocity over time, σ′. This assump-tion holds because (1) the mean velocity of noisy gates should be zero; (2) the mean15
velocity of stationary ground clutter should be zero; (3) the mean wind velocity over along period of time should be zero; and (4) any other random targets should contributea mean velocity of zero. (Regions with constant prevailing winds may require carefultreatment.) In tests, the resulting σ′ closely approximated the true σ.
The new standard deviation of velocity (SDV) parameter was created by convert-20
ing σ′ values into a pseudo-probability map, which makes it analogous to POD. (Thischoice is exploited later.) Empirically it was determined that σ′ > 7 m s−1 represented0% probability of being clutter, and the minimum σ′ (near 0) is 100% likely to be clut-ter. The pseudo-probability is calculated by: (1) SDV= 7−σ′; (2) if SDV< 0 then setSDV= 0; (3) normalize SDV to be between 0 and 1 (divide the map of values by the25
1850
maximum SDV value). Hence SDV= 1 is likely to be clutter just as POD= 1 is likely tobe clutter.
4 Appraisal of methods
Here POD and SDV are applied, along with a noise threshold, to demonstrate their ac-curacy and functionality in separating insects and clutter. In practice, additional thresh-5
olds of Z and V may be considered in conjunction with these methods (e.g. Rennie etal., 2010).
The example chosen is from a cluttered radar (Clee Hill), which is located in Englandnear the Welsh border. POD and SDV maps were created using archived radar datafrom summer. Then a scan was chosen from a day with good insect returns and a few10
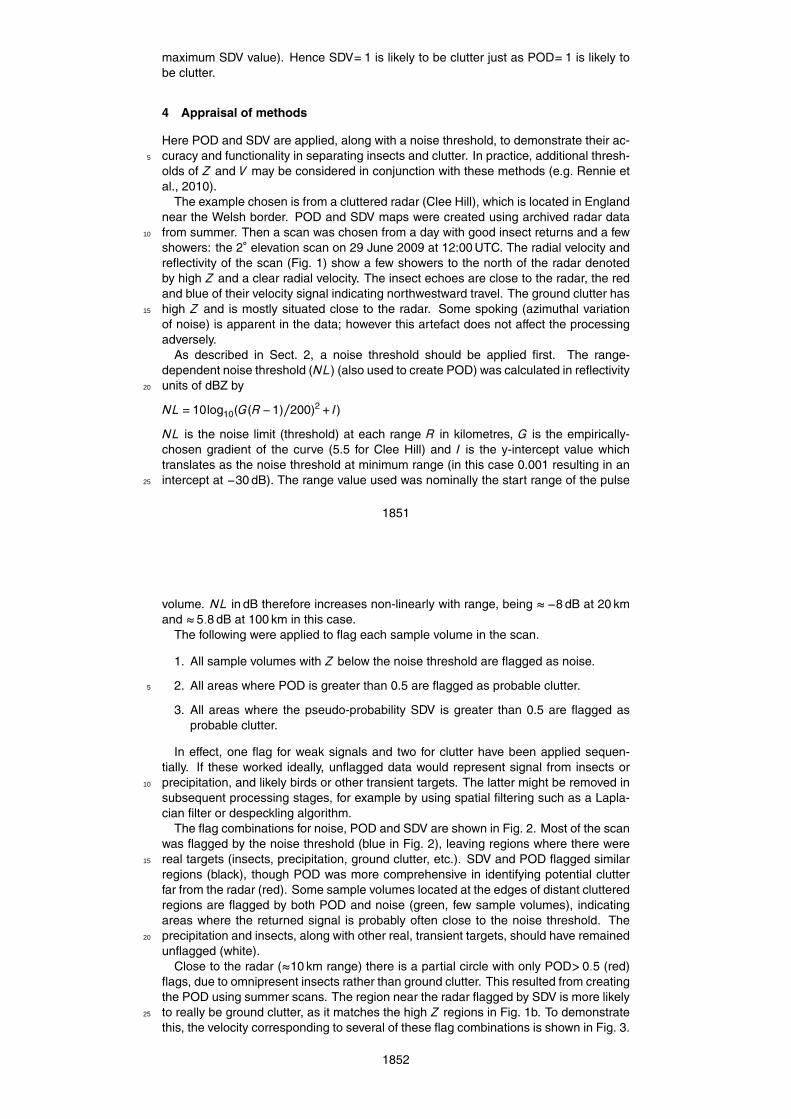
showers: the 2◦ elevation scan on 29 June 2009 at 12:00 UTC. The radial velocity andreflectivity of the scan (Fig. 1) show a few showers to the north of the radar denotedby high Z and a clear radial velocity. The insect echoes are close to the radar, the redand blue of their velocity signal indicating northwestward travel. The ground clutter hashigh Z and is mostly situated close to the radar. Some spoking (azimuthal variation15
of noise) is apparent in the data; however this artefact does not affect the processingadversely.
As described in Sect. 2, a noise threshold should be applied first. The range-dependent noise threshold (NL) (also used to create POD) was calculated in reflectivityunits of dBZ by20
NL=10log10(G(R−1)/200)2+ I)
NL is the noise limit (threshold) at each range R in kilometres, G is the empirically-chosen gradient of the curve (5.5 for Clee Hill) and I is the y-intercept value whichtranslates as the noise threshold at minimum range (in this case 0.001 resulting in anintercept at −30 dB). The range value used was nominally the start range of the pulse25
1851
volume. NL in dB therefore increases non-linearly with range, being ≈−8 dB at 20 kmand ≈5.8 dB at 100 km in this case.
The following were applied to flag each sample volume in the scan.
1. All sample volumes with Z below the noise threshold are flagged as noise.
2. All areas where POD is greater than 0.5 are flagged as probable clutter.5
3. All areas where the pseudo-probability SDV is greater than 0.5 are flagged asprobable clutter.
In effect, one flag for weak signals and two for clutter have been applied sequen-tially. If these worked ideally, unflagged data would represent signal from insects orprecipitation, and likely birds or other transient targets. The latter might be removed in10
subsequent processing stages, for example by using spatial filtering such as a Lapla-cian filter or despeckling algorithm.
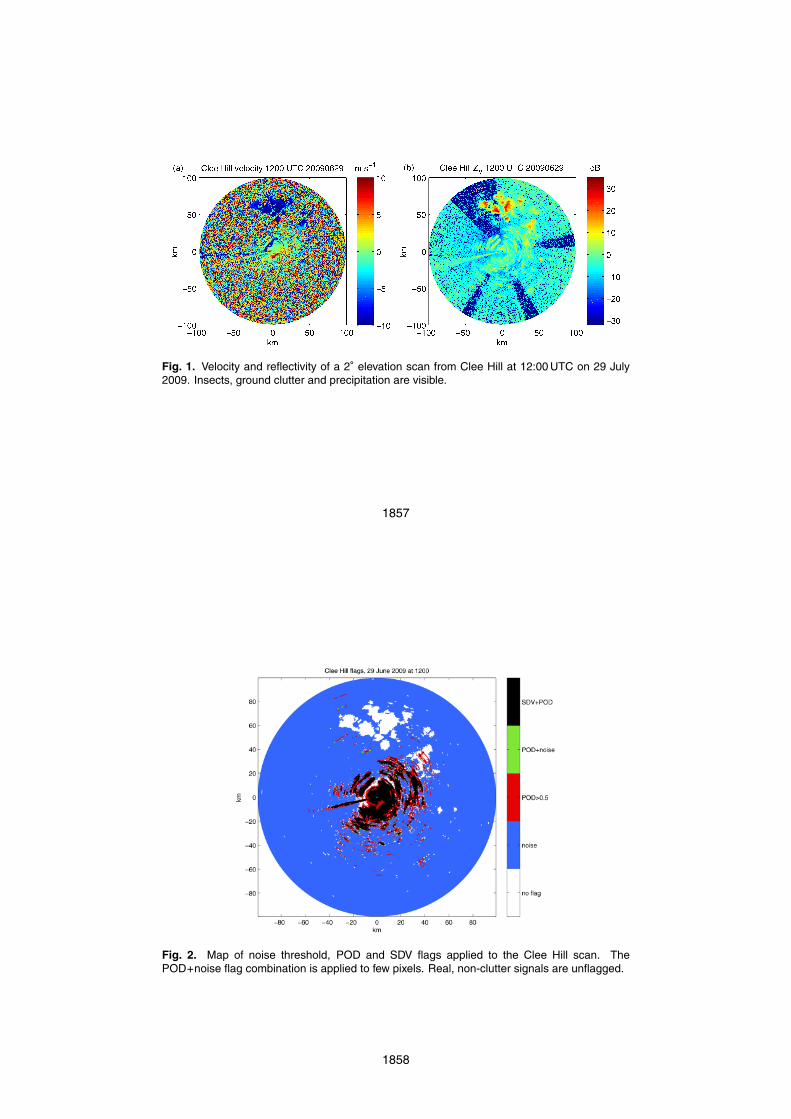
The flag combinations for noise, POD and SDV are shown in Fig. 2. Most of the scanwas flagged by the noise threshold (blue in Fig. 2), leaving regions where there werereal targets (insects, precipitation, ground clutter, etc.). SDV and POD flagged similar15
regions (black), though POD was more comprehensive in identifying potential clutterfar from the radar (red). Some sample volumes located at the edges of distant clutteredregions are flagged by both POD and noise (green, few sample volumes), indicatingareas where the returned signal is probably often close to the noise threshold. Theprecipitation and insects, along with other real, transient targets, should have remained20
unflagged (white).Close to the radar (≈10 km range) there is a partial circle with only POD> 0.5 (red)
flags, due to omnipresent insects rather than ground clutter. This resulted from creatingthe POD using summer scans. The region near the radar flagged by SDV is more likelyto really be ground clutter, as it matches the high Z regions in Fig. 1b. To demonstrate25
this, the velocity corresponding to several of these flag combinations is shown in Fig. 3.
1852
The regions with no flag should ideally contain insects and precipitation, and no clut-ter. The velocity in unflagged (white) sample volumes (Fig. 3a) lacks areas with zerovelocity due to clutter, which indicates successful clutter removal. Regions flagged asclutter by only POD, not SDV, (red flags) contain mostly clutter but also insects closeto the radar, as evinced by the regions with velocity far from zero (Fig. 3b). Comparing5
Fig. 3 with 1a, SDV clearly differentiates the clutter and insects close to the radar muchmore effectively than POD.
5 Proposed solution
Optimal clutter detection should reflect SDV close to the radar and POD far from theradar. One solution is to combine POD and SDV into a new clutter map which is10
identical to SDV near the radar and identical to POD beyond the range of omnipresentinsects. The transition occurs across the limit of insects affecting the POD. This isbetween the 14th and 25th range gates (0.3 <POD< 0.7 in clutter-free regions nearthe radar) for Clee Hill at 2◦ elevation, corresponding to a range of ≈8 to ≈15 km.POD and SDV are combined with a range dependent, azimuthally uniform, weighting15
scheme W , where the new clutter map Cmap values are given by
Cmapi =PODi ·Wi +SDVi · (1−Wi )
for each sample volume i . W is set to 0 for the closest 14 ranges, increments by 0.1between the 15th and 25th ranges, and remains at 1 out to the farthest range.
The results of applying a noise threshold and modified clutter map are shown (Fig. 4)20
using a Cmap threshold of 0.5. The velocity field of sample volumes not excluded bynoise threshold or Cmap is extracted with little sign of clutter contamination (comparewith Fig. 1a). A speckle filter or similar would be required to clean the velocity furtherand produce a suitable wind product. An upper reflectivity limit can also be applied atthis stage, to distinguish precipitation from insects. Data processing should be opti-25
mised by careful choice of thresholds, and subsequent stringent speckle filtering.1853
This style of clutter map was used in processing all data in Rennie et al. (2010).The Doppler velocity was used to calculate VAD (velocity azimuth display, Browningand Wexler, 1968) wind profiles for comparison with model background wind profiles.Despite much effort in developing the processing procedure, results showed that cluttercontamination still caused a low speed bias for highly cluttered radars (Rennie et al.,5
2010). In cases where the sample volumes containing ground clutter outnumber thosecontaining insects, velocity observations are very sensitive to clutter contamination.Nevertheless, this method was the most successful in removing clutter while retaininginsect echoes.
6 Conclusions10
We have developed a method to separate ground clutter and insects using only velocityand reflectivity to create a pseudo-probability clutter map. Conventional probabilityof detection methods often fail to separate ground clutter from insects due to theiromnipresence during summertime. When spectral or polarimetric methods are notavailable, the most effective way to distinguish insects and clutter close to the radar is15
to calculate the standard deviation of velocity over a long period of time, and convert theresult into a pseudo-probability map. This can then be combined with a conventionalprobability of detection map, which is more effective at long ranges.
Acknowledgements. We thank the Met Office and BADC for provision and archive of the radardata. From the Met Office we acknowledge the assistance of Sue Ballard, Malcolm Kitchen,20
Nicolas Gaussiat, Tim Darlington, Robert Scovell and Jaqueline Sugier. This work is part of theFREE (Flood Risk from Extreme Events) Programme funded by NERC, grant NE/002137/1.
1854
References
Alberoni, P. P., Ducrocq, V., Gregoric, G., Hasse, G., Holleman, I., Lindskog, M., Macpher-son, B., Nuret, M., and Rossa, A.: Quality and assimilation of radar data for NWP –a review, COST717, http://www.shmi.se/cost717/doc/WDF 03 200104 1.pdf, 38 pp., 2003.1845, 18485
Bachmann, S. and Zrnic, D.: Suppression of clutter residue in weather radar reveals birds’corridors over urban area, IEEE Geosci. Remote S., 5, 128–132, 2008a. 1844, 1845
Bachmann, S. and Zrnic, D.: Three-dimensional attributes of clear-air scatterers observed withthe polarimetric weather radar, IEEE Geosci. Remote S., 5, 231–235, 2008b. 1846
Browning, K. A. and Wexler, R.: A determination of kinematic properties of a wind field using10
Doppler radar, J. Appl. Meteorol., 7, 105–113, 1968. 1854Doviak, R. J. and Zrnic, D. S.: Doppler radar and weather observations, Academic Press, UK,
458 pp., 1984. 1847Friedrich, K., Germann, U., and Tabary, P.: Influence of ground clutter contam-
ination on polarimetric radar parameters, J. Atmos. Ocean. Tech., 26, 251–269,15
doi:10.1175/2008JTECHA1092.1, 2009. 1846Gauthreaux Jr., S. A., Livingston. J. W., and Belser, C. G.: Detection and discrimination of
fauna in the atmosphere using Doppler weather surveillance radar, Integr. Comp. Biol., 48,12–23, 2008. 1846
Gourley, J. J., Tabary, P., and Parent du Chatalet, J.: A fuzzy logic algorithm for the separation20
of precipitating from nonprecipitating echoes using polarimetric radar observations, J. Atmos.Ocean. Tech., 24, 1439–1451, 2007. 1846
Hubbert, J. C., Dixon, M., Ellis, S. M., and Meymaris, G.: Weather radar ground clutter,Part I: Identification, modeling, and simulation, J. Atmos. Ocean. Tech., 26, 1165–1180,doi:10.1175/2009JTECHA1159.1, 2009a. 1844, 184525
Hubbert, J. C., Dixon, M., and Ellis, S. M.: Weather radar ground clutter PartII: Real-time identification and filtering, J. Atmos. Ocean. Tech., 26, 1181–1197,doi:10.1175/2009JTECHA1160.1, 2009b. 1844, 1845
Hurtado, M. and Nehorai, A.: Polarimetric detection of targets in heavy inhomogeneous clutter,IEEE T. Signal Proces., 56, 1349–1362, 2008. 184630
Ice, R. L., Rhoton, R. D., Krause, J. C., Saxion, D. S., Boydstun, O. E., Heck, A. K., Chrisman, J.N., Berkowitz, D. S., Zittel, W. D., and Warde, D. A.: Automatic clutter mitigation in the WSR-
1855
88D, design, evaluation, and implementation, AMS 34th Conference on Radar Meteorology,Williamsburg VA, USA, 5–9 October 2009, P5.3, 2009. 1845
Meischner, P., Collier, C., Illingworth, A., Joss, J. and Randeu, W.: Advanced weather radarsystems in Europe: The COST 75 Action, B. Am. Meteorol. Soc., 78, 1411–1431, 1997.18455
Rennie, S. J., Illingworth, A. J., Dance, S. L., and Ballard, S. P.: Utilization of Doppler radarwind measurements from insect returns. Proceedings of ERAD 2008 – The Fifth EuropeanConference on Radar in Meteorology and Hydrology, Helsinki, Finland, 30 June–4 July 2008,P2.6, 2008. 1846
Rennie, S. J., Illingworth, A. J., Dance, S. L. and Ballard, S. P.: Accuracy of Doppler radar10
velocities using insect returns, Meteorol. Appl., doi:10.1002/met.174, in press, 2010. 1844,1846, 1851, 1854
Sugier, J., Parent du Chatelet, J., Roquain, P., and Smith, A.: Detection and removal of clutterand anaprop in radar data using a statistical scheme based on echo fluctuation, Proceedingsof ERAD 2002 – The Second European Conference on Radar Meteorology, Delft, Nether-15
lands, 18–22 November 2002, 17–24, 2002. 1845, 1847Unal, C.: Spectral Polarimetric radar clutter suppression to enhance atmospheric echoes, J.
Atmos. Ocean. Tech., 26, 1781–1797, doi:10.1175/2009JTECHA1170.1, 2009. 1844, 1846Warde, D. A. and Torres, S. M.: Automatic detection and removal of ground clutter contami-
nation on weather radars, AMS 34th Conference on Radar Meteorology, Williamsburg VA,20
USA, 5–9 October 2009, P10.11, 2009. 1845Wood, C. R., O’Connor, E. J., Hurley, R. A., Reynolds, D. R. and Illingworth, A. J.: Cloud-radar
observations of insects in the UK convective boundary layer, Meteorol. Appl., 16, 491–500,2009a. 1849
Wood, C. R., Reynolds, D. R., Wells, P. M., Barlow, J. F., Woiwod, I. P. and Chapman, J. W.:25
Flight periodicity and the vertical distribution of high-altitude moth migration over southernBritain, B. Entomol. Res., 99, 525–535, 2009b.
1849
1856
Fig. 1. Velocity and reflectivity of a 2◦ elevation scan from Clee Hill at 12:00 UTC on 29 July2009. Insects, ground clutter and precipitation are visible.
1857
Fig. 2. Map of noise threshold, POD and SDV flags applied to the Clee Hill scan. ThePOD+noise flag combination is applied to few pixels. Real, non-clutter signals are unflagged.
1858
Fig. 3. (a) Velocity of areas with no flag in Fig. 2. (b) Velocity of areas flagged with POD only,including the insects near the radar visible as blue or red patches.
1859
Fig. 4. Velocity data remaining after a noise threshold was applied and clutter removed usingmodified clutter map.