30
FFI-rapport 2012/01094 RADARSAT-2 new modes Tonje Nanette Arnesen Hannevik Norwegian Defence Research Establishment (FFI) 10 July 2012
FFI-rapport 2012/01094
RADARSAT-2 new modes
Tonje Nanette Arnesen Hannevik
Norwegian Defence Research Establishment (FFI)
10 July 2012

2
FFI-rapport 2012/01094
FFI-rapport 2012/01094
1210
P: ISBN 978-82-464-2129-2
E: ISBN 978-82-464-2130-8
Keywords
Syntetisk Aperture Radar (SAR)
Skipsdeteksjon
RADARSAT-2
Nye moduser
Høy-oppløselig
Polarimetri
Approved by
Richard B.Olsen Project Manager
Johnny Bardal Director
FFI-rapport 2012/01094 3
English summary
RADARSAT-2 has provided new and better opportunities for spaceborne monitoring of vessel
traffic and fishing activities because of better flexibility in choice of resolution, polarisation and
look direction. Due to user demand, five new modes were installed on the satellite in 2011. The
new modes give the possibility to order images with better resolution and quad-polarisation (for
some of the modes). This may be better for some scenarios in operational ship detection due to
the increased swath width and coverage area for the new modes. Until the new modes on
RADARSAT-2 were installed, high resolution and quad-polarisation images only covered small
areas. For ship detection these images have mainly been used for research purposes, harbor areas
or over a known small area of interest.
The report presents an overview of RADARSAT-2’s original and new modes. Original and new
swath widths are compared and image examples are shown. In addition ship length formulas are
used to calculate theoretical nominal minimum detectable ship sizes for different combinations of
modes, incidence angles, wind speeds and radar resolutions.

4
FFI-rapport 2012/01094
Sammendrag
RADARSAT-2 har gitt nye og bedre muligheter for rombasert overvåking av skipstrafikk og
fiskeaktiviteter på grunn av bedre fleksibilitet i valg av oppløsning, polarisering og om satellitten
ser til høyre eller venstre. På grunn av brukeretterspørsel ble fem nye moduser installert om bord
på satellitten i 2011. De nye modusene gir muligheten for å bestille bilder med bedre oppløsning
og full-polarisasjon (for noen av modusene). Dette kan fungere bedre for noen operasjonelle
skipsdeteksjons-scenarioer på grunn av større sporbredde og dekningsområde. Inntil de nye
modusene på RADARSAT-2 ble installert dekket høyoppløselige bilder og fullpolariserings-
bilder kun små områder. Disse bildene har derfor mest blitt brukt for forskningsformål, i
havneområder eller over et kjent lite interesseområde.
Denne rapporten presenterer en oversikt over RADARSAT-2s opprinnelige og nye moduser.
Opprinnelige og nye sporbredde er sammenliknet og bildeeksempler er vist. I tillegg brukes
skipslengdeformler for å beregne teoretiske nominelle minimum detekterbare skipsstørrelser for
forskjellige kombinasjoner av moduser, innfallsvinkler, vindhastigheter og radaroppløsninger.

FFI-rapport 2012/01094 5
Contents
1 Introduction 7
2 RADARSAT-2 modes 7
2.1 Original modes 7
2.2 New modes 8
2.2.1 Wide Fine Mode 10
2.2.2 Wide Multi-Look Fine Mode 10
2.2.3 Wide Ultra-Fine Mode 10
2.2.4 Wide Standard Quad-Polarisation Mode 10
2.2.5 Wide Fine Quad-Polarisation Mode 11
3 Image examples using new modes 11
3.1 Caspian Sea in Wide Fine mode 12
3.2 Oslofjord in Wide Fine Quad-Pol mode 14
3.2.1 December 4th 2011 14
3.2.2 December 28th 2011 16
3.3 Norne Field in Wide Standard and Fine Quad-Pol modes 18
3.3.1 March 22nd 2012 19
3.3.2 March 28th 2012 21
3.3.3 March 29th 2012 22
3.3.4 April 21st 2012 23
4 Discussions 24
5 Conclusion and recommendations 27
References 28
Appendix A Definitions 30

6
FFI-rapport 2012/01094
FFI-rapport 2012/01094 7
1 Introduction
Five new modes were installed on the Canadian RADARSAT-2 Synthetic Aperture Radar (SAR)
satellite in 2011. This report gives a brief presentation about the original modes and a
presentation of the five new modes. It also presents images that were acquired using some of the
new modes.
Previously high resolution and/or quad-polarisation (quad-pol) images only covered small areas,
and were mainly useful in harbour areas or over a known small area of interest. To be able to
image vessels of interest in the open ocean with high resolution and/or quad-pol before, detailed
information in advance was necessary to locate where the images should be acquired, i.e. where
the vessels are located. Now the new modes open up new opportunities to use high resolution and
quad-pol images for operational ship detection due to increased coverage area.
This report gives an overview of RADARSAT-2’s original and new modes in chapter 2. Chapter
3 shows image examples of the new modes. In addition original and new modes are compared.
Graphs showing the dependence between the nominal minimum detectable ship length and the
incidence angle for different modes are shown in the discussions section in chapter 4.
Conclusions and recommendations are given in chapter 5.
2 RADARSAT-2 modes
RADARSAT-2 is a Canadian Earth Observation (EO) SAR satellite that was launched in 2007.
The satellite is used daily by the Norwegian authorities to monitor ship traffic, oil spills and sea
ice in the High North. RADARSAT-2 has improved spatial resolution (see appendix A), more
imaging modes and the ability to image the Earth either to the right or to the left of the satellite.
For more information about RADARSAT-2 and the original modes on the satellite see [1].
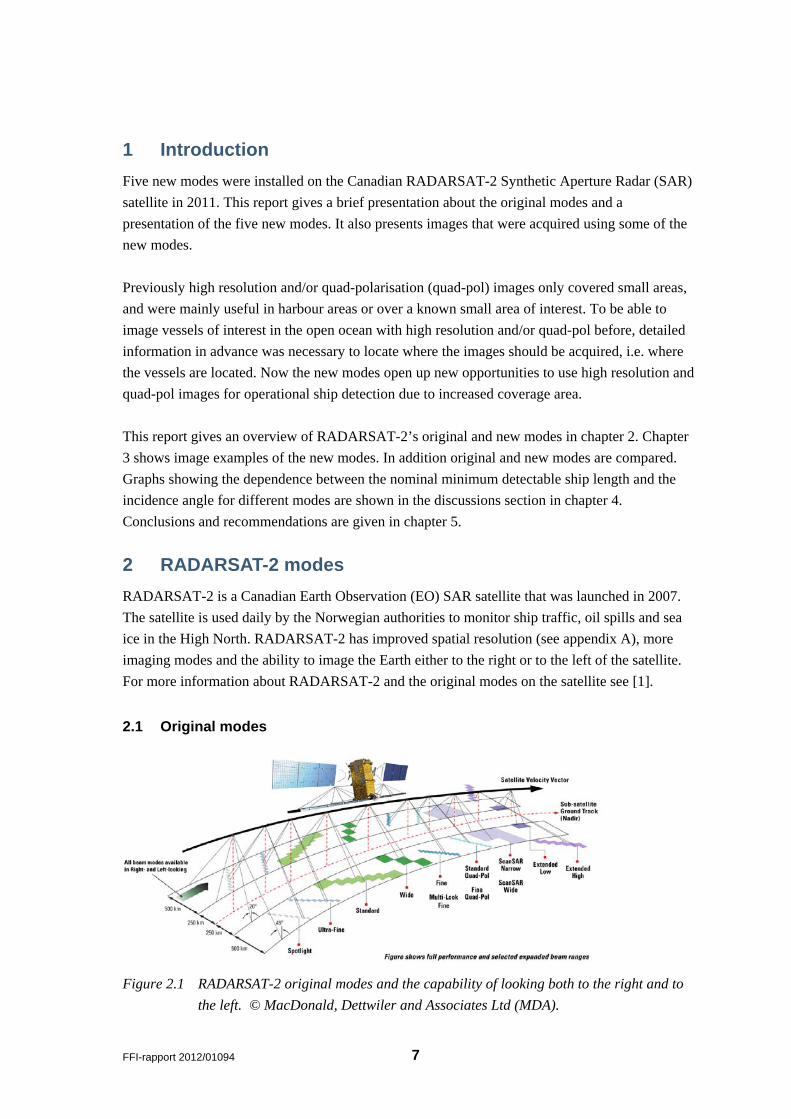
2.1 Original modes
Figure 2.1 RADARSAT-2 original modes and the capability of looking both to the right and to
the left. © MacDonald, Dettwiler and Associates Ltd (MDA).

8
FFI-rapport 2012/01094
Beam mode Appr. nominal
swath width
Appr. resolution Appr.
incidence
angle
Polarisation
(pol) Range Azimuth
Spotlight 18 km 1.6-4.6 m 0.8 m 20º - 49º
Single-pol
(HH,VV,HV
or VH)
Ultra-Fine 20 km 1.6-4.6 m 2.8 m 20º - 49º
Multi-Look
Fine
50 km 3.1-10.4 m 4.6-7.6 m 30º - 50º
Fine 50 km 5.2-10.4 m 7.7 m 30º - 50º
Single-pol or
dual-pol
Standard 100 km 9-26.8 m 7.7-24.7 m 20º - 49º
Wide 120-170 km 13.5-40 m 7.7-24.7 m 20º - 45º
ScanSAR
Narrow
300 km 37.7-79.9 m 60 m 20º - 47º
ScanSAR
Wide
450-500 km 72.1-160 m 100 m 20º - 49º
Extended
High
70 – 80 km 13.5-18.2 m 7.7-24.7 m 49º - 60º
Single-pol
(HH) Extended
Low
170 km 9-52.7 m 7.7-24.7 m 10º - 23º
Fine Quad-
Pol
25 km 5.2-16.5 m
7.6 m 18º - 49º
Quad-pol
Standard
Quad-Pol
25 km 9-28.6 m 7.6 m 18º - 49º
Table 2.1 RADARSAT-2 original beam modes [2].
For operational purposes in the High North, wide area coverage is of primary interest. Now dual-
polarisation (dual-pol) ScanSAR images are being used to monitor the vast ocean areas. The
original modes, with their swath widths and coverage, are shown in Figure 2.1. Table 2.1 gives
more information about the original RADARSAT-2 modes.
2.2 New modes
The RADARSAT-2 SAR sensor is very flexible. It is possible to reprogram the sensor for
example according to resolution and swath width. Five new modes have now been made due to
user demand. The new modes open up new opportunities to use images with good resolution and
relatively wide swath width at the same time. The Wide Fine Quad-Pol and Wide Standard Quad-
Pol modes give the opportunity to choose quad-pol images with wider swath widths compared to
the original modes. Earlier, high resolution and quad-pol images only covered small areas, and
were mainly useful in harbor areas or over a small well-known area of interest. Earlier, to image
vessels of interest in the open ocean with high resolution and/or using quad-pol, detailed
information in advance was necessary to be able to know where to plan the SAR acquisitions.

FFI-rapport 2012/01094 9
Quad-pol images give many advantages when doing ship detection analysis compared to dual-pol
or single-pol images, so if possible quad-pol images are preferable.
The new modes have wider swath width while offering the same resolution as before. Figure 2.2
shows original and new modes on RADARSAT-2 in the same figure. The new modes are
described in table 2.2. They are all single beam modes (see Figure 2.3), which is a stripmap SAR
mode. This means that the beam elevation and profile are constant while collecting data. A
presentation of the five new beam modes follows below [2].
Figure 2.2 Original and new modes (with red circles) on RADARSAT-2. © MDA.
Figure 2.3 Single beam mode. © MDA.
10
FFI-rapport 2012/01094
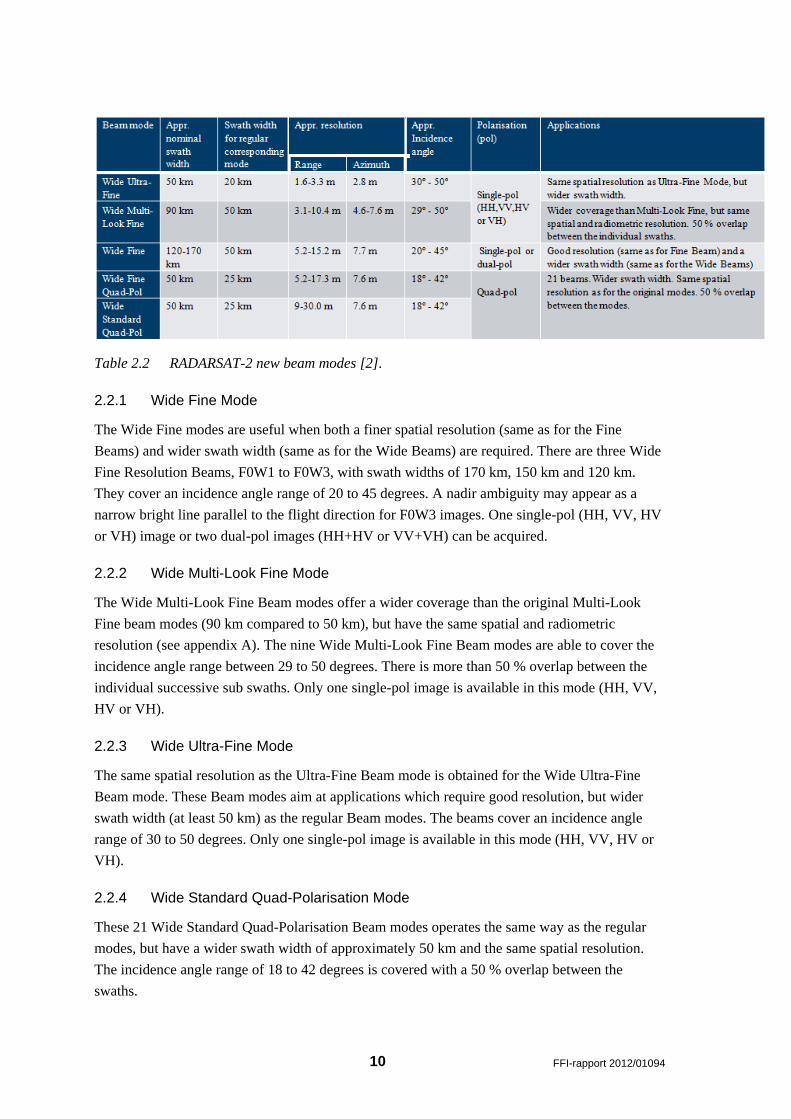
Table 2.2 RADARSAT-2 new beam modes [2].
2.2.1 Wide Fine Mode
The Wide Fine modes are useful when both a finer spatial resolution (same as for the Fine
Beams) and wider swath width (same as for the Wide Beams) are required. There are three Wide
Fine Resolution Beams, F0W1 to F0W3, with swath widths of 170 km, 150 km and 120 km.
They cover an incidence angle range of 20 to 45 degrees. A nadir ambiguity may appear as a
narrow bright line parallel to the flight direction for F0W3 images. One single-pol (HH, VV, HV
or VH) image or two dual-pol images (HH+HV or VV+VH) can be acquired.
2.2.2 Wide Multi-Look Fine Mode
The Wide Multi-Look Fine Beam modes offer a wider coverage than the original Multi-Look
Fine beam modes (90 km compared to 50 km), but have the same spatial and radiometric
resolution (see appendix A). The nine Wide Multi-Look Fine Beam modes are able to cover the
incidence angle range between 29 to 50 degrees. There is more than 50 % overlap between the
individual successive sub swaths. Only one single-pol image is available in this mode (HH, VV,
HV or VH).
2.2.3 Wide Ultra-Fine Mode
The same spatial resolution as the Ultra-Fine Beam mode is obtained for the Wide Ultra-Fine
Beam mode. These Beam modes aim at applications which require good resolution, but wider
swath width (at least 50 km) as the regular Beam modes. The beams cover an incidence angle
range of 30 to 50 degrees. Only one single-pol image is available in this mode (HH, VV, HV or
VH).
2.2.4 Wide Standard Quad-Polarisation Mode
These 21 Wide Standard Quad-Polarisation Beam modes operates the same way as the regular
modes, but have a wider swath width of approximately 50 km and the same spatial resolution.
The incidence angle range of 18 to 42 degrees is covered with a 50 % overlap between the
swaths.
FFI-rapport 2012/01094 11
2.2.5 Wide Fine Quad-Polarisation Mode
The Wide Fine Quad-Polarisation Beam modes have a wider swath width of about 50 km
(compared to 25 km for the regular beams) and the same spatial resolution as for the original
beams. There are 21 beams which overlaps 50 % overlap between the swaths, covering an
incidence angle range between 18 to 42 degrees.
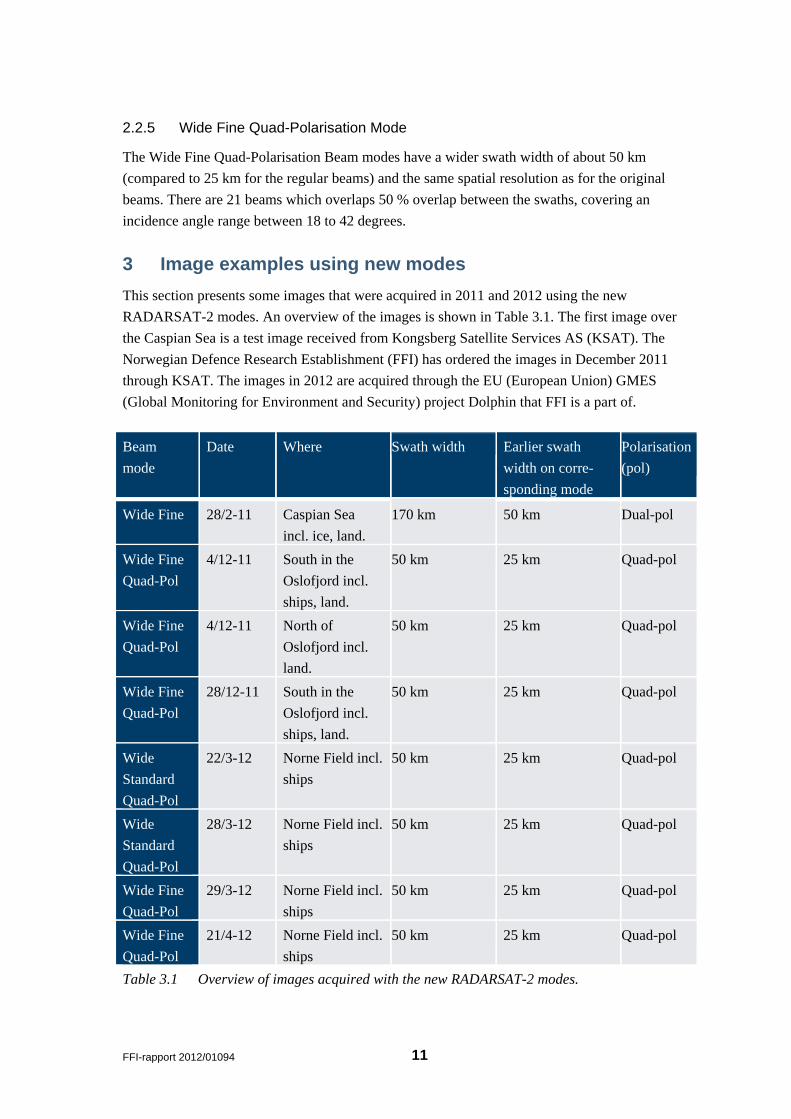
3 Image examples using new modes
This section presents some images that were acquired in 2011 and 2012 using the new
RADARSAT-2 modes. An overview of the images is shown in Table 3.1. The first image over
the Caspian Sea is a test image received from Kongsberg Satellite Services AS (KSAT). The
Norwegian Defence Research Establishment (FFI) has ordered the images in December 2011
through KSAT. The images in 2012 are acquired through the EU (European Union) GMES
(Global Monitoring for Environment and Security) project Dolphin that FFI is a part of.
Beam
mode
Date Where Swath width Earlier swath
width on corre-
sponding mode
Polarisation
(pol)
Wide Fine 28/2-11 Caspian Sea
incl. ice, land.
170 km 50 km Dual-pol
Wide Fine
Quad-Pol
4/12-11 South in the
Oslofjord incl.
ships, land.
50 km 25 km Quad-pol
Wide Fine
Quad-Pol
4/12-11 North of
Oslofjord incl.
land.
50 km 25 km Quad-pol
Wide Fine
Quad-Pol
28/12-11 South in the
Oslofjord incl.
ships, land.
50 km 25 km Quad-pol
Wide
Standard
Quad-Pol
22/3-12 Norne Field incl.
ships
50 km 25 km Quad-pol
Wide
Standard
Quad-Pol
28/3-12 Norne Field incl.
ships
50 km 25 km Quad-pol
Wide Fine
Quad-Pol
29/3-12 Norne Field incl.
ships
50 km 25 km Quad-pol
Wide Fine
Quad-Pol
21/4-12 Norne Field incl.
ships
50 km 25 km Quad-pol
Table 3.1 Overview of images acquired with the new RADARSAT-2 modes.

12
FFI-rapport 2012/01094
3.1 Caspian Sea in Wide Fine mode
One test image is received from Kongsberg Satellite Services AS (KSAT) after the new
RADARSAT-2 modes were installed on the satellite. The coverage area for the Wide Fine Beam
mode image in the Caspian Sea from February 2nd 2011 is shown in Figure 3.1. The swath width
is 170 km compared with 50 km on the original Fine Beam mode. The red arrow in the figure
shows how long 50 km is, which the original mode would cover, and it is easy to see that the new
Wide Fine Beam mode makes it easier to observe a much larger ocean area. The dual-polarisation
SAR images are shown in Figure 3.2, and they include ice, land and sea.
Figure 3.1 Shows the coverage area for the SAR Wide Fine mode image in the Caspian Sea
from February 2nd 2011. © Google Earth.

FFI-rapport 2012/01094 13
Figure 3.2 Wide Fine Beam mode images over the Caspian Sea acquired on February
28th2011. Above: HH-channel. Bottom: HV-channel.

14
FFI-rapport 2012/01094
3.2 Oslofjord in Wide Fine Quad-Pol mode
3.2.1 December 4th 2011
Figure 3.3 Top: Wide Fine Quad-Pol SAR image in HH-polarisation north of the Oslofjord on
December 4th 2011. Bottom: Google Earth showing where the SAR image is
acquired.

FFI-rapport 2012/01094 15
The first Wide Fine Quad-Pol image from December 4th 2011 is shown in Figure 3.3. The image
includes an area north of the Oslofjord shown at the bottom of the figure. The SAR image shows
the swath widths of the original (25 km) and the new mode (50 km).
The second Wide Fine Quad-Pol image from December 4th 2011 is shown in Figure 3.4. The
image includes the area of the Oslofjord between Moss and south of Tønsberg. AIS (Automatic
Identification System) detections from aisonline.com [3] are shown to the right with arrows
pointing to the detections in the SAR image. The swath width of the image is 50 km, as shown in
the image. The swath width of the original mode, Fine Quad-Pol Beam mode, is 25 km, and this
is marked out in the SAR image. Figure 3.5 shows a close-up of the ferry vessel Crown of
Scandinavia detected in the SAR image in HH-, VV- and HV-polarisation.
Figure 3.4 Left: Wide Fine Quad-Pol image south in the Oslofjord on December 4th 2011.
Right: AIS detections from aisonline.com [3].
Figure 3.5 Close-up of the ferry Crown of Scandinavia detected December 4th 2011 in HH-
(left), VV- (middle) and HV-polarisation (right).

16
FFI-rapport 2012/01094
3.2.2 December 28th 2011
On December 28th 2011 another Wide Fine Quad-Pol image over the Oslofjord was acquired. The
image, shown in Figure 3.6, shows approximately the same area as the southernmost image on
December 4th 2011. The SAR image shown in Figure 3.6 also includes the ferry vessel Crown of
Scandinavia. The detection is shown inside the white circle. Figure 3.7 shows a close-up outside
Tønsberg, also shown in the white square in Figure 3.6. Seven detected vessels are shown as
white against dark ocean background in the SAR image (top of figure). At the bottom of the
image the same seven detected vessels in addition to Crown of Scandinavia are shown reported
by aisonline.com [3].
Figure 3.6 Wide Fine Quad-Pol mode south in the Oslofjord on December 28th 2011.

FFI-rapport 2012/01094 17
Figure 3.7 Top: Seven detected vessels in the SAR image. Bottom: The same seven detected vessels in
addition to Crown of Scandinavia reported by aisonline.com [3].
18
FFI-rapport 2012/01094
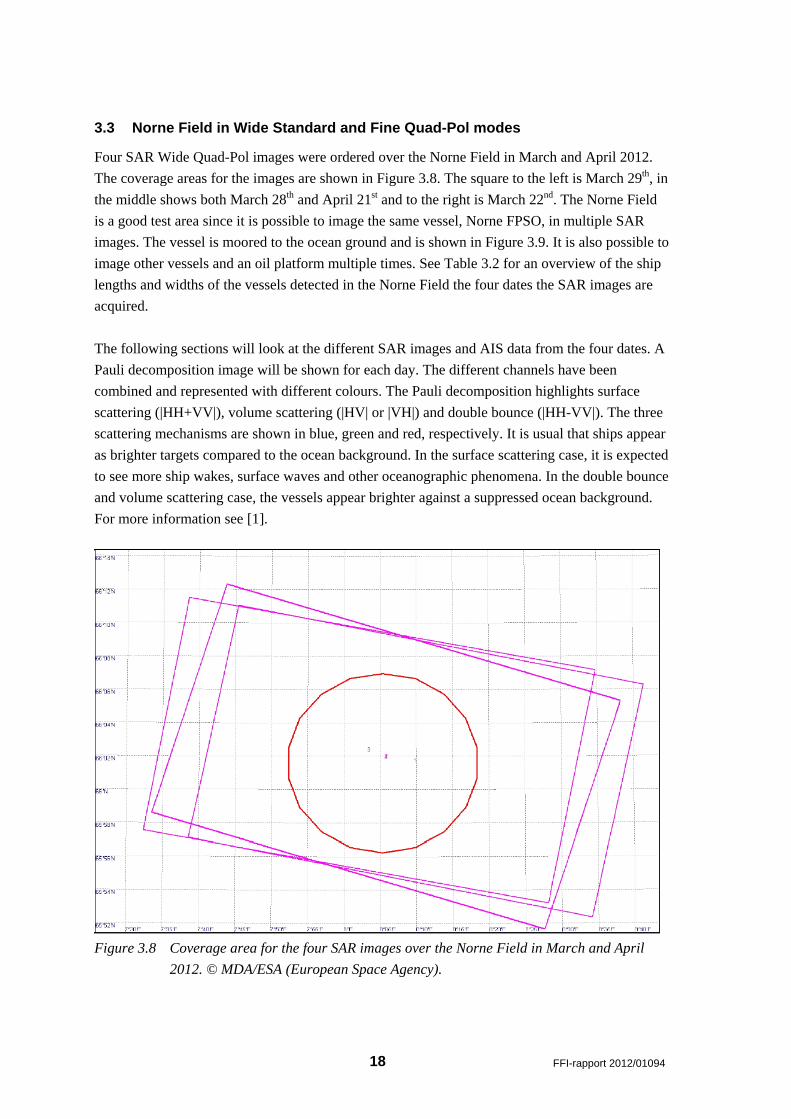
3.3 Norne Field in Wide Standard and Fine Quad-Pol modes
Four SAR Wide Quad-Pol images were ordered over the Norne Field in March and April 2012.
The coverage areas for the images are shown in Figure 3.8. The square to the left is March 29th, in
the middle shows both March 28th and April 21st and to the right is March 22nd. The Norne Field
is a good test area since it is possible to image the same vessel, Norne FPSO, in multiple SAR
images. The vessel is moored to the ocean ground and is shown in Figure 3.9. It is also possible to
image other vessels and an oil platform multiple times. See Table 3.2 for an overview of the ship
lengths and widths of the vessels detected in the Norne Field the four dates the SAR images are
acquired.
The following sections will look at the different SAR images and AIS data from the four dates. A
Pauli decomposition image will be shown for each day. The different channels have been
combined and represented with different colours. The Pauli decomposition highlights surface
scattering (|HH+VV|), volume scattering (|HV| or |VH|) and double bounce (|HH-VV|). The three
scattering mechanisms are shown in blue, green and red, respectively. It is usual that ships appear
as brighter targets compared to the ocean background. In the surface scattering case, it is expected
to see more ship wakes, surface waves and other oceanographic phenomena. In the double bounce
and volume scattering case, the vessels appear brighter against a suppressed ocean background.
For more information see [1].
Figure 3.8 Coverage area for the four SAR images over the Norne Field in March and April
2012. © MDA/ESA (European Space Agency).
FFI-rapport 2012/01094 19
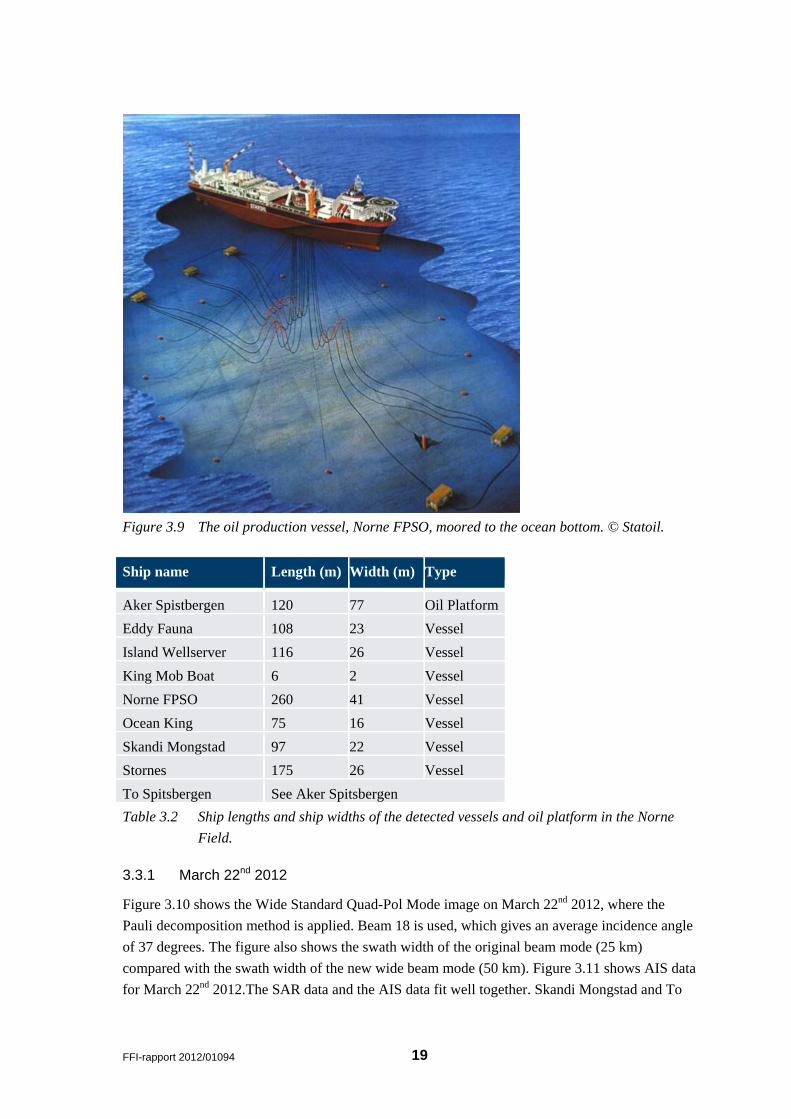
Figure 3.9 The oil production vessel, Norne FPSO, moored to the ocean bottom. © Statoil.
Ship name Length (m) Width (m) Type
Aker Spistbergen 120 77 Oil Platform
Eddy Fauna 108 23 Vessel
Island Wellserver 116 26 Vessel
King Mob Boat 6 2 Vessel
Norne FPSO 260 41 Vessel
Ocean King 75 16 Vessel
Skandi Mongstad 97 22 Vessel
Stornes 175 26 Vessel
To Spitsbergen See Aker Spitsbergen
Table 3.2 Ship lengths and ship widths of the detected vessels and oil platform in the Norne
Field.
3.3.1 March 22nd 2012
Figure 3.10 shows the Wide Standard Quad-Pol Mode image on March 22nd 2012, where the
Pauli decomposition method is applied. Beam 18 is used, which gives an average incidence angle
of 37 degrees. The figure also shows the swath width of the original beam mode (25 km)
compared with the swath width of the new wide beam mode (50 km). Figure 3.11 shows AIS data
for March 22nd 2012.The SAR data and the AIS data fit well together. Skandi Mongstad and To

20
FFI-rapport 2012/01094
Spitsbergen are lying so close together that it is not possible to distinguish the two vessels. It is
easy to see the vessels in the SAR Pauli image as bright targets.
Figure 3.10 Pauli decomposition image on March 22nd 2012. The position of Norne FPSO is
shown with the red arrow.
Figure 3.11 AIS data on March 22nd 2012. © aisonline.com.
FFI-rapport 2012/01094 21
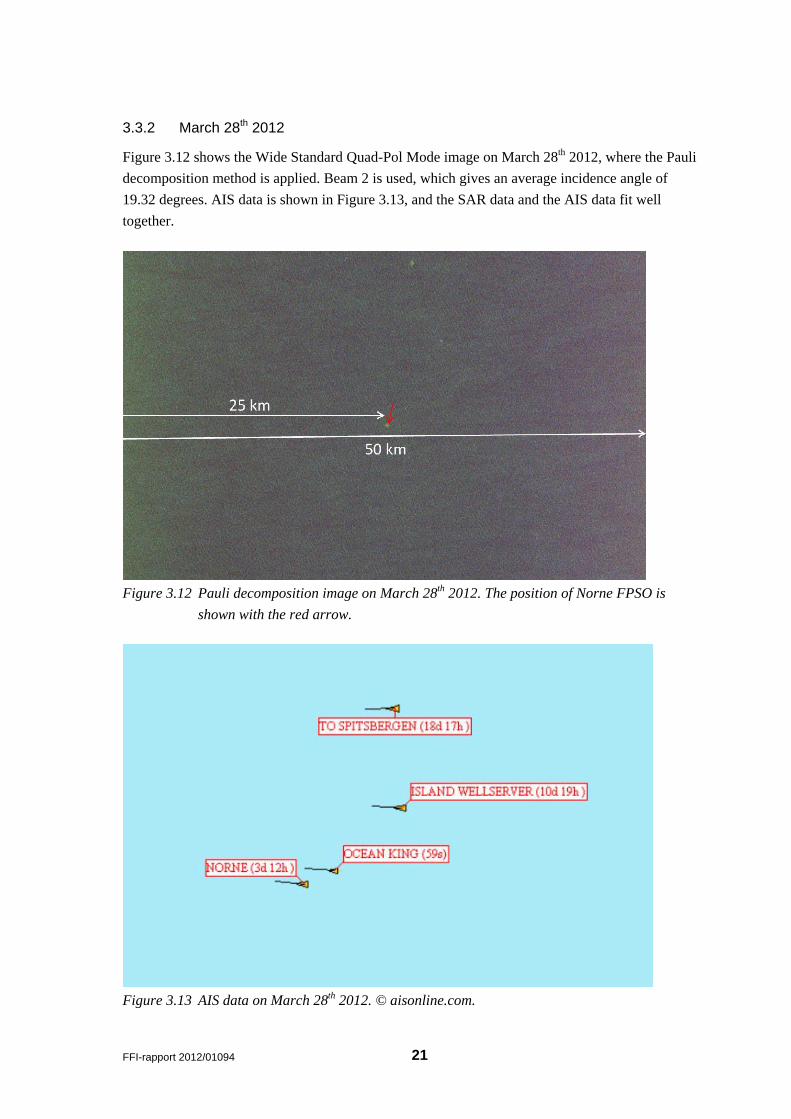
3.3.2 March 28th 2012
Figure 3.12 shows the Wide Standard Quad-Pol Mode image on March 28th 2012, where the Pauli
decomposition method is applied. Beam 2 is used, which gives an average incidence angle of
19.32 degrees. AIS data is shown in Figure 3.13, and the SAR data and the AIS data fit well
together.
Figure 3.12 Pauli decomposition image on March 28th 2012. The position of Norne FPSO is
shown with the red arrow.
Figure 3.13 AIS data on March 28th 2012. © aisonline.com.

22
FFI-rapport 2012/01094
3.3.3 March 29th 2012
Figure 3.17 shows the Wide Fine Quad-Pol Mode image on March 29th 2012, where the Pauli
decomposition method is applied. Beam 21 is used, which gives an average incidence angle of
39.81 degrees. AIS data is shown in Figure 3.15, and the SAR data and the AIS data fit well
together.
Figure 3.14 Pauli decomposition image on March 29nd 2012. The position of Norne FPSO is
shown with the red arrow.
Figure 3.15 AIS data on March 29th 2012. © aisonline.com.
FFI-rapport 2012/01094 23
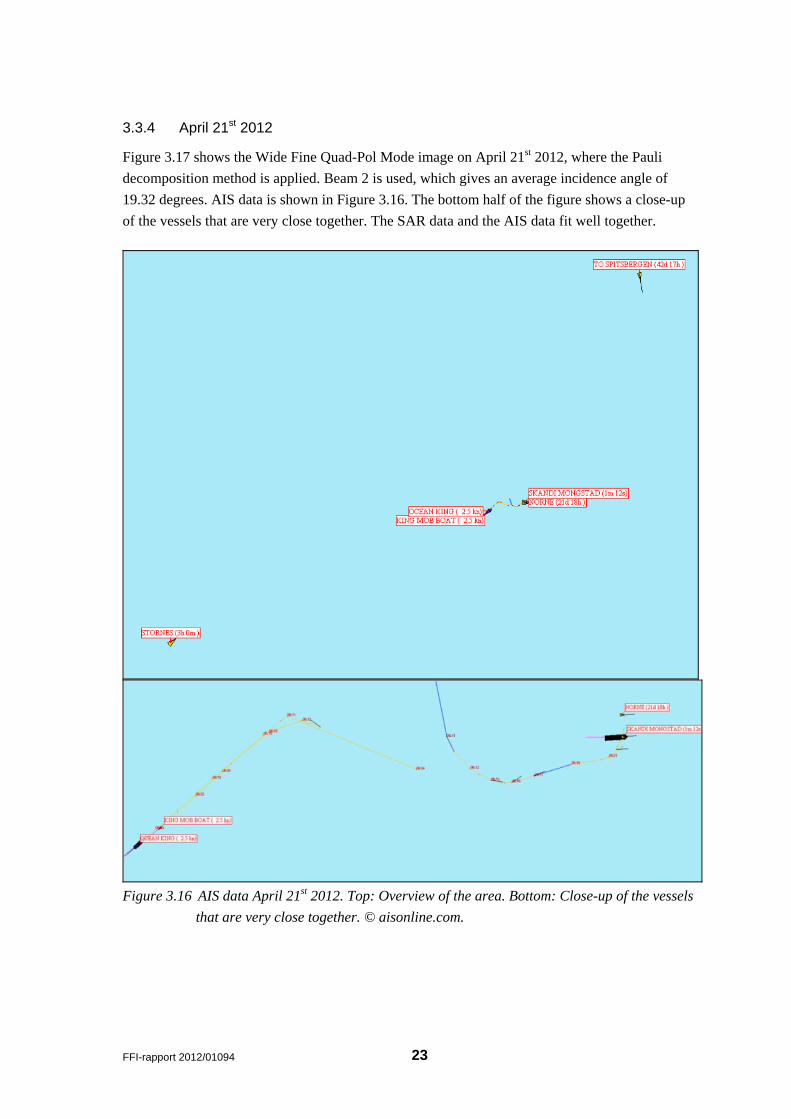
3.3.4 April 21st 2012
Figure 3.17 shows the Wide Fine Quad-Pol Mode image on April 21st 2012, where the Pauli
decomposition method is applied. Beam 2 is used, which gives an average incidence angle of
19.32 degrees. AIS data is shown in Figure 3.16. The bottom half of the figure shows a close-up
of the vessels that are very close together. The SAR data and the AIS data fit well together.
Figure 3.16 AIS data April 21st 2012. Top: Overview of the area. Bottom: Close-up of the vessels
that are very close together. © aisonline.com.

24
FFI-rapport 2012/01094
Figure 3.17 Pauli decomposition image on April 21st 2012. The position of Norne FPSO is
shown with the red arrow.
4 Discussions
Ship length formulas [4] can be used to calculate theoretical nominal minimum detectable ship
sizes for different combinations of modes, incidence angles, wind speeds and radar resolutions.
This has been done at FFI, and is shown in Figure 4.1- Figure 4.4. Wind direction directly
towards the radar is used, which is the worst case where it is most difficult to detect vessels due to
the high reflection from the sea. The threshold for detection is 5 dB above the background sea
clutter.
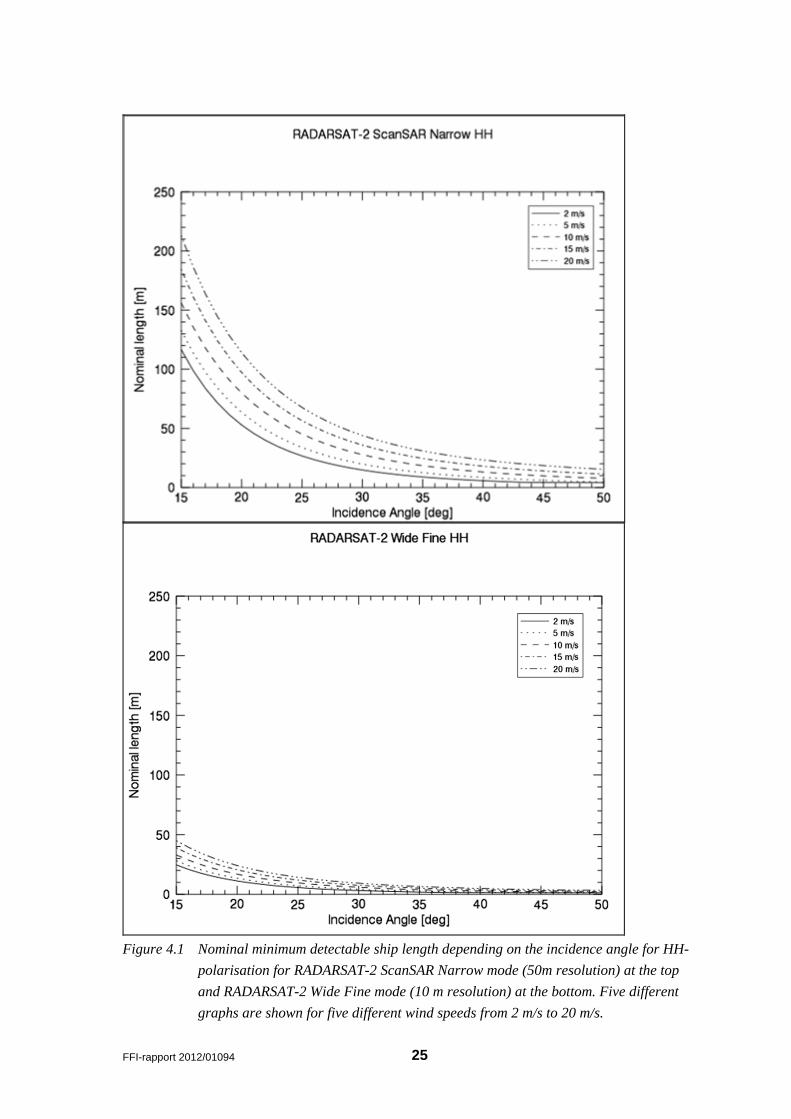
Figure 4.1 shows two graphs showing the dependence between the nominal minimum detectable
ship length and the incidence angle. The comparison is between RADARSAT-2 ScanSAR
Narrow mode and RADARSAT-2 Wide Fine mode for HH-polarisation. The Wide Fine mode
performance is much better than the ScanSAR Narrow mode due to the better spatial resolution of
the Wide Fine mode compared to the ScanSAR Narrow mode. The RADARSAT-2 ScanSAR
Narrow mode is the mode that is used operationally today, and has average range and azimuth
resolution of 50 m and 60 m and a noise floor of -28.5 dB. The RADARSAT-2 Wide Fine mode
has a wide swath of 120-170 km compared to 50 km in the original Fine mode. Average range
and azimuth resolution are 10 m and 8 m and the noise floor is -24 dB. Both modes are offered in
both single-pol and dual-pol. Figure 4.2 shows a similar curve for RADARSAT-2 Wide Fine
mode where the y-axis ranges from 0 to 50 m instead of 0 to 250 m. Then it is easier to see more
details, especially for high incidence angles.
Figure 4.3 shows the dependence between the nominal minimum detectable ship length and the
incidence angle for RADARSAT-2 Wide Fine Quad-Pol mode where the y-axis ranges from 0 to
50 m. The swath width is 50 km compared to 25 km in original Fine Quad-Pol mode. The average
range and azimuth resolution is 11 m and 8 m in azimuth and the noise floor is -32.5 dB.
Figure 4.4 shows the same dependence for RADARSAT-2 Wide Standard Quad-Pol mode. The
swath width is 50 km compared to 25 km in original Fine Quad-Pol. Approximate range and
azimuth resolution are 20 m and 8 m and the noise floor is -35 dB.
FFI-rapport 2012/01094 25
Figure 4.1 Nominal minimum detectable ship length depending on the incidence angle for HH-
polarisation for RADARSAT-2 ScanSAR Narrow mode (50m resolution) at the top
and RADARSAT-2 Wide Fine mode (10 m resolution) at the bottom. Five different
graphs are shown for five different wind speeds from 2 m/s to 20 m/s.

26
FFI-rapport 2012/01094
Figure 4.2 Nominal minimum detectable ship length as a function of incidence angle for HH-
polarisation for RADARSAT-2 Wide Fine mode (10 m resolution). Five different
graphs are shown for five different wind speeds from 2 m/s to 20 m/s.
Figure 4.3 Nominal minimum detectable ship length as a function of incidence angle for HH-
polarisation for RADARSAT-2 Wide Fine Quad-Pol mode (11 m resolution). Five
different graphs are shown for 5 different wind speeds from 2 m/s to 20 m/s.

FFI-rapport 2012/01094 27
Figure 4.4 Nominal minimum detectable ship length as a function of incidence angle for HH-
polarisation for RADARSAT-2 Wide Standard Quad-Pol mode (20 m resolution).
Five different graphs are shown for five wind speeds from 2 m/s to 20 m/s.
5 Conclusion and recommendations
RADARSAT-2 provides new opportunities for spaceborne monitoring of vessel traffic and
fishing activities. Due to user demand, five new modes were installed on the satellite in 2011. The
new modes open up new opportunities to use high resolution and quad-pol images for operational
ship detection due to the increased swath width and coverage area.
The RADARSAT-2 ScanSAR Wide and Narrow modes are the modes that are now daily used
operationally in the Barents Sea. The RADARSAT-2 Wide Fine mode in dual-polarisation is the
new mode that might be used operationally due to the wide swath width. It covers from 120 km to
170 km depending on the chosen incidence angle. Further tests should be done with
RADARSAT-2 Wide Fine Mode (dual-pol) in the Barents Sea to evaluate image quality,
advantages and limitations of this mode compared to RADARSAT-2 ScanSAR Narrow mode.

28
FFI-rapport 2012/01094
References [1] T. N. A. Hannevik, "Evaluation of Radarsat-2 for ship detection," Forsvarets
Forskningsinstitutt,FFI-rapport 2011/01692, Dec.2011.
[2] MacDonald Dettwiler and Associates Ltd., "RADARSAT-2 Product Format Description,"RN-RP-51-2713. Issue 1/7, Mar.2008.
[3] Christian Michelsen Research, "www.aisonline.com," 2010.
[4] T. R. Grønlien, "Deteksjon av punktmål ved hjelp av ScanSAR," Universitetet i Oslo, Hovedfagsoppgave i fysikk 1998.
[5] Canada Centre for Remote Sensing, "Fundamentals of Remote Sensing. A Canada Centre for Remote Sensing Tutorial.," Canada Centre for Remote Sensing,Dec.2011.

FFI-rapport 2012/01094 29
Acronyms
AIS Automatic Identification System
Dual-pol Dual-polarisation
EO Earth Observation
ESA European Space Agency
EU European Union
FFI Forsvarets Forskningsinstitutt
FOW Wide Fine
GMES Global Monitoring for Environment and Security
H Horisontal polarisation
HH Horisontally transmitted – Horisontally received polarisation
HV Horisontally transmitted – Vertically received polarisation
KSAT Kongsberg Satellite Services AS
MDA MacDonald, Dettwiler and Associates Ltd
Pol Polarisation
Quad-pol Quad-polarisation
SAR Synthetic Aperture Radar
Single-pol Single-polarisation
V Vertical polarisation
VH Vertically transmitted – Horisontally received polarisation
VV Vertically transmitted – Vertically received polarisation

30
FFI-rapport 2012/01094
Appendix A Definitions
Radiometric resolution Sensitivity to detect small differences in reflected energy [5] Spatial resolution Size of the smallest possible feature that can be detected [5]


